1. Introduction
Vibration therapy devices can take one of two forms: whole body vibration (WBV) or focal vibration (FV). In WBV, vibration is delivered to the body through a relatively large vibration platform upon which a patient can sit or stand. In FV, vibration is delivered through a relatively small vibrating mechanism applied to specific muscles and/or tendons. The neurophysiological benefits of vibration have been of interest for over a century. The earliest examples of WBV and FV devices were developed by Gustav Zander [
1], John Kellogg [
2], and Joseph Granville [
3]. Since then, vibration, especially WBV, has been shown to be beneficial in counteracting loss of muscle mass [
4], reducing bone mineral density decline [
5], improving balance and mobility [
6], and treating chronic lower back pain [
7]. While WBV has traditionally been more popular, FV is now being studied more closely, primarily because of the potential harmful effects of WBV [
8,
9]. The basic mechanisms underlying the effective use of vibration therapy were well documented. For example, at the macro (tissue or organ) level, vibration therapy works by improving the supply of blood to the tissue [
10]. This is, on the one hand, the effect of compression and stretching of muscles or bones [
11], and on the other hand, “resonant hemodynamics” [
12]. At the molecular level, vibrations lead to the formation of hydrogen peroxide in water and biological fluids [
13]. It is known that hydrogen peroxide is an important signal-regulatory molecule involved in the regulation of many processes [
14].
There is a lack of standardized application protocols for FV [
15,
16,
17]. Different studies have used various combinations of vibration frequencies, amplitudes/intensities, and dosages as an intervention, but the reported values correspond to the vibration characteristics in the free vibration condition. FV has been used with vibration frequencies in the range of 80 [
18] to 300 Hz [
19] for upper limb post-stroke recovery. Similarly, vibration displacement has ranged from as low as 0.2 to 0.5 mm [
20], up to 2 mm [
19]. Different studies have demonstrated different degrees of success. This lack of consensus in the effectiveness of FV can be attributed to the change in characteristics of the vibrations delivered by the FV devices in the constrained condition. Therefore, an effective FV therapy protocol is still undefined.
Fundamentally, an FV therapy protocol is defined by two parameters: vibration frequency and vibration intensity (amplitude or acceleration). Souron and group [
16] conducted a review on the acute as well as chronic changes in neuromuscular activity caused by FV and their findings indicate that the frequency of vibration plays a crucial role in adaptations in the central nervous system [
16]. Tonic vibration reflex (TVR) is defined as a reflex contraction of the vibrated muscle due to the excitatory input on alpha motoneurons caused by the discharge of the Ia afferents during vibration [
16]. While it has been reported that TVR due to muscle vibration helps in motor recovery, more studies on the effects of FV have reported that the response of the Ia afferents in the muscle spindles that contribute to the motor recovery. The muscle spindles are innervated with both primary (Ia) as well as secondary (II) afferents and the response of these afferents to vibration stimuli is dependent on the vibration characteristics of the stimulus, i.e., the frequency and amplitude of vibration. Smaller amplitudes (0.2–0.5 mm) and frequencies below 150 Hz are more effective in recruiting Ia afferents. Frequencies between 20 and 60 Hz result in the recruitment of II afferents in addition to Ia afferents, and frequencies >150 Hz result in a disharmonious discharge of the Ia afferents. Larger amplitudes (>0.5 mm) result in the recruitment of Ib and II afferents in addition to the Ia afferents and only the recruitment of the Ia afferents has been reported to be relatively more responsible for inducing motor recovery through neuromuscular changes/adaptations [
16,
21].
Having the right vibration frequency and amplitude is important, because of different physiological responses to different frequencies and amplitudes. For example, muscles will contract at 100 to 200 Hz [
17]. At 70 to 80 Hz, physiological responses are generated in the somatosensory cortex, motor cortex, and premotor cortex [
17]. As a result, the frequency for pain management may be different from the frequency for treating spasticity. Furthermore, FV has been shown to increase nitric oxide production, improve blood flow, and increase angiogenesis [
22,
23,
24]. FV provides beneficial effects at both the peripheral and central levels. Therefore, depending on the condition being treated, the optimum frequency needs to be carefully selected. Similarly, vibration intensity required can also vary depending on the condition being treated, the muscle tendon size, and the individual physiology. Effective values for both frequency and amplitude are undefined at this time. This study focuses on addressing the knowledge gap with regards to the characteristics of the vibrations delivered by FV devices in the free and constrained condition to determine the actual/effective frequency and intensity delivered by the FV devices. The findings of this study can also be used in progressing the development of wearable and portable FV devices.
Drawing from prior research approaches used in the characterization of wearable sensors for health monitoring [
25] and the development of embedded wearable device technology [
26], this study focuses on devices that are wearable or very portable, i.e., hand-held, and only include devices that are available in the US. This is the first step in identifying an effective FV protocol. Future work would involve extensively testing these approaches and their variations with human subjects. In this study, we measured the vibration characteristics of commercially available FV devices that have been known to be effective in the field of rehabilitation. These devices have been consistently used for therapy in the past, with a sizable number and variety of users, as compared with experimental devices, which are usually evaluated for a limited number of times on a limited number of patients.
The objective of this research is to identify FV vibration parameters of effective devices in a standardized, repeatable approach, and to compare the frequencies and peak-to-peak amplitudes produced by four commercially available FV devices in the United States in the free vibration as well as the constrained vibration conditions. The closest related study that has investigated FV therapy devices is the earlier research conducted by the authors of this paper [
27]. In this earlier research, we tested a subset of the available modes for commercially available FV devices. While the results were interesting and provided insightful information, they were limited and insufficient to generate conclusive evidence. The work by Botter et al. provided a detailed evaluation on some focal vibration techniques [
28]. However, they used devices that are not available for use in the US. In addition, they evaluated bulky pressure-based devices, while we focus on more portable FV devices. The measurement approach developed in this study shall be applicable to wearable FV devices in future work.
2. Materials and Methods
Vibration characteristics were measured for the four different commercially available devices. They are described in
Section 2.1. The devices and modes are listed in
Table 1.
2.1. Devices Tested
Four commercially available focal vibration devices were tested: Vibracool [
31], Novafon Pro [
29], and two Myovolt [
30] series of devices (
Figure 1). The Vibracool device (
Figure 1a) is marketed as a focal vibration device for pain relief. It is a battery-powered device with a single vibration motor that delivers a constant vibration. To wear the device, different styles of pouches with straps are available. Hot packs and cold packs are also available to use together with the device [
31].
The Novafon Pro device (
Figure 1b) is marketed as a general health massager. It provides focal vibration by use of a transducer, where the vibration head is directly connected to the transducer. The device is powered by mains electricity. It is advertised to have two modes: Mode I (120 Hz) and Mode II (60 Hz). The modes can be selected using a rocker switch. For each mode, intensity can be controlled by a rotating knob [
29].
Myovolt devices (
Figure 1c,d) are marketed as wearable muscle relief devices, primarily for athletes. They are battery-powered. There are two models: three-actuator and two-actuator. The three-actuator models have three vibration motors, and the two-actuator models have two vibration motors, embedded together into a single flexible structure. Various straps are available for attaching them on different body parts. The Myovolt devices operate in three different modes: (1) sinusoidal, with intensity changing sinusoidally, (2) pulsing, alternating between on and off, and (3) constant vibration. The modes can be changed by pressing a mode button [
30].
Those four devices were selected for testing due to their commercial availability and use for research and clinical practice. Vibracool is commercially available. It has been used in FV therapy, and has been proven to provide pain relief [
32]. In fact, it has been demonstrated to be better than transcutaneous electrical nerve stimulation (TENS) [
33]. Novafon Pro is commercially available and has been used by therapists for FV therapy. It has proven to be effective [
34,
35]. There are many other devices similar to Novafon Pro, but not shown, that have been used for research or clinical practice. Finally, Myovolt devices are also commercially available and have been used in research studies [
36,
37,
38,
39,
40].
2.2. Overall Approach
Each device was tested under free vibration and constrained vibration conditions. For free vibration, the device was held in the hand lightly, with the forearm resting on a horizontal support (see
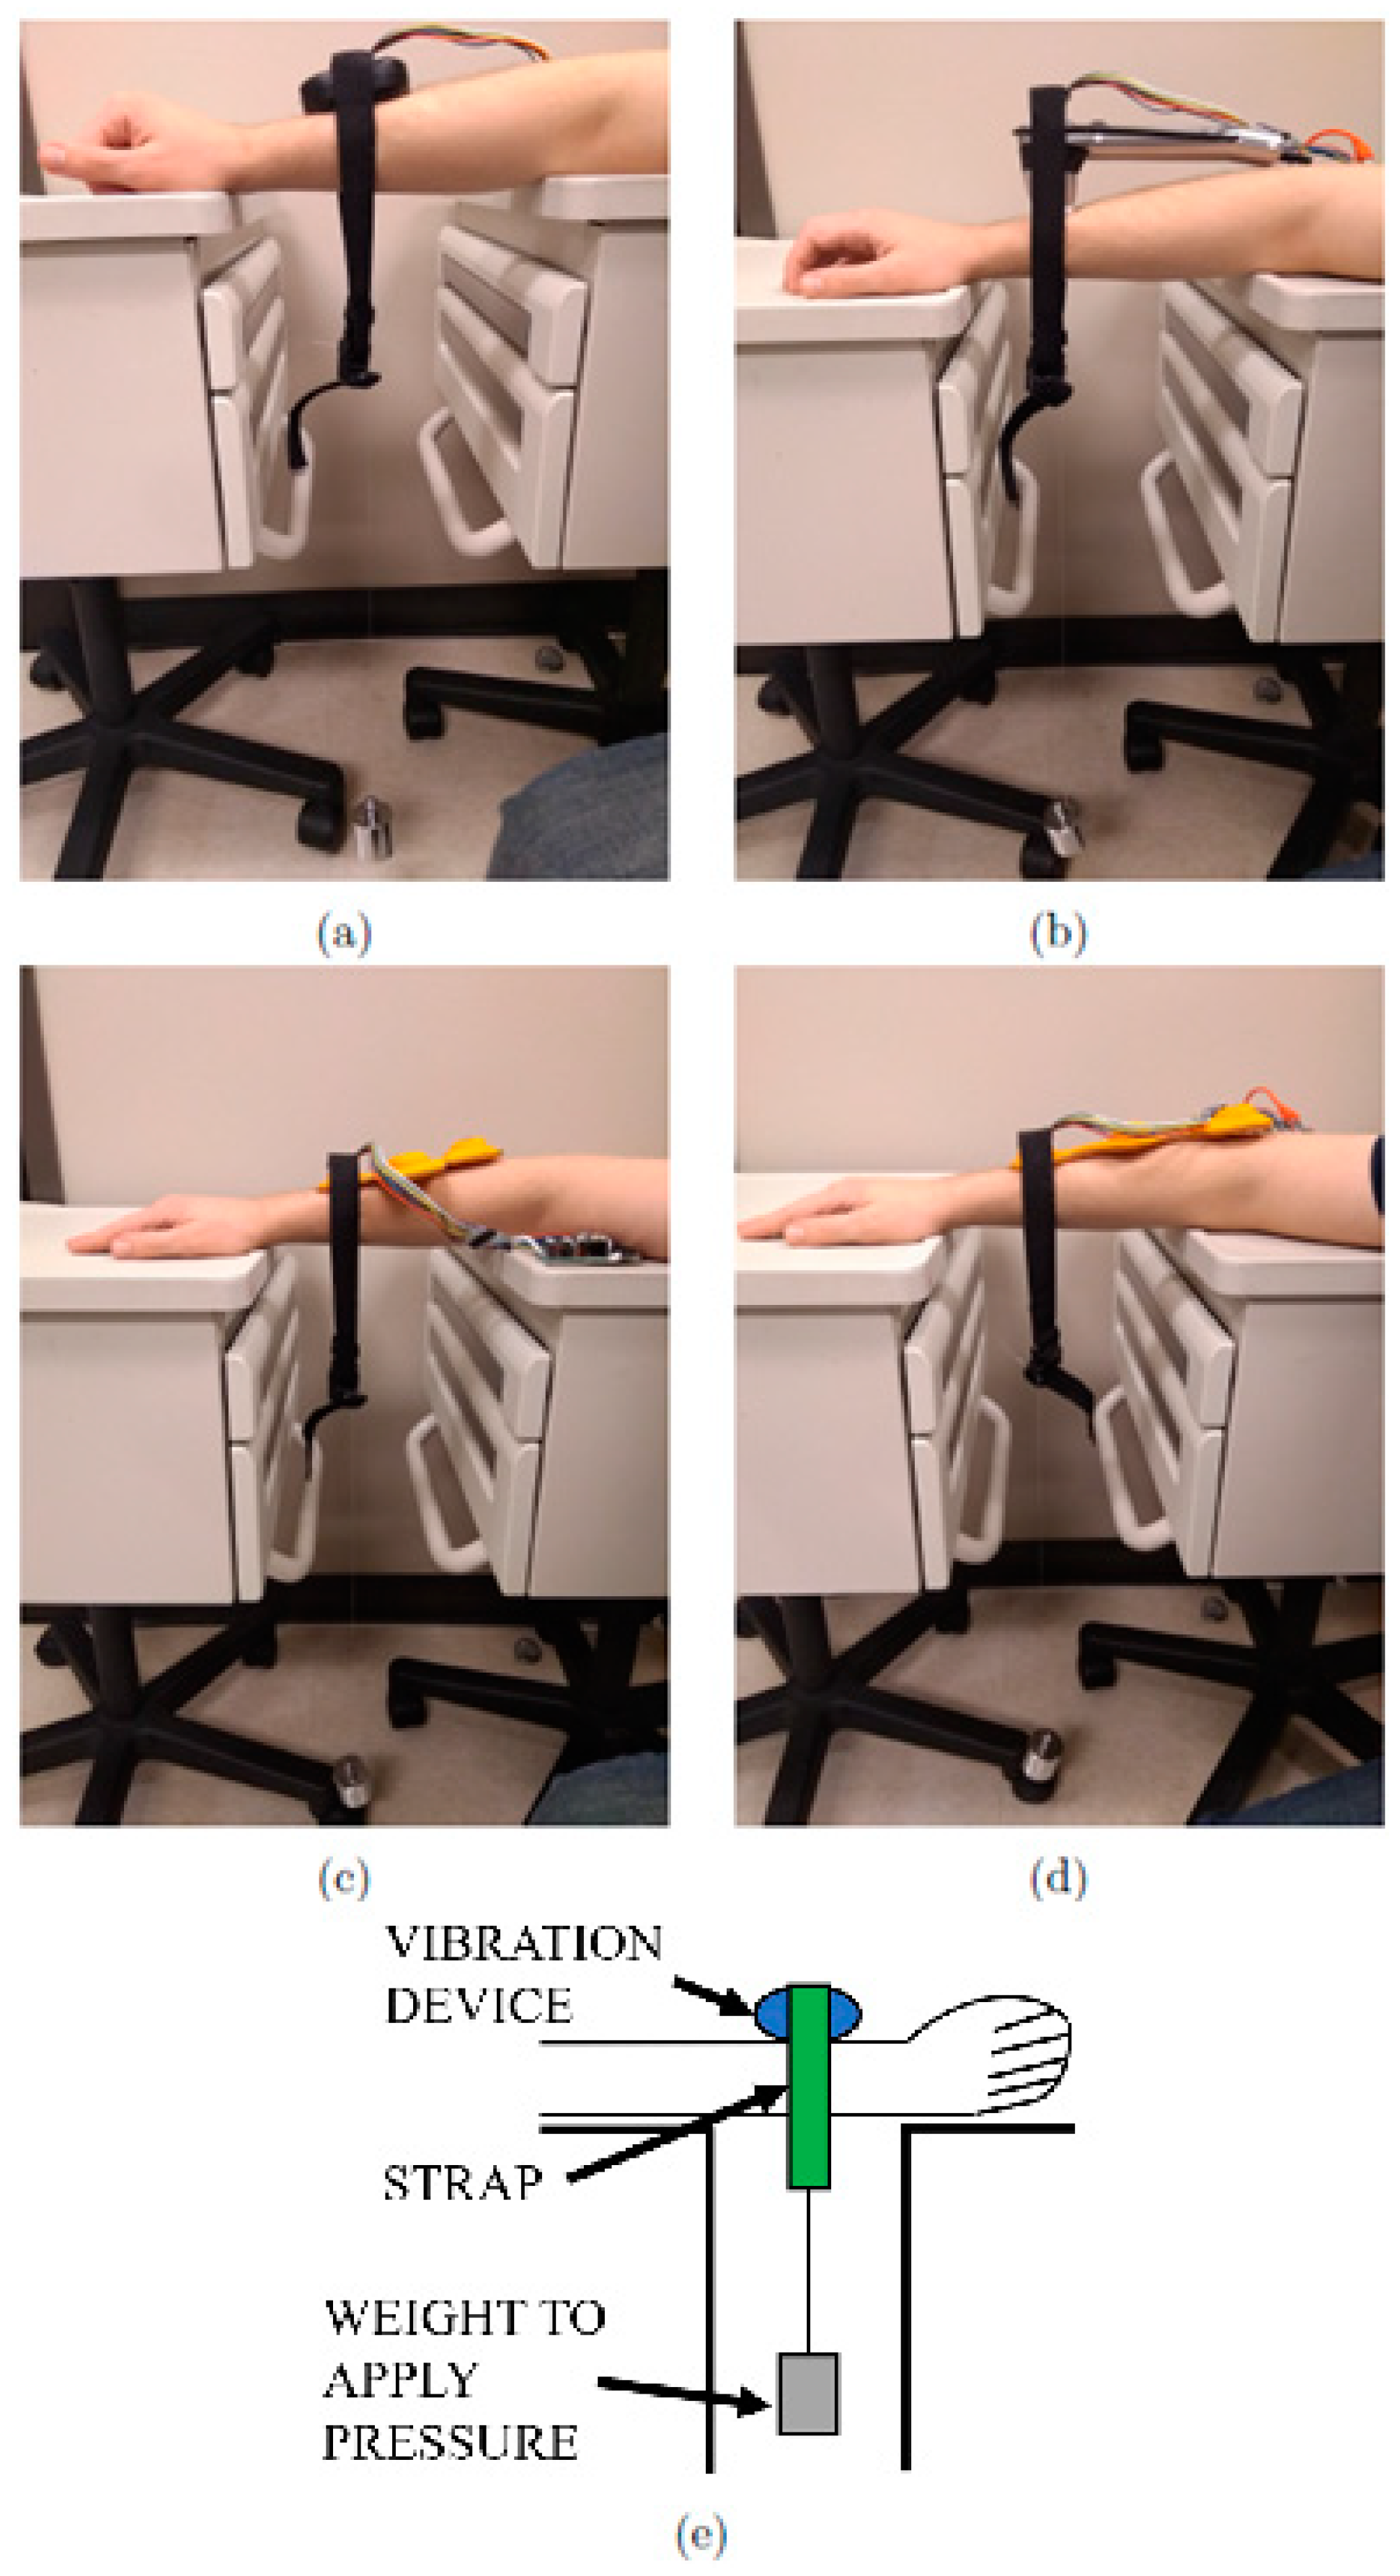
Figure 2). For constrained vibration, each device was placed on the forearm. The forearm was kept horizontal and the device was applied from above (see
Figure 3). Consistent pressure was maintained through the placement of a weighted securing strap. The strap was loosely placed around the device and a 500 g mass was suspended from the strap from below. This pressure seemed to be comfortable, yet strong enough to hold the device in place and firmly apply vibration. A 50 g mass was used for the Novafon to avoid dampening out the vibration. This was based on the 28 to 57 g (1 to 2 oz) range recommended in Reference [
41].
For measuring vibration characteristics, a distinction was made between the single-actuator devices (Vibracool, Novafon Pro) and multi-actuator devices (Myvolt two-actuator and three-actuator) due to their vibration characteristics. This was because the multi-actuator devices had time-varying vibration characteristics. This was observed in all three modes (sinusoidal, pulsing, and constant vibration).
2.3. Single-Actuator Devices
For the two single-actuator devices (Vibracool and Novafon Pro), an accelerometer (STMicroelectronics LSM9DS1, ±16 g’s full scale, 952 Hz sampling rate) was used to measure acceleration along the axis of vibration. A microcontroller (PJRC Teensy 3.2, 96 MHz) was used to read the raw accelerometer data and transfer it over USB to a computer to derive the measurement parameters. For each device, the accelerometer board was taped on to the body of the device. Peak-to-peak acceleration intensity (g’s) and frequency (Hz) were measured. Peak-to-peak acceleration intensity was computed by taking the difference between mean peak and mean valley (negative peak) over 200 samples (0.21 s, at a 952 Hz sampling rate). Frequency was computed by using mean zero-crossing rate (ZCR) over the same 200 samples. This measurement process was repeated three times, for each mode, for each device.
For the Novafon Pro, both Mode I and Mode II were used (120 and 60 Hz). For each mode of the Novafon Pro, the minimum and maximum intensity was used. The tested modes are listed in
Table 1.
2.4. Multi-Actuator Devices
The process of measuring the vibration characteristics of the two multi-actuator devices (Myovolt two-actuator and three-actuator) was different from in
Section 2.3, since the frequency and intensity were changing over time. The same accelerometer as in
Section 2.3 was used (STMicroelectronics LSM9DS1, ±16 g’s full scale, 952 Hz sampling rate). The accelerometer board was taped on to the body of the device, and acceleration was measured along the axis of vibration. In contrast to the previous approach for single-actuator devices, accelerometer data were recorded over 9520 samples (10.00 s, at a 952 Hz sampling rate). Since a constant peak-to-peak acceleration could not be measured, the maximum peak-to-peak acceleration was computed by using 95th and 5th percentiles of the peaks and valleys (negative peaks) as follows:
For both multi-actuator devices, intensity was computed for all three modes, i.e., Mode 1 (sinusoidal), Mode 2 (pulsing on/off), and Mode 3 (constant).
The vibration frequency was not measured because it changed over time and the multibody vibration dynamics distorted the frequency even further. This made frequency estimation using ZCR relatively unreliable.
Additionally, the time period for the vibration pattern for Mode 1 (sinusoidal) and Mode 2 (pulsing on/off) patterns was computed. Note that this is not related to frequency of vibration, which was not measured because it changed over time. The vibration pattern time period was computed by filtering the peaks through a 9-point moving average, then using a zero-crossing rate with a suitable threshold. Since Mode 3 did not have a vibration pattern, no pattern frequency was computed. Vibration pattern measurements were repeated three times for each mode for each device. An average was computed using the three free vibration and three constrained vibration samples, where the average was based on data from the six tests.
2.5. Relating Vibration Amplitude and Acceleration
Typically, past works have quoted vibration intensity in terms of displacement (or vibration amplitude). It is not clear why this has been a trend, since acceleration is relatively easier to measure, especially in the constrained vibration case. Perhaps this has been a trend because vibration systems and accelerometers have been miniaturized to feasible costs and sizes in only the past two decades. Vibration technology itself has been around for much longer, i.e., well over a century. In the past, bulkier and more expensive technologies, e.g., high-speed cameras and linear variable differential transformers (LVDT), were the most feasible options. These technologies can directly measure displacement (or vibration amplitude), possibly explaining why vibration intensity has been widely reported in the literature. We believe that using acceleration as a metric for vibration delivered is more logical and economical, given the widespread availability of low-cost micro-electro-mechanical systems (MEMS) accelerometers.
In the spirit of making the comparison with vibration displacement (or amplitude) easier, we present a conversion between displacement (or vibration amplitude) and peak-to-peak acceleration. Consider the motion of a vibration device as is vibrates in the normal direction to the body. We can safely assume a sinusoidal displacement pattern with amplitude
A/2 (m) (peak-to-peak amplitude
A). The sinusoidal pattern will have angular frequency
ω (rad/s). It follows that the displacement s (m) from the mean position, as a function of time t (s), is defined by the sinusoidal wave equation [cite
https://en.wikipedia.org/wiki/Sine_wave (accessed date 9 March 2021)]:
Alternatively,
ω can also be defined in terms of frequency
f in Hz:
From basic kinematics, velocity is the first derivative of displacement s (3):
From basic kinematics, acceleration is the second derivative of displacement s (3):
The displacement s is maximum when ds/dt = 0. Thus, from (4),
We also know that when displacement is maximum, the acceleration is maximum (in the opposite direction). Taking the first value π/2, we get the maximum acceleration from (5):
Rearranging, we have a relation where we can compute peak-to-peak amplitude
A (m) given maximum acceleration (ms
−2) and vibration frequency
f (Hz):
If acceleration is instead in g’s, and 1 g is 9.81
, then the peak-to-peak amplitude
A (m) is given by:
Maximum acceleration is half of peak-to-peak acceleration. Vibration amplitudes are typically in the order of mm. In terms of peak-to-peak acceleration in g’s, the peak-to-peak amplitude
A (mm) is given by:
Therefore, to convert between peak-to-peak vibration amplitude
A (mm) and peak-to-peak vibration acceleration, acceleration
PKPK (g’s), (11) may be used, if the frequency of vibration
f (Hz) is known. This relationship is illustrated in
Figure 4.
4. Discussion
Little is known about the effective vibration characteristics of FV devices. In this study, we measured vibration characteristics of four commercially available FV devices. Anecdotal and literature evidence exists indicating that these devices can be effective, but the application of the FV therapy was limited. One factor influencing limited use is the lack of clinical practice guidelines for FV therapy. Much is unknown regarding how much vibration was actually delivered to the target muscles or body segments, as little research on the exact delivery of FV exists. Since the vibration characteristics of FV devices can be used as a starting point to devise FV therapy protocols, we conducted the experiments in this study to quantify the vibration delivery of four commercially available devices that have been used in clinical settings.
We measured peak-to-peak acceleration and vibration frequency. In the case where the devices were free to vibrate, peak-to-peak acceleration ranged from about 2.0 to 7.9 g’s. The vibration frequency ranged from about 120 to 225 Hz. When the devices were worn on the body, in general, the peak-to-peak vibration intensity dropped by 5.8% to 65.7%. This indicates that when quoting FV parameters, it is necessary to specify the vibration condition (free-vibration or constrained-vibration). The free-vibration condition is not an accurate representation of the vibration delivered to the body. The frequency drop in the Novafon vibration device can likely be attributed to the fact that the transducer is in direct contact with the body, and so the vibration mechanism and hence the driving (excitation) frequency can be physically hindered. This is different from typical vibration motor-based devices, where the vibration mechanism is enclosed, and the driving or excitation frequency cannot be physically hindered. From these data, it is apparent that, in general, vibration frequency does not change significantly when applied to the body.
Vibration intensity in the constrained vibration case (
Figure 6) is the most interesting because it reflects a realistic scenario where the FV device is applied to the body. Three clusters of changes occurred in intensity. First, there was a significant decrease ranging from 40.9% (Myovolt three-actuator, Mode 3) to 65.7% (Novafon Mode II, maximum). Next was the cluster of moderate decrease in intensity ranging from 5.8% (Myovolt two-actuator, Mode 2) to 22.3% (Vibracool). The third cluster with a lone data point showed a moderate increase in vibration intensity to 23.5% (Myovolt two-actuator, Mode 3). We can deduce that when worn on the body, the vibration intensity of a device can decrease anywhere from 5.8% to 65.7%. For the Myovolt two-actuator device, the increase in intensity can be attributed to the second vibration motor, which could have been vibrating in phase to amplify the vibration, i.e., constructive interference. Alternatively, this could be attributed to the structural dynamics of the Myovolt two-actuator device. For example, the resonant frequency in the constrained configuration may have been closer to the vibration motor frequency, resulting in higher vibration intensity. Thus, in free vibration, some vibration energy may have been lost in vibrating the flexible structure, while in constrained vibration, less vibration energy would have been lost this way.
The Myovolt device provides different vibration patterns. This could provide an alternative starting point for FV therapy. Time-variant vibration patterns such as these may be more effective than constant vibration due to human mechanosensitive neurons becoming more desensitized in response to sustained mechanical stimulation [
20]. Therefore, to maximize response to the vibration, applying vibration that changes over time might be more appropriate.
Lastly, we derived the relation between vibration amplitude and acceleration. For clinicians, it could be easier to use the displacement (amplitude) to describe the vibration intensity (acceleration), which is why in most of the literature, the vibration amplitudes were reported as displacement in mm. However, it is critical to know how much acceleration was applied with each given displacement. As mentioned above, the relationship between the amplitude and acceleration was also dependent on frequency. As shown in
Figure 4, the lower the frequency, the higher the peak-to-peak amplitude for a given peak-to-peak acceleration.
The current study had some limitations. First, we only included four commercially available wearable FV devices in this study. We selected the devices based on their applications in clinical settings. In the future, we will include more devices based on different features and designs. We will also try to include the non-portable devices that have been tested in another study to compare the performance differences among them [
15]. Second, the accelerometer used in the present study was not optimized (barely adequate for the device frequency measured). We will test more FV devices with an accelerometer with a higher sampling rate to improve the accuracy of our results. Finally, all of the FV devices were applied to the same person (one of the researchers) on the same muscle. In future study, we will test more FV devices on different muscles and tendons and will test the devices on more individuals to determine whether the FV parameters change with body types, e.g., another variable in FV therapy that must be addressed. In future, we will also work towards developing a more unambiguous metric for quantifying the amount of vibration delivered. Using only amplitude and frequency, or acceleration and frequency, might not be sufficient.
5. Conclusions
The main contributions of this paper are two-fold. First, the findings will help researchers and clinicians to learn the effective vibration parameters delivered by different techniques, especially when applied to the human body. Second, the results can be used to guide the future application and design of new FV technology that can deliver precise vibration for rehabilitation. In this work, we tested, analyzed, and compared the vibration frequencies and intensities of four different wearable FV devices in free vibration, as well as when applied to the human body. We observed that the vibration intensity usually drops when a device is in contact with the human body. For future work, this indicates that vibration parameters must be quoted in both conditions. Moreover, the difference in these vibration parameters can indicate the actual vibration delivered into the body. So, there needs to be an improved measure for quantifying vibration delivered, perhaps in terms of energy, force, or momentum. Another area for future work is modeling the vibration interface with the muscle to predict the muscle response. Such a model should consider the type, size, and location of the muscle, as well as how tightly the device is pressed against the muscle. We highlighted that having devices with multiple vibration sources in the same structure can result in inconsistent FV dosage. This indicates that such device configurations should be avoided. We presented a conversion chart to convert between vibration amplitude and acceleration. This will help compare works using both units of intensity. Finally, the quantification approaches developed in this study can also be used to quantify WBV therapy delivery, which can guide WBV clinical practice.


