
Low-Light Photodetectors for Fluorescence Microscopy


Abstract
1. Introduction
2. Fluorescence Microscopy
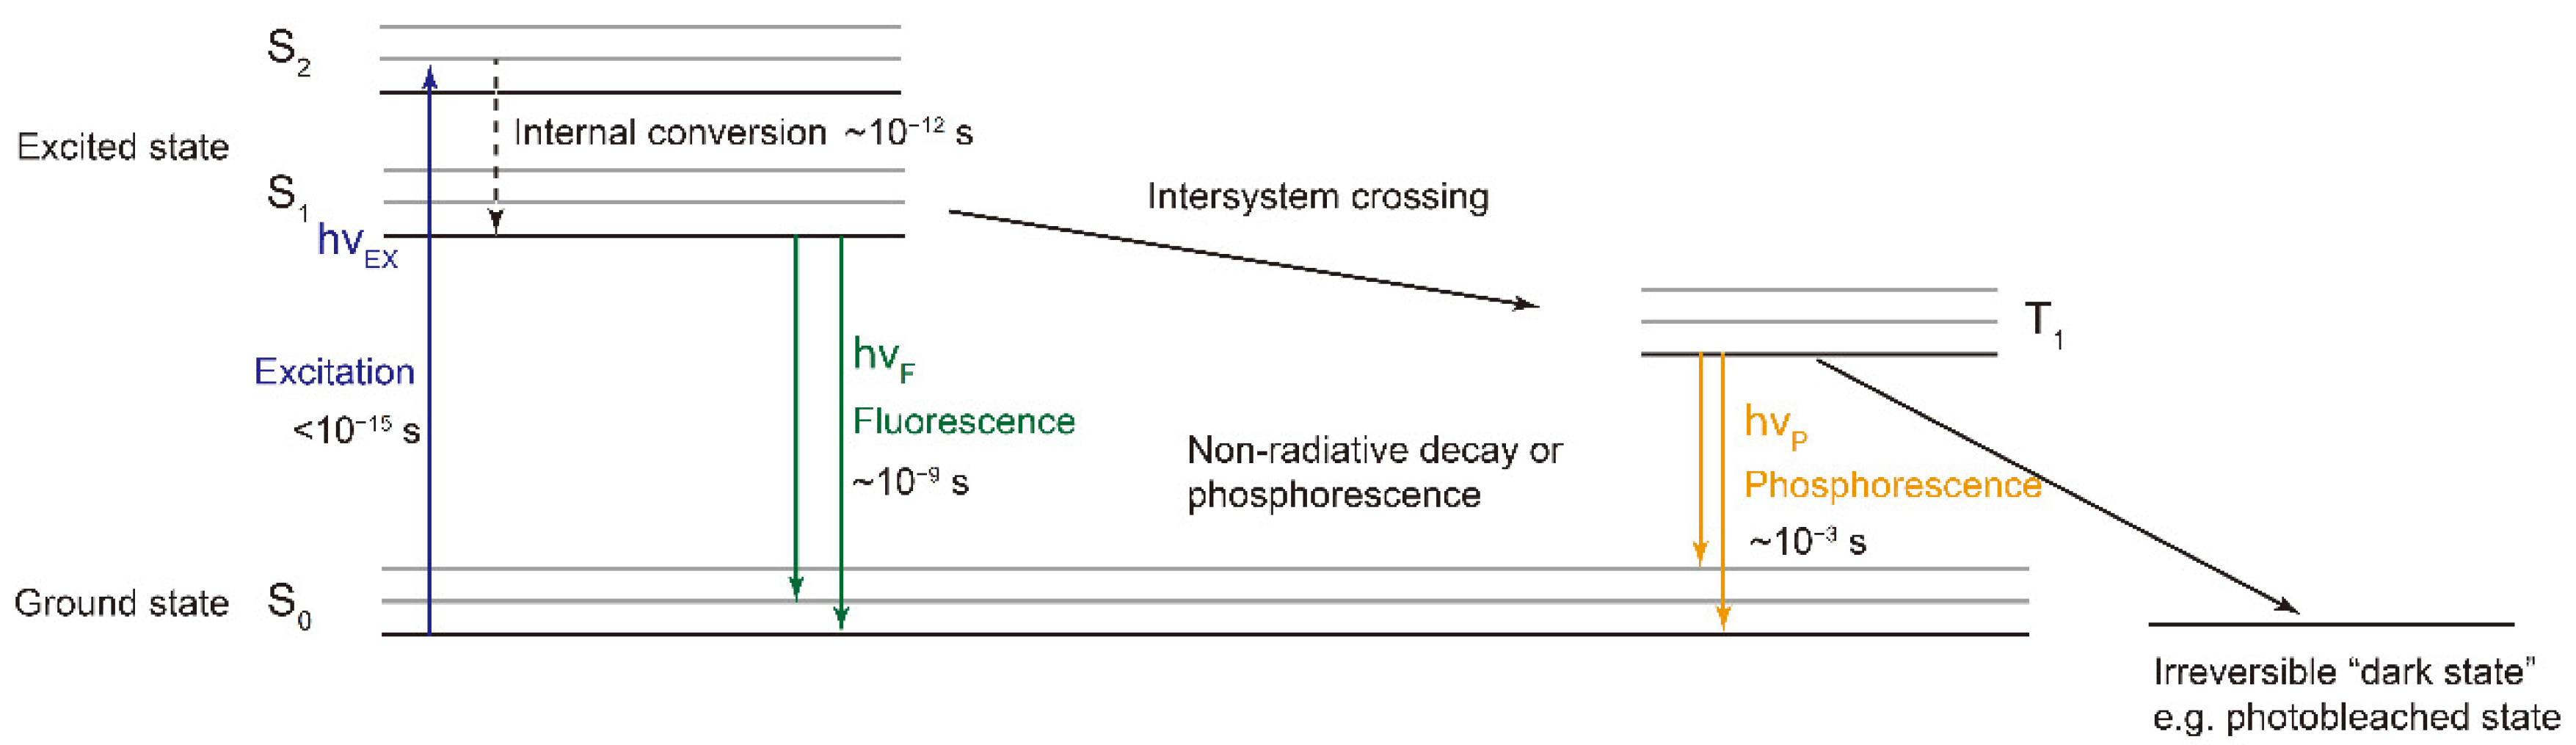
2.1. Fluorescence
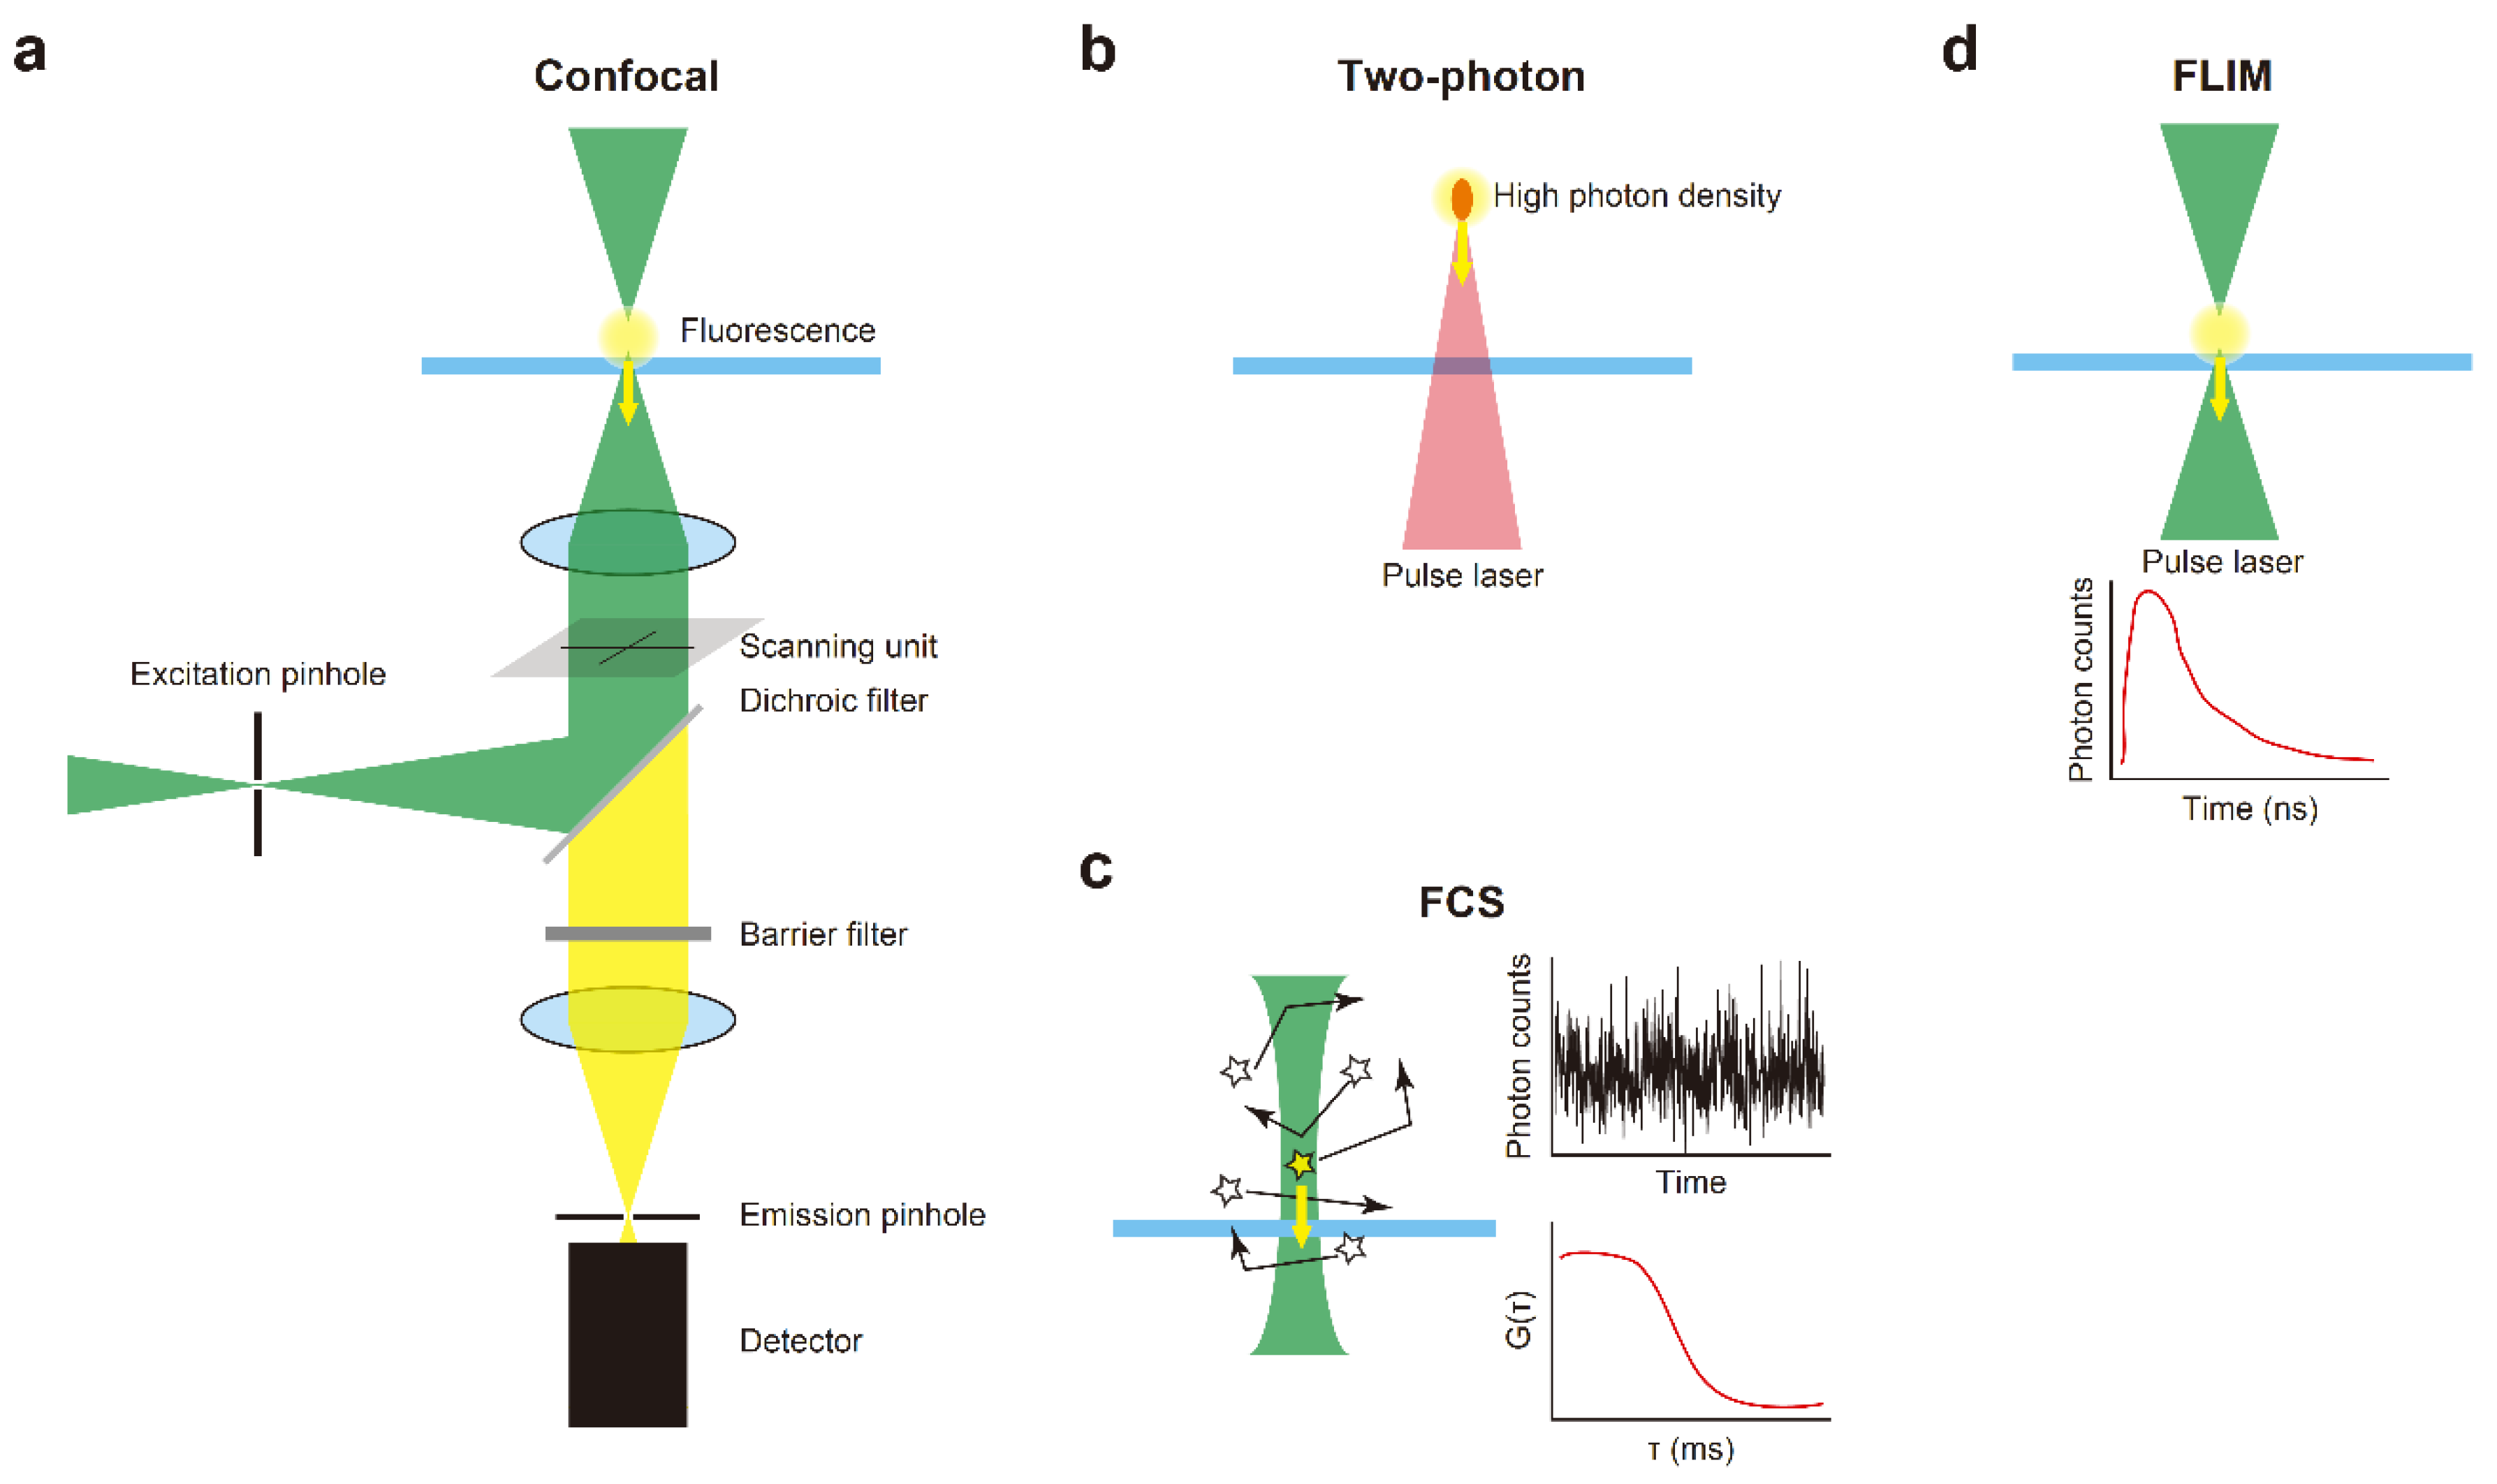
2.2. Laser Scanning Fluorescence Microscopy (LSM)
2.3. Confocal Microscopy
2.4. Two-Photon Micriscopy
2.5. Fluorescence Correlation Spectroscopy (FCS)
2.6. Fluorescence Lifetime Imaging Microscopy (FLIM)
3. Single Point Detectors
3.1. Performance Indices
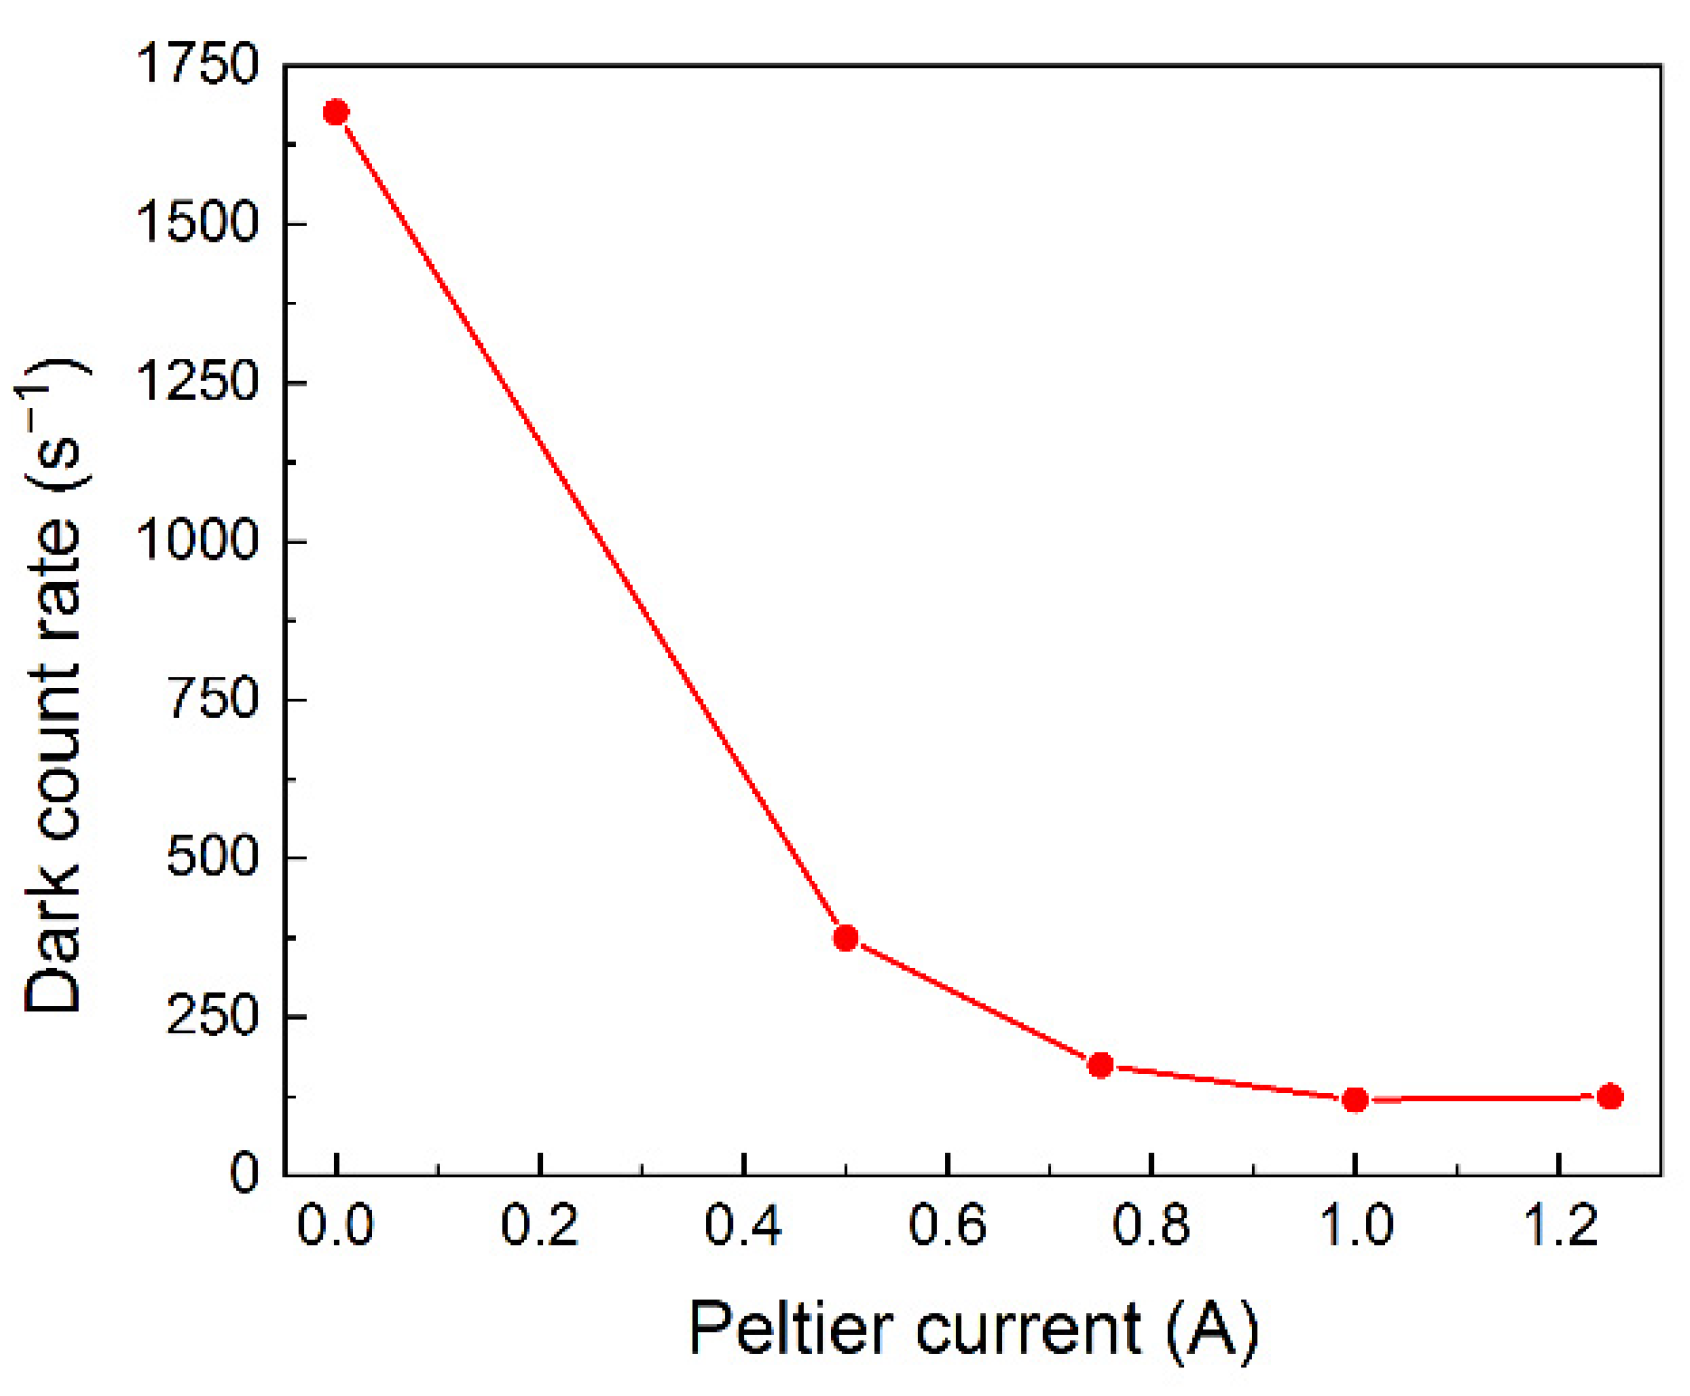
3.1.1. Dark Count
3.1.2. Instrument Response Function
3.1.3. Afterpulse
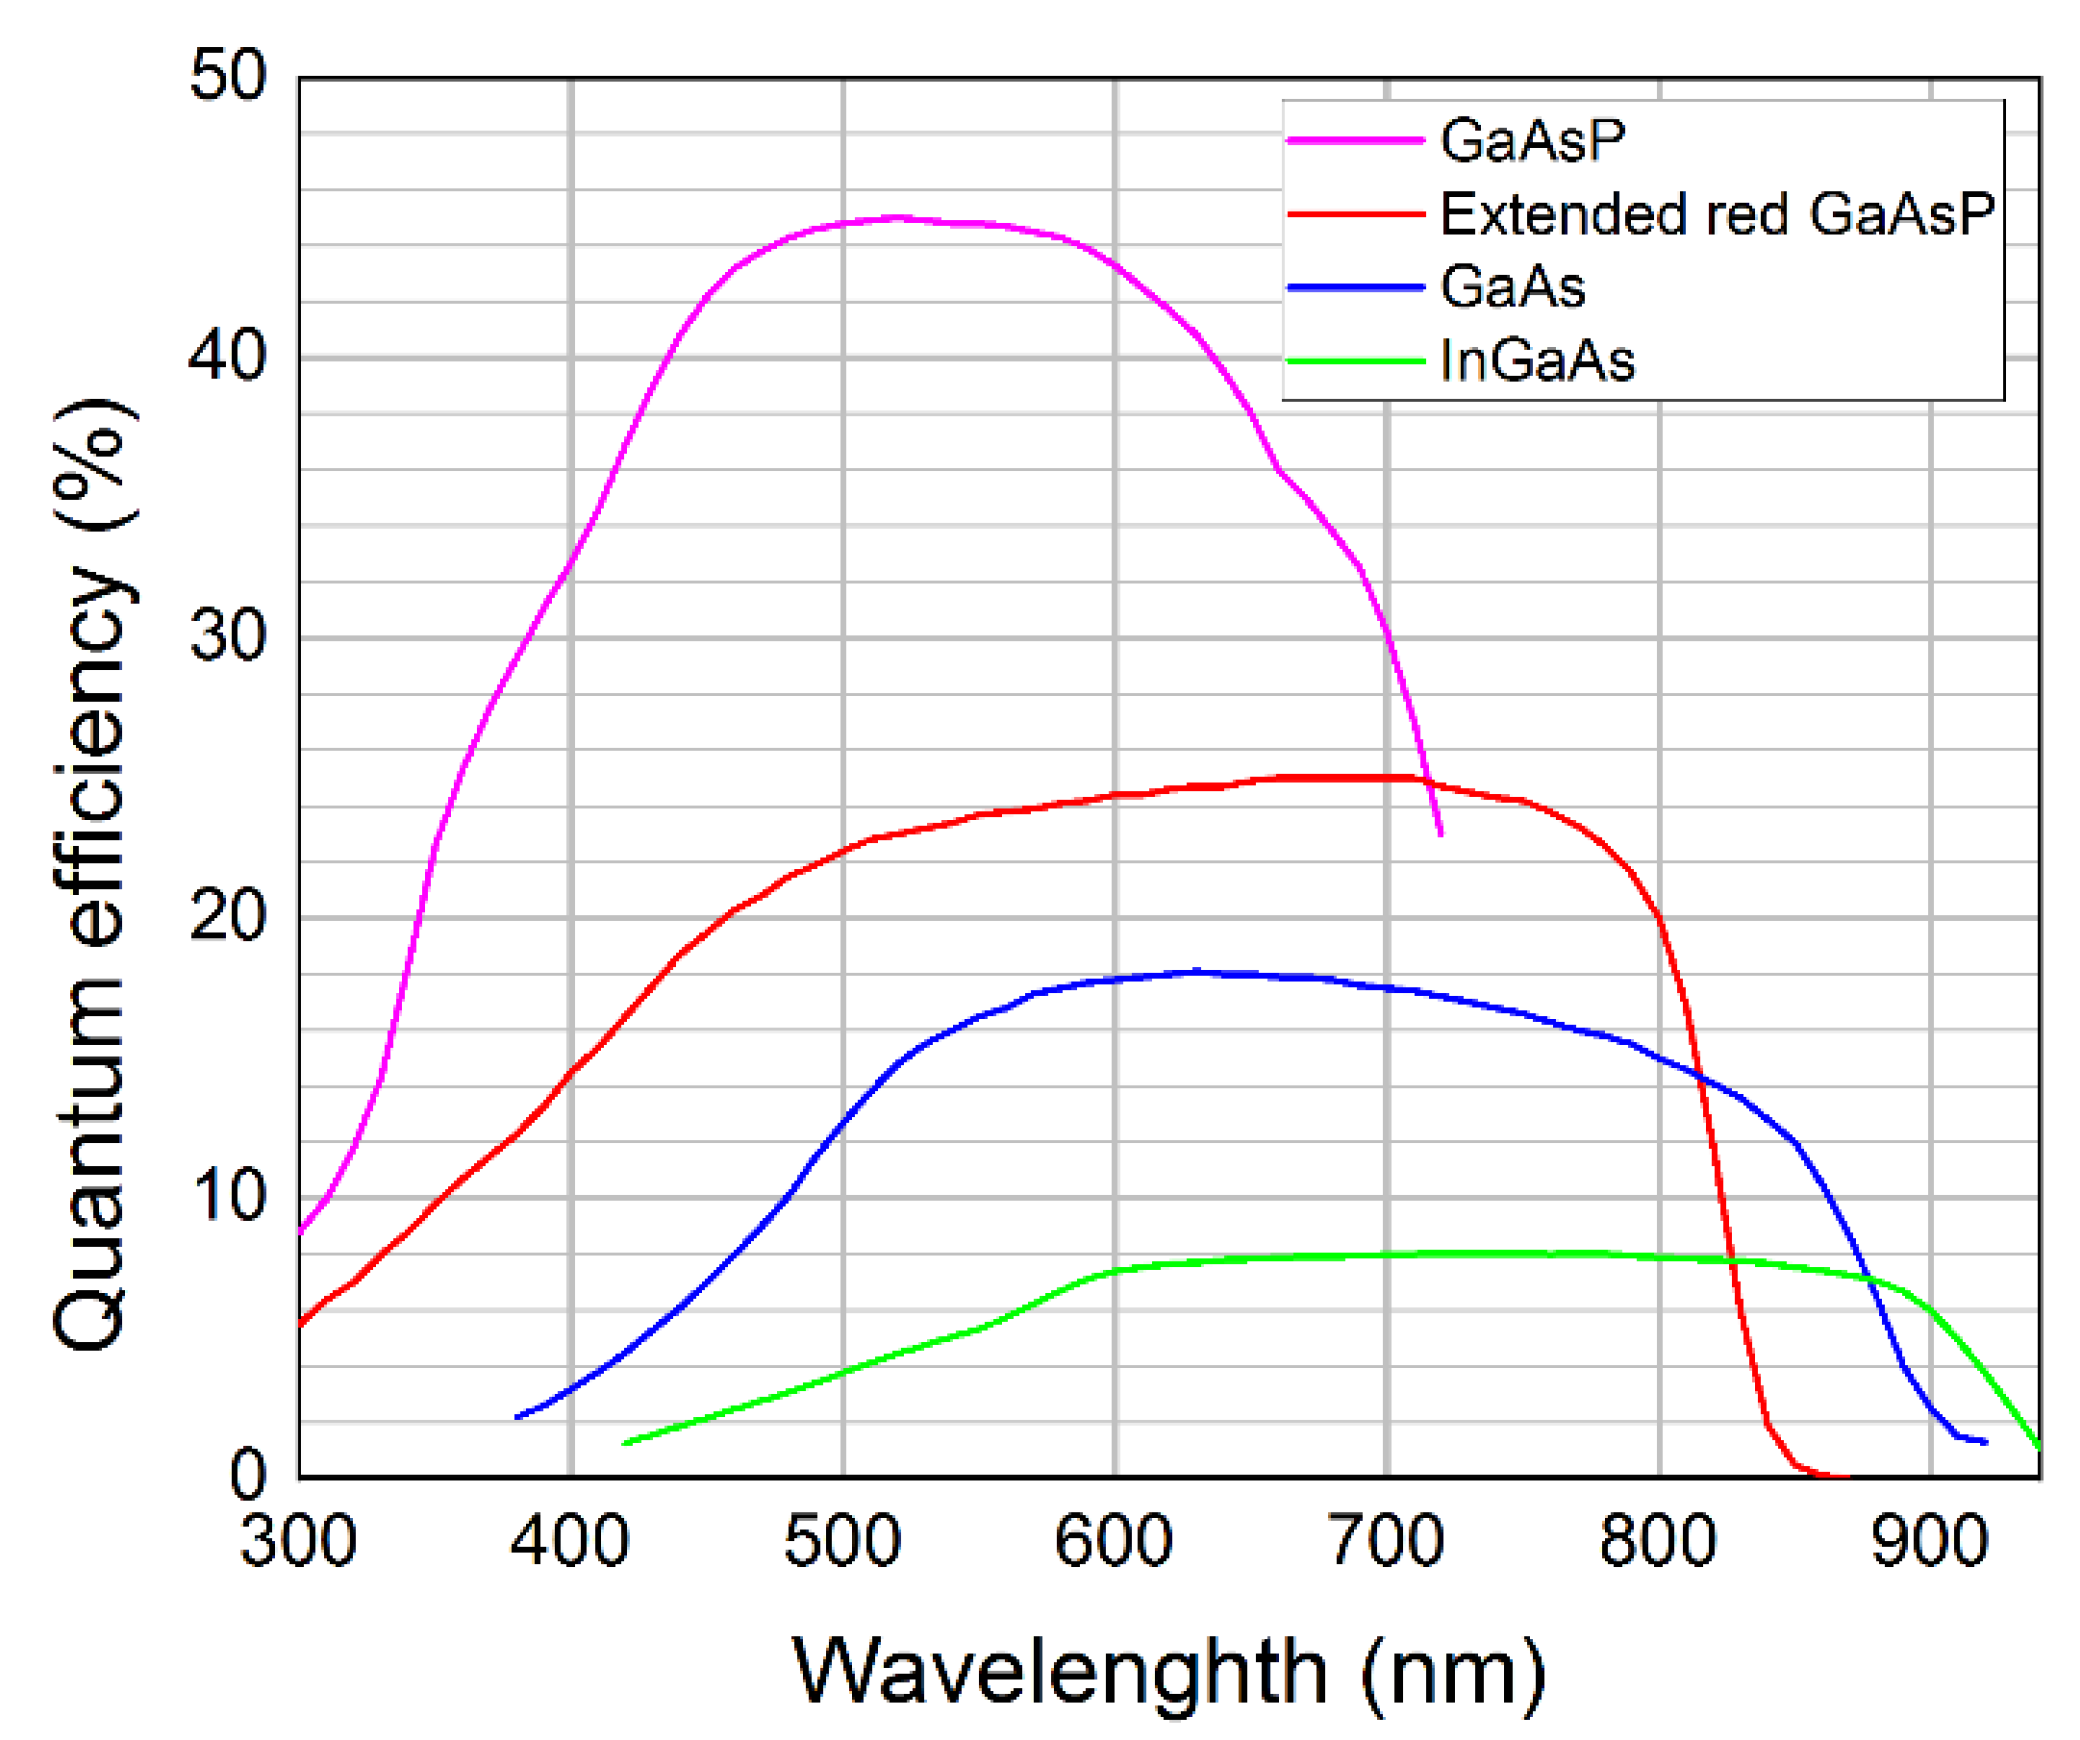
3.1.4. Sensitivity
3.1.5. Active Area
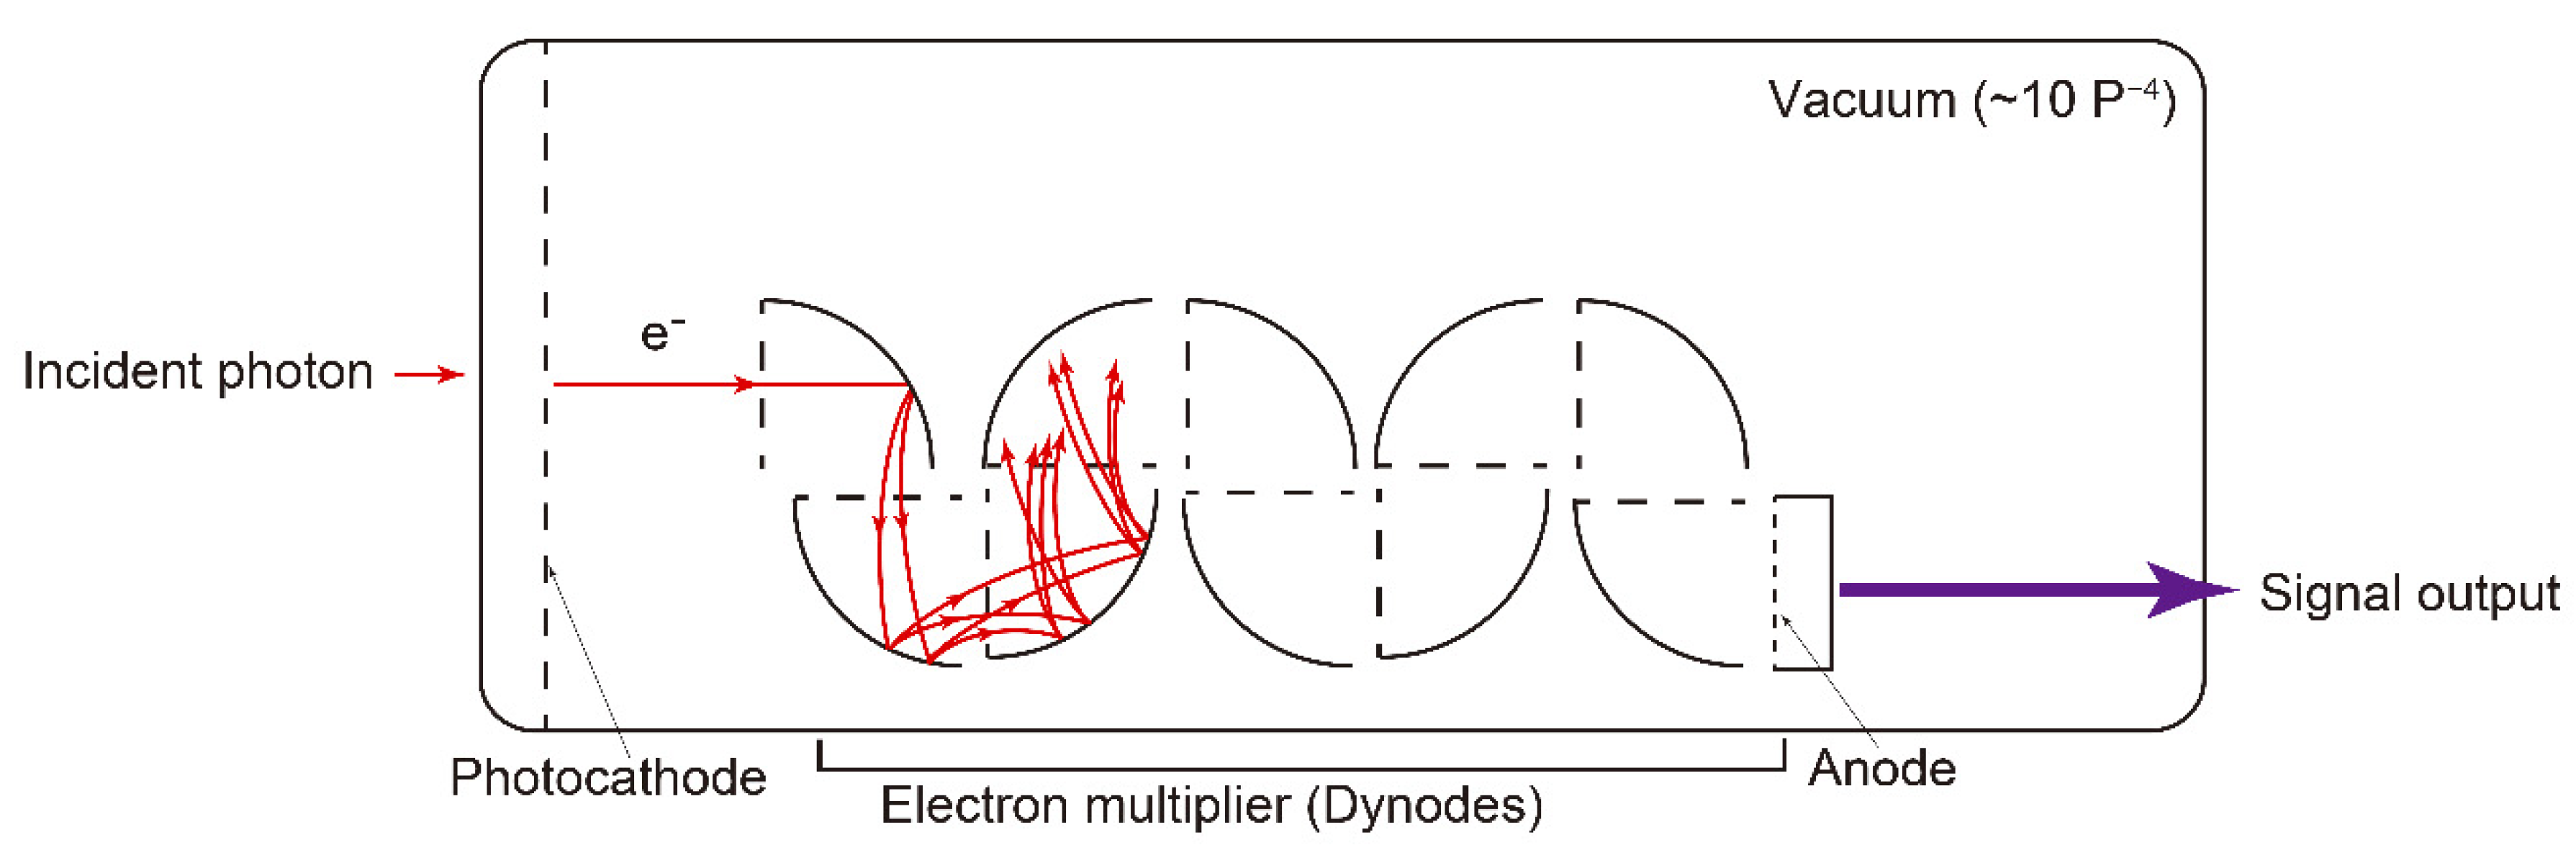
3.2. Photomultiplier Tube (PMT)
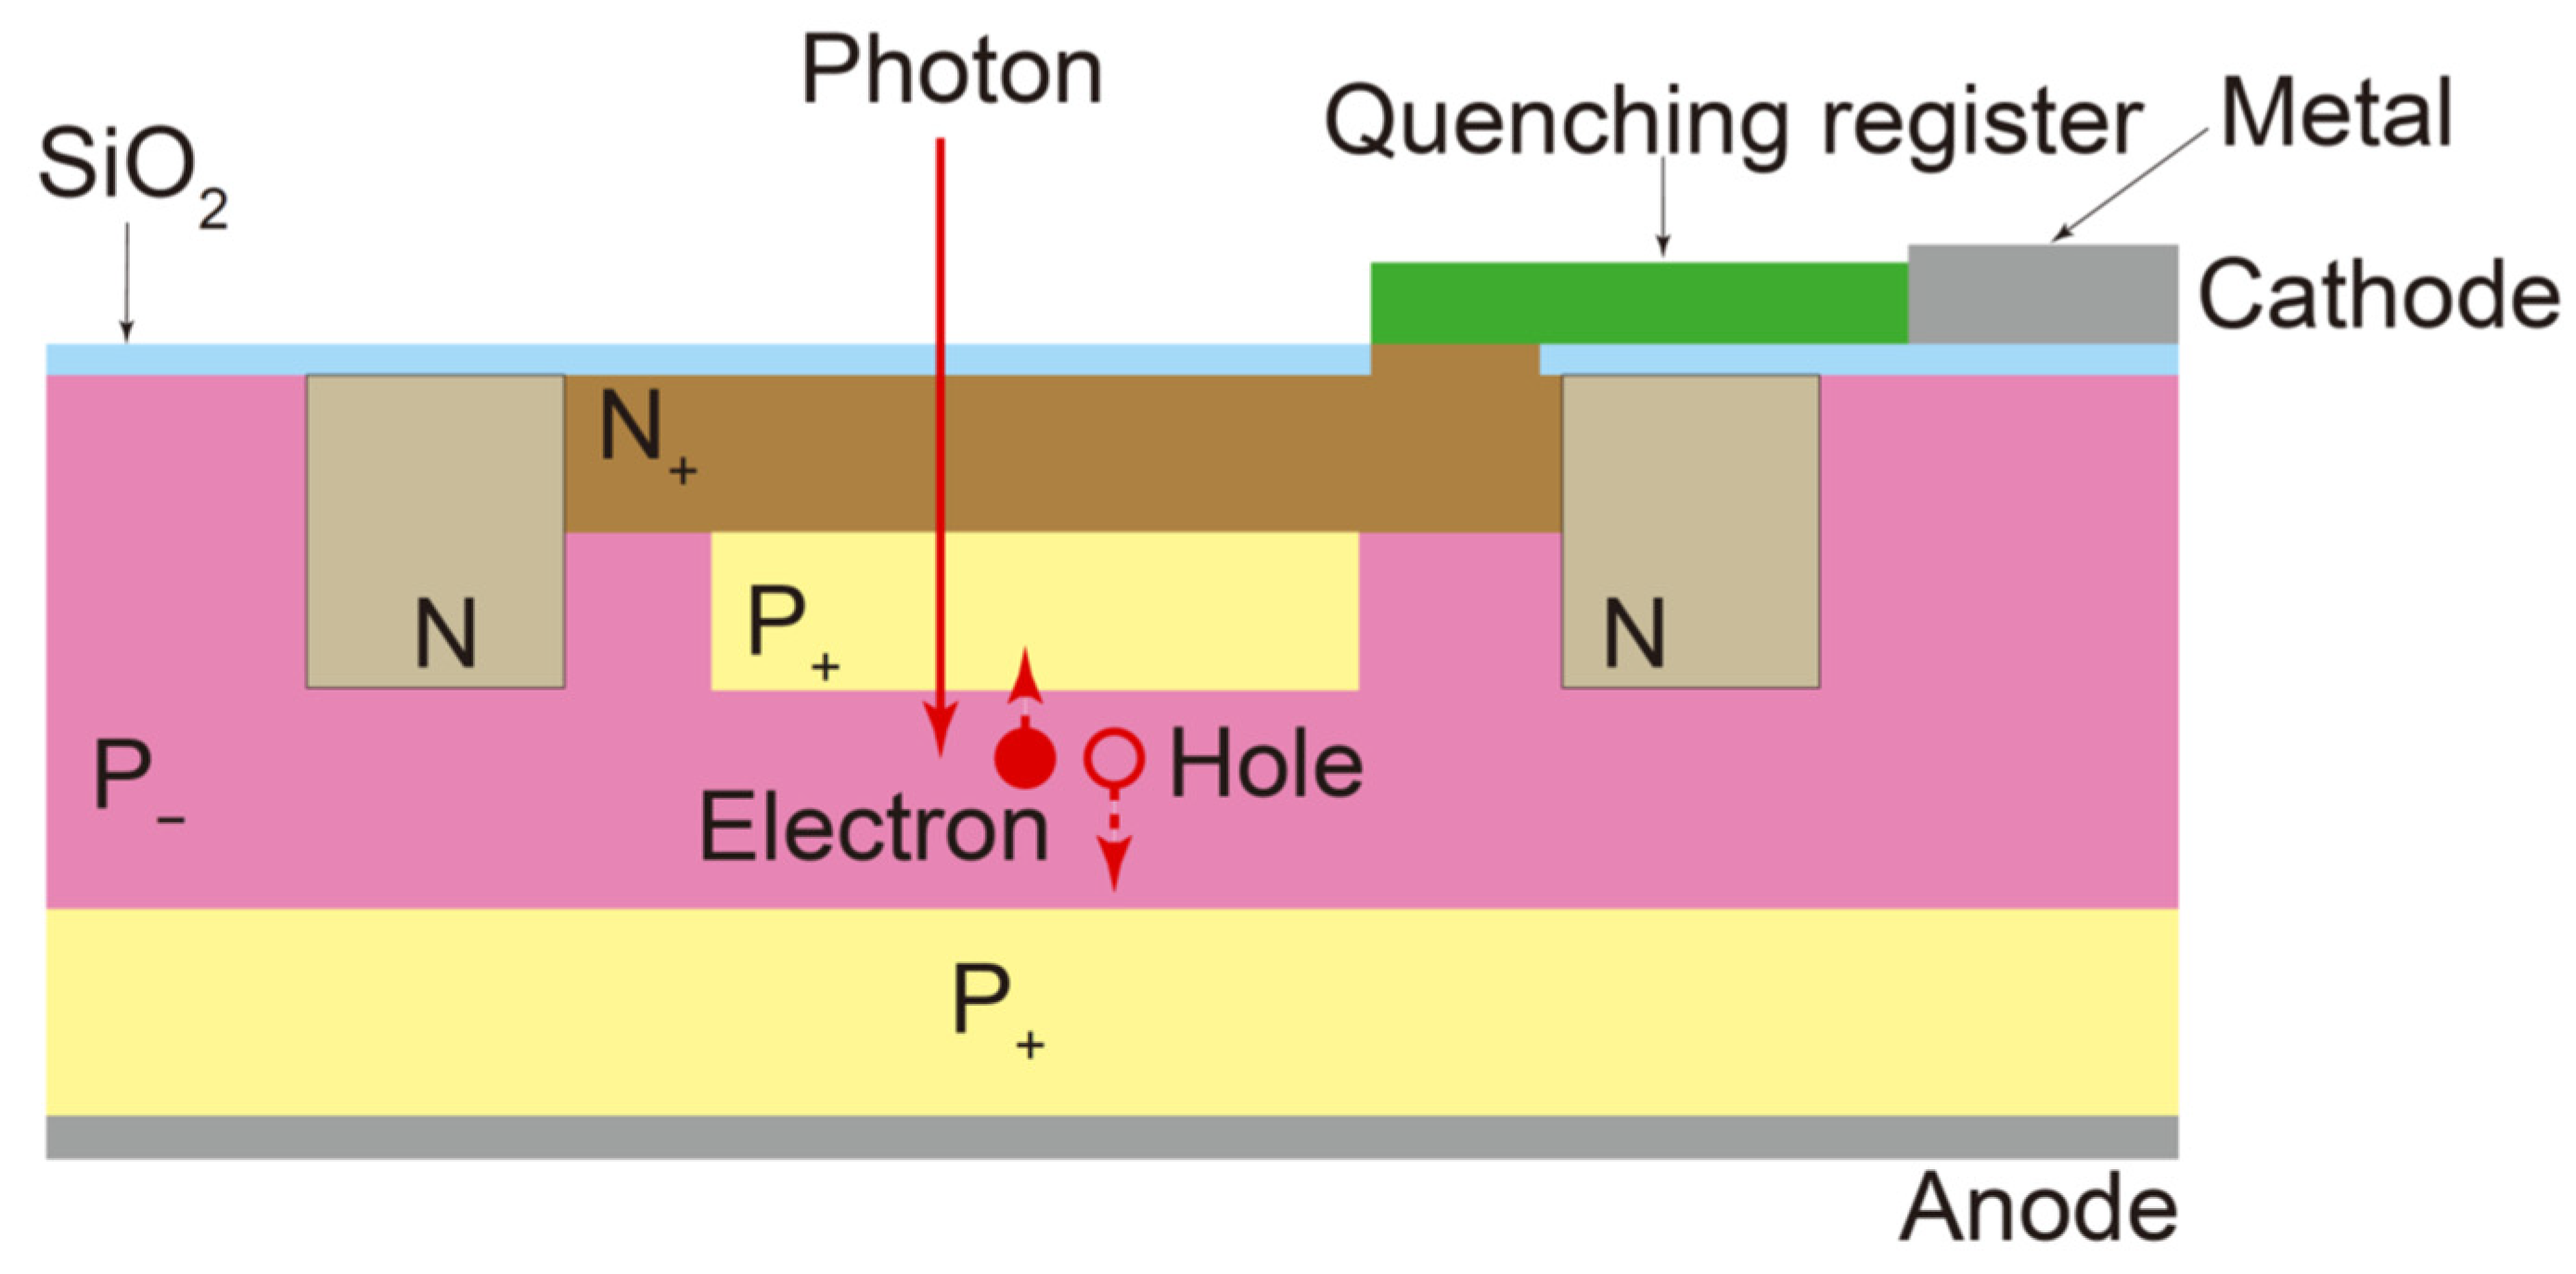
3.3. Single Photon Avalanche Diode (SPAD)
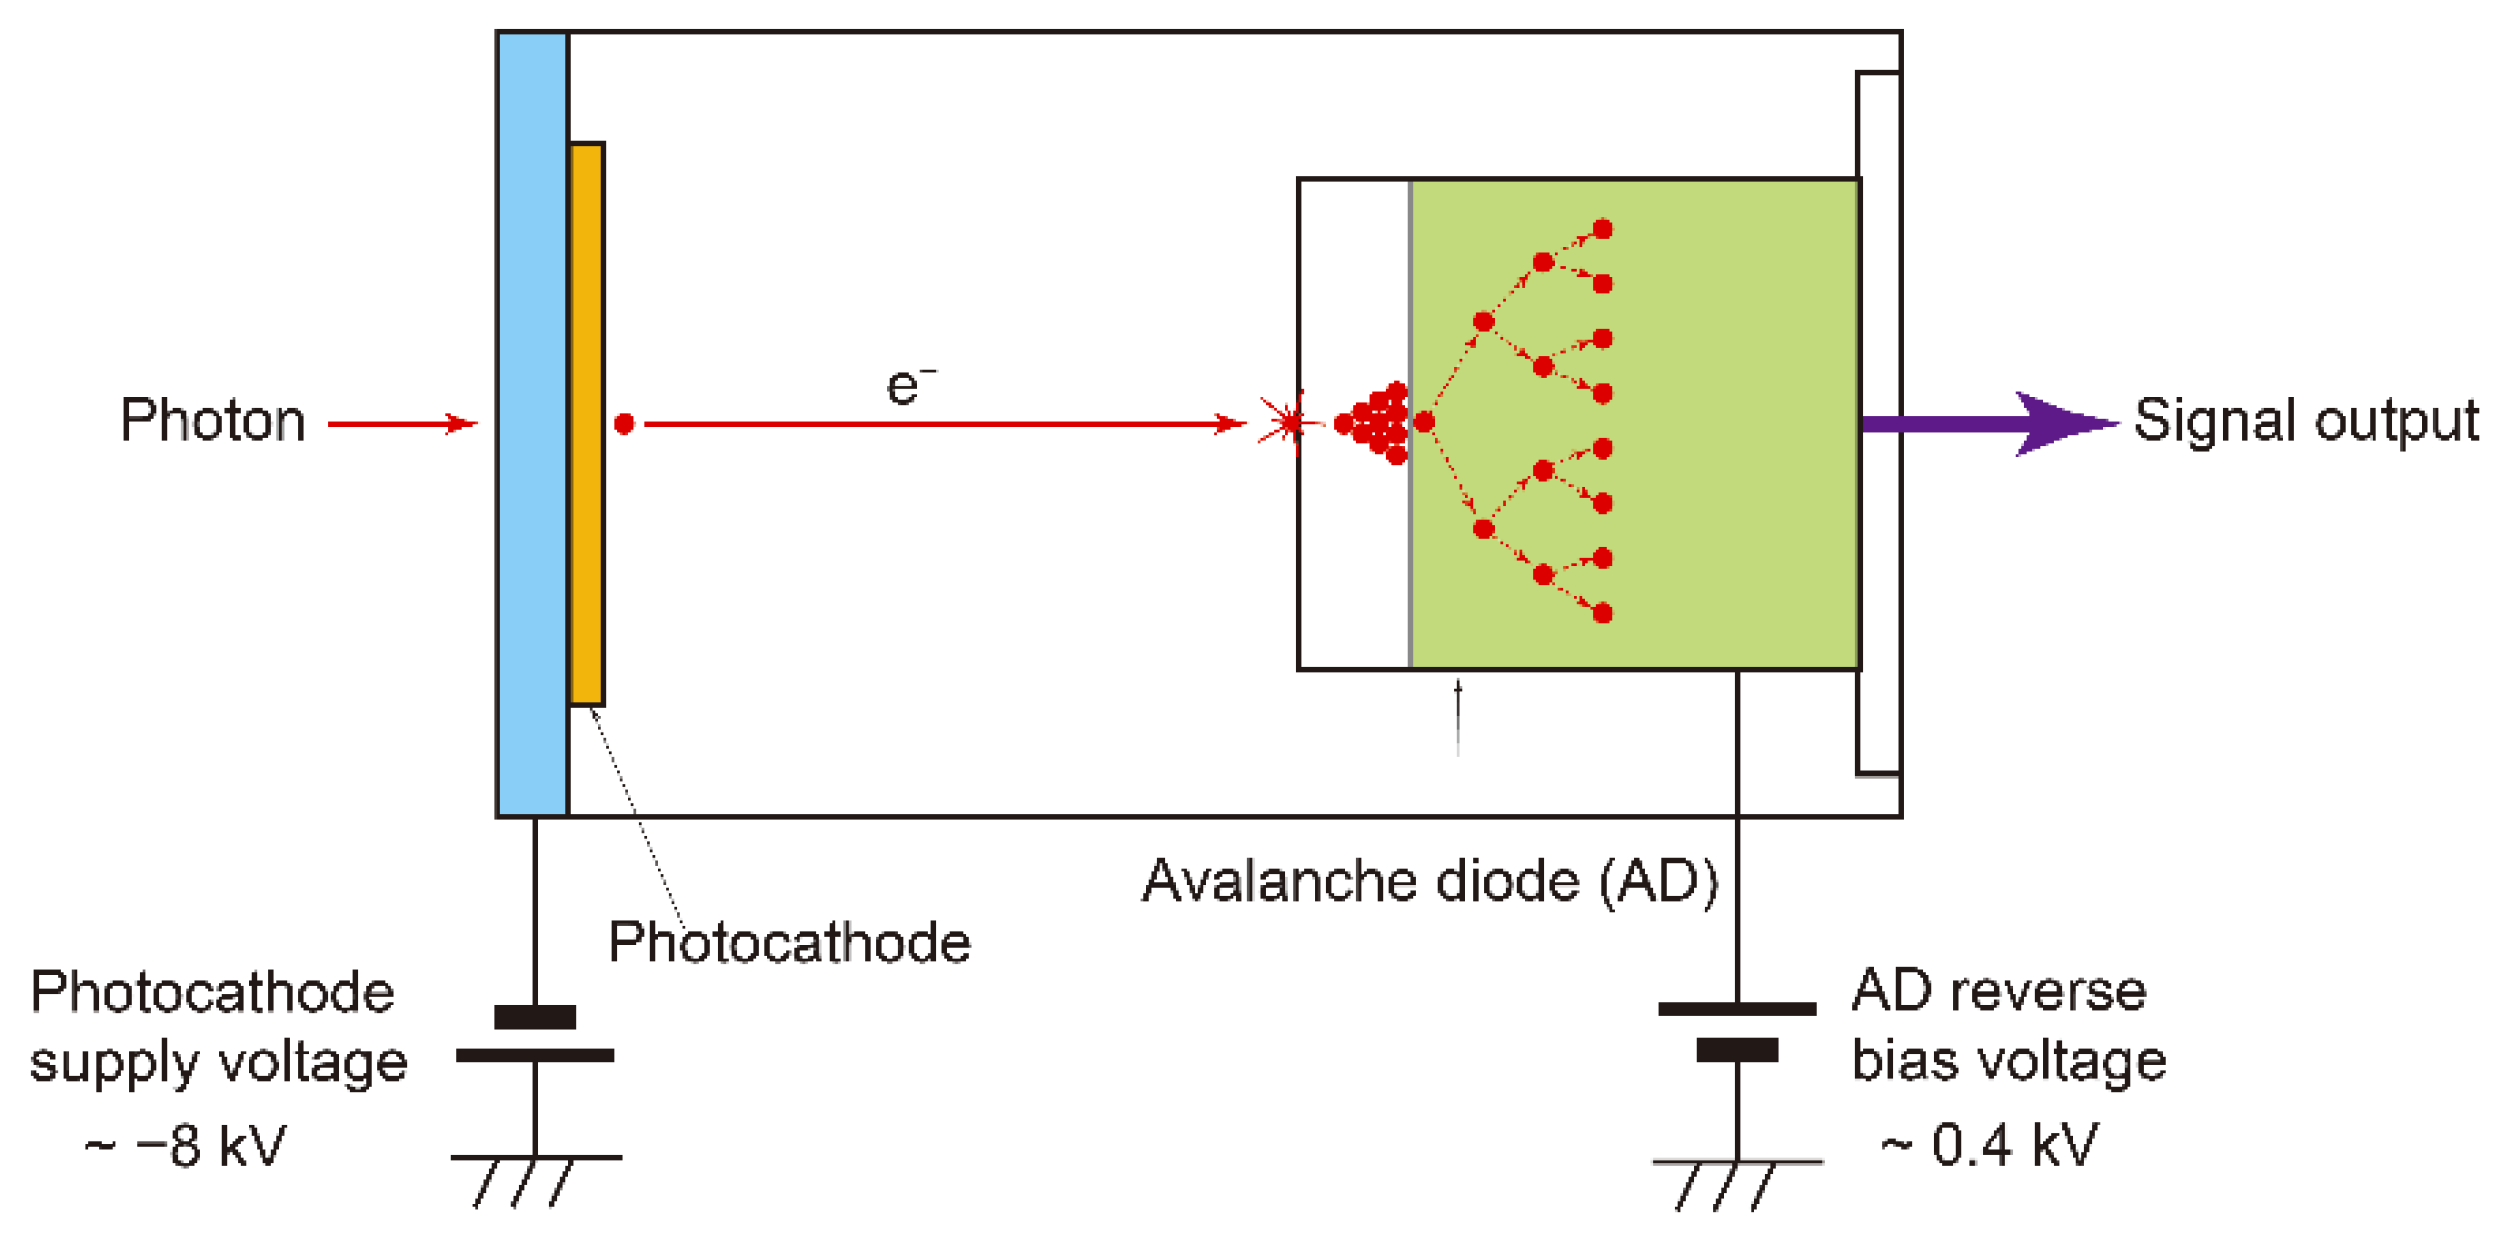
3.4. Hybrid Photodetector (HPD)
3.4.1. Features of HPD
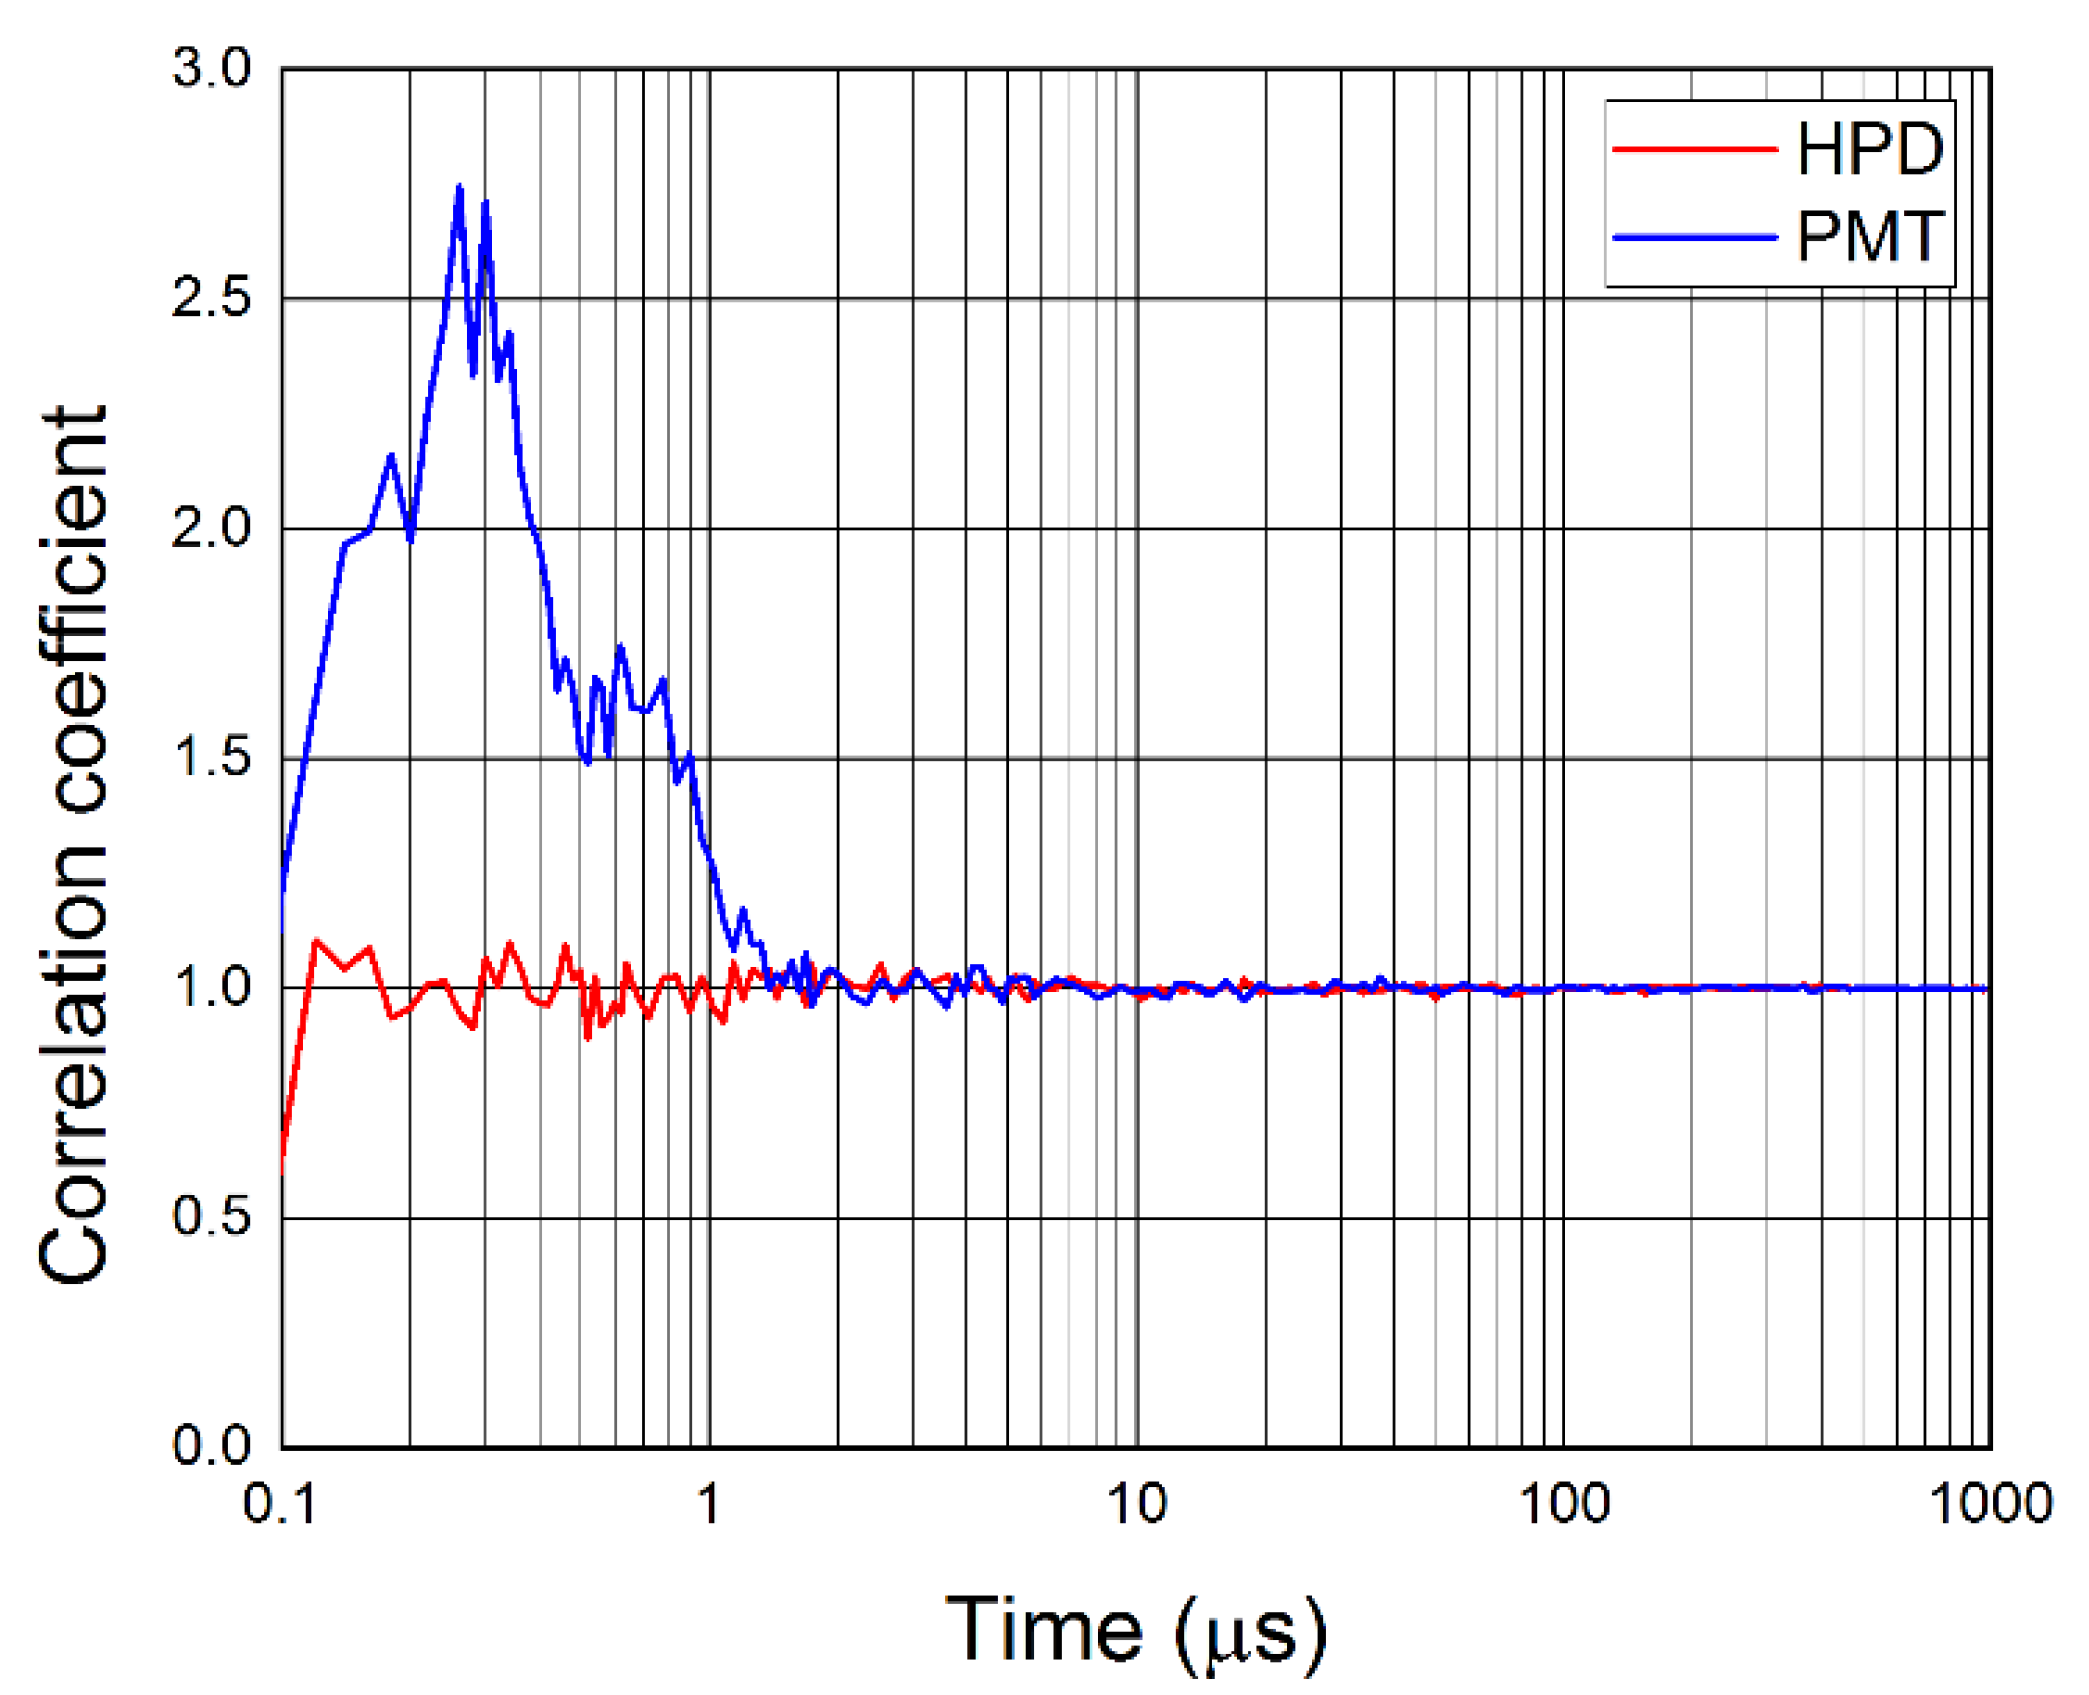
Low Afterpulse
High Resolution of Photon Counting
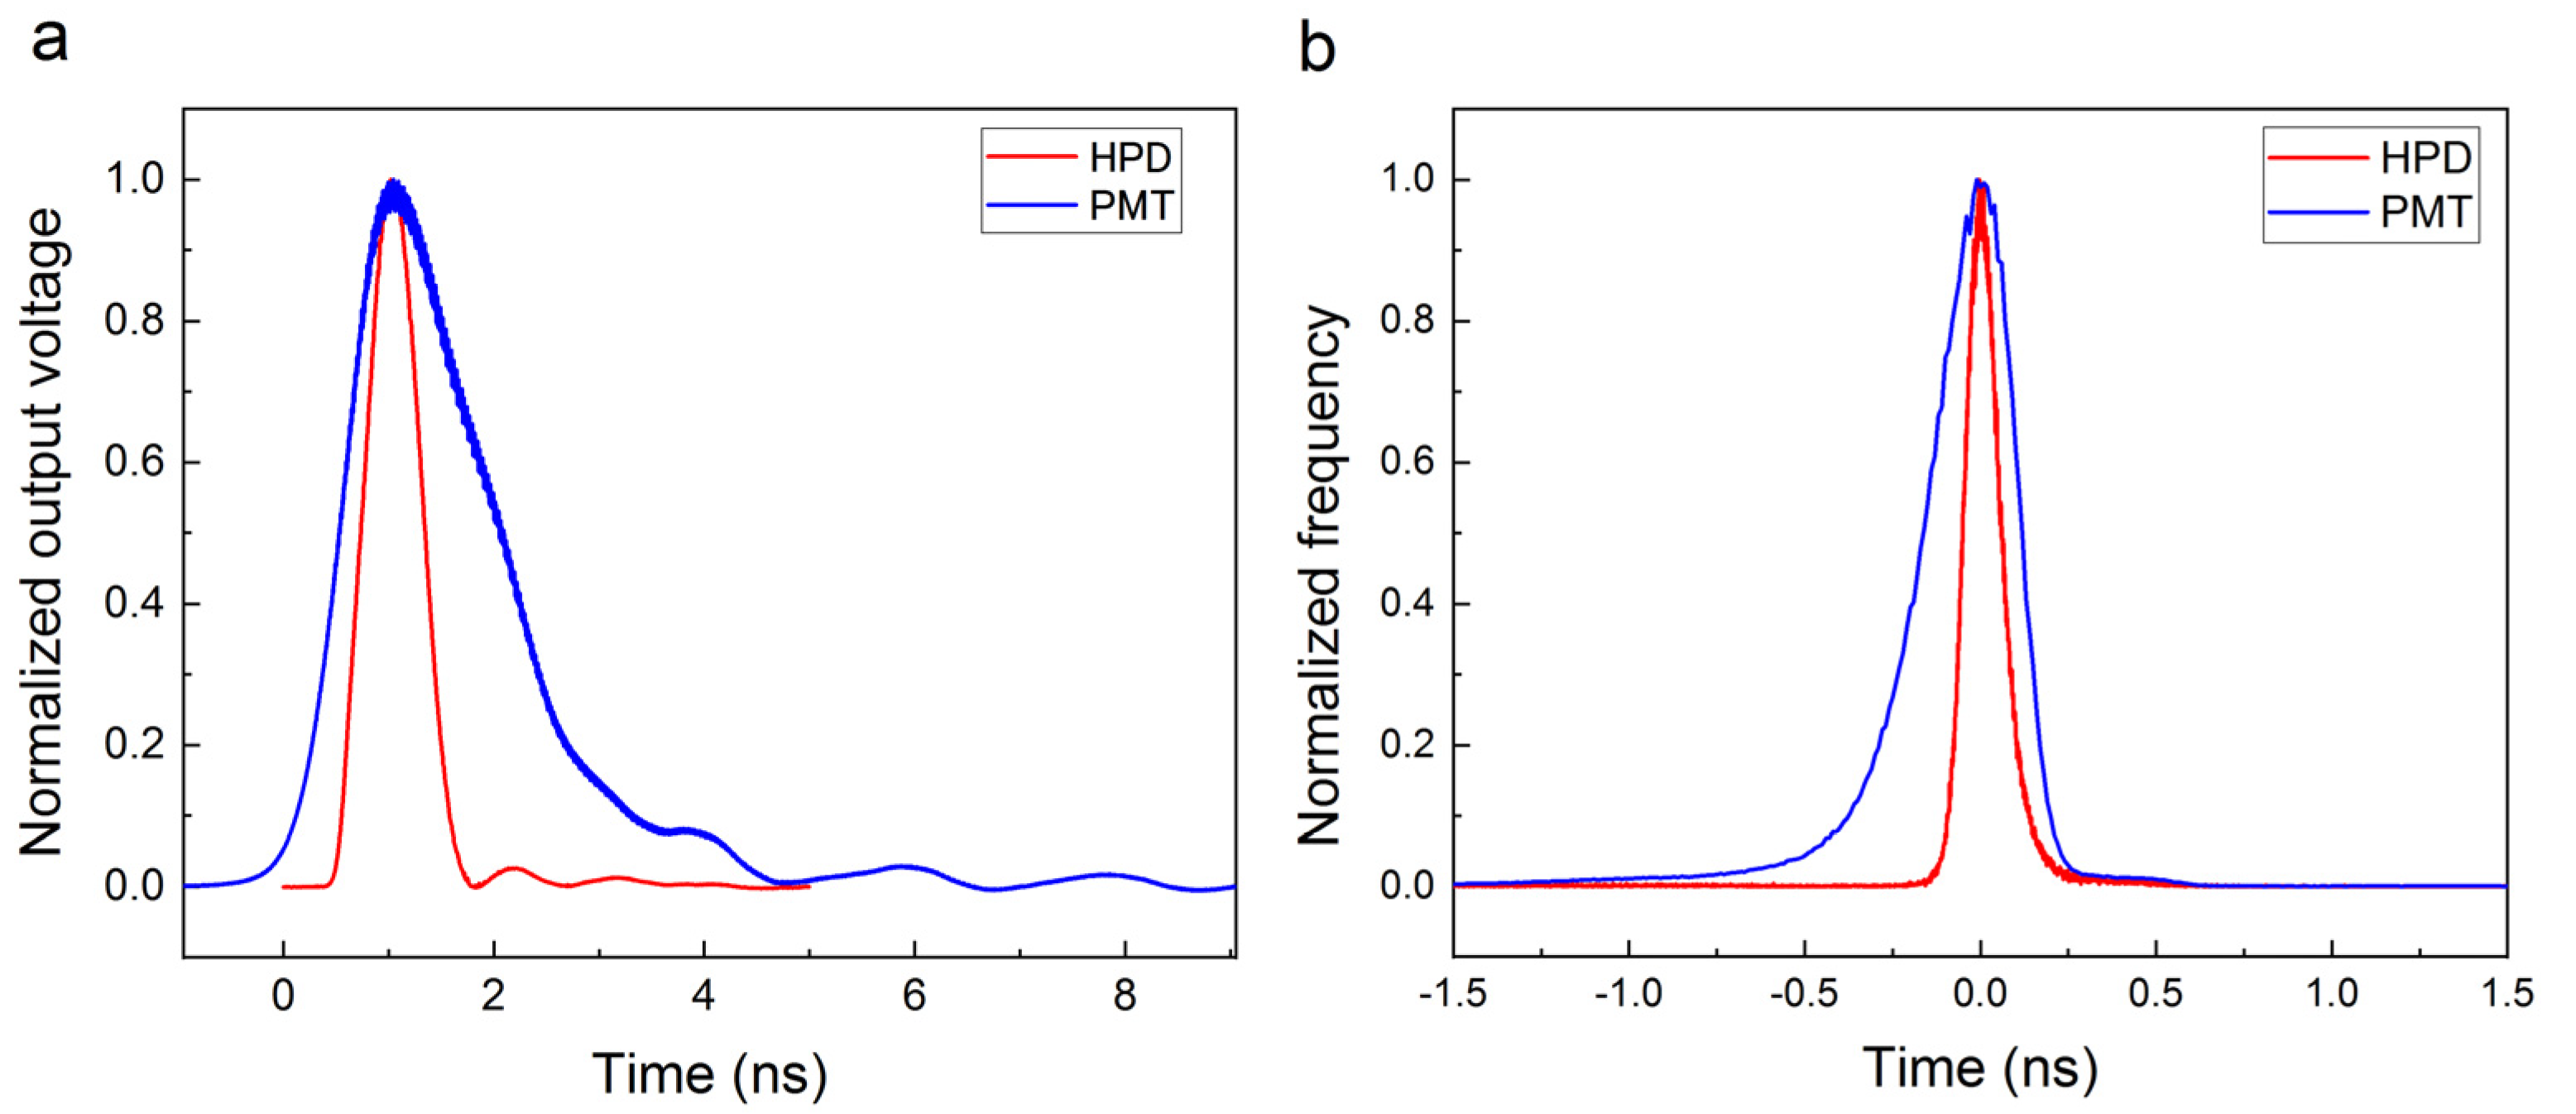
High Timing Resolution
Large Active Area
3.4.2. HPD and Fluorescence Microscopy
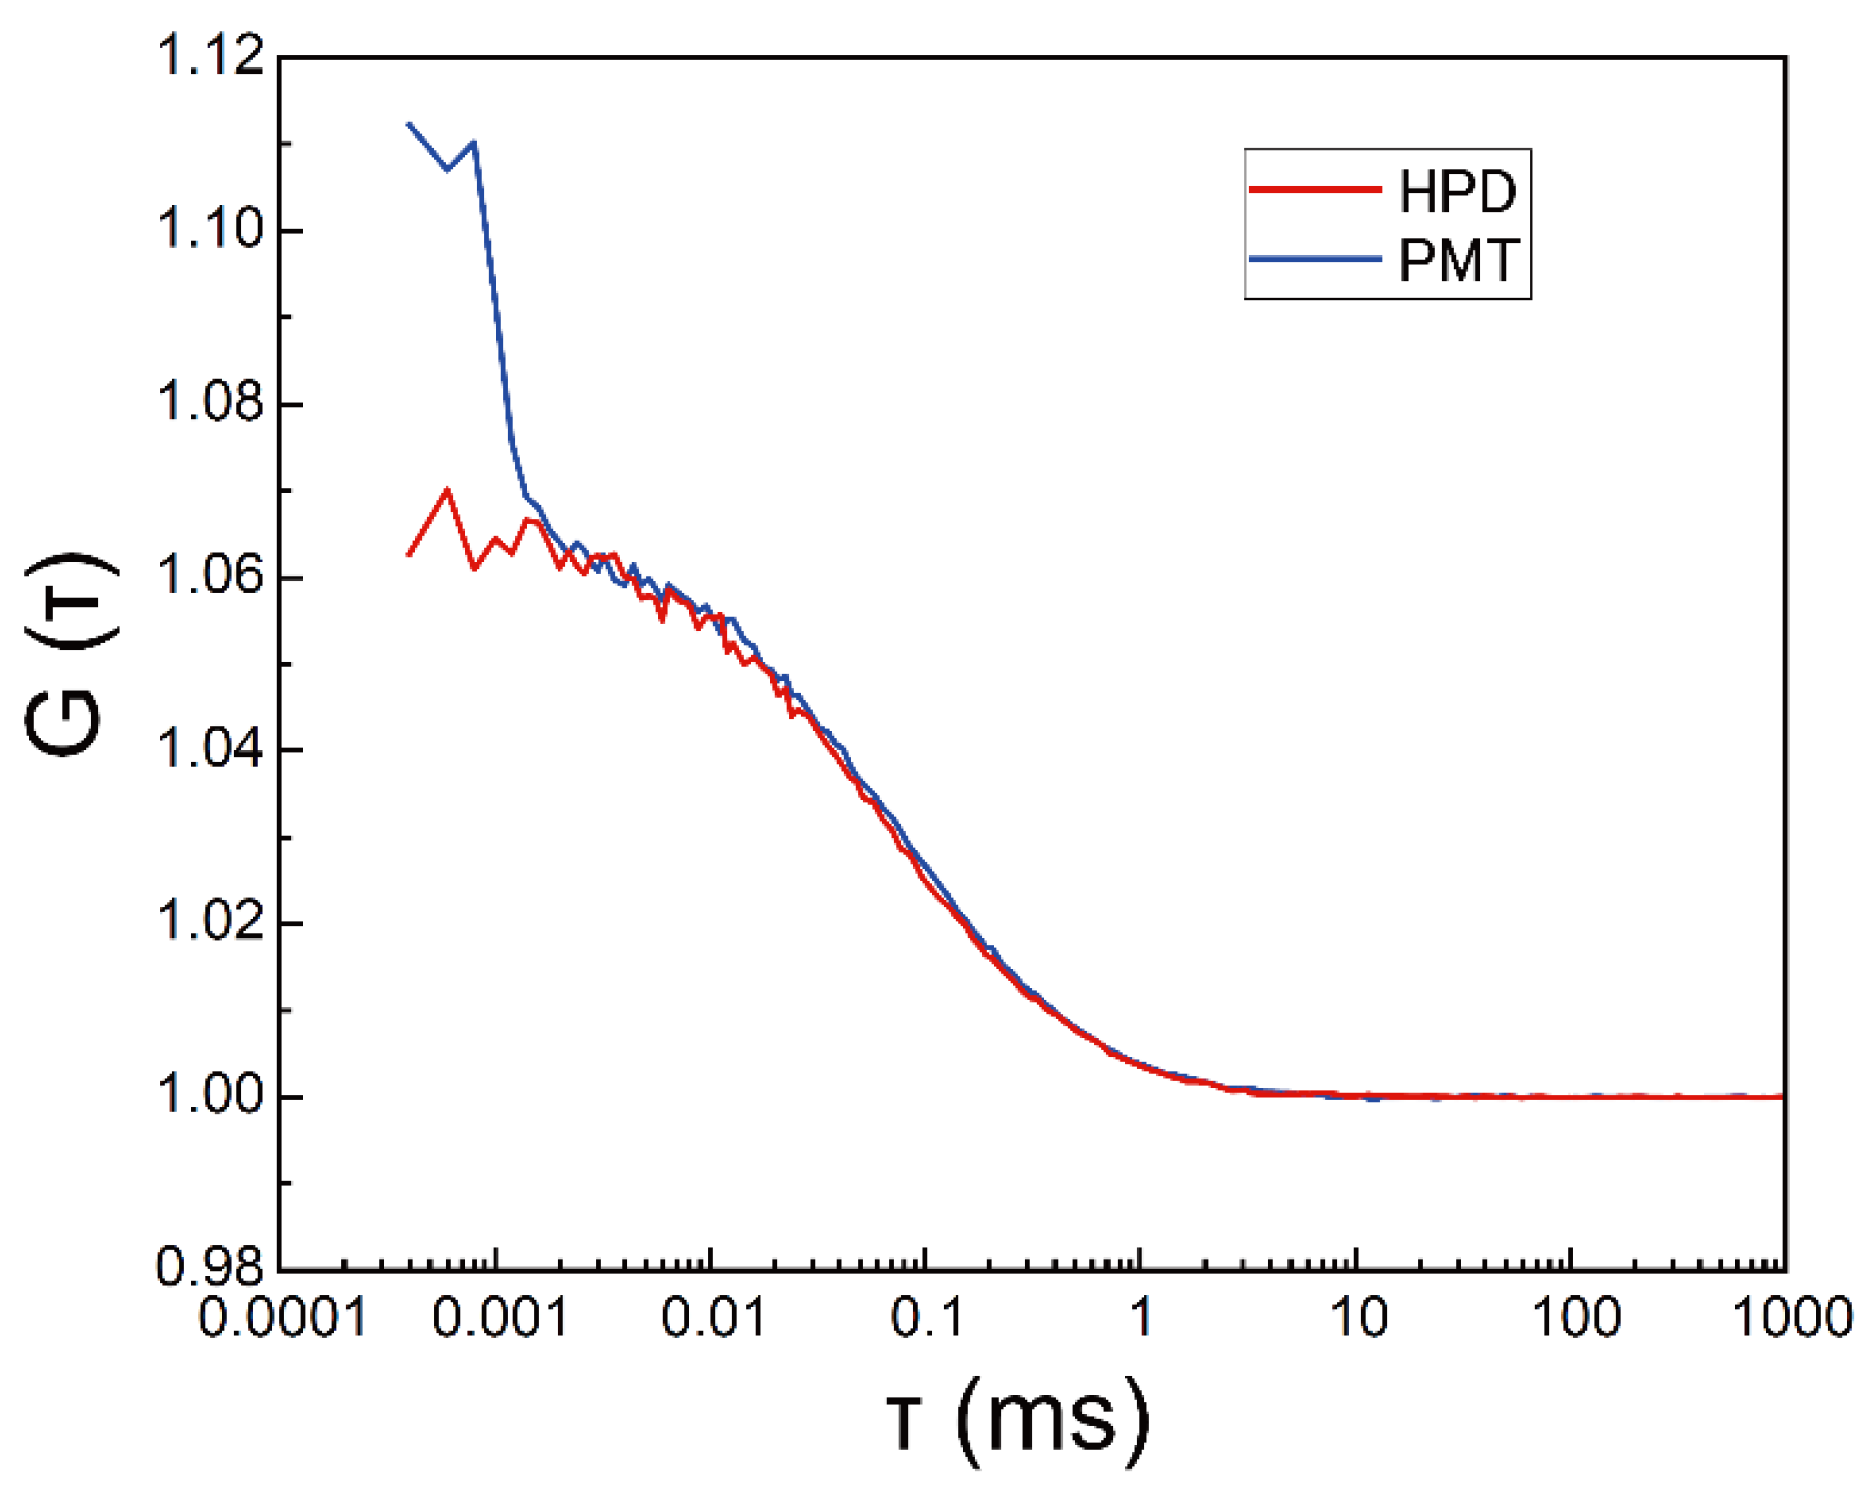
FCS
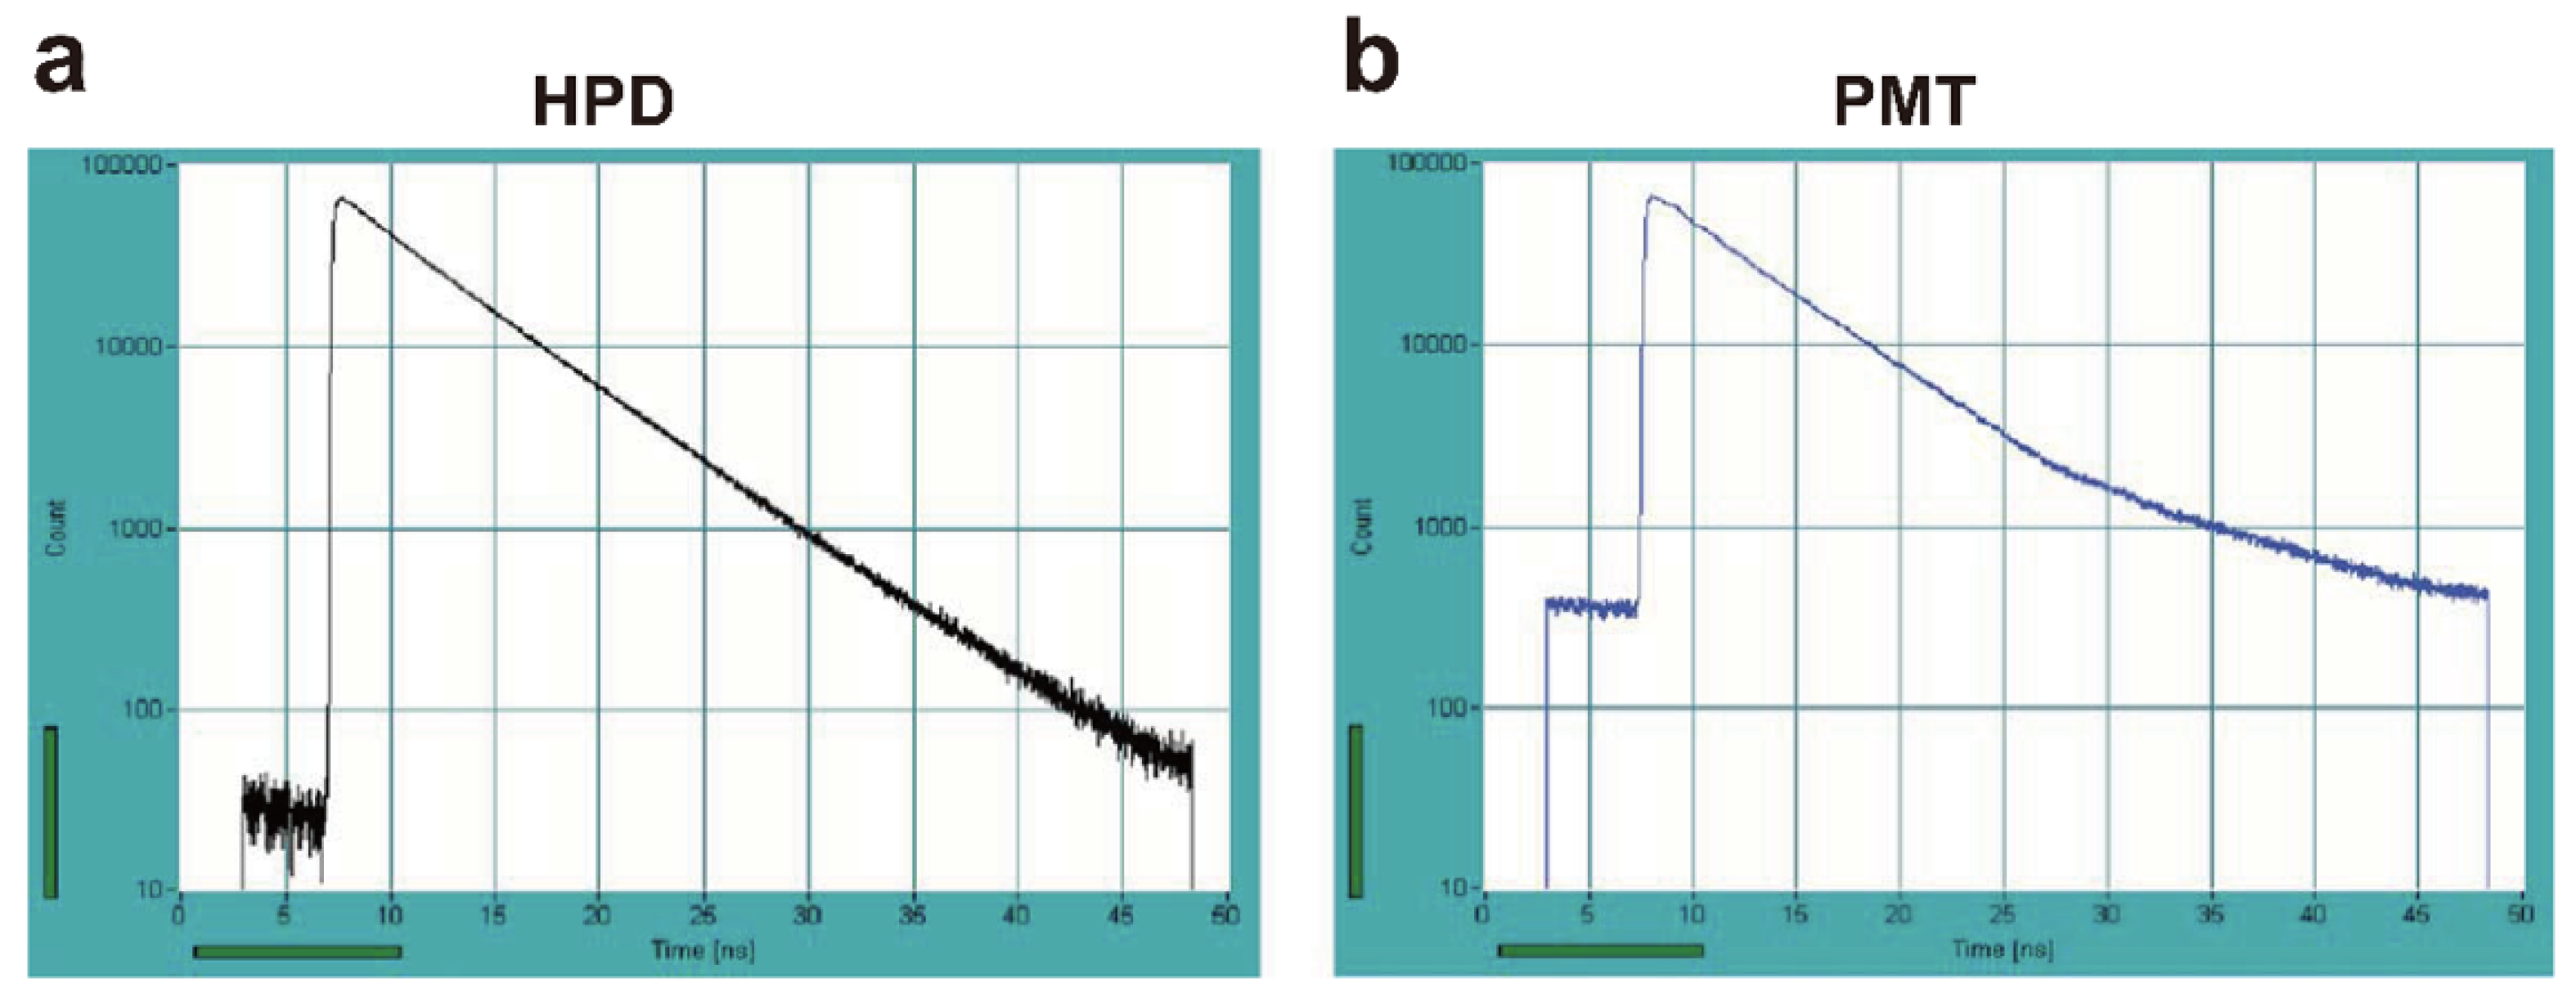
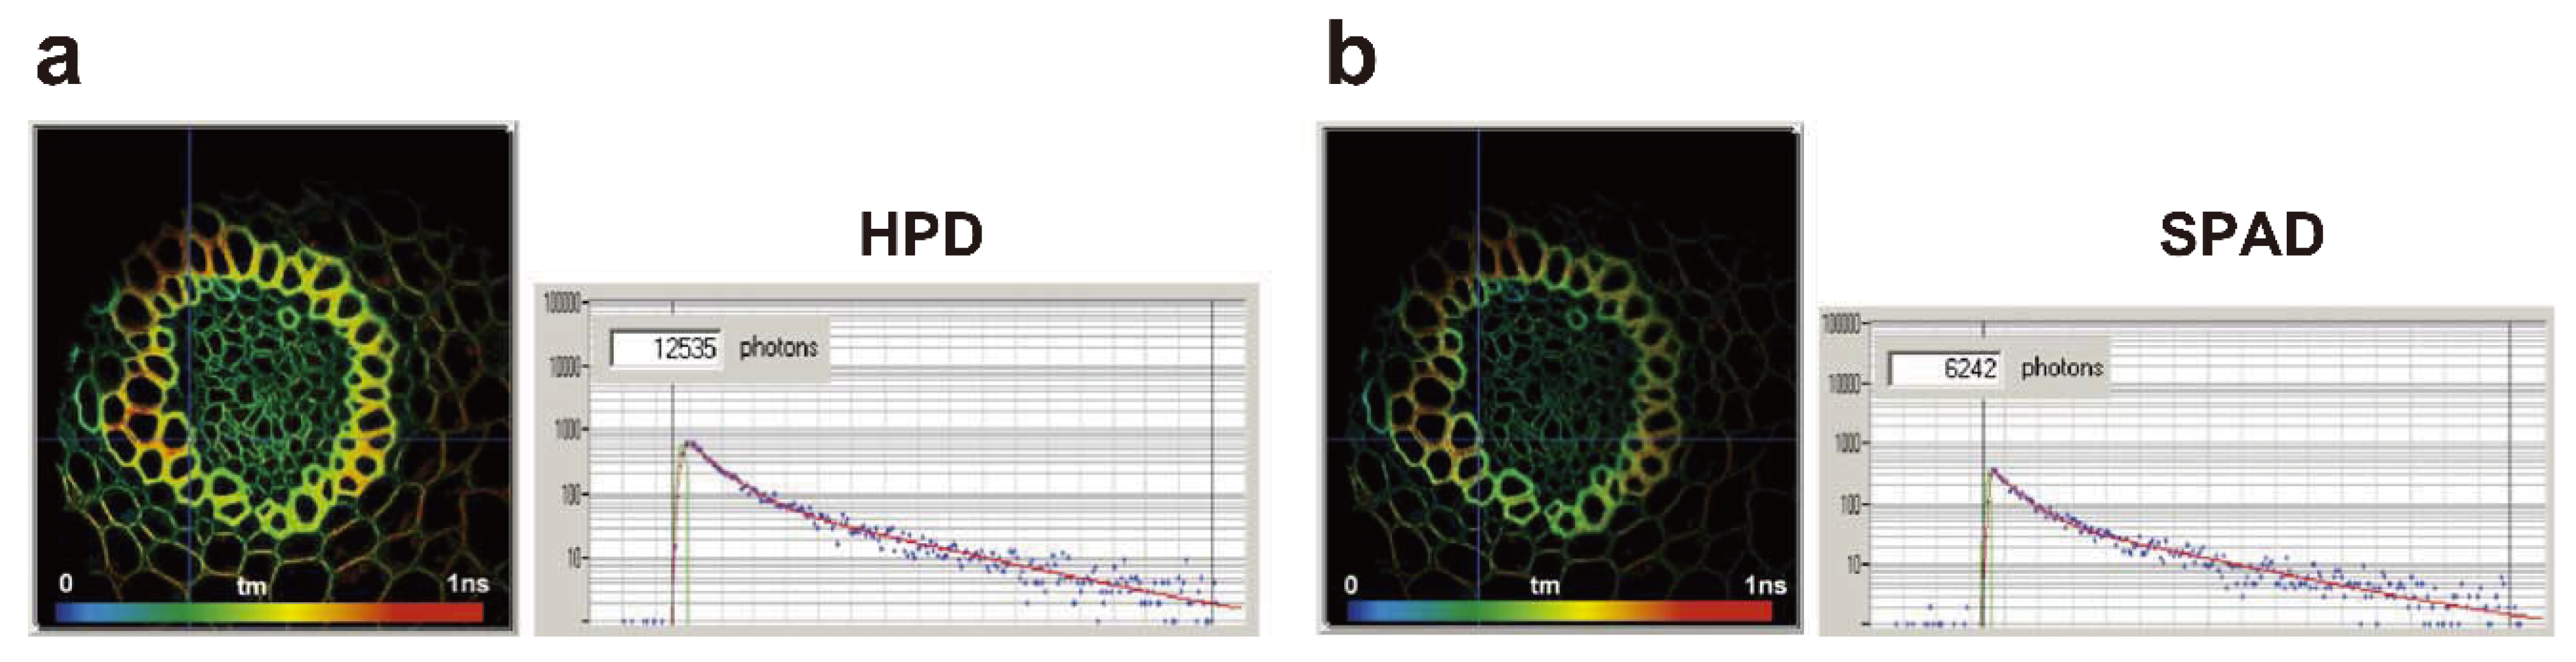
FLIM
3.4.3. Other Types of HPDs
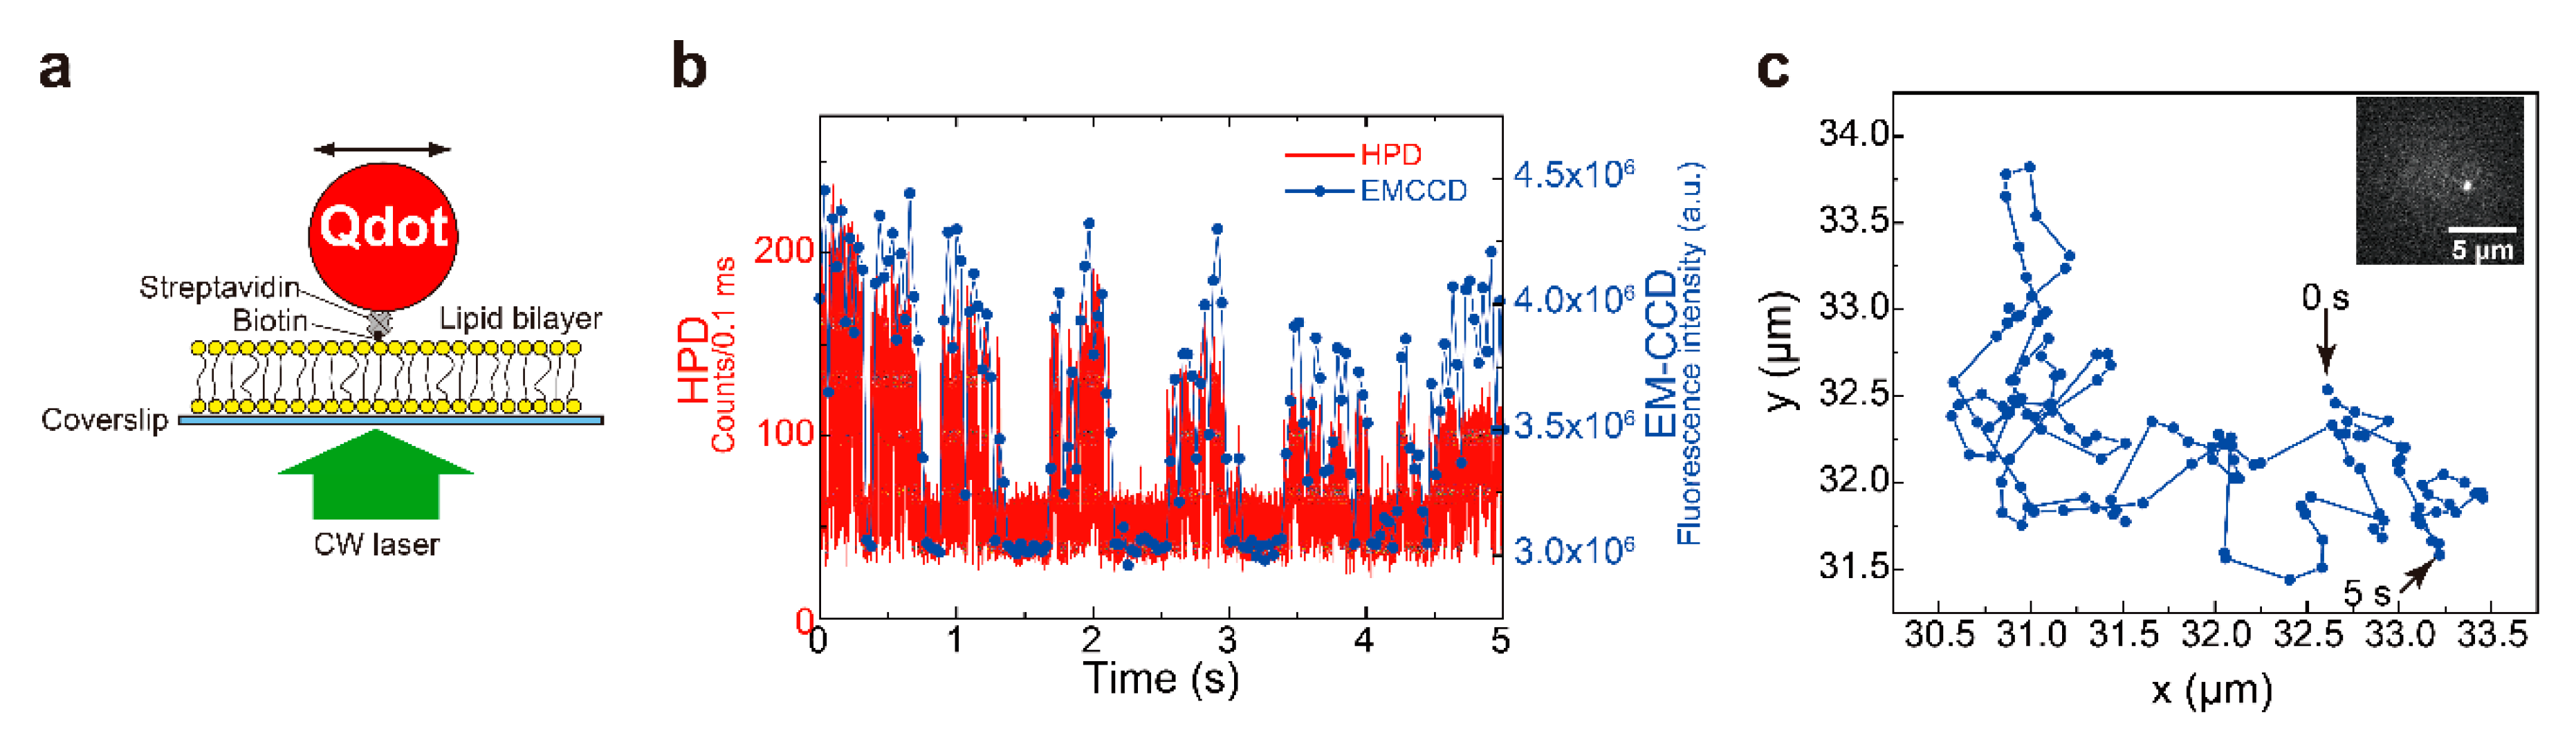
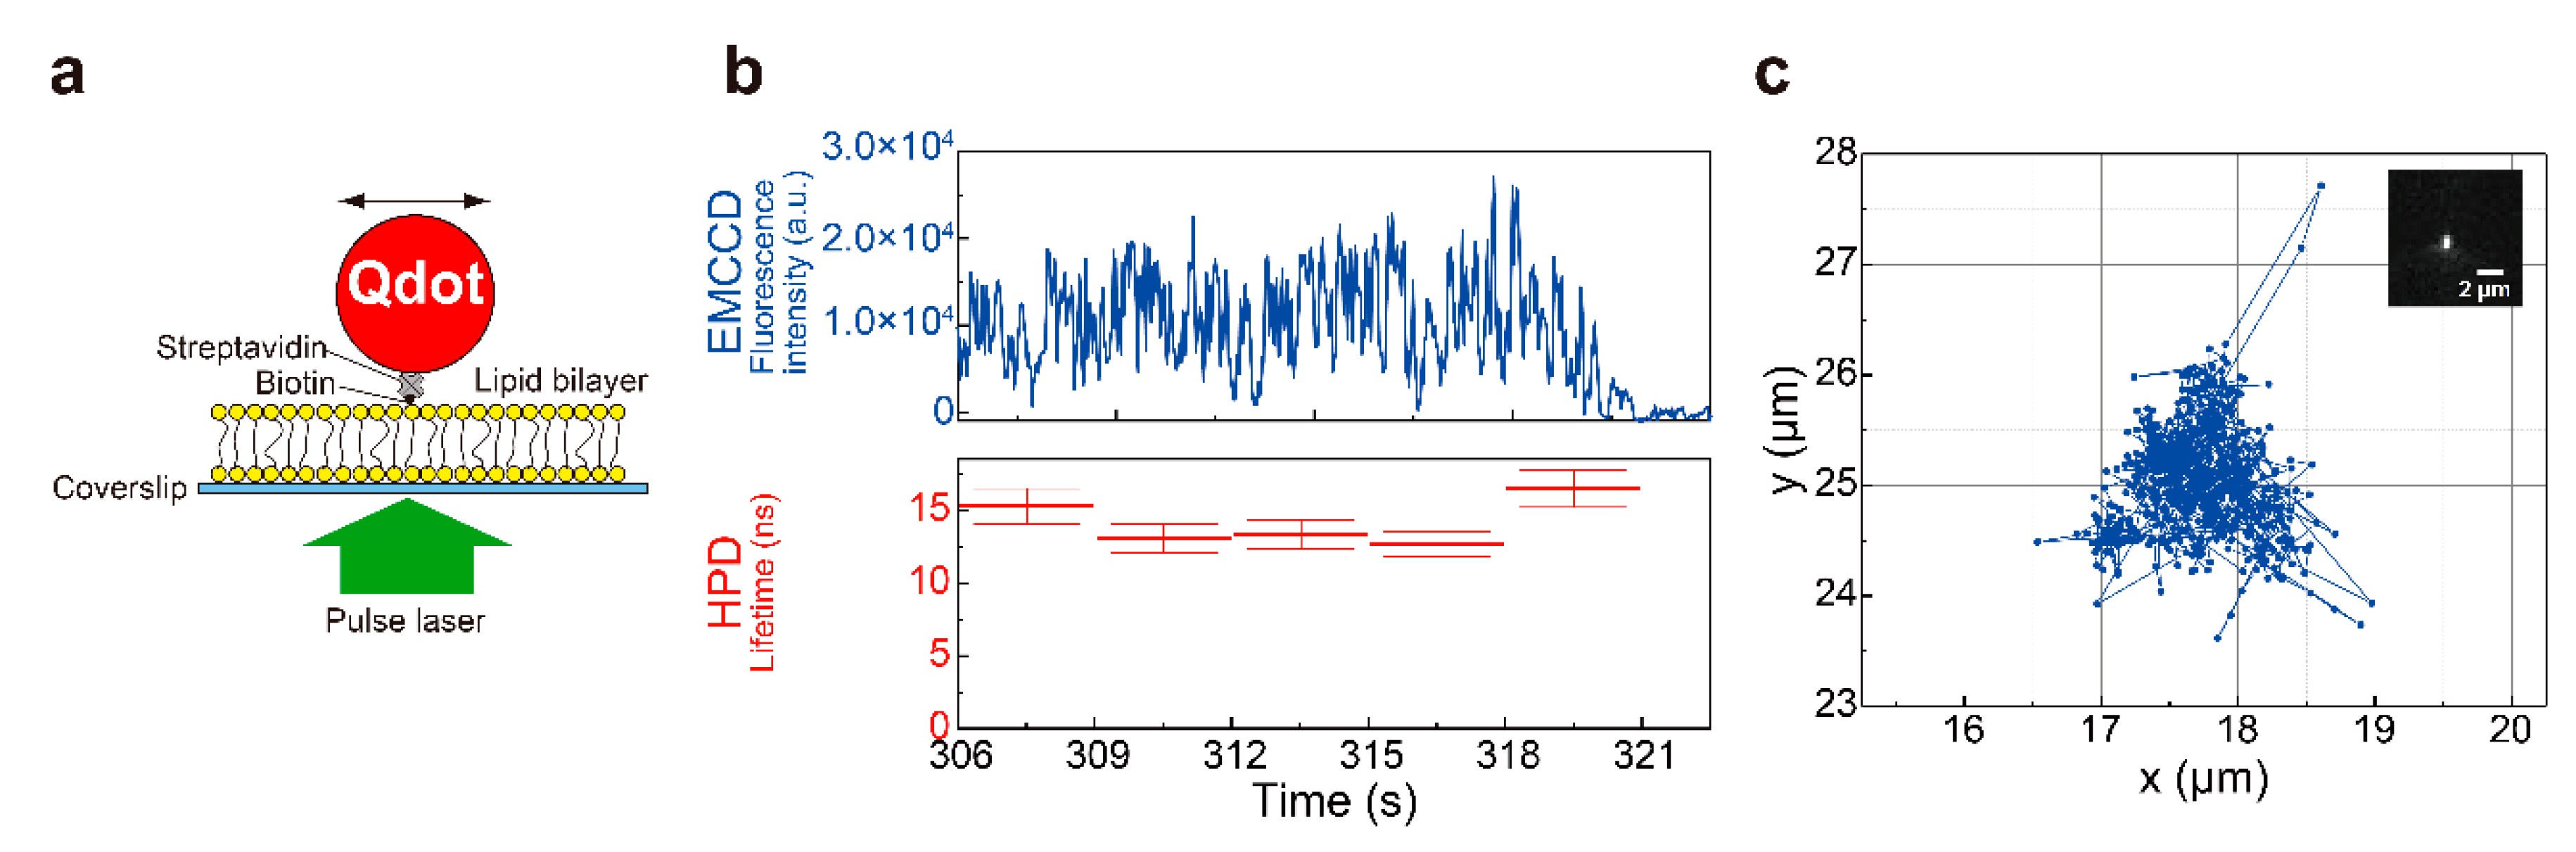
3.4.4. Application of HPDs to Single-Molecule Fluorescence Microscopy
4. Emerging Point Detectors
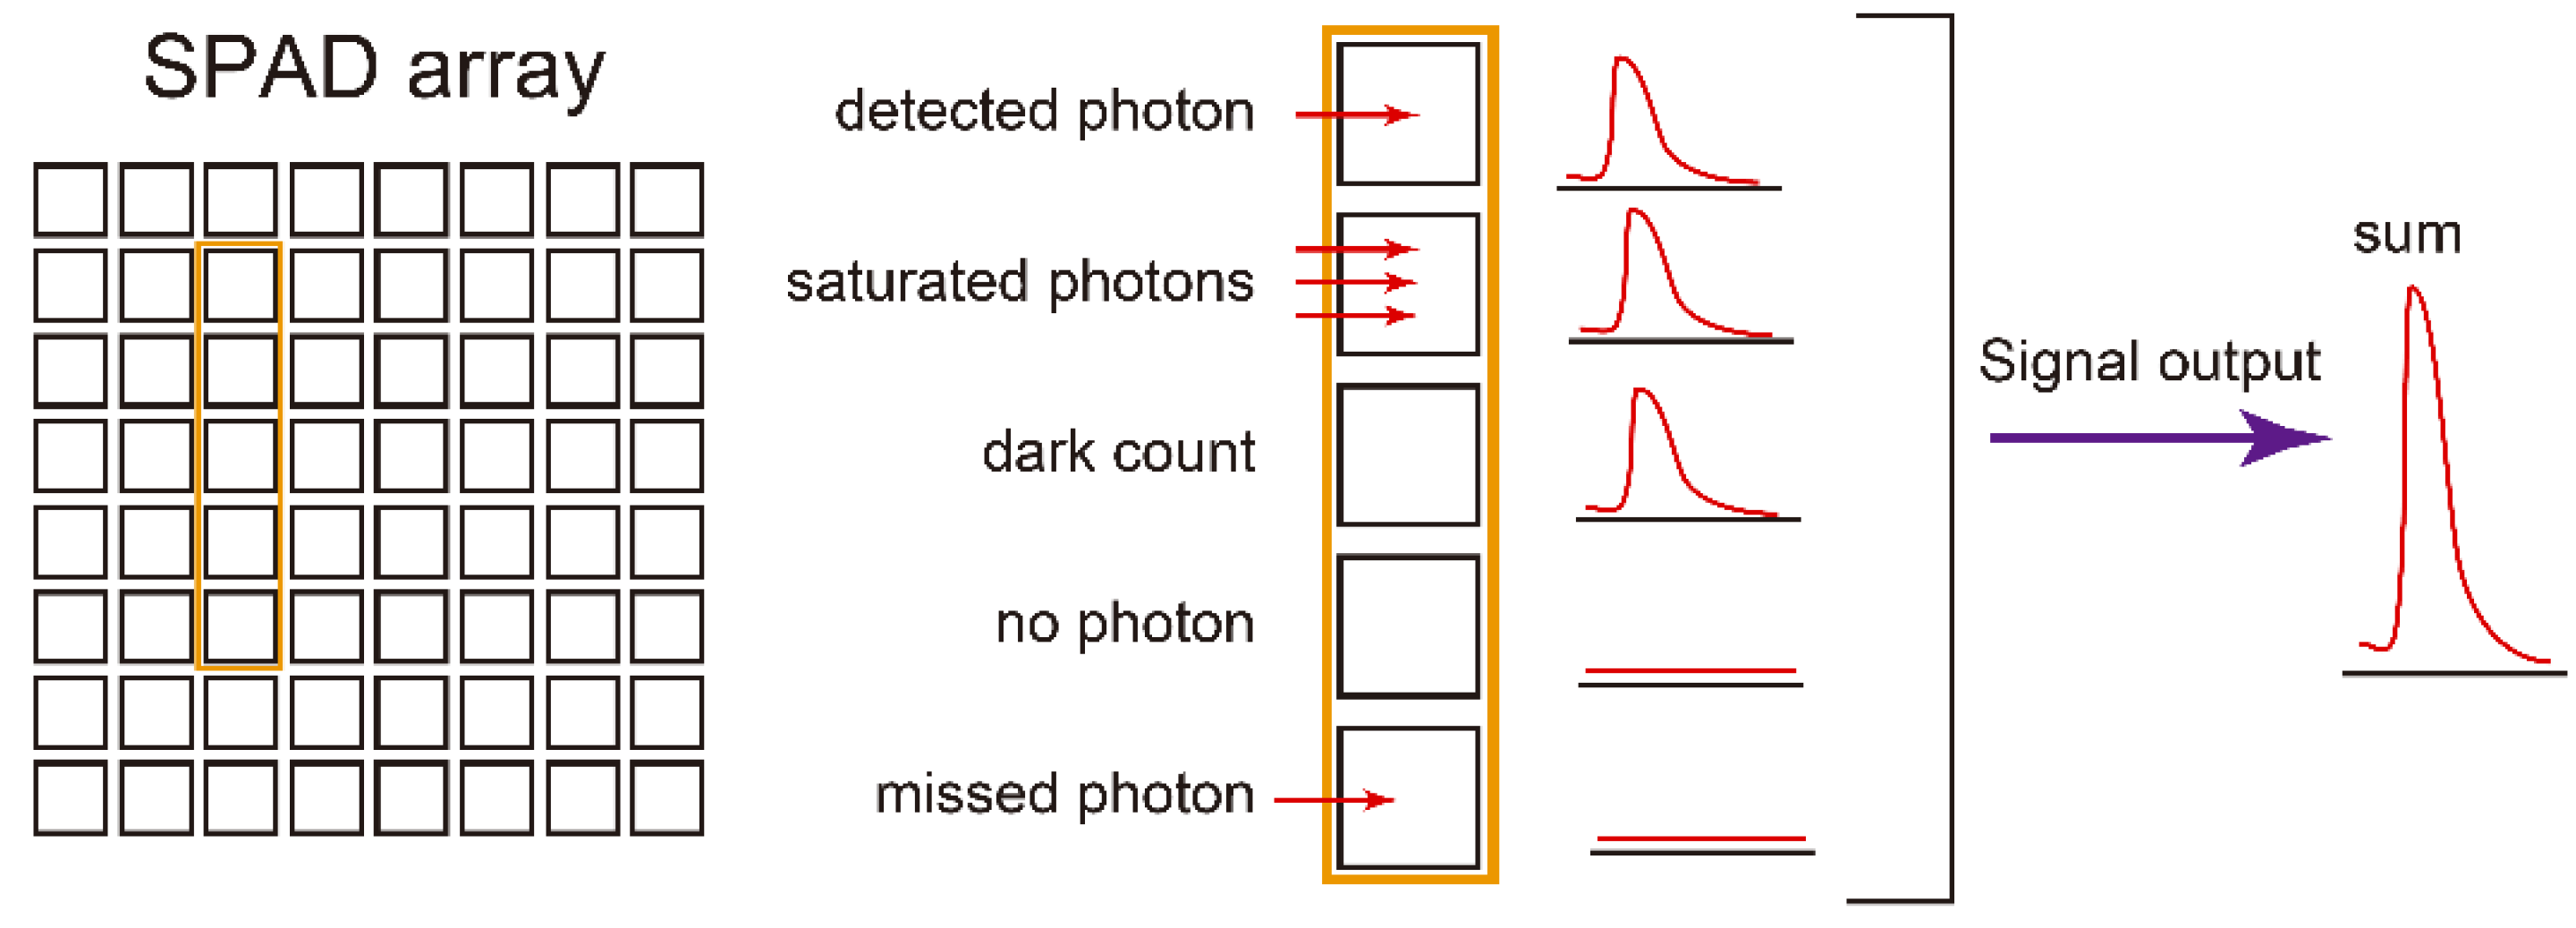
4.1. Silicon Photomultiplier (SiPM)
4.2. SSPD
5. Summary and Outlook
Author Contributions
Funding
Data Availability Statement
Acknowledgments
Conflicts of Interest
Abbreviations
| AD | avalanche diode |
| APD | avalanche photodiode |
| CW | continuous wave |
| DOPC | 1,2-dioleoyl-sn-glycero-3-phosphocholine |
| EMCCD | electron-multiplying charge-coupled device |
| FCS | fluorescence correlation spectroscopy |
| FLIM | fluorescence lifetime imaging microscopy |
| FRET | fluorescence resonance energy transfer |
| FWHM | full-width half-maximum |
| GFP | green fluorescent protein |
| HPD | hybrid photodetector |
| LSM | laser scanning microscopy |
| MPPC | multi-pixel photon counter |
| PCR | polymerase chain reaction |
| PE | phosphoethanolamine |
| PET | positron emission tomography |
| PMT | photomultiplier tube |
| Qdot | quantum dot |
| sCMOS | scientific complementary metal-oxide-semiconductor |
| SiPM | silicon photomultiplier |
| SPAD | single photon avalanche diode |
| SSPD | superconducting nanowire single photon detector |
| TCSPC | time-correlated single photon counting |
| TTS | transit time spread |
References
- Lichtman, J.W.; Conchello, J.A. Fluorescence microscopy. Nat. Methods 2005, 2, 910–919. [Google Scholar] [CrossRef] [PubMed]
- Petty, H.R. Fluorescence microscopy: Established and emerging methods, experimental strategies, and applications in immunology. Microsc. Res. Tech. 2007, 70, 687–709. [Google Scholar] [CrossRef] [PubMed]
- Sanderson, M.J.; Smith, I.; Parker, I.; Bootman, M.D. Fluorescence microscopy. Cold Spring Harb. Protoc. 2014, 2014, pdb top071795. [Google Scholar] [CrossRef]
- Moerner, W.E.; Fromm, D.P. Methods of single-molecule fluorescence spectroscopy and microscopy. Rev. Sci. Instrum. 2003, 74, 3597–3619. [Google Scholar] [CrossRef]
- Michalet, X.; Siegmund, O.H.; Vallerga, J.V.; Jelinsky, P.; Millaud, J.E.; Weiss, S. Detectors for single-molecule fluorescence imaging and spectroscopy. J. Mod. Opt. 2007, 54, 239. [Google Scholar] [CrossRef] [PubMed]
- Shashkova, S.; Leake, M.C. Single-molecule fluorescence microscopy review: Shedding new light on old problems. Biosci. Rep. 2017, 37, BSR20170031. [Google Scholar] [CrossRef]
- Yokota, H. Fluorescence microscopy for visualizing single-molecule protein dynamics. Biochim. Biophys. Acta Gen. Subj. 2020, 1864, 129362. [Google Scholar] [CrossRef] [PubMed]
- Betzig, E.; Patterson, G.H.; Sougrat, R.; Lindwasser, O.W.; Olenych, S.; Bonifacino, J.S.; Davidson, M.W.; Lippincott-Schwartz, J.; Hess, H.F. Imaging intracellular fluorescent proteins at nanometer resolution. Science 2006, 313, 1642–1645. [Google Scholar] [CrossRef]
- Huang, B.; Wang, W.; Bates, M.; Zhuang, X. Three-dimensional super-resolution imaging by stochastic optical reconstruction microscopy. Science 2008, 319, 810–813. [Google Scholar] [CrossRef]
- Bertocchi, C.; Goh, W.I.; Zhang, Z.; Kanchanawong, P. Nanoscale Imaging by Superresolution Fluorescence Microscopy and Its Emerging Applications in Biomedical Research. Crit. Rev. Biomed. Eng. 2013, 41, 281–308. [Google Scholar] [CrossRef]
- Michalet, X.; Colyer, R.A.; Scalia, G.; Ingargiola, A.; Lin, R.; Millaud, J.E.; Weiss, S.; Siegmund, O.H.W.; Tremsin, A.S.; Vallerga, J.V.; et al. Development of new photon-counting detectors for single-molecule fluorescence microscopy. Philos. Trans. R. Soc. B Biol. Sci. 2013, 368, 20120035. [Google Scholar] [CrossRef] [PubMed]
- Lakowicz, J.R. Principles of Fluorescence Spectroscopy, 3rd ed.; Springer: Berlin/Heidelberg, Germany, 2006. [Google Scholar]
- Becker, W.; Su, B.; Holub, O.; Weisshart, K. FLIM and FCS detection in laser-scanning microscopes: Increased efficiency by GaAsP hybrid detectors. Microsc. Res. Tech. 2011, 74, 804–811. [Google Scholar] [CrossRef]
- Michalet, X.; Pinaud, F.F.; Bentolila, L.A.; Tsay, J.M.; Doose, S.; Li, J.J.; Sundaresan, G.; Wu, A.M.; Gambhir, S.S.; Weiss, S. Quantum dots for live cells, in vivo imaging, and diagnostics. Science 2005, 307, 538–544. [Google Scholar] [CrossRef]
- Resch-Genger, U.; Grabolle, M.; Cavaliere-Jaricot, S.; Nitschke, R.; Nann, T. Quantum dots versus organic dyes as fluorescent labels. Nat. Methods 2008, 5, 763–775. [Google Scholar] [CrossRef] [PubMed]
- Kairdolf, B.A.; Smith, A.M.; Stokes, T.H.; Wang, M.D.; Young, A.N.; Nie, S. Semiconductor quantum dots for bioimaging and biodiagnostic applications. Annu. Rev. Anal. Chem. 2013, 6, 143–162. [Google Scholar] [CrossRef] [PubMed]
- Shaner, N.C.; Steinbach, P.A.; Tsien, R.Y. A guide to choosing fluorescent proteins. Nat. Methods 2005, 2, 905–909. [Google Scholar] [CrossRef] [PubMed]
- Shcherbakova, D.M.; Sengupta, P.; Lippincott-Schwartz, J.; Verkhusha, V.V. Photocontrollable fluorescent proteins for superresolution imaging. Annu. Rev. Biophys. 2014, 43, 303–329. [Google Scholar] [CrossRef]
- Minsky, M. Memoir on inventing the confocal scanning microscope. Scanning 1988, 10, 128–138. [Google Scholar] [CrossRef]
- Denk, W.; Strickler, J.H.; Webb, W.W. Two-photon laser scanning fluorescence microscopy. Science 1990, 248, 73–76. [Google Scholar] [CrossRef]
- Becker, W. Fluorescence lifetime imaging--techniques and applications. J. Microsc. 2012, 247, 119–136. [Google Scholar] [CrossRef]
- Liu, X.; Lin, D.; Becker, W.; Niu, J.; Yu, B.; Liu, L.; Qu, J. Fast fluorescence lifetime imaging techniques: A review on challenge and development. J. Innov. Opt. Heal. Sci. 2019, 12, 1930003. [Google Scholar] [CrossRef]
- Hamamatsu Photonics, K.K. Editorial Committee, Photomultiplier Tubes Basic and Applications, 4th ed.; Hamamatsu Photonics, K.K., Ed.; Electron Tube Division: Iwata-shi, Shizuoka, Japan, 2017. [Google Scholar]
- Natarajan, C.M.; Tanner, M.G.; Hadfield, R.H. Superconducting nanowire single-photon detectors: Physics and applications. Supercond. Sci. Technol. 2012, 25, 063001. [Google Scholar] [CrossRef]
- Yamashita, T.; Miki, S.; Terai, H. Recent Progress and Application of Superconducting Nanowire Single-Photon Detectors. IEICE Trans. Electron. 2017, 100, 274–282. [Google Scholar] [CrossRef]
- Michalet, X.; Cheng, A.; Antelman, J.; Suyama, M.; Arisaka, K.; Weiss, S. Hybrid photodetector for single-molecule spectroscopy and microscopy. Proc. Soc. Photo. Opt. Instrum. Eng. 2008, 6862. [Google Scholar] [CrossRef]
- Eisaman, M.D.; Fan, J.; Migdall, A.; Polyakov, S.V. Invited Review Article: Single-photon sources and detectors. Rev. Sci. Instrum. 2011, 82, 071101. [Google Scholar] [CrossRef]
- Suyama, M.; Kawai, Y.; Kimura, S.; Asakura, N.; Hirano, K.; Hasegawa, Y.; Saito, T.; Morita, T.; Muramatsu, M.; Yamamoto, K. A compact hybrid photodetector (HPD). IEEE Trans. Nucl. Sci. 1997, 44, 985. [Google Scholar] [CrossRef]
- Suyama, M.; Hirano, K.; Kawai, Y.; Nagai, T.; Kibune, A.; Saito, T.; Negi, Y.; Asakura, N.; Muramatsu, S.; Morita, T. A hybrid photodetector (HPD) with a III-V photocathode. IEEE Trans. Nucl. Sci. 1998, 45, 572. [Google Scholar] [CrossRef]
- Fukasawa, A.; Haba, J.; Kageyama, A.; Nakazawa, H.; Suyama, M. High Speed HPD for Photon Counting. In Proceedings of the 2006 IEEE Nuclear Science Symposium and Medical Imaging Conference, San Diego, CA, USA, 29 October–1 November 2006; Volume 1, pp. 43–47. [Google Scholar]
- Fukasawa, A.; Haba, J.; Kageyama, A.; Nakazawa, H.; Suyama, M. High Speed HPD for Photon Counting. IEEE Trans. Nucl. Sci. 2008, 55, 758–762. [Google Scholar] [CrossRef]
- Fukasawa, A. Development and Promotion of Hybrid Photodetectors (HPDs) Used in Biological Fluorescence Microscopes. Doctoral Thesis, The Graduate School for the Creation of New Photonics Industries, Hamamatsu-shi, Shizuoka, Japan, 2016. [Google Scholar]
- Barbarino, G.; Barbato, F.C.T.; Campajola, L.; Canfora, F.; de Asmundis, R.; De Rosa, G.; Di Capua, F.; Fiorillo, G.; Migliozzi, P.; Mollo, C.M.; et al. A new generation photodetector for astroparticle physics: The VSiPMT. Astropar. Phys. 2015, 67, 18–25. [Google Scholar] [CrossRef][Green Version]
- Barbato, F.C.T.; Barbarino, G.; Campajola, L.; Di Capua, F.; Mollo, C.M.; Valentini, A.; Vivolo, D. R&D of a pioneering system for a high resolution photodetector: The VSiPMT. Nucl. Instrum. Methods Phys. Res. A 2017, 876, 48–49. [Google Scholar]
- Fukasawa, A.; Hotta, Y.; Ishizu, T.; Negi, Y.; Nakano, G.; Ichikawa, S.; Nagasawa, T.; Egawa, Y.; Kageyama, A.; Adachi, I.; et al. Development of a new 2-inch hybrid photo-detector using MPPC. Nucl. Instrum. Methods Phys. Res. A 2018, 912, 290–293. [Google Scholar] [CrossRef]
- Oikawa, H.; Takahashi, T.; Kamonprasertsuk, S.; Takahashi, S. Microsecond resolved single-molecule FRET time series measurements based on the line confocal optical system combined with hybrid photodetectors. Phys. Chem. Chem. Phys. 2018, 20, 3277–3285. [Google Scholar] [CrossRef]
- Caccia, M.; Nardo, L.; Santoro, R.; Schaffhauser, D. Silicon Photomultipliers and SPAD imagers in biophotonics: Advances and perspectives. Nucl. Instr. Meth. A 2019, 926, 101–117. [Google Scholar] [CrossRef]
- Modi, M.N.; Daie, K.; Turner, G.C.; Podgorski, K. Two-photon imaging with silicon photomultipliers. Opt. Express 2019, 27, 35830–35841. [Google Scholar] [CrossRef] [PubMed]
- Giacomelli, M. Evaluation of silicon photomultipliers for multiphoton and laser scanning microscopy. J. Biomed. Opt. 2019, 24, 106503. [Google Scholar] [CrossRef]
- Hadfield, R.H. Single-photon detectors for optical quantum information applications. Nat. Photon. 2009, 3, 696–705. [Google Scholar] [CrossRef]
- Korzh, B.; Zhao, Q.-Y.; Allmaras, J.P.; Frasca, S.; Autry, T.M.; Bersin, E.A.; Beyer, A.D.; Briggs, R.M.; Bumble, B.; Colangelo, M.; et al. Demonstration of sub-3 ps temporal resolution with a superconducting nanowire single-photon detector. Nat. Photon. 2020, 14, 250–255. [Google Scholar] [CrossRef]
- Allmaras, J.P.; Wollman, E.E.; Beyer, A.D.; Briggs, R.M.; Korzh, B.A.; Bumble, B.; Shaw, M.D. Demonstration of a Thermally Coupled Row-Column SNSPD Imaging Array. Nano Lett. 2020, 20, 2163–2168. [Google Scholar] [CrossRef]
- Yamashita, T.; Liu, D.; Miki, S.; Yamamoto, J.; Haraguchi, T.; Kinjo, M.; Hiraoka, Y.; Wang, Z.; Terai, H. Fluorescence correlation spectroscopy with visible-wavelength superconducting nanowire single-photon detector. Opt. Express 2014, 22, 28783–28789. [Google Scholar] [CrossRef] [PubMed]
- Yamamoto, J.; Oura, M.; Yamashita, T.; Miki, S.; Jin, T.; Haraguchi, T.; Hiraoka, Y.; Terai, H.; Kinjo, M. Rotational diffusion measurements using polarization-dependent fluorescence correlation spectroscopy based on superconducting nanowire single-photon detector. Opt. Express 2015, 23, 32633–32642. [Google Scholar] [CrossRef] [PubMed]
- Yang, W.; Miller, J.E.; Carrillo-Reid, L.; Pnevmatikakis, E.; Paninski, L.; Yuste, R.; Peterka, D.S. Simultaneous Multi-plane Imaging of Neural Circuits. Neuron 2016, 89, 269–284. [Google Scholar] [CrossRef]
- Kazemipour, A.; Novak, O.; Flickinger, D.; Marvin, J.S.; Abdelfattah, A.S.; King, J.; Borden, P.M.; Kim, J.J.; Al-Abdullatif, S.H.; Deal, P.E.; et al. Kilohertz frame-rate two-photon tomography. Nat. Methods 2019, 16, 778–786. [Google Scholar] [CrossRef]
- Colyer, R.; Scalia, G.; Villa, F.; Guerrieri, F.; Tisa, S.; Zappa, F.; Cova, S.; Weiss, S.; Michalet, X. Ultra High-Throughput Single Molecule Spectroscopy with a 1024 Pixel SPAD. Proc. SPIE Int. Soc. Opt. Eng. 2011, 7905, 790503. [Google Scholar]
- Michalet, X.; Ingargiola, A.; Colyer, R.A.; Scalia, G.; Weiss, S.; Maccagnani, P.; Gulinatti, A.; Rech, I.; Ghioni, M. Silicon photon-counting avalanche diodes for single-molecule fluorescence spectroscopy. IEEE J. Sel. Top Quantum Electron. 2014, 20, 38044201–380442020. [Google Scholar] [CrossRef] [PubMed]
- Antolovic, I.M.; Burri, S.; Bruschini, C.; Hoebe, R.A.; Charbon, E. SPAD imagers for super resolution localization microscopy enable analysis of fast fluorophore blinking. Sci. Rep. 2017, 7, 44108. [Google Scholar] [CrossRef]
- Yabuno, M.; Miyajima, S.; Miki, S.; Terai, H. Scalable implementation of a superconducting nanowire single-photon detector array with a superconducting digital signal processor. Opt. Express 2020, 28, 12047–12057. [Google Scholar] [CrossRef] [PubMed]
- Zickus, V.; Wu, M.L.; Morimoto, K.; Kapitany, V.; Fatima, A.; Turpin, A.; Insall, R.; Whitelaw, J.; Machesky, L.; Bruschini, C.; et al. Fluorescence lifetime imaging with a megapixel SPAD camera and neural network lifetime estimation. Sci. Rep. 2020, 10, 20986. [Google Scholar] [CrossRef]
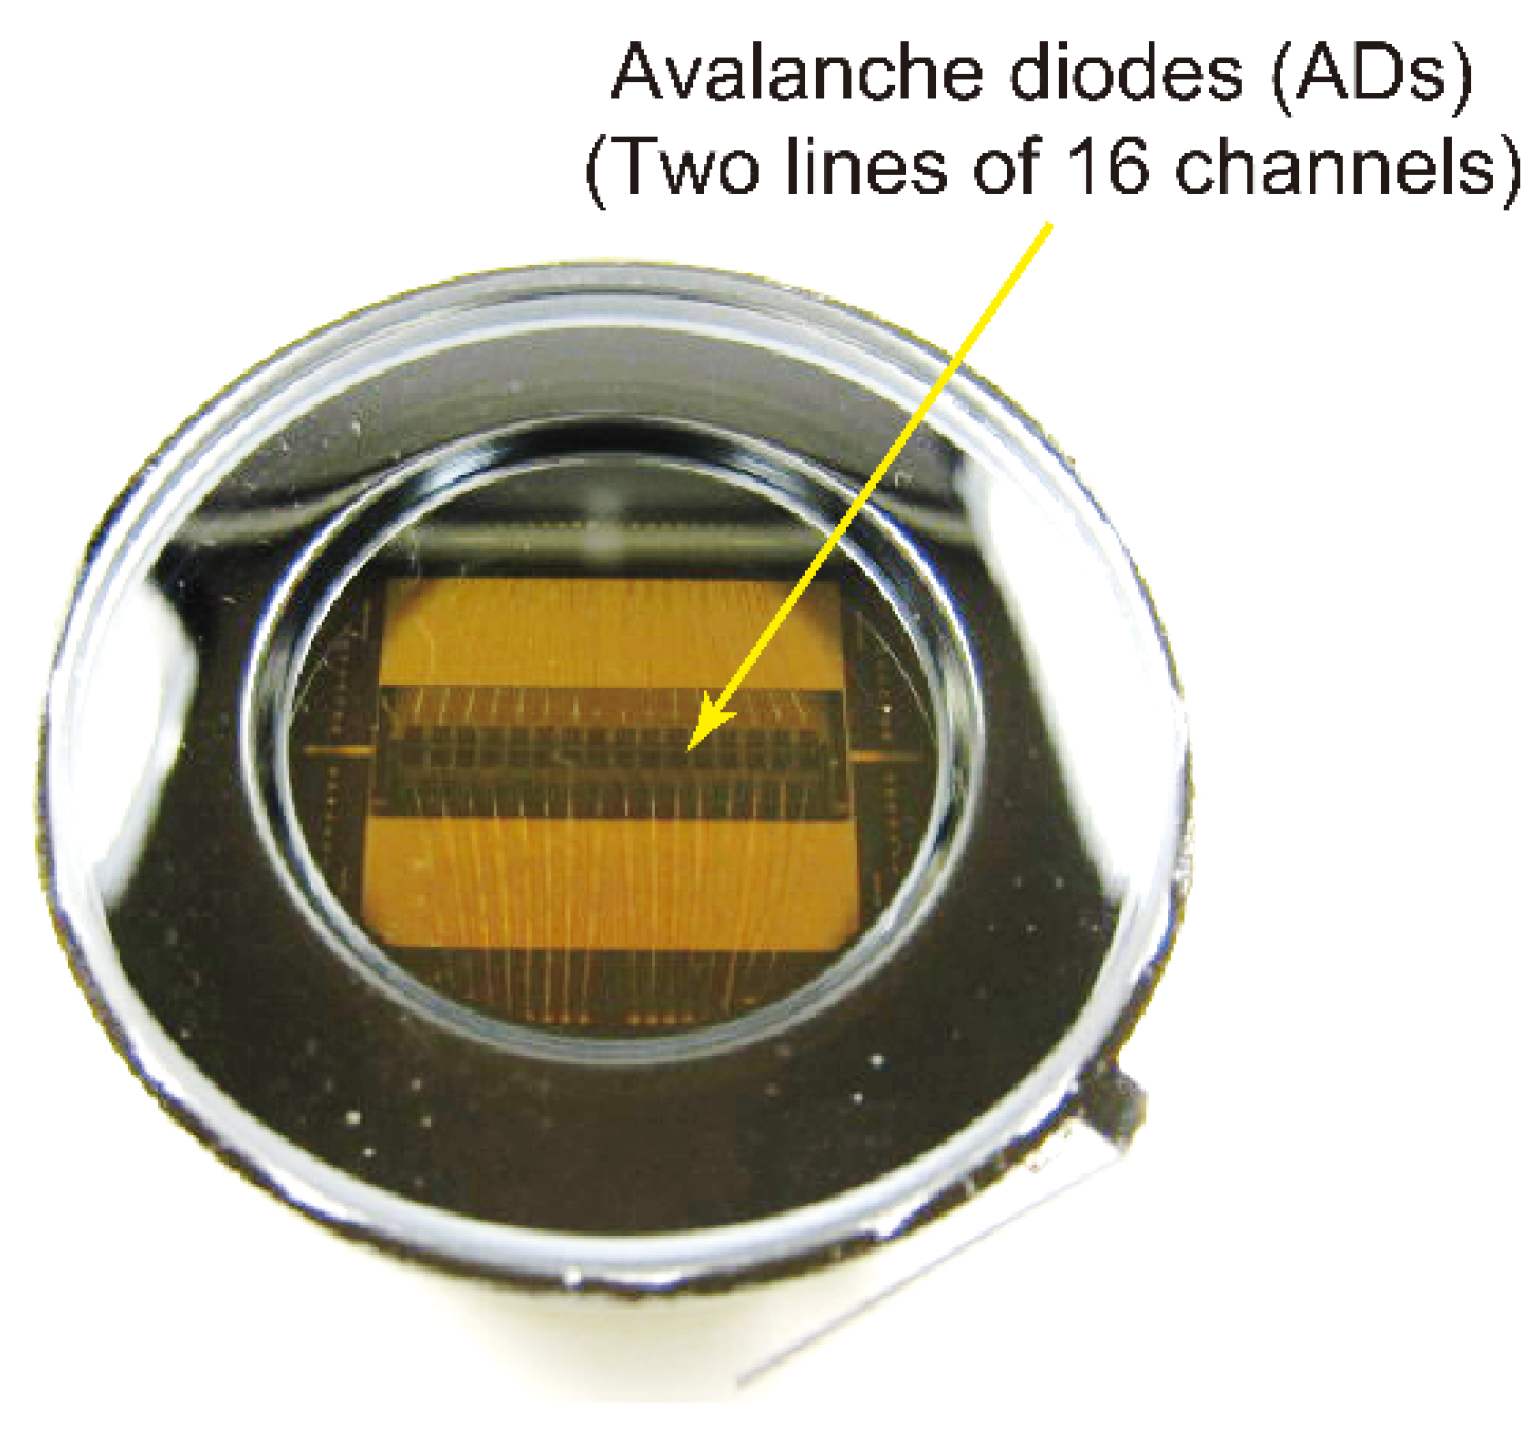
- Fukasawa, A.; Egawa, Y.; Ishizu, T.; Kageyama, A.; Kamiya, A.; Muramatsu, T.; Nakano, G.; Negi, Y. Multichannel HPD for high-speed single photon counting. Nucl. Instrum. Methods Phys. Res. A 2016, 812, 81–85. [Google Scholar] [CrossRef]
- Wollman, E.E.; Verma, V.B.; Lita, A.E.; Farr, W.H.; Shaw, M.D.; Mirin, R.P.; Woo Nam, S. Kilopixel array of superconducting nanowire single-photon detectors. Opt. Express 2019, 27, 35279–35289. [Google Scholar] [CrossRef]


| Fluorophore | Typical Excitation Wavelength (nm) | Emission Wavelength (nm) | Molecular Extinction Coefficient (M−1cm−1) | Quantum Yield | Fluorescence Lifetime (ns) | Resistance to Photoblea-Ching |
|---|---|---|---|---|---|---|
| Cy3 | 532 | 570 | 150,000 (550 nm) | 0.15 | 0.2 | ++ |
| Cy5 | 633 | 670 | 250,000 (649 nm) | 0.28 | 0.9 | ++ |
| Qdot655 | 532, 633 | ~655 | 2,100,000 (532 nm) | 0.44 | ~20 | +++ |
| Green fluorescent protein (GFP) | 488 | 507 | 56,000 (484 nm) | 0.60 | 2.3 | + |
| Photomultiplier Tube (PMT) | Single Photon Avalanche Diode (SPAD) | Hybrid Photodetector (HPD) | |
|---|---|---|---|
| Afterpulse | High | High | Low |
| Transit time spread (TTS) | ~300 ps | ~300 ps | ~100 ps |
| Diameter of active area | ~5 mm | ~several 100 µm | ~5 mm |
| Operating temperature | ~270 K | 210–250 K | Room temperature |
| Type of HPD | Feature | Possible Application |
|---|---|---|
| Photocathode-cooled | Low thermal noise | FCS |
| MPPC (SiPM)-incorporated | Low voltage operation | Easy to install into systems |
Publisher’s Note: MDPI stays neutral with regard to jurisdictional claims in published maps and institutional affiliations. |
© 2021 by the authors. Licensee MDPI, Basel, Switzerland. This article is an open access article distributed under the terms and conditions of the Creative Commons Attribution (CC BY) license (http://creativecommons.org/licenses/by/4.0/).
Share and Cite
Yokota, H.; Fukasawa, A.; Hirano, M.; Ide, T. Low-Light Photodetectors for Fluorescence Microscopy. Appl. Sci. 2021, 11, 2773. https://doi.org/10.3390/app11062773
Yokota H, Fukasawa A, Hirano M, Ide T. Low-Light Photodetectors for Fluorescence Microscopy. Applied Sciences. 2021; 11(6):2773. https://doi.org/10.3390/app11062773
Chicago/Turabian StyleYokota, Hiroaki, Atsuhito Fukasawa, Minako Hirano, and Toru Ide. 2021. "Low-Light Photodetectors for Fluorescence Microscopy" Applied Sciences 11, no. 6: 2773. https://doi.org/10.3390/app11062773
APA StyleYokota, H., Fukasawa, A., Hirano, M., & Ide, T. (2021). Low-Light Photodetectors for Fluorescence Microscopy. Applied Sciences, 11(6), 2773. https://doi.org/10.3390/app11062773