Article

Study on the Variable-Temperature Drying Process of Corn Drying in an Industrial Corn-Drying System Equipped with a Self-Adaptive Control Heat Exchanger

College of Engineering, South China Agricultural University, Guangzhou 510642, China
*
Author to whom correspondence should be addressed.
Appl. Sci. 2021, 11(6), 2772; https://doi.org/10.3390/app11062772
Submission received: 29 January 2021 / Revised: 15 March 2021 / Accepted: 16 March 2021 / Published: 19 March 2021
(This article belongs to the Section Energy Science and Technology)

Abstract

:
To realize energy-saving and efficient industrial grain drying, the present work studied the variable-temperature drying process of corn drying in a novel industrial corn-drying system with a heat recycling and self-adaptive control function. The drying kinetics, thermal performance, heat-loss characteristics and the heat-recycling performance of the drying system under different allocations between flue gas and hot air were investigated, and the optimized drying process was proposed and compared with two constant drying processes. The results showed that the optimized drying process exhibited better drying kinetic and thermal performance than the two constant drying processes. More specifically, the total heat loss, total energy consumption and specific energy consumption of the optimized drying process were ascertained to be 36,132.85 MJ, 48,803.99 MJ and 7290.27 kJ/kg, respectively, which were lower than those of the other two processes. On the other hand, the thermal efficiency of the drying chamber for the optimized drying process was ascertained to be varied within the range of 6.81–41.71%. Overall, the validation results showed that the optimized drying process can significantly improve the drying performance of the drying system.

1. Introduction

Drying plays an important role in post-processing of agricultural products and is a highly energy-intensive operation [1]. According to some open literature [2,3,4], the energy consumed by drying operations accounts for about 10–20% of the national industrial energy consumption every year in some developed countries. With the development of global industries and economics, the steep rise in energy consumption has become one of the common concerns all over the world. In this regard, the development of energy-saving as well as environment-friendly drying technologies has been strongly encouraged around world [5].
In the last few decades, researchers have done a lot of work on grain-drying technologies and processes from a multi-scale (nano [6], micro [7] and macro [8]) perspective. Few works have been focused on industrial-scale grain drying, while industrial grain-drying production is the most effective way to satisfy the steep rise in grain consumption. Moreover, although a number of innovative drying technologies arising from all over the world have been applied in grain-drying production, hot air drying is still one of the most effective methods, owing to its advantages of feasibility, efficiency and being economical [9]. For example, Che Gang et al. introduced an industrial-scale 5HFS-10-type automatic control grain dryer with a drying capacity of 27.35 t/h, drying temperature of hot air of 127 °C and drying cycle of 5.25 h. The results showed that energy consumption was reduced by more than 20% compared with a traditional positive-pressure air-supply dryer [10]. Li Changyou et al. proposed a 5HP-3.5 hot-air circulation dryer with a loading capacity of 31 t; energy performance under a constant drying temperature of 78 °C was investigated, and the results showed that thermal efficiency of the drying chamber varied from 17.14% to 97.83% [11]. Although hot-air drying technology has been widely applied in industrial grain-drying production, few works have focused on the variable temperature of the drying process. Moreover, drying is a typical heat- and mass-transfer process, and during the hot-air drying process, different fluxes (e.g., material flux, flue gas flux, hot air flux) flow throughout the whole system. The match between different fluxes is a key issue for designing the variable temperature of the drying process as well as optimizing the drying system. Accordingly, it is necessary to have a fundamental understanding of the allocation among different fluxes for the purpose of energy-saving and efficient grain drying.
Heat recirculation is one of the most common approaches used to save energy in an energy-consuming system and is also widely used in the agricultural-product drying field. For example, Golman and Julklang focused on waste-heat recovery from the exhaust air of a grain spray dryer. More specifically, during the drying process, the exhaust air was separated from the material flux and further mixed with fresh air in the drying chamber; the experimental results showed that the methodology effectively improved the energy efficiency of the spray dryer [12]. Zhang et al. introduced a grain heat-pump drying system with an outlet air-waste heat-recovery function; the exhaust air was exhausted to the cold-water chamber, and the water was heated up to 30 °C and further used to prepare the hot water (60–80 °C); the results showed that almost 18% of the total energy consumption was recovered [13]. Bai et al. studied waste-heat recovery from a tractor exhaust; their results showed that the recovered energy could be used to dehydrate 3–6% of moisture from wet grains [14]. According to the analysis above, recovery of waste heat from exhaust drying air is an effective way to save energy; however, few works have focused on waste-heat recovery from exhaust flue gas, while there is huge heat-recirculation potential in exhaust flue gas of the heat exchanger.
Far infrared drying is an efficient and energy-saving method which has been widely used in grain drying, owing to its advantages of high drying quality, simple structure and high efficiency. For example, Tuncel et al. conducted an experiment to compare the drying performance between far infrared drying, hot air drying and far infrared-assisted hot air drying; the results showed that the quality of dried corn kernels was significantly affected by far infrared wavelengths when the temperature was 45 °C and that far infrared-assisted hot air drying technology could effectively decrease specific energy consumption [15]. T.M. Afzal et al. also compared barley drying performance between far infrared convection drying and hot air drying; the results showed that far infrared convection drying could improve the drying rate and reduce the energy consumption, and the optimal radiation intensity was found to be 0.33 W/cm2 [16]. Pan et al. also reported that when fresh paddy with a thickness of 10 mm was heated up to 60 °C by far infrared drying technology, the moisture in wet paddy could be further removed under natural wind drying technology [17]. Obviously, it can be summarized from the above analyses that far infrared drying technology can be applied to grain drying.
In order to realize energy-saving and efficient corn drying production, the present work focused on energy-saving variable-temperature drying technology and heat-recirculation performance of an industrial corn-drying system; the allocation between flue gas and hot air was also investigated by adjusting the flue-gas valve openings, α (15°, 30°, 45°, 60°, 75° and 90°). More specifically, the drying kinetics under different α was investigated, and the thermal efficiency (η) of the main components of the system, the thermal-recirculation rate ( Q rec) and the heat-loss characteristics of the drying system were respectively investigated under different drying processes. The objective of the present work was to investigate energy-saving and efficient drying process as well as lay some of the fundamental theoretical basis for designing and optimizing the drying system.

2. Materials and Methods

2.1. Material

Newly harvested corn cobs (Changcheng 799#) were threshed in a threshing machine, and the prepared corn kernel was used for the test; the crushing rate of the corn kernels was ascertained to be less than 5%. Moreover, the initial moisture content (32.2 %d.b.) of the corn kernel was determined by 105 °C constant weight methodology [18].

2.2. Equipment Description and the Working Principle

The scene graph of the drying system, heat exchanger and flue-gas valve are depicted in Figure 1a–c, respectively. As can be seen in Figure 1a, the system mainly consisted of two symmetrical drying towers with a loading capacity of 25 t each. During the drying process, the threshed corn kernels were conveyed to a hoist (HST) by a conveyor belt (CB) and continuously fed into the drying chamber (DC); at this period (90 min), the discharging device (DD) remained closed. After the DC was fully filled, the induced draft fan (IDF) and DD were successively opened, and the grain flux began the cycle under gravity as well as with the help of HST. Meanwhile, the flue gas flux and the air flux flowed into the heat exchanger (HE) and the DC driven by the IDF, respectively. Moreover, the fuel of the CC was hard coal, and the details of the electrical components are tabulated in Table 1.
During the drying process, the combustion in the combustion chamber (CC) was adjusted by the flue-gas valve in the middle of the flue gas pipeline (FGP), and based on the scene graph of the flue gas valve, it can obviously be seen that there was a baffle inserted into the FGP and six card slots which were used to adjust the baffle angles (15°, 30°, 45°, 60°, 75° and 90°). Additionally, in order to simplify the drying system, a schematic diagram of the flows for different fluxes is depicted in Figure 2. As can be seen in detail from the figure, the air volumes of the flue gas and the hot air flux were controlled by the flue-gas valve openings (α) during the drying process; the combustion of hard coal in the CC was affected by the fresh air volume rate inlet into the CC, i.e., the larger the fresh air volume rate was, the more sufficient the combustion of the coal in the CC and the higher the Tfg,in and vfg would be. Meanwhile, under the same total pressure of the IDF, the larger the fresh air-volume rate inlet into the CC was, the larger the flue gas volume rate would be, while the smaller the fresh air-volume entering into the HE would be. In other words, the heat-exchanger performance of the HE and the drying performance of the whole drying system were controlled by the flue-gas valve openings (α); the characteristics of the control may be valuable for the application of a specific drying system in different areas with different ambient conditions. The key physical parameters of the dryer and the HE are tabulated in Table 2.

2.3. Experimental Design and Data Acquisition

The experiments were conducted from October 20th to October 27th, 2019 at Xinzhou, Shanxi Province of China. In order to investigate the energy-saving and efficient drying process, drying performance under an α of 15°, 30°, 45°, 60°, 75° and 90°, respectively, were investigated; during the experimental period, the moisture content of the corn and the moisture content (Mc) and temperature of the outlet corn (Tc) were measured by a self-developed online moisture meter (capacitance mode) which was pre-calibrated using 105 °C constant weight methodology [18]. Additionally, the temperatures of inlet flue gas (Tfg,in), outlet flue gas (Tfg,out), exhaust flue gas (Tfg0), radiators (Tr) and hot air (Tair) were recorded by the corresponding thermocouple (WRN-130/230: 0–1300 °C, ± 0.1 °C), and the flow velocities of flue gas (vfg) and hot air (vair) were also measured by an anemometer (DT-8893: 0.4–30m/s, ±0.2 m/s). In order to eliminate the influence of corn moisture content on pressure, the experiments were conducted at the second cycle of the drying process (the moisture content varied in a small range for each cycle). The experimental data are tabulated in Table 3.

2.4. Assumptions

In order to analyze the drying system from a scientific perspective, several assumptions were made in the present work, which are listed as follows:
(1)
The fluxes were in the steady flow state.
(2)
The heat loss on the FGP was neglected.
(3)
The influence of moisture content variations on the hot air velocity was neglected.
(4)
The temperature and the relative humidity of ambient air in the experimental period were considered to be constant at 8 °C and 85%, respectively.

2.5. Theoretical Analysis

2.5.1. Thermal Analysis

The generally used heat and mass conservation equations were adopted to analyze the thermal performance of the components and the whole drying system. The heat and mass conservation equations in rate form were expressed as Equations (1) and (2), respectively [9,19,20]:
Q i n = Q o u t
m i n = m o u t
In the present work, heat and mass transfer mainly occurred in the components of CC, HE, RA and DC. The heat and mass conservation for the components were given as follows:
For CC:
m c o a l q L H V = m f g , i n h f g , i n + Q l o s s , CC
where m c o a l is the inlet mass rate of the coal, kg/s; q L H V is the low thermal value of the coal, q L H V = 4500 kcal/kg [21]; m fg,in s the mass flow rate of the flue gas, kg/s; hfg,in is the enthalpy of the flue gas produced by the CC (inlet into the HE), kJ/kg. Q l o s s , C C is the heat-loss rate in the CC, kJ/s, which includes the heat loss in discharged ash, heat loss caused by the surface irradiation and convection and the heat loss caused by the unburned C and CO. In relation to this, m f g , i n can be determined by the following Equations (4) and (5):
m f g = ρ f g · v f g · S F G P
ρ f g = ρ N · 273 273 + T f g · B a + p s 101325
where the S F G P is the cross-sectional area of the FGP, m2; ρ N is the density of the flue gas under standard pressure, kg/m3; B a is the atmospheric pressure, Pa; p s is the hydrostatic pressure in the FGP, Pa.
The enthalpy of the flue gas throughout the whole work can be determined by the following Equations (6)–(8) [21,22,23]:
h f g h 0 = c p , f g ( T f g T 0 )
c p , f g = c p , C O 2 a C + b N + c H + d S m t o t , s t e o m f g + f A
c p , C O 2 = 0.1874 × 1.000061 T f g × T f g 0.2665
where c p , C O 2 is the specific heat of CO2, kJ·kg−1·K−1; a N , b N , c H , d S , f A and mtot,steo/mfg are the calculation coefficients, and the values of the coefficients were 0.2498, 0.6366, 0.1196, 0.0029, 0 and 1, respectively [23].
For HE:
m f g , i n = m f g , o u t
m d a i r , 0 = m d a i r , i n
m f g , i n h f g , i n + m a i r , 0 h a i r , 0 = m f g , o u t h f g , o u t + m a i r , i n h a i r , i n + Q l o s s , H E
where m a i r , 0 and the m a i r , i n are the mass flow rate of the dry air inlet and outlet the HE, respectively, kg/s; h f g , i n and h f g , o u t are the enthalpy of the flue gas inlet and outlet the HE, respectively, kJ/kg; hair,0 and h a i r , i n are the enthalpy of the air inlet and outlet the HE, respectively, kJ/kg. Q l o s s , H E is the heat-loss rate to surroundings caused by surface irradiation and convection, kJ/s.
The mass flow rate of air throughout the whole work can be determined by the following Equations (12) and (13) [24,25]:
m a = ρ a · v a · s a
ρ a = ρ d a ( 1 + X 1 + R v X / R a ) = 101.325 0.287 T a b s ( 1 + X 1 + R v X / R a )
where ρa and ρda are the density of the air and dry air, respectively, kg/m3; va is the velocity of the air, m/s; sa is the area of the air-flow path, m2; X is the absolute humidity of the air, kgwater/kgdryair; Rv is the gas constant of saturated water vapor, kJ·kg−1·K−1; Ra is the gas constant of dry air, kJ·kg−1·K−1; Tabs is the absolute temperature, K.
The enthalpy of the air (hair) throughout the whole manuscript can be determined by the following Equation (14) [21,26]:
h a i r h 0 = c a i r ( T a i r T 0 )
c a i r = ( c d a i r + X c v ) / ( 1 + X )
where cair, cdair and cv are the specific heat of the air, dry air and vapor, respectively, kJ·kg−1·K−1.
For RA:
m f g , o u t = m f g , 0
m f g , o u t h f g , o u t = m f g , 0 h f g , 0 + Q F I R
where Q F I R is the thermal energy rate recovered by the RA, which can be calculated by the following Equation (18) [27]:
Q F I R = c p , f g m f g ( T f g , o u t T f g 0 )
For DC:
m d a i r , i n = m d a i r , o u t
m d c , i n = m d c , o u t
m a i r , i n h a i r , i n + Q F I R + Q c , i n = m a i r , o u t h a i r , o u t + Q c , o u t + Q e v a p + Q l o s s , D C
where Q c , i n , Q c , o u t , Q e v a p and Q l o s s , D C are the thermal energy carried by the inlet corn and outlet corn, the thermal energy used for evaporating water from the corn and the heat loss rate caused in DC, respectively, the latter of which includes heat loss caused by surface irradiation and convection to the surroundings and the heat loss of inertial flow, kJ/s. In relation to this, Q c , i n and Q c , o u t can be determined by the Equation (22) [28]:
Q c = c c m c ( T c T 0 )
where cc is the specific heat of the corn, kJ·kg−1·K−1; m c is the mass flow rate of corn, kg/s; Mc is the dry basis moisture content of corn, %d.b.
In the Equation (20), Q e v a p can be determined by the following Equations (23) and (24) [29,30]:
Q e v a p = m d e h y L h
m d e h y = W 0 ( 100 - M c 0 ) ( M c t M c t + Δ t ) Δ t
where m d e h y is the mass flow rate of dehydrated water, kg/s; Lh is the latent heat of water evaporation from the corn material, kJ/kg. W0 is the initial weight of the corn, kg; Mc0 is the initial moisture content of the corn, %d.b.
For the whole drying system, the thermal conservation equation can be expressed as:
m c o a l q L H V + m a i r , 0 h a i r , 0 + Q c , i n = m f g , 0 h f g , 0 + m a i r , o u t h a i r , o u t + Q c , o u t + Q e v a p + Q l o s s
where, the Q l o s s is the total heat loss in components, which includes Q l o s s , C C , Q l o s s , H E and Q l o s s , D C . The values of the parameters and the equations used for the calculation mentioned above are tabulated in Table 4.

2.5.2. Thermal Efficiency

In the present work, thermal efficiency (η) was applied to evaluate the thermal performance of the components and the whole drying system. Based on the analysis above in Section 2.5.1, the thermal efficiency of CC (ηCC), HE (ηHE), RA (ηRA), DC (ηDC) and the whole drying system (ηS) can be determined by following Equations (26)–(30) [34]:
η C C = m f g , i n h f g , i n m c o a l q L H V + m a i r , 0 h a i r , 0
η H E = m a i r , i n h a i r , i n m f g , i n h f g , i n m f g , o u t h f g , o u t + m a i r , 0 h a i r , 0
η R A = m f g , o u t h f g , o u t m f g , 0 h f g , 0 m f g , o u t h f g , o u t
η D C = Q e v a p m a i r , i n h a i r , i n + Q c , i n + Q F I R
η S = m f g , i n h f g , i n m f g , 0 h f g , 0 m c o a l q L H V

2.5.3. Specific Heat Consumption

Specific heat consumption (SHC) was defined as the required thermal energy used to evaporate 1 kg water from the moist corn (kJ·kg−1) [35], which could be used to evaluate the drying difficulty of the drying process. SHC can be determined by the following Equation (31):
S H C = m c o a l q L H V m d e h y

2.5.4. Heat Loss Characteristics

To comprehensively investigate the thermal performance of the drying system, the heat loss characteristics of the drying system were investigated. The heat loss of the system (Qloss,wholesystem) mainly consisted of four parts which were heat loss in outlet hot air (Qair,out), heat loss in outlet corn (Qc,out), heat loss in outlet flue gas (Qfg,0) and the total heat loss in components (∑Qloss). Based on the analysis above in Section 2.5.1, the Qloss,wholesystem in rate form can be calculated by the following Equations (32)–(35) [20]:
Q l o s s , w h o l e s y s t e m = Q a i r , o u t + Q c , o u t + Q f g , 0 + Q l o s s
Q a i r , o u t = m a i r , o u t h a i r , o u t
Q c , o u t = c c m c , o u t ( T c T 0 )
Q f g , 0 = m f g , 0 h f g , 0

2.5.5. Far Infrared Wavelength

As can be seen from Figure 2, the RA is the key component to enhancing the thermal efficiency of the whole drying system, and the far infrared wavelength produced by the RA is also one of the effective methodologies to improve the quality of the dried corn [36]. The wavelength (λ) of the RA can be determined by Wien’s Displacement Law [37]:
λ T r = 2897.6 u m K

2.5.6. Drying Kinetics

In the present work, the dry basis moisture content of the corn (Mc) was measured by the online capacitance mode moisture meter, and the drying rate (DR) can be determined followed by the following Equation (33) [19]:
D R = M c t M c t + Δ t Δ t
where Mct and Mct+t are the moisture content of the corn at time t and △t, respectively, %d.b.; △t is the time difference, h.

3. Results and Discussions

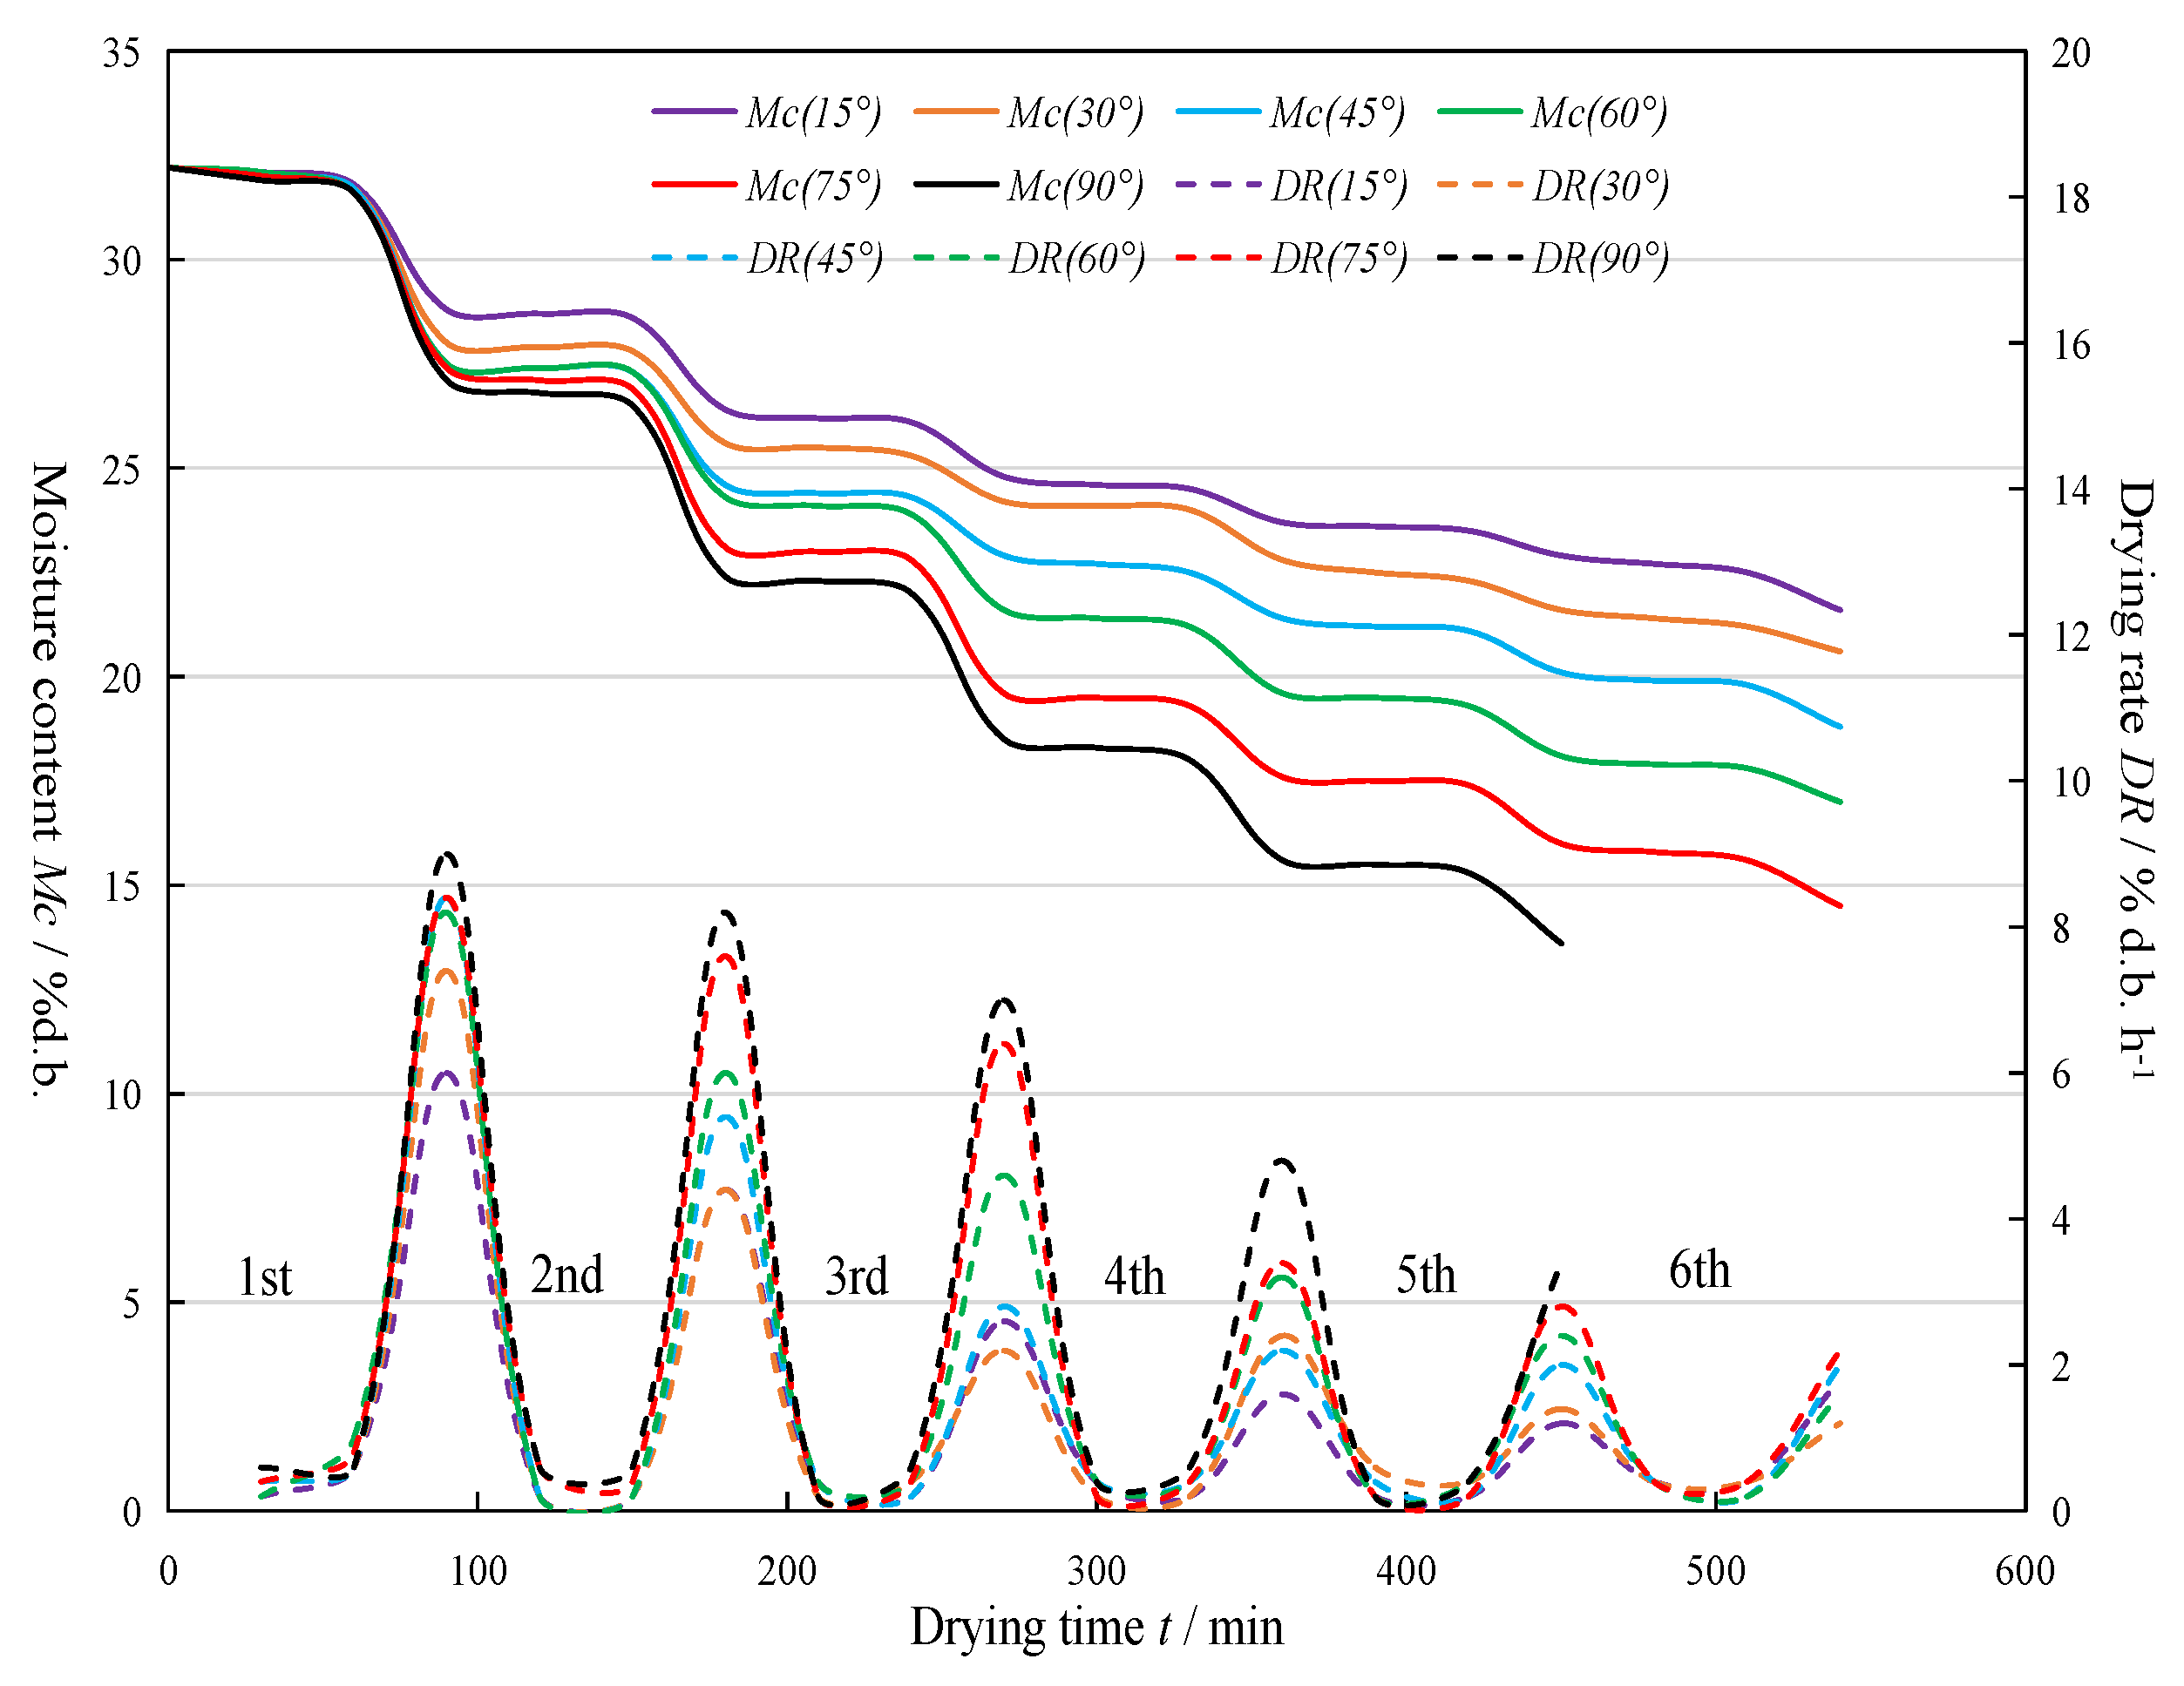
3.1. The Drying Performance of the Drying System

In the present work, the Mc was measured at 30 min intervals, and the measured Mc was used to calculate the DR; the variations in Mc and DR with drying time t for different α are depicted in Figure 3; as can be seen from the figure, over the six drying cycles of the drying process, the Mc gradually decreases with the increase of t for different α. It can be seen from the variation trends of DR that the DR for the different α in the first cycle obtained the maximum values, which might be due to the fact that the evaporated water in this period could be regarded as free water, and the dehydration characteristic could be summarized as free water evaporation [21]; thus, moisture was quickly removed from the corn. Moreover, it also can be seen from Figure 3 that in the first drying cycle, the DR under α of 45°, 60°, 75° and 90° were similar and obviously higher than that of the others. In the second and third drying cycles, the DR under the α of 75° and 90° were similar and obviously higher than that of others, while in the fourth and fifth drying cycles, the DR under the α of 90° was obviously higher than that of others, which might be due to the fact that the moisture in the material was mainly expressed as bound water, and thus, more energy was needed to overcome the binding energy between the moisture molecules and the adsorption site, and higher hot air temperature was needed to evaporate the same amount of water [30]. Accordingly, by comprehensively considering the heat exchange performance of the HE and based on the analysis in the above Section 3.1, a variable temperature drying process could be developed as Tair of 76.5 °C in the 1st drying cycle (α = 45°), Tair of 95.2 °C in the 2nd and 3rd drying cycles (α = 75°), Tair of 100.3 °C in the 4th and 5th drying cycles (α = 90°). Another drying operation followed by the obtained optimized drying process was conducted, and the drying performance was compared with the drying performance under the α of 75° and 90° (the final Mc of only two of the drying processes was down to the required moisture content of 14 %d.b.); the comparison curves are shown in the following Figure 4.

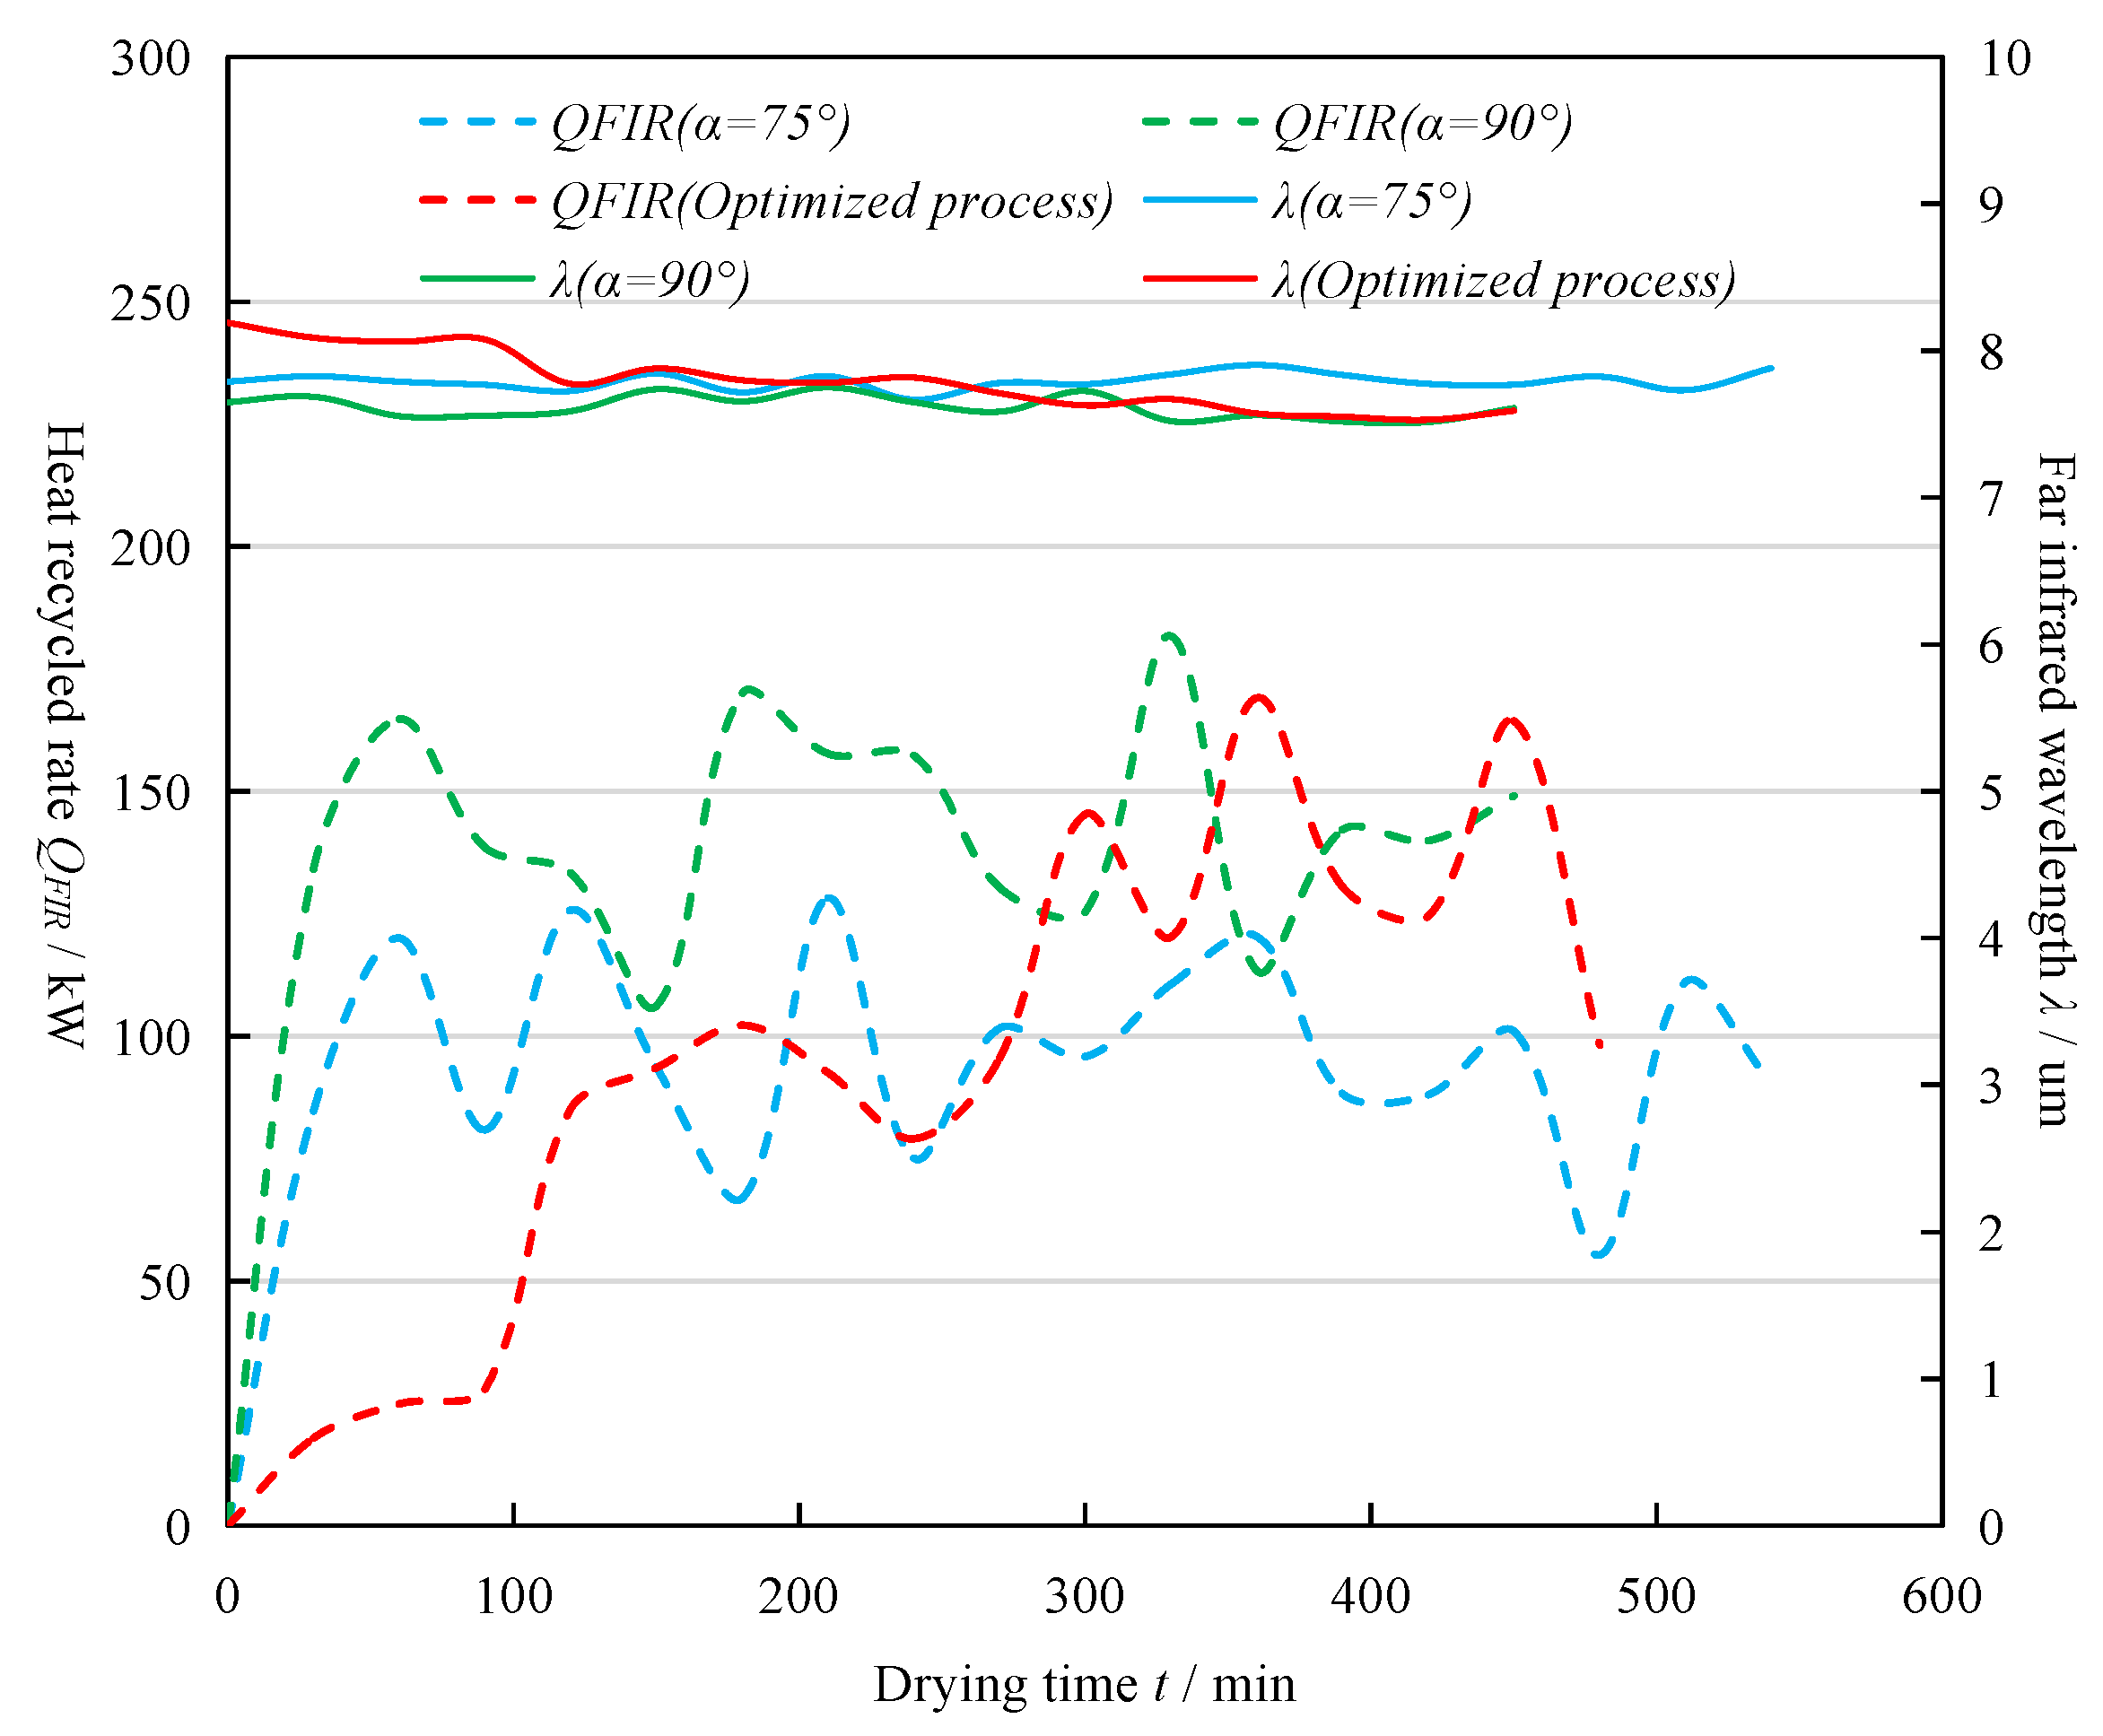
3.2. Heat Recycled Performance of the RA

RA was the key component for enhancing the energy utilization level of the whole drying system, and it could also be considered as a primary heat resource of the drying system. During the drying process, the thermal energy in the flue gas after HE was transferred to radiant energy, which can enhance the drying even better than thermal energy [38]. Moreover, a proper far infrared wavelength can cause the resonance of moisture molecules in the corn kernel and increase the internal energy of the corn kernel, thereby strengthening the drying performance [20]. The variations in recycled radiant energy rate ( Q F I R ) and the far infrared wavelength (λ) with drying time for different drying processes are depicted in Figure 5. As can be seen from the figure, the λ for optimized drying process, α = 75° and α = 90° varied in the range of 7.53–8.32, 7.86–7.98 and 7.54–7.88 μm, respectively. Zhu et al. have reported that grain achieves the highest far infrared radiation absorption rate when the λ is closed to 9 um [39], which indicates that the wavelength in the present work for different drying processes could be effectively absorbed by the corn material. On the other hand, the Q F I R for the optimized drying process, α = 75° and α = 90° were ascertained to be 2650.11, 3127.45 and 3858.57 MJ, respectively, which could evaporates 1509.62, 1250.48 and 1542.81 kg water from the fresh corn material, respectively.

3.3. Heat Loss Characteristics of the Drying System

The reduction of heat loss was another effective method to improve the energy utilization level of the drying system. In order to further validate the feasibility of the optimized drying process, the variations in heat-loss rates in outlet air ( Q a i r , o u t ), outlet corn ( Q c , o u t ) and outlet flue gas from the RA ( Q f g , 0 ) and the total heat-loss rate in components ( Q l o s s ) with drying time for the three drying processes were investigated; the results are shown in Figure 6a, and the heat-loss rate of the whole drying system ( Q l o s s , w h o l e s y s t e m ) for the three drying processes are depicted in Figure 6b. Obviously, it can be seen from Figure 6a that the Q c , o u t for the three drying processes increased with the increase in drying time. It can be deduced from Equation (34) that Q c , o u t is proportionate to Tc while inversely proportionate to Mc; during the drying process, Tc increased with drying time, while Mc decreased with drying time, which may help to explain the trends of the Q c , o u t for the three drying processes; similar findings have been reported by Li et al. in 2019 for paddy grain industrial drying processes [20]. On the other hand, the Q f g , 0 varied in a relatively small range for the processes of α = 75° and α = 90°, while for the optimized drying process, the Q f g , 0 in the first cycle (0–90min) was obviously lower than that in the other four drying cycles, which might be due to the fact that the Tfg,0 and vfg in the first cycle (α = 45°) were lower than those in the second, third, fourth and fifth drying cycles. Moreover, obviously, it can be concluded from Figure 6a that for each of the drying processes, the Q c , o u t were larger than the Q f g , 0 and Q a i r , o u t indicating that the heat loss in outlet corn should primarily be optimized for the purpose of energy-saving drying; the reduction of the grain discharging rate ( m c ) and the Tc may be helpful to decrease the Q c , o u t , as recommended by Ma et al. for paddy-grain drying in an industrial paddy dryer [40]. By comparing the Q l o s s for the three drying processes, it can be deduced that the Q l o s s in the first drying cycle for the optimized process was lower than that of the other two processes under the same drying time, indicating that the optimized drying process shows a better thermal performance in the first cycle than the other two processes. Moreover, as can be seen in Figure 6b, the Q l o s s , w h o l e s y s t e m for the optimized drying process, α = 75° and α = 90° were ascertained to be 36,132.874, 40,459.801 and 44,788.154 MJ, respectively, indicating that the optimized drying process shows a better heat loss performance of the whole drying system than that of the processes of α = 75° and α = 90°.

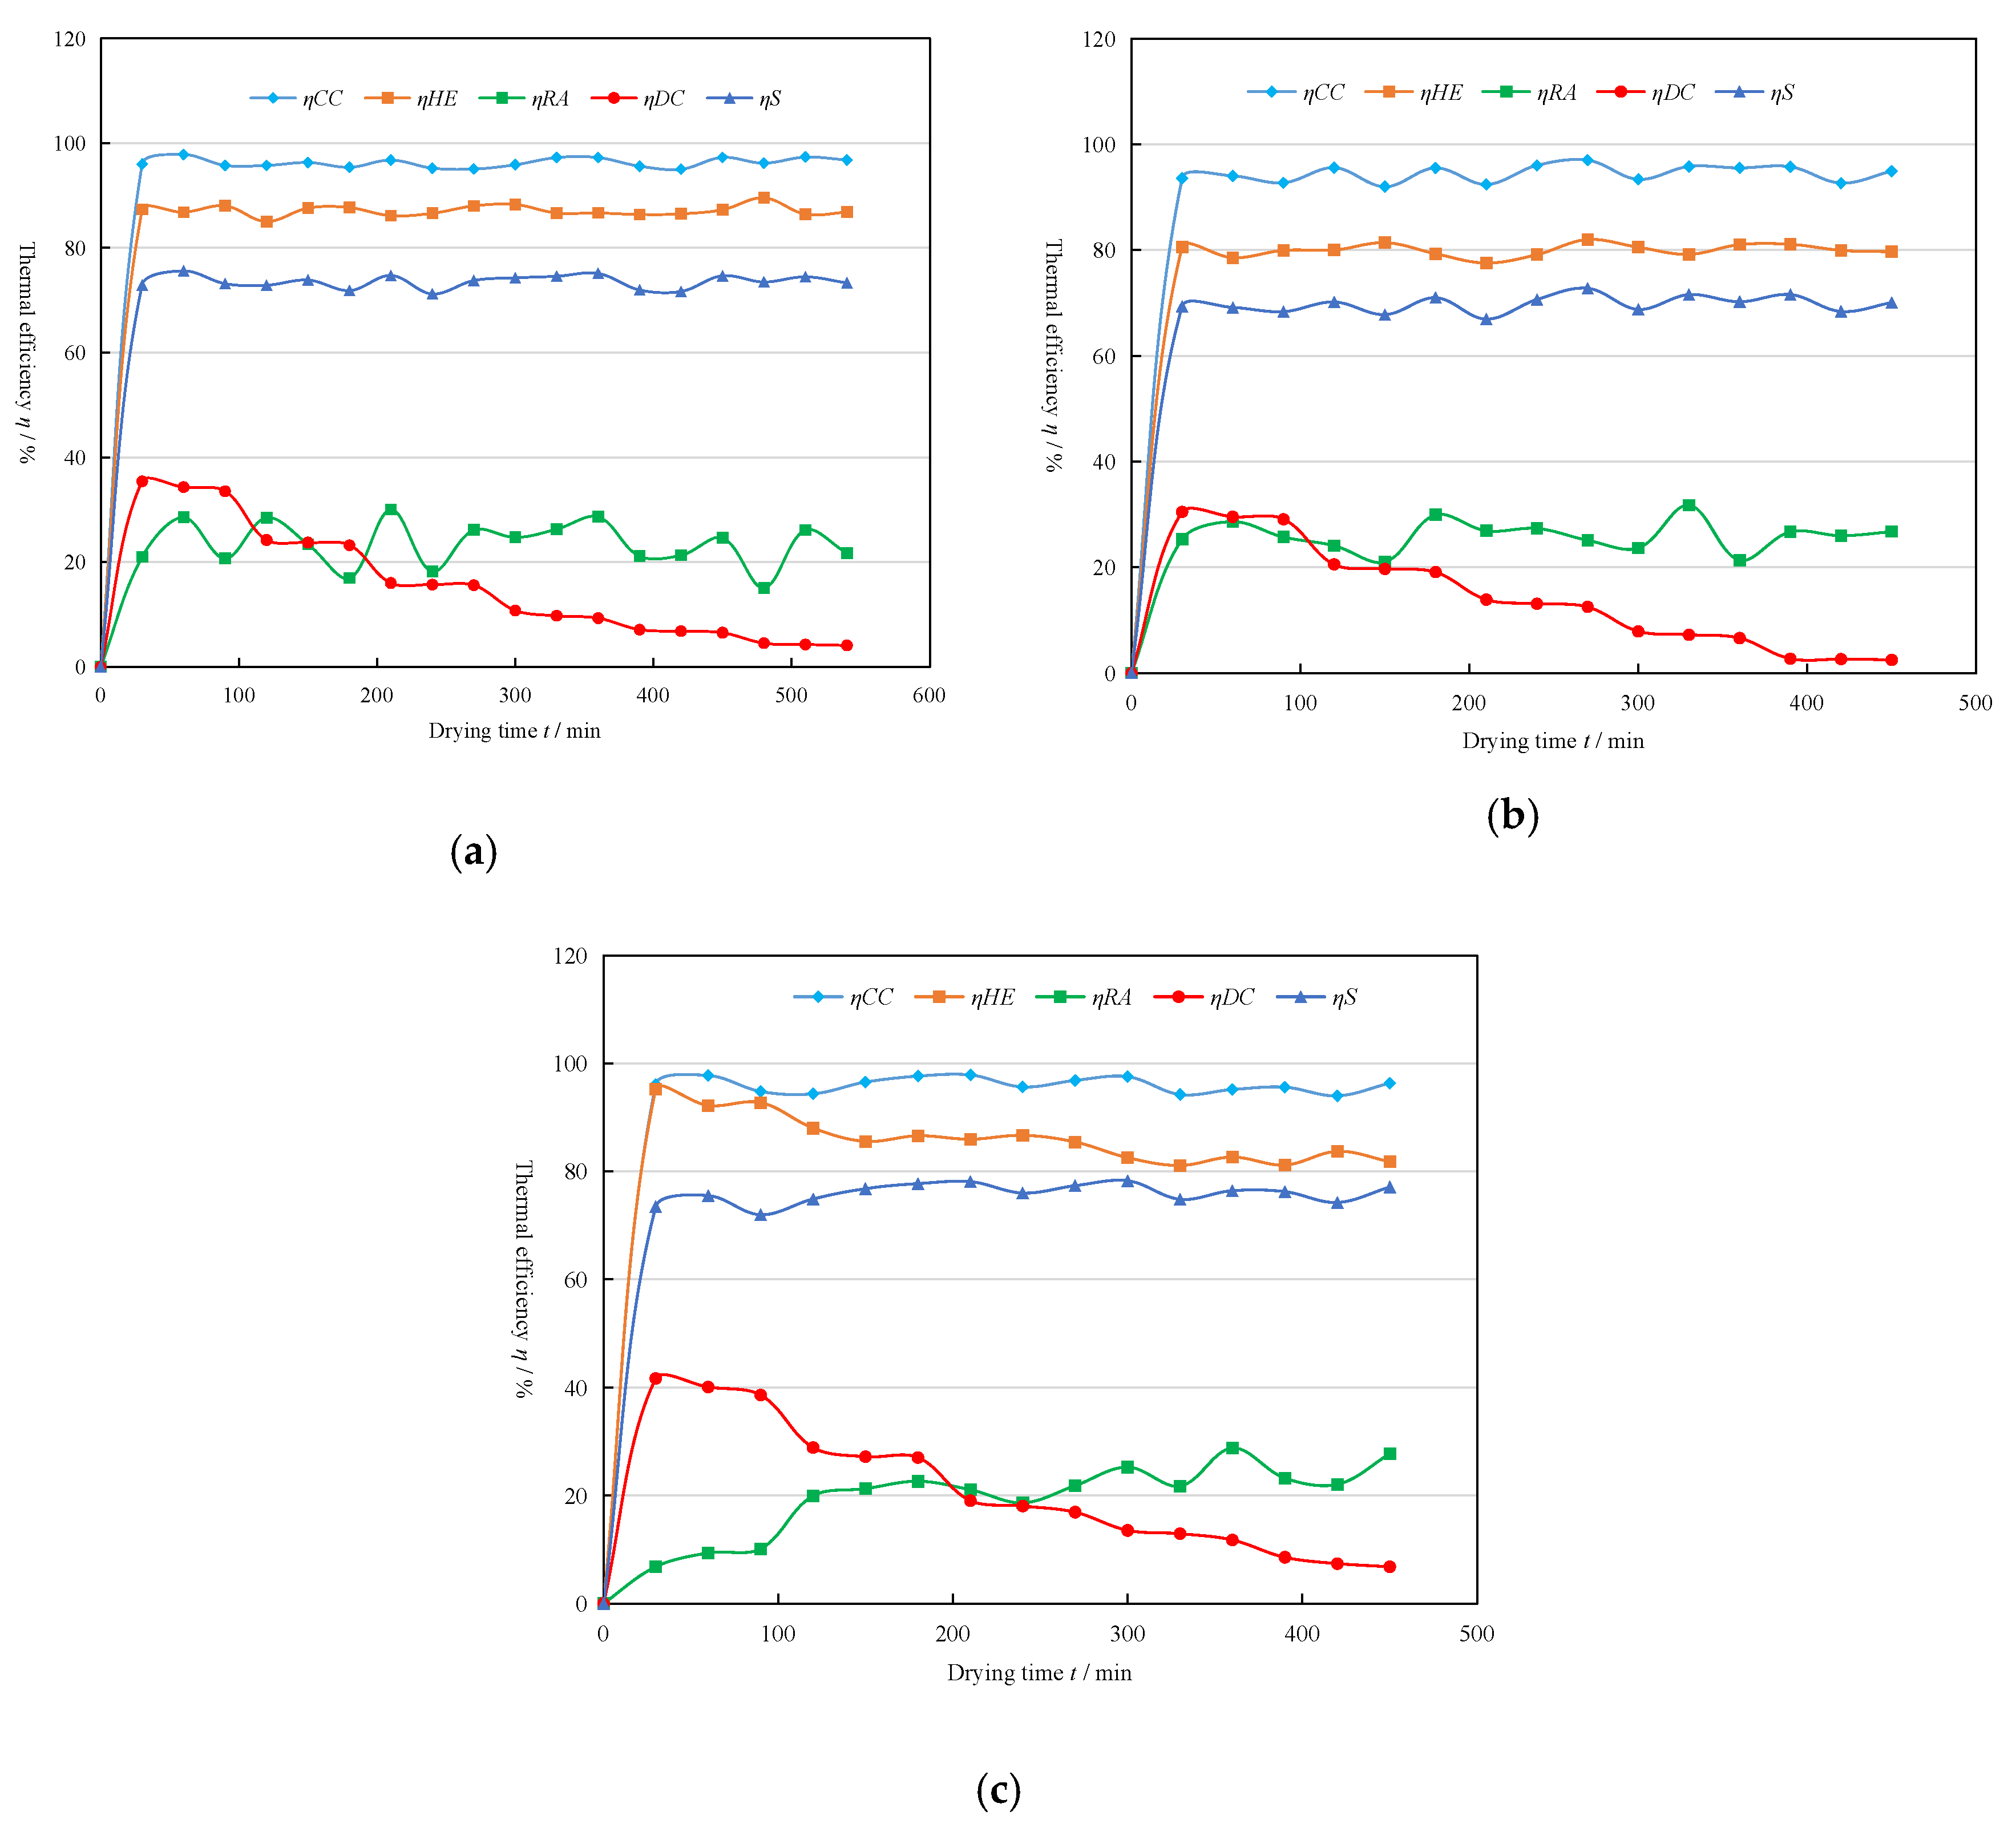
3.4. The Thermal Efficiency of the Drying System

Thermal efficiency (η) is defined as the ratio of the effective output energy to the total energy input into a specific thermal system [41], which was widely used to evaluate the thermal performance of the agricultural product drying system [42]. In order to investigate the thermal performance of the key components of the drying system, the variations of the thermal efficiency of CC (ηCC), HE (ηHE), DC (ηDC), RA (ηRA) and the whole drying system (ηS), with drying time for the three drying processes, are depicted in Figure 7.
As can be seen from the above Figure 7, the ηHE for the drying process of α = 75°, α = 90° and optimized drying process were ascertained to be varied within the ranges of 85.03–89.56%, 77.57–82.01% and 81.08–95.21%, respectively, and the ηCC for the three processes were all above 93%. By comparing Figure 7a–c, it can be found that the ηHE and ηDC for the optimized drying process were higher than that of the other two drying processes under the same drying time (especially in the 1st drying cycle), respectively, indicating that the optimized drying process showed a better thermal performance in the HE and DC. Additionally, DC was the key component for evaporating moisture from the wet corn material, and ηDC was one of the most important indexes for evaluating the drying capacity of the whole drying system. It can be seen from the above three figures that ηDC decreased with the increase of drying time and that the variation range of ηDC for the drying processes of α = 75°, α = 90° and optimized drying process were ascertained to be 4.09–35.43%, 2.49–30.49% and 6.81–41.71%, respectively. Furthermore, in order to obtain a better understanding of the energy saving performance of the optimized drying process, the total energy input into the drying system and the SHC for the three drying processes, respectively, were depicted in Figure 8a,b. As can be seen from Figure 8a, the total energy consumption of the optimized drying process was lower than that of the other two processes. On the other hand, SHC was the key index for evaluating the drying difficulty of the corn in the drying system and could be calculated by the Equation (31); the calculation results are shown in the following Figure 8b. It can be seen from the figure that the average SHC for the optimized drying process, α = 75° and α = 90° were 7290.269, 8068.129 and 8881.118 MJ, respectively, indicating that the drying difficulty of the optimized drying process was lower than that of the other two processes.

3.5. The Thermal Performance of the Drying System

Based on the analysis above, the energy distribution of the whole drying system for the optimized drying process was concluded by a Sankey diagram and shown in Figure 9. As can be seen from the figure, the energy transmission and conversion of the system mainly occurred at the CC, HE, RA and DC. During the drying process, 1807.56 kW of energy was carried by the coal and delivered into the CC, and 1734.04 kW of thermal energy ( Q f g , i n ) was produced by burning the coal, while 73.52 kW of thermal energy ( Q l o s s , C C ) was lost in the CC, which might have been caused by surface irradiation and convection, heat loss in the discharged ash and inadequate combustion of the coal. The Q f g , i n into the HE was mainly divided into three parts: the thermal energy carried by the hot air ( Q a i r , i n ), the thermal energy input into the RA ( Q f g , o u t ) and the thermal energy loss in HE ( Q l o s s , H E ). The values of the Q a i r , i n , Q f g , o u t and Q l o s s , H E were ascertained to be 1096.59, 444.26 and 193.19 kW, respectively. As for the RA, the Q f g , o u t was considered as the fuel of the RA, while the Q F I R was considered as the product of the RA. The average value of the Q F I R was ascertained to be 98.15 kW, i.e., 98.15 kJ of thermal energy was recycled to the DC per second; however, 346.11 kW of thermal energy in the outlet flue gas of the RA was still wasted, indicating that the ηRA should be further improved by using other alternative material of the radiators [43]. Accordingly, as can be seen from Figure 9, there were two fuel energy flux inputs into the DC, and the energy inputs into the DC were mainly consumed by four aspects: thermal energy used for evaporating moisture from the wet corn material ( Q e v a p ), thermal energy loss carried by the outlet corn material ( Q c , o u t ), thermal energy loss in outlet hot air ( Q a i r , o u t ) and the thermal energy loss in DC ( Q l o s s , D C ), and the values of Q e v a p , Q c , o u t , Q a i r , o u t and Q l o s s , D C were ascertained to be 384.74, 357.72, 175.49 and 178.64 kW, respectively.

4. Conclusions

In the present work, based on the investigation of the allocation between flue gas flux and air flux, an optimized variable-temperature drying process was proposed, and the thermal performance of the whole drying system was investigated. The main conclusions depending on the results are listed as follows:
(1)
The optimized variable-temperature drying process for corn industrial drying was ascertained to be Tair of 76.5 °C in the first drying cycle, Tair of 95.2 °C in the second and third drying cycles and Tair of 100.3 °C in the fourth and fifth drying cycle.
(2)
There was 2650.11 MJ of thermal energy that was recycled by RA, and the far infrared wavelength of the RA was found to vary from 7.53 um to 8.32 um, indicating that the RA could enhance the drying performance of the whole drying system.
(3)
The total energy consumption and specific heat consumption of the corn for the optimized drying process were ascertained to be 48,803.99 MJ and 7290.269 kJ/kg, respectively, which showed a better drying performance than the two analyzed constant-temperature drying processes.
(4)
The thermal efficiency of the optimized drying process for the DC was higher than that of the two analyzed constant-temperature drying processes. The variation range of ηDC for the optimized drying process was found to be 6.81–41.71%.
(5)
Only 384.74 kW of thermal energy was used to evaporate the moisture from the wet corn material, which should be further improved.
The main conclusions and the proposed design approach could lay a fundamental basis for the design and optimization of other similar equipment. Moreover, to reach the ultimate goals of grains-friendly processing and efficient drying, the drying performance of the drying process as well as the energy performance of the whole drying system should be further investigated.

Author Contributions

Data curation, B.L., Z.Z. and X.Z.; formal analysis, B.L.; funding acquisition, Y.Z.; investigation, B.L. and Z.Z.; methodology, B.L. and X.Z.; software, B.L.; supervision, Y.Z.; writing—original draft, B.L. All authors have read and agreed to the published version of the manuscript.

Funding

This work was supported by the Science and Technology Project of the Guangdong Tobacco Monopoly Bureau (№: yueyankexiang 201706) and National Natural Science Foundation of China (№:31671783).

Institutional Review Board Statement

Not applicable.

Informed Consent Statement

Not applicable.

Data Availability Statement

Data is contained within the article.

Acknowledgments

The authors would like to thank the editors and reviewers for their valuable and constructive comments.

Conflicts of Interest

The authors declare that they have no known competing financial interests or personal relationships that could have influenced the work reported in this paper.

References

  1. Defraeye, T. Advanced computational modelling for drying processes—A review. Appl. Energy 2014, 131, 323–344. [Google Scholar] [CrossRef]
  2. Mujumdar, A.S. Handbook of Industrial Drying, 3rd ed.; Taylor & Francis Group: Boca Raton, FL, USA; CRC Press: Boca Raton, FL, USA, 2006. [Google Scholar] [CrossRef]
  3. Kudra, T. Energy aspects in drying. Dry Technol. 2004, 22, 917–932. [Google Scholar] [CrossRef]
  4. Kemp, I.C. Fundamentals of energy analysis of dryers. In Mod. Dry. Technol—Energy Savings, Weinheim; Tsotsas, E., Mujumdar, A.S., Eds.; Wiley-VCH Verlag GmbH: Weinheim, Germany, 2011; pp. 1–46. [Google Scholar] [CrossRef]
  5. Lamidi, R.O.; Jiang, L.; Pathare, P.B.; Wang, Y.D.; Roskilly, A.P. Recent advances in sustainable drying of agricultural produce: A review. Applied Energy 2019, 233–234, 367–385. [Google Scholar] [CrossRef] [Green Version]
  6. Xu, F.Y.; Huang, M.S.; Chen, Z.; Li, C.Y. Moisture diffusion characteristics and quality characteristics of rice during drying. Trans. Chin. Soc. Agric. Eng. 2016, 32, 261–267. [Google Scholar] [CrossRef]
  7. Li, T.; Li, C.; Li, C.; Xu, F.; Fang, Z. Porosity of flowing rice layer: Experiments and numerical simulation. Biosyst. Eng. 2019, 179, 1–12. [Google Scholar] [CrossRef]
  8. Jokiniemi, H.T.; Ahokas, J.M. Drying process optimisation in a mixed-flow batch grain dryer. Biosyst. Eng. 2014, 121, 209–220. [Google Scholar] [CrossRef]
  9. Chen, H.T.; Hsieh, Y.L.; Chen, P.C.; Lin, Y.F.; Liu, K.C. Numerical simulation of natural convection heat transfer for annular elliptical finned tube heat exchanger with experimental data. Int. J. Heat Mass Transfer. 2018, 127, 541–554. [Google Scholar] [CrossRef]
  10. Gang, C.; Wudong, C.; Chunsheng, W.; Hailong, L.; Zhongbo, J.; Lin, W. Design and experiment of large-scale 5HFS-10 type automatic control negative pressure grain dryer. Trans. Chin. Soc. Agric. Eng. 2017, 33, 267–275. [Google Scholar] [CrossRef]
  11. Li, C.; Ma, X.; Fang, Z.; Zhang, Y. Thermal energy structure of grain hot air drying and analytical method. Trans. Chin. Soc. Agric. Eng. 2014, 30, 220–228. [Google Scholar] [CrossRef]
  12. Golman, B.; Julklang, W. Analysis of heat recovery from a spray dryer by recirculation of exhaust air. Energy Convers. Manag. 2014, 88, 641–649. [Google Scholar] [CrossRef]
  13. Zhang, X.R.; Zheng, Q.Y.; Gao, J.Z.; Shi, X.H. Technology and application of waste heat recovery from tail gas of grain drying system. Energy Conserv. Environ. Prot. 2015, 11, 74–75. [Google Scholar]
  14. Bai, J.W.; Luo, S.Q.; Ye, J.; Liu, L.; Niu, M.J.; Deng, X.M. Design of the Waste Heat Utilizing System on Multifunctional Tractor. J. Agric. Mech. Res. 2008, 12, 195–197. [Google Scholar] [CrossRef]
  15. Tuncel, N.B.; Yilmaz, N.; Kocabiyik, H.; Öztürk, N.; Tunçel, M. The effects of infrared and hot air drying on some properties of corn (zea mays). J. Food Agric. Environ. 2010, 8, 63–68. [Google Scholar] [CrossRef] [Green Version]
  16. Afzal, T.M.; Abe, T.; Hikida, Y. Energy and quality aspects during combined fir-convection drying of barley. J. Food Eng. 1999, 42, 177–182. [Google Scholar] [CrossRef]
  17. Pan, Z.; Khir, R.; Bett-Garber, K.L. Drying characteristics and quality of rough rice under infrared radiation heating. Trans. ASABE 2011, 54, 203–210. [Google Scholar] [CrossRef]
  18. Li, B.; Peng, G.L.; Luo, C.W.; Meng, G.D.; Yang, L. Vacuum drying kinetics characteristics of Chinese prickly ash based on Weibull distribution. Food Ferment. Ind. 2017, 43, 58–64. [Google Scholar] [CrossRef]
  19. Akpinar, E.K.; Midilli, A.; Bicer, Y. The first and second law analyses of thermodynamic of pumpkin drying process. J. Food Eng. 2006, 72, 320–331. [Google Scholar] [CrossRef]
  20. Li, B.; Li, C.; Li, T.; Zeng, Z.; Ou, W.; Li, C. Exergetic, energetic, and quality performance evaluation of paddy drying in a novel industrial multi-field synergistic dryer. Energies 2019, 12, 4588. [Google Scholar] [CrossRef] [Green Version]
  21. Li, B.; Li, C.; Huang, J.; Li, C. Exergoeconomic analysis of corn drying in a novel industrial drying system. Entropy 2020, 22, 689. [Google Scholar] [CrossRef]
  22. Coskun, C.; Oktay, Z.; Ilten, N. A new approach for simplifying the calculation of flue gas specific heat and specific exergy value depending on fuel composition. Energy 2009, 34, 1898e902. [Google Scholar] [CrossRef]
  23. Zhang, Q.; Yi, H.N.; Yu, Z.H.; Gao, J.T.; Wang, X.Z.; Lin, H.Y.; Shen, B. Energy-exergy analysis and energy efficiency improvement of coal-fired industrial boilers based on thermal test data. Appl. Therm. Eng. 2018, 144, 614–627. [Google Scholar] [CrossRef]
  24. Aviara, N.A.; Onuoha, L.N.; Falola, O.E. Energy and exergy analyses of native cassava starch drying in a tray dryer. Energy 2014, 73, 809–817. [Google Scholar] [CrossRef]
  25. Soufiyan, M.M.; Dadak, A.; Hosseini, S.S.; Nasiri, F.; Dowlati, M.; Tahmasebi, M. Comprehensive exergy analysis of a commercial tomato paste plant with a double-effect evaporator. Energy 2016, 111, 910–922. [Google Scholar] [CrossRef]
  26. Yildirim, N.; Genc, S. Energy and exergy analysis of a milk powder production system. Energy Convers. Manag. 2017, 149, 698–705. [Google Scholar] [CrossRef]
  27. Jin, Y.; Gao, N.; Zhu, T. Techno-economic analysis on a new conceptual design of waste heat recovery for boiler exhaust flue gas of coal-fired power plants. Energy Convers. Manag. 2019, 200, 112097. [Google Scholar] [CrossRef]
  28. Aghbashlo, M.; Tabatabaei, M.; Soltanian, S.; Ghanavati, H.; Dadak, A. Comprehensive exergoeconomic analysis of a municipal solid waste digestion plant equipped with a biogas genset. Waste Manag. 2019, 87, 485–498. [Google Scholar] [CrossRef]
  29. Wojciech, S. Thermodynamics for Sustainable Management of Natural Resources. Green Energy Technol. 2017. [Google Scholar] [CrossRef]
  30. Li, C.Y. Engineering Thermodynamics and Heat Transfer; China Agricultural University Press: Beijing, China, 2012. (In Chinese) [Google Scholar]
  31. Tohidi, M.; Sadeghi, M.; Torki-Harchegani, M. Energy and quality aspects for fixed deep bed drying of paddy. Renew. Sustain. Energy Rev. 2017, 70, 519–528. [Google Scholar] [CrossRef]
  32. Aghbashlo, M.; Mobli, H.; Rafiee, S. Energy and exergy analyses of the spray drying process of fish oil microencapsulation. Biosyst. Eng. 2012, 111, 229–241. [Google Scholar] [CrossRef]
  33. Khanali, M.; Aghbashlo, M.; Rafiee, S. Exergetic performance assessment of plug flow fluidised bed drying process of rough rice. Int. J. Exergy 2013, 13, 387–408. [Google Scholar] [CrossRef]
  34. Zhao, H.; Dai, P.; Cao, S.; Hao, Q. Waste Heat Recovery System Using Coal-Fired Boiler Flue Gas to Heat Heating Network Return Water. In Lecture Notes in Electrical Engineering, Proceedings of the 8th International Symposium on Heating, Ventilation and Air Conditioning; Li, A., Zhu, Y., Li, Y., Eds.; Springer: Berlin/Heidelberg, Germany, 2013; Volume 262. [Google Scholar] [CrossRef]
  35. Li, C.; Mai, Z.; Fang, Z. Analytical study of grain moisture binding energy and hot air drying dynamics. Trans. Chin. Soc. Agric. Eng. 2014, 30, 236–242. [Google Scholar] [CrossRef]
  36. Baird, J.K.; King, T.R. A wien displacement law for impact radiation. Int. J. Impact Eng. 1999, 23, 39–49. [Google Scholar] [CrossRef]
  37. De Lima, J.A.S.; Santos, J. Generalized Stefan-Boltzmann law. Int. J. Theor. Phys. 1995, 34, 127–134. [Google Scholar] [CrossRef]
  38. Deng, Y.; Wang, Y.; Yue, J.; Liu, Z.; Zheng, Y.; Qian, B.; Zhong, Y.; Zhao, Y. Thermal behavior, microstructure and protein quality of squid fillets dried by far-infrared assisted heat pump drying. Food Control 2014, 36, 102–110. [Google Scholar] [CrossRef]
  39. Zhu, W.; Zhang, Z. Research on characteristics of infrared absorption of grain. Grain Storage 2003, 32, 38–41. [Google Scholar]
  40. Ma, X.; Fang, Z.; Li, C. Energy efficiency evaluation and experiment on grain counter-flow drying system based on exergy analysis. Trans. Chin. Soc. Agric. Eng. 2017, 33, 285–291. [Google Scholar] [CrossRef]
  41. Menzel, G.; Och, S.H.; Mariani, V.C.; Moura, L.M.; Domingues, E. Multi-objective optimization of the volumetric and thermal efficiencies applied to a multi-cylinder internal combustion engine. Energy Convers. Manag. 2020, 216, 112930. [Google Scholar] [CrossRef]
  42. Zhang, H.; Dong, L.; Li, H.Q.; Chen, B.; Tang, Q.; Tsuyoshi, F. Investigation of the residual heat recovery and carbon emission mitigation potential in a Chinese steelmaking plant: A hybrid material/energy flow analysis case study. Sustain. Energy Technol. Assess. 2013, 2, 67–80. [Google Scholar] [CrossRef]
  43. Nimmol, C.; Devahastin, S.; Swasdisevi, T.; Soponronnarit, S. Drying and heat transfer behavior of banana undergoing combined low-pressure superheated steam and far-infrared radiation drying. Appl. Therm. Eng. 2007, 27, 2483–2494. [Google Scholar] [CrossRef]
Figure 1. The scene graph of the drying system (a), the heat exchanger (b) and the flue-gas valve (c).
Applsci 11 02772 g001
Figure 2. The schematic diagram of the flows for different fluxes.
Applsci 11 02772 g002
Figure 3. The variation of moisture content and drying rate with drying times for different valve openings.
Applsci 11 02772 g003
Figure 4. Comparison of the drying performance under different processes.
Applsci 11 02772 g004
Figure 5. The wavelength and the heat-recycled performance of the RA under different drying processes.
Applsci 11 02772 g005
Figure 6. The heat loss characteristics (a) and the total heat loss (b) of the drying system for the three drying processes.
Applsci 11 02772 g006
Figure 7. The thermal efficiency of the key components for the drying process of α = 75°(a), α = 90°(b) and the optimized drying process (c).
Applsci 11 02772 g007
Figure 8. The total energy input into the drying system (a) and the specific heat consumption (b) of the drying system for the three drying processes.
Applsci 11 02772 g008
Figure 9. The Sankey diagram for the thermal analysis of the overall drying system.
Applsci 11 02772 g009
Table 1. The details of the electrical components adopted in this work.
Components Power (kW)
Data acquisition (DA)0.75
Hoist (HST)5.5
Conveyor belt (CB)1.5
Induced draft fan (IDF)30
Discharging device (DD)1.5
Table 2. The key parameters of the dryer and the heat exchanger.
ParametersValue/MethodUnits
DryerLoading capacity50 t
Drying capacity5.5t/h
Cycling time of the dryer90min
Total air volume of the induced draft fan17,585–30,774m3/h
Total pressure of the induced draft fan1500–2149Pa
Diameter of the flue gas pipeline200mm
Heat exchangerHeat exchanger typeShell and tube type-
MaterialStainless steel-
Number of pipes253 (11 columns and 23 rows)-
Pipe arrangementStaggered-
Pipe space120mm
Size of pipe (length × diameter × thickness)1800 × 50 × 1.5mm
Table 3. The experimental data of the parameters.
Parameters
Flue Gas Valve Openings α/°
153045607590
va
m·s−1
2.722.682.652.622.602.59
2.70–2.742.66–2.692.63–2.682.59–2.642.58–2.612.57–2.62
vfg
m·s−1
5.687.269.2111.8315.3520.47
5.21–6.855.96–9.327.65–11.329.75–13.2514.32–18.6317.96–23.2
Tfg,in
°C
336.6462.5632.3795.6936.51024.3
296.3–362428.6–486.8601.5–663.8765.8–816.3904.8–968.9987.6–1086.3
Tfg,out
°C
77.382.696.3105.6115.6128.5
74.3–80.279.8–83.992.1–99.6100.3–108.9112.3–119.6121.6–132.3
Tfg,0
°C
62.265.373.978.582.285.6
57.9–64.862.3–69.269.8–76.177.2–81.980.2–85.683.6–89.3
Tair
°C
32.656.476.586.295.2100.3
30.6–35.254.2–58.973.5–79.682.1–89.392.6–99.897.6–105.9
Tr
°C
65.273.584.296.398.8105.6
63.2–69.871.6–75.682.6–87.993.6–98..395.6–102.3101.6–109.6
m c o a l
kg·h−1
155.4188.7206.5275.4334.8425.6
Table 4. The values of the parameters and equations used in the present work.
Parameters NameValue/EquationUnitReference
Ra0.287kJ·kg−1·K−1[31]
Rv0.462kJ·mol−1·K−1
Ba101.325kPa[9]
ρN1.338kg/m3
SFGP0.0314 m2
m c 17.223kg·s−1
cc c p = 1.12 + 0.045 M c kJ·kg−1·K−1[21]
Lh h lh = 2.503 × 10 6 2.386 × 10 3 ( T 273.16 ) 0.5 273.16 T 338.72 J·kg−1[32]
cv c v = 1.883 ( 1.6737 × 10 4 T ) + ( 8.4386 × 10 7 T 2 ) ( 2.6966 × 10 10 T 3 ) kJ·kg−1·K−1[33]
cdair c d a i r = 1.04841 ( 3.83719 × 10 4 T ) + ( 9.45378 × 10 7 T 2 ) ( 5.49031 × 10 10 T 3 ) + ( 7.9298 × 10 14 T 4 ) kJ·kg−1·K−1
Publisher’s Note: MDPI stays neutral with regard to jurisdictional claims in published maps and institutional affiliations.

