Article

Experimental Study on the Behavior of Existing Reinforced Concrete Multi-Column Piers under Earthquake Loading

1
Department of Civil Engineering, Pusan National University, Busan 46241, Korea
2
Department of Civil and Environmental Engineering, University of Ulsan, Ulsan 44610, Korea
3
Department of Ocean Engineering, Pukyong National University, Busan 48513, Korea
*
Author to whom correspondence should be addressed.
Appl. Sci. 2021, 11(6), 2652; https://doi.org/10.3390/app11062652
Submission received: 8 February 2021 / Revised: 10 March 2021 / Accepted: 13 March 2021 / Published: 16 March 2021
(This article belongs to the Special Issue Buildings and Structures under Extreme Loads II)

Abstract

:
When a seismic force acts on bridges, the pier can be damaged by the horizontal inertia force of the superstructure. To prevent this failure, criteria for seismic reinforcement details have been developed in many design codes. However, in moderate seismicity regions, many existing bridges were constructed without considering seismic detail because the detailed seismic design code was only applied recently. These existing structures should be retrofitted by evaluating their seismic performance. Even if the seismic design criteria are not applied, it cannot be concluded that the structure does not have adequate seismic performance. In particular, the performance of a lap-spliced reinforcement bar at a construction joint applied by past practices cannot be easily evaluated analytically. Therefore, experimental tests on the bridge piers considering a non-seismic detail of existing structures need to be performed to evaluate the seismic performance. For this reason, six small scale specimens according to existing bridge piers were constructed and seismic performances were evaluated experimentally. The three types of reinforcement detail were adjusted, including a lap-splice for construction joints. Quasi-static loading tests were performed for three types of scale model with two-column piers in both the longitudinal and transverse directions. From the test results, the effect on the failure mechanism of the lap-splice and transverse reinforcement ratio were investigated. The difference in failure characteristics according to the loading direction was investigated by the location of plastic hinges. Finally, the seismic capacity related to the displacement ductility factor and the absorbed energy by hysteresis behavior for each test were obtained and discussed.

1. Introduction

Detailed seismic design standards have been introduced recently in countries in low to moderate seismicity regions. In the case of Korea, detailed standards for seismic design were established after recognizing the earthquake damage from the Northridge earthquake in the US and the Kobe earthquake in Japan in the 1990s. Therefore, structures constructed before that time cannot be considered to have been secured against earthquakes. In the case of bridges, the mass is concentrated in the superstructure, therefore when a lateral load such as an earthquake is applied, the bridge should withstand the seismic force through the bending behavior of piers. In the case of a single-column pier, a plastic hinge is generated at the bottom of the pier where the bending moment is at its maximum. This plastic hinge must have sufficient ductile capacity and energy absorption capacity to be safe against earthquake loading. Reinforcement details in the plastic hinge section have a great influence on this flexural behavior. In order to have sufficient ductility capacity, the core concrete must be sufficiently confined by transverse reinforcing bars, and the main reinforcing bar should be connected continuously without a lap-splice. However, when the detailed seismic design criteria are not applied, the longitudinal reinforcing bars at the plastic hinge region were often connected by a lap-splice due to the convenience of construction. Therefore, the behavioral characteristics of such lap-spliced longitudinal bars has emerged as a very important issue in the seismic performance evaluation of the existing bridges.
Most studies about the seismic behavior of bridge piers are about the single-column piers because the number of existing single-column pier bridges is much higher than that of multi-column pier bridges. The multi-column piers may show similar behavior in the longitudinal direction of the superstructure to the single-column piers, but it can be expected that the behavior of the multi-column piers in the transverse direction is different from the single-column piers. Therefore, in this study, one of the aims is to verify the seismic performance of multi-column piers in each direction, as well as the reinforcement details.
Since the superstructure of the bridge has a large mass and is located at the same height, it acts as an inertial force concentrated at the top of the pier when an earthquake load is applied. Therefore, the pier behaves as a deformable body that transmits the inertial force of the superstructure. Most of the piers are reinforced concrete, and how much seismic force these piers can withstand in the horizontal direction is a key consideration in seismic design. If the aspect ratio of the pier, that is, the height compared to the cross-sectional dimension, is low, the shear behavior dominates, and if this ratio is large, the bending behavior occurs [1]. In order to avoid such behavior, reinforcement may be necessary to prevent damage, for example, by seismic isolation, in bridges [2]. The pier can withstand the seismic force with its horizontal strength, but when excessive seismic force is applied, sufficient ductile capacity is required.
In order to increase the ductility of reinforced concrete piers that behave in flexure, it is necessary to prevent compressive failure of the concrete in the cross section by bending. For this purpose, core concrete is confined by a transverse reinforcement bar. The confinement effect at the plastic hinge region of the pier column during earthquakes increases seismic capacity due to ductile behavior [3,4]. In the case of installing sufficient transverse reinforcement, considerable flexural ductility is exhibited while maintaining the load resistance capacity even after the plastic hinge occurs [5,6]. Even if the transverse reinforcement bar ratio is the same, if the spacing is small, the confinement effect increases [7]. Therefore, the horizontal reinforcement ratio is an important variable in seismic detail. This confinement effect can be expressed by transverse reinforcing bars, but can also be implemented through appropriate techniques such as fiber straps [8,9].
The transverse reinforcing bars of reinforced concrete columns contribute to the confinement effect to increase ductility during bending behavior. For this, the transverse reinforcing bar must withstand the tensile force. However, since transverse reinforcing bars are difficult to make into continuous reinforcing bars, they are traditionally composed of columnar hoops and cross ties. In this case, the design details of hoops and cross ties are very important, and an experimental study has been conducted on this [10,11,12]. In order to improve this, spiral reinforcement detail using a continuous transverse reinforcing bar is applied, so it has very high ductility [13,14].
In addition, the longitudinal reinforcement bar must withstand the tension in the bending section. However, it is difficult to connect the longitudinal reinforcement bars from the foundation to the bottom of the pier continuously during construction; the longitudinal reinforcement bars used to be lap-spliced. Since the bottom of the pier is the part where the plastic hinge occurs, a large tensile force acts on the longitudinal reinforcement bar, and if this part is lap-spliced, bond failure is likely to occur [15,16,17,18,19]. For the occurrence of bonding failure of the lab splice reinforcing bar, the effect of various parameters such as longitudinal bar size and length, amount of transverse reinforcing bars and concrete compressive strength were experimentally studied [20]. In order to prevent the bond failure of the lap-splice, confinement should be increased, and research on improvement methods for this was also conducted [21,22,23].
Studies on seismic detail in the plastic hinge region have been performed on single-column piers. However, there are many multi-column piers, and their behavior is different from that of single-column piers. Studies on the fracturing of beam–column junctions of multi-column piers with relatively weak cap beams or shear failure of the cap beam [24], a study on the reinforcement method of the cap beam [25], and a study on the design guidelines for multicolumn piers [26] were performed. Since the behavior of multi-column piers is different in both directions, it is necessary to evaluate the behavior characteristics of each direction experimentally. The bidirectional experiment can be performed as a shaking table experiment [27]. However, in order to know the seismic capacity in each direction, an experiment on the horizontal load in each direction is required.
Referring to these existing studies, it is shown that the seismic capacity of the columns with lap-splices is very low and varies according to the details of the transverse reinforcing bar. However, for multi-column piers, seismic performance evaluation is required for these details of the reinforcing bars for each loading direction. Therefore, in this study, the seismic performance of two-column piers is evaluated experimentally.

2. Test Model of Multi-Column Bridge Piers

2.1. Test Specimens

Three sets of test specimens were constructed. They were designed to be one-fourth-scale models of the existing two-column piers on Korean highways. The height of prototype is determined to be 12 m to induce flexural failure for transverse direction loading. The diameter of the column section of scale model is 500 mm and the height is 3000 mm. In the case of the scale model, reinforcement with a diameter of 10 mm was used for the longitudinal reinforcement due to the limitations of size of commercial reinforcement bar. Instead, the reinforcement bar ratio was the same for the full-scale model and the one-fourth-scale model as 1.174%. For the lateral reinforcement, a reinforcement bar with a diameter of 4 mm was fabricated. The concrete strength was 24 MPa, which is the same value applied to the prototype model. Therefore, it is judged that the Young’s modulus as determined by the concrete strength was similar between the scale model and prototype. However, the geometrical mix design of the concrete could not be properly scaled because of commercial concrete limitations. The properties of the test specimens are summarized in Table 1, and Figure 1 illustrates the geometry of the test specimen.
The characteristics of 6 test specimens are described in Table 2. The test specimen was composed of two specimens as a set so that the behavior characteristics in the longitudinal direction and the transverse direction to the superstructure could be investigated. Additionally, 3 different reinforcement details were applied for each specimen set. The first specimen (RH-NS) has the same reinforcement details as existing bridge piers. The second specimen (RH-SL) has different reinforcement bar details. For this specimen, the number of lap-spliced longitudinal reinforcement bars in the plastic hinge region was the half of the total number of longitudinal reinforcement bars, and the transverse reinforcing bar was installed with 1/2 of the amount required by the seismic design regulations. The third specimen used continuous longitudinal reinforcing bars without a lap-splice, and a minimal amount of transverse reinforcing bars was installed to prevent local buckling of the main reinforcing bars.
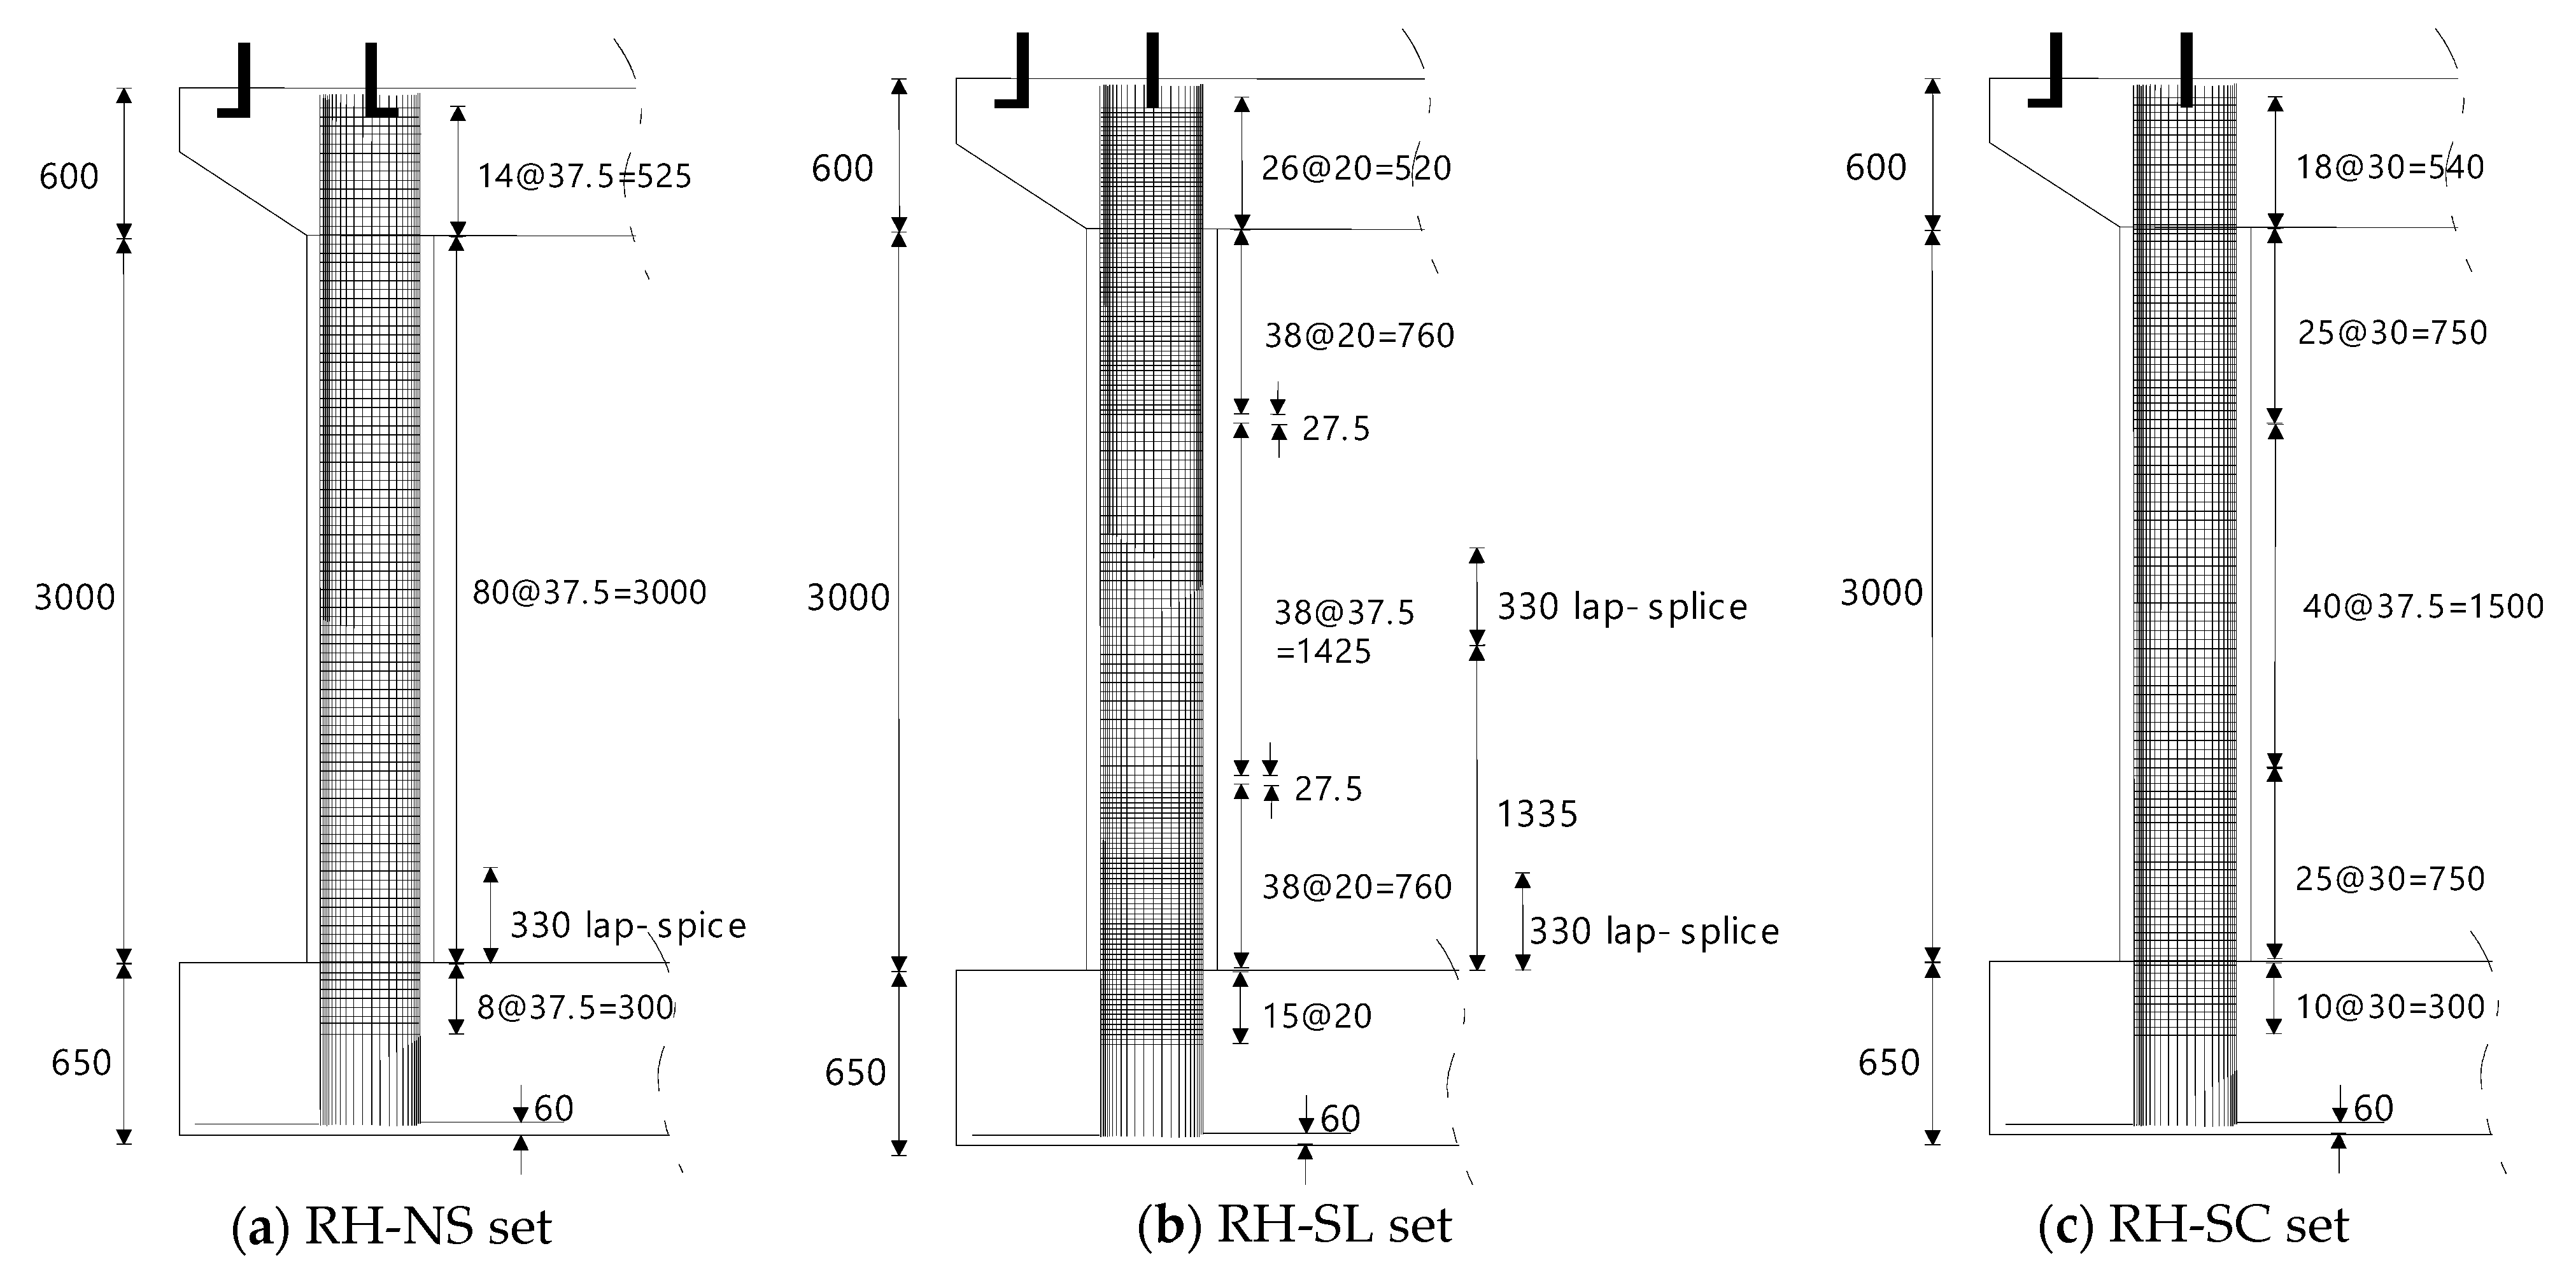
The reinforcement details for each set are shown in Figure 2. Each specimen of the RH-NS set was designed as a prototype without any consideration of seismic performance. For the RH-SL set, the volumetric transverse reinforcement ratio for this set is 50% of what is required by AASHTO (American association of state highway and transportation officials) specifications [28]. The volumetric transverse reinforcement ratio is defined as the ratio of the volume of the transverse reinforcing bar to the volume of the concrete confined by it. In case of the RH-SC set, minimum lateral reinforcement was used to prevent the local buckling of the longitudinal reinforcement.
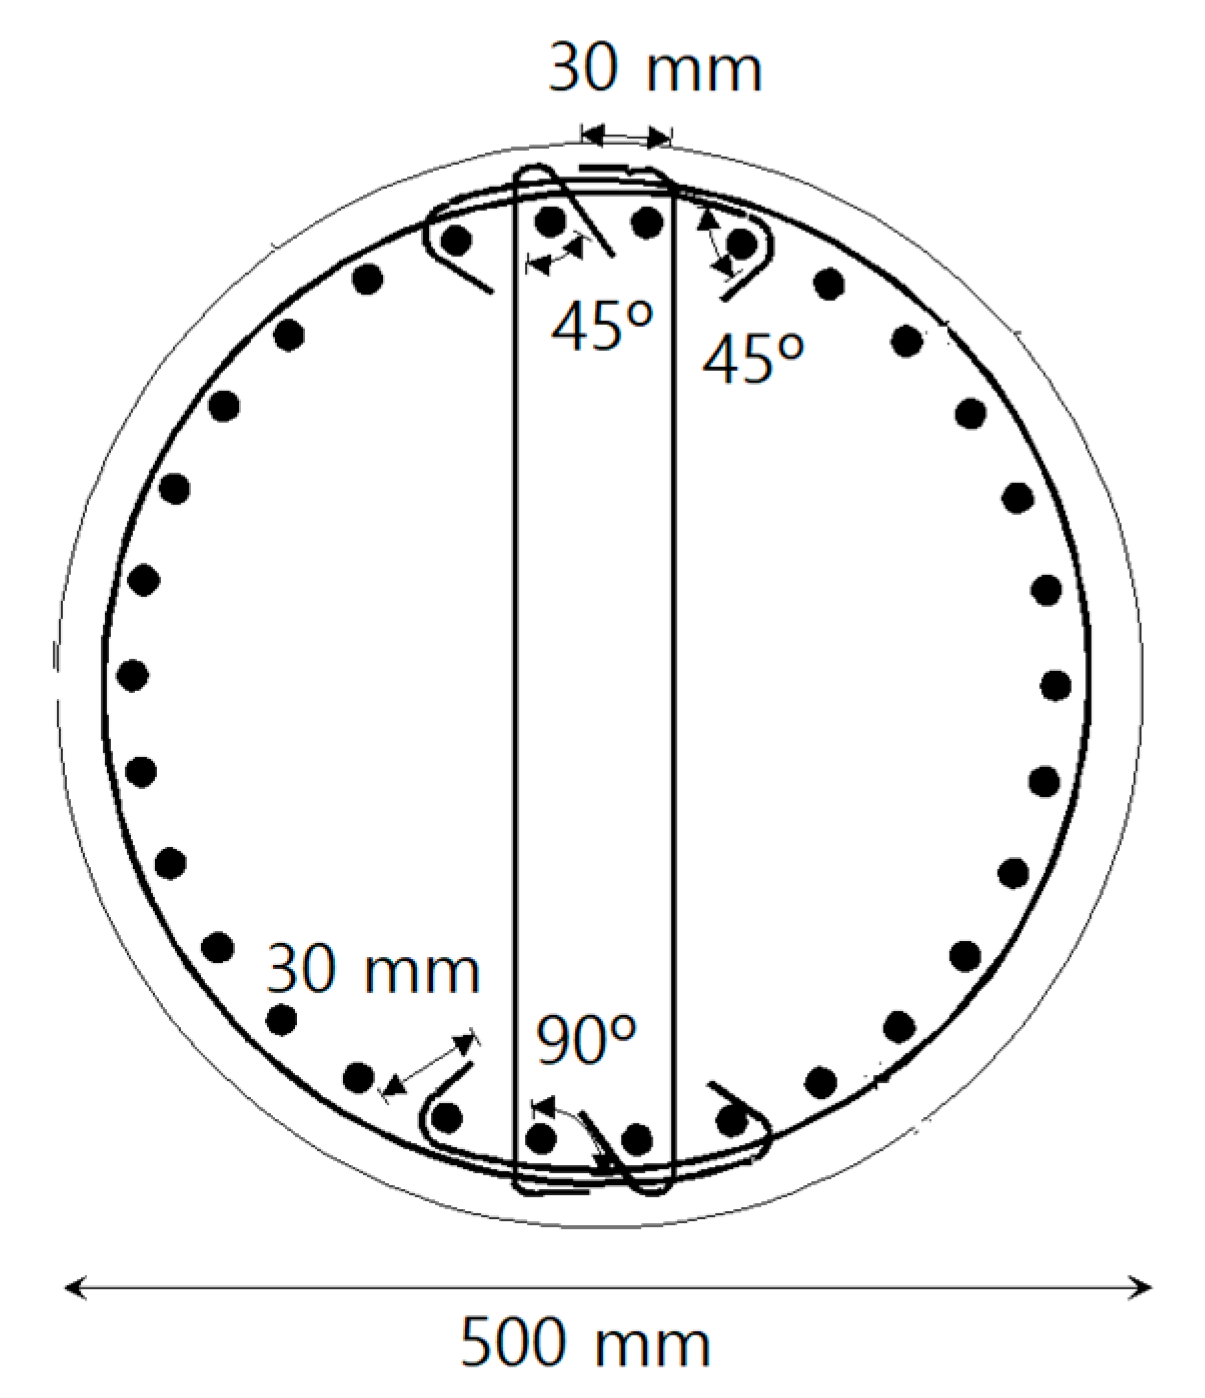
The volumetric transverse reinforcement ratio was 0.268% for the RH-NS set. For the RH-SL set and the RH-SC set, the volumetric transverse reinforcement ratio in the lower and higher regions was 0.503% and 0.335%, respectively. The volumetric transverse reinforcement for these sets was 0.268% except for these regions. For the lateral confinement, two bars of semicircle were used with 135-degree hooks and augmented with two cross ties with a 135-degree hook and a 90-degree hook, as in Figure 3. The cross ties were used in the longitudinal direction and the transverse direction in turns.
The longitudinal reinforcements were lap-spliced up to 330 mm from the bottom for the RH-NS set. Only 50% of the longitudinal bars were lap-spliced in the lower region and 50% in the middle region for the RH-SL set. In the case of the RH-SC set, the longitudinal reinforcements were extended from the foundation to the top continuously without any lap-splicing. Each set consists of two specimens, one for longitudinal direction loading and the other for transverse direction loading.

2.2. Test Setup

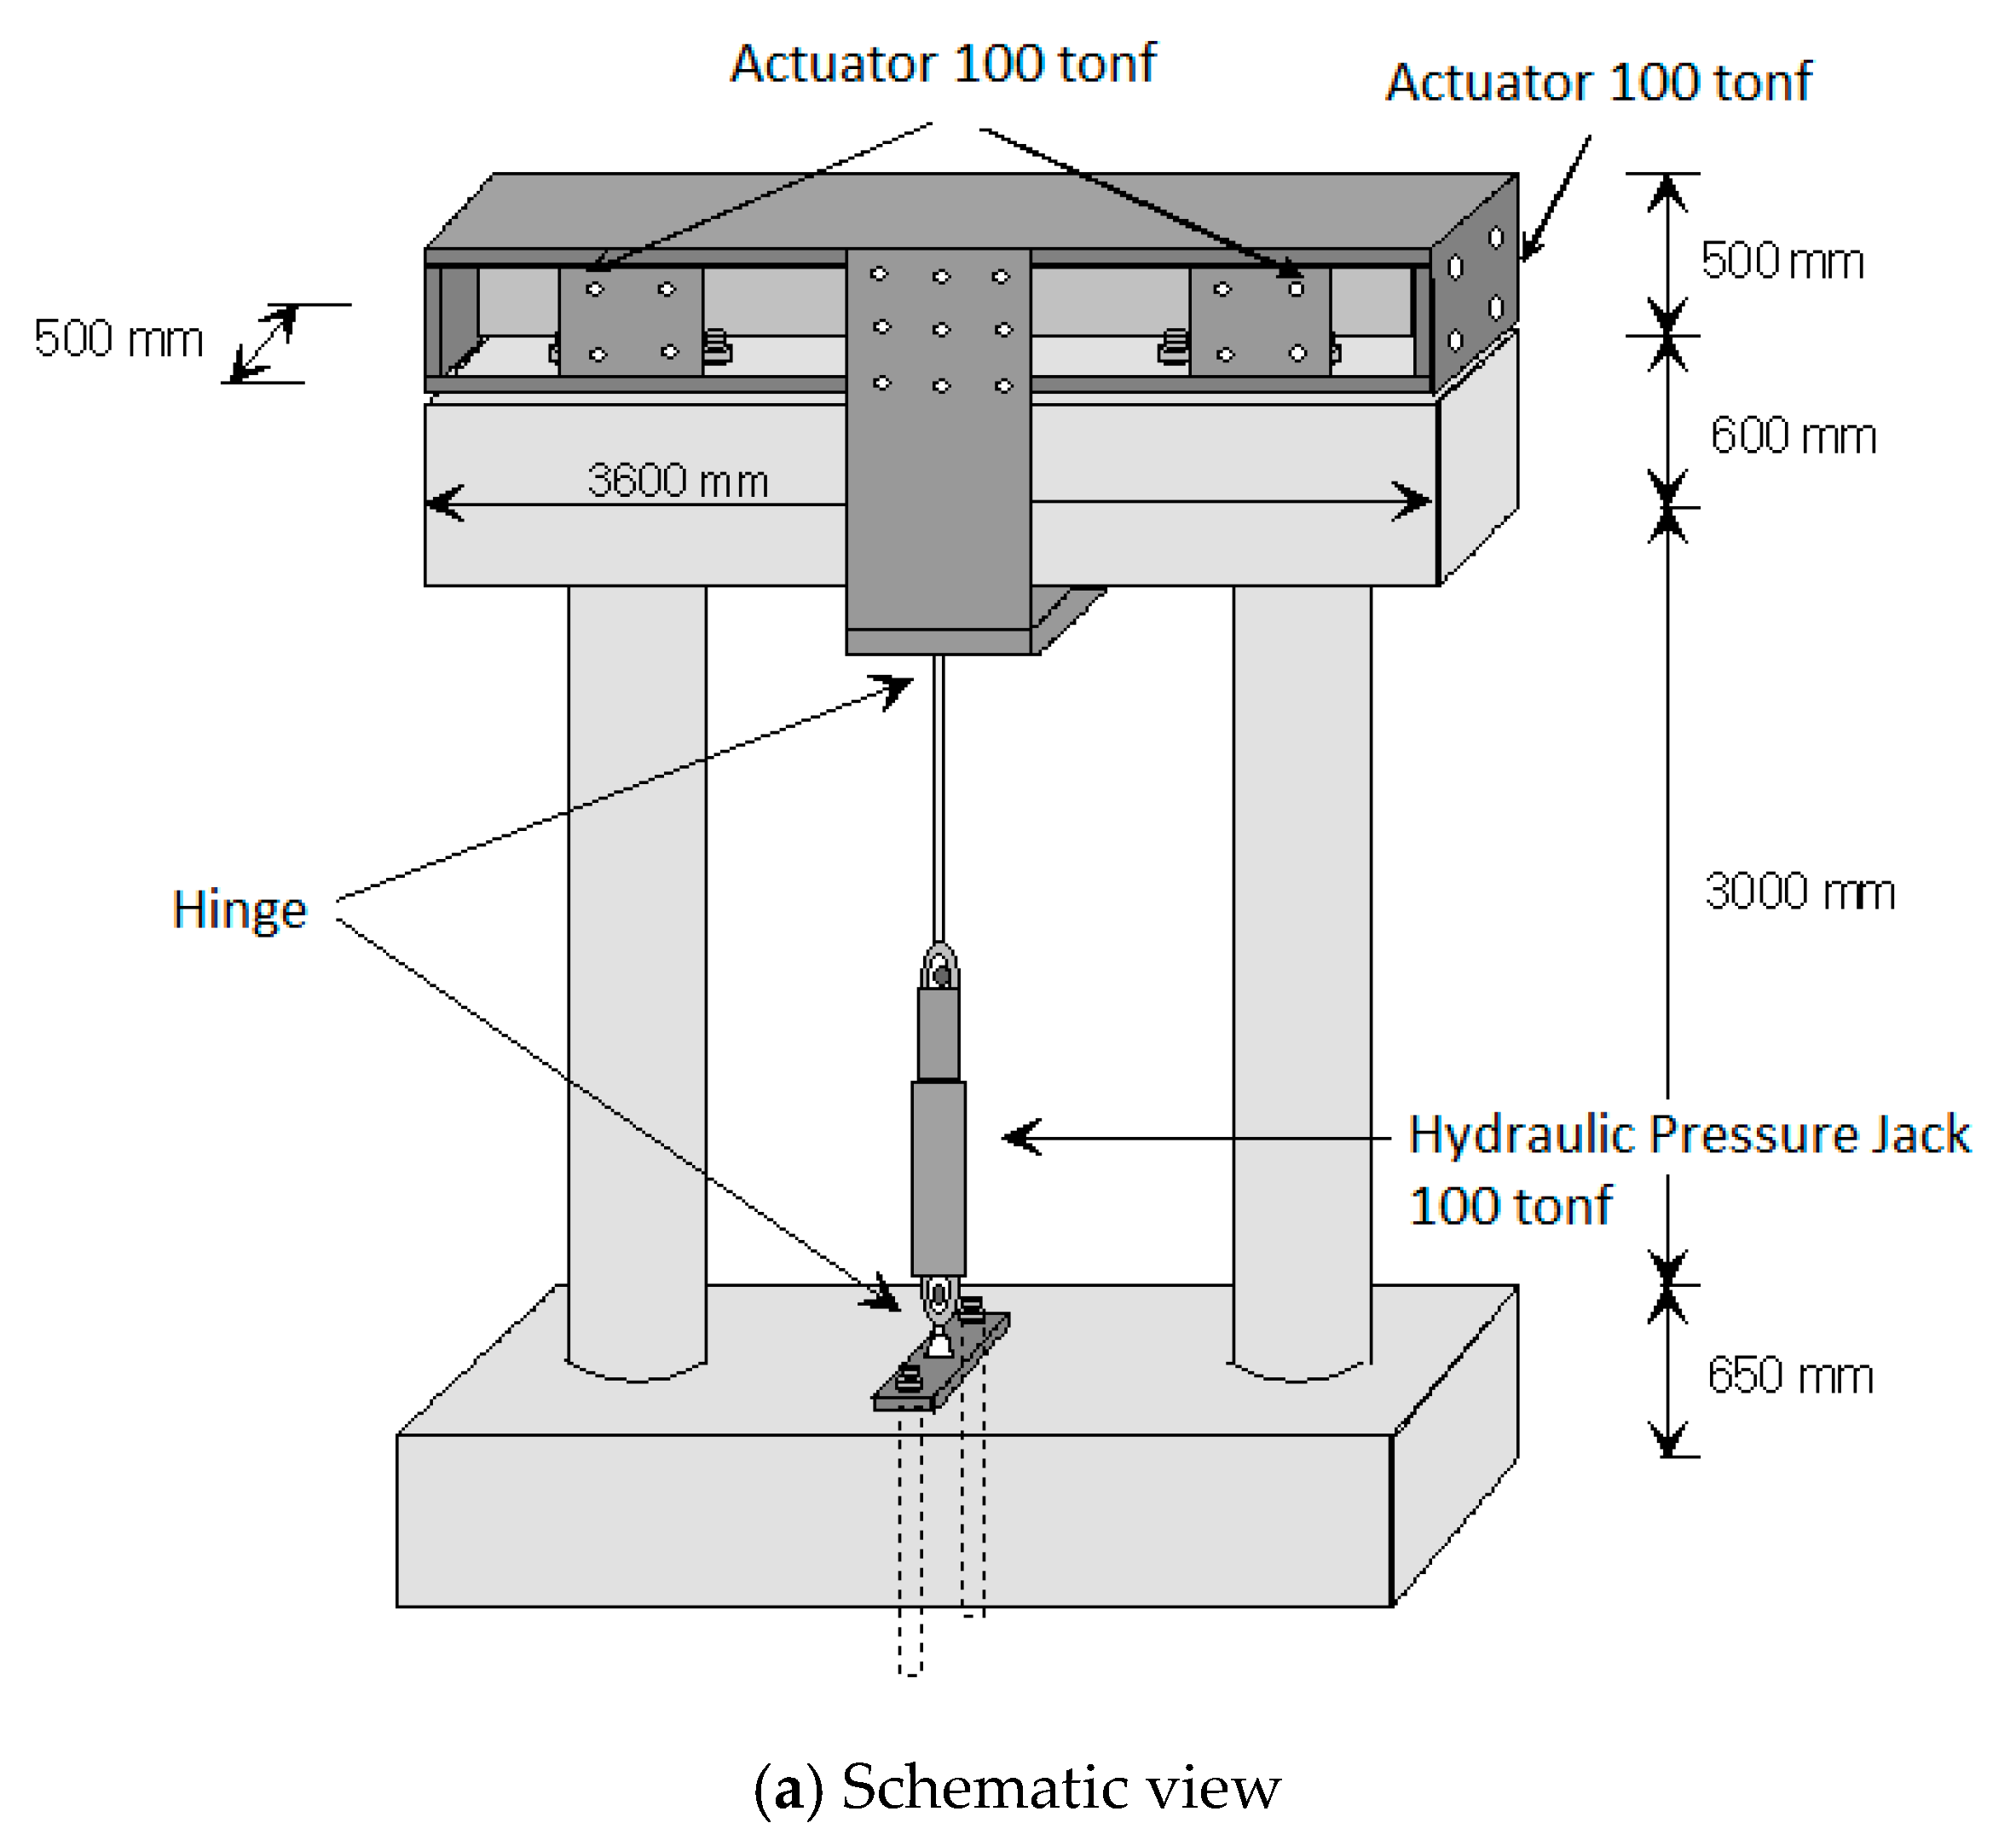
The axial force was applied with a hydraulic pressure jack. Axial force was determined to be 5.2% of the compressive stress of the concrete of the columns, which corresponds with existing bridge structures. The lateral loading was applied with an actuator of 1000 kN (100 tonf) capacity. When longitudinal direction loading was applied, 2 actuators were set and controlled with displacement to prevent torsional behavior. The height at which the horizontal load corresponded to the inertia force of the superstructure was reflected in the existing bridge model. The height from the foundation to the point of loading is 3850 mm, therefore the aspect ratio is 7.7 for longitudinal direction. The aspect ratio for the transverse direction is 3.0 because only column parts are considered to be deformed by rigid joints at both the top and bottom ends. Figure 4 shows the installation of the test specimen for longitudinal loading and transverse loading.

2.3. Loading Protocol

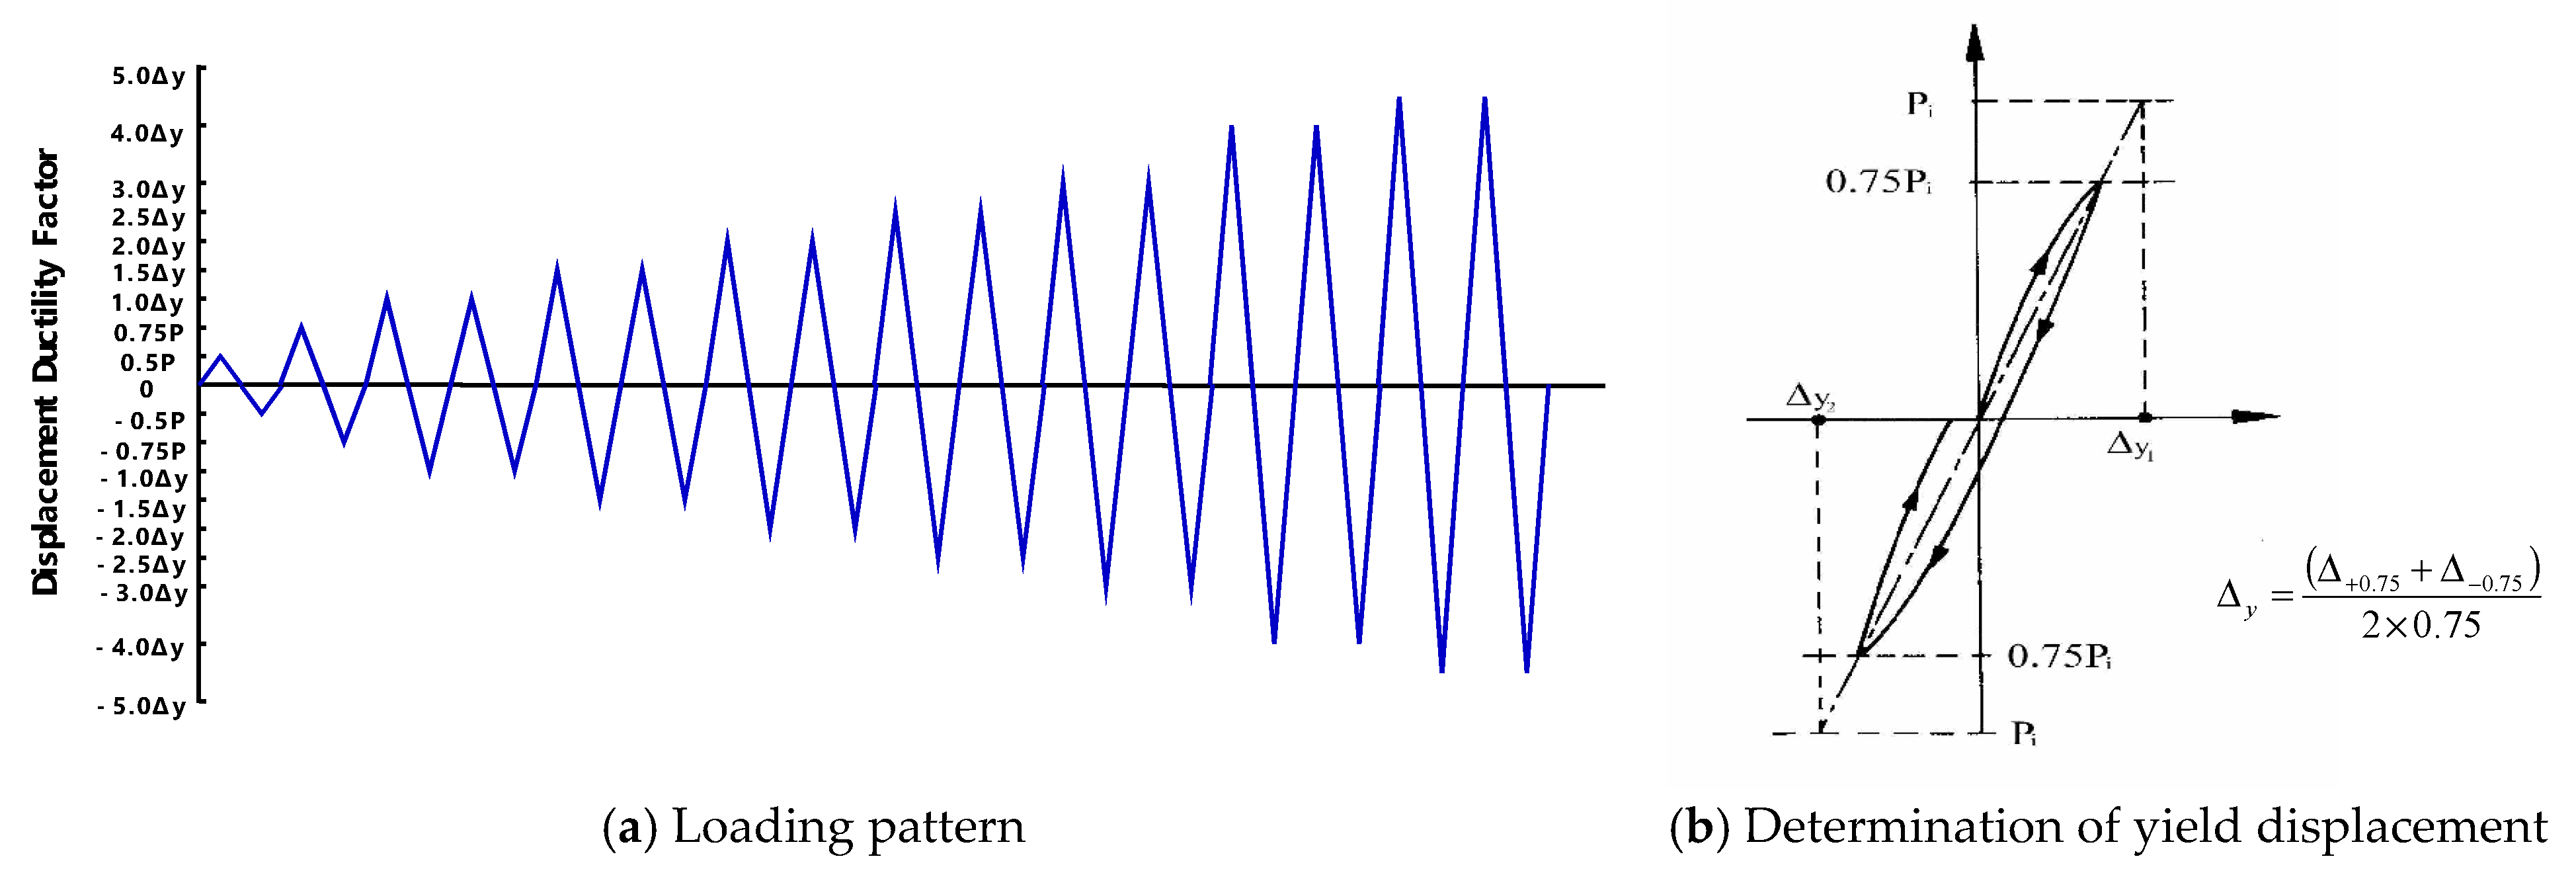
The load patterns are illustrated schematically in Figure 5. The formula proposed in Equation (1) was used to determine the yielding displacement [29].
Δ y = Δ + 0.75 + Δ 0.75 2 × 0.75
The lateral strength P i is obtained from analysis at the ultimate compressive strain of 0.003. The displacements Δ + 0.75 and Δ 0.75 are displacements when the load 0.75 P i is applied in the push and pull directions, respectively. For the comparison of each specimen, the yield displacement was assigned the same value in spite of the differences in reinforcement detail. At the small displacement level of 1.0 Δ y ~ 3.0 Δ y , the loading displacement was applied in 0.5 Δ y increments. Two cycles were applied at each loading step. After the 3.0 Δ y displacement level, the load was applied in 1.0 Δ y increments until failure. The displacement was applied at a low speed that was close to the static load. Therefore, during the test, pictures could be taken at each loading step and cracks were checked.
Data on load histories were obtained from the load cell in the actuator. The displacement was measured with wire-type LVDT at the cap beam. To measure the curvature of each column, clip gauges were instrumented in pairs on the front and back faces in the loading direction. Since the plastic hinge region is generally up to a height corresponding to the cross-sectional diameter, it was attached to the position corresponding to this height. The heights at which the clip gauges were instrumented were 100 mm, 300 mm, 500 mm, and 700 mm from the foundation or the cap beam. After measuring the strain on both sides of the column using clip gauges, the strain difference was divided by the cross-sectional diameter to convert it into curvature.

3. Seismic Behavior of Specimens

3.1. Longitudinal Loading Test

3.1.1. Failure Mode of Longitudinal Loading Specimen

Figure 6 shows an image of the failure of the longitudinal loading specimens. In the case of the RH-NS-L specimen, concrete cracks hardly occurred up to the height of 330 mm when the loading was applied corresponding to the yield displacement because the ratio of the longitudinal reinforcement was twice that of the other heights by the lap-splicing of the longitudinal reinforcement bars. At 1.5 Δ y , the construction joint at the bottom began to crack. At 3.5~4.0 Δ y , the crack in the construction joint was intensified and the concrete adjacent to the foundation was gradually damaged by compression. At 5.0 Δ y , the buckling of the reinforcing bar was observed, and spalling occurred. In general, longitudinal reinforcing bars resist tensile forces in flexural members. However, when the surrounding concrete undergoes compression failure, the longitudinal reinforcing bar at the compression section may buckle. In addition, the shear force of the transverse load could cause the longitudinal reinforcing bar itself to bend and contribute to the damage.
In the case of the RH-SL-L specimen, since the longitudinal reinforcement ratio of the lap-splice region was relatively smaller than that of the RH-NS-L specimen, cracks occurred earlier at the bottom. At 6.0 Δ y , spalling of the compression part was intensified and the concrete cover began to fall off severely. In the case of the RH-SC-L specimen, several cracks occurred even under 350 mm because the ratio of the longitudinal reinforcement was the same for all sections. At 7.0 Δ y , the transverse reinforcement bar at the bottom was deformed due to the buckling of the longitudinal reinforcing bar. However, the gap between the transverse reinforcement bars was determined to prevent buckling of the longitudinal reinforcement bars, so excessive buckling did not occur.
Generally, if the longitudinal bars are lap-spliced in the plastic hinge region, the flexural member is very vulnerable to repeated horizontal loads such as seismic loads. The longitudinal bars do not transmit tensional force and are expected to be damaged by lap-splice bond failure. However, it was observed in this study that the specimens loaded in the longitudinal direction failed through flexural failure at the bottom. The lap-spliced length of longitudinal bars in the scaled specimens was determined in proportion to the diameter of the longitudinal bars, which is larger than the diameter from the scale factor. There was a possibility that the lap-splice was extended to the non-plastic hinge zone, which induced the flexural failure. Another possible reason for flexural failure is the detailing of lateral reinforcements. The minimum volumetric reinforcement ratio for preventing lap-splice bond failure is calculated to be 0.279%. In this study, the volumetric reinforcement ratio of all specimens is almost equal to or larger than this value. The shear friction of confined core concrete by the lateral reinforcements prevented the bond failure of the lap-splice. Additionally, the hooks of the lateral reinforcement and cross ties in the specimens can confine the core concrete [30].
Figure 7 shows the distribution of curvature along the height from the bottom of the column for the longitudinal loading test specimen. The lap-splice of longitudinal reinforcements increases the longitudinal reinforcement ratio. Because lap-splices increase the longitudinal reinforcement ratio, the curvature of the corresponding region decreases. Therefore, the RH-NS-L specimen has the smallest curvature and the RH-SC-L specimen has the largest curvature. This does not mean that the RH-NS-L specimen does not have small amounts of damage, but it does mean that the damage is concentrated in the lowermost part, where the curvature was not measured.

3.1.2. Hysteresis Curve of Longitudinal Loading Specimen

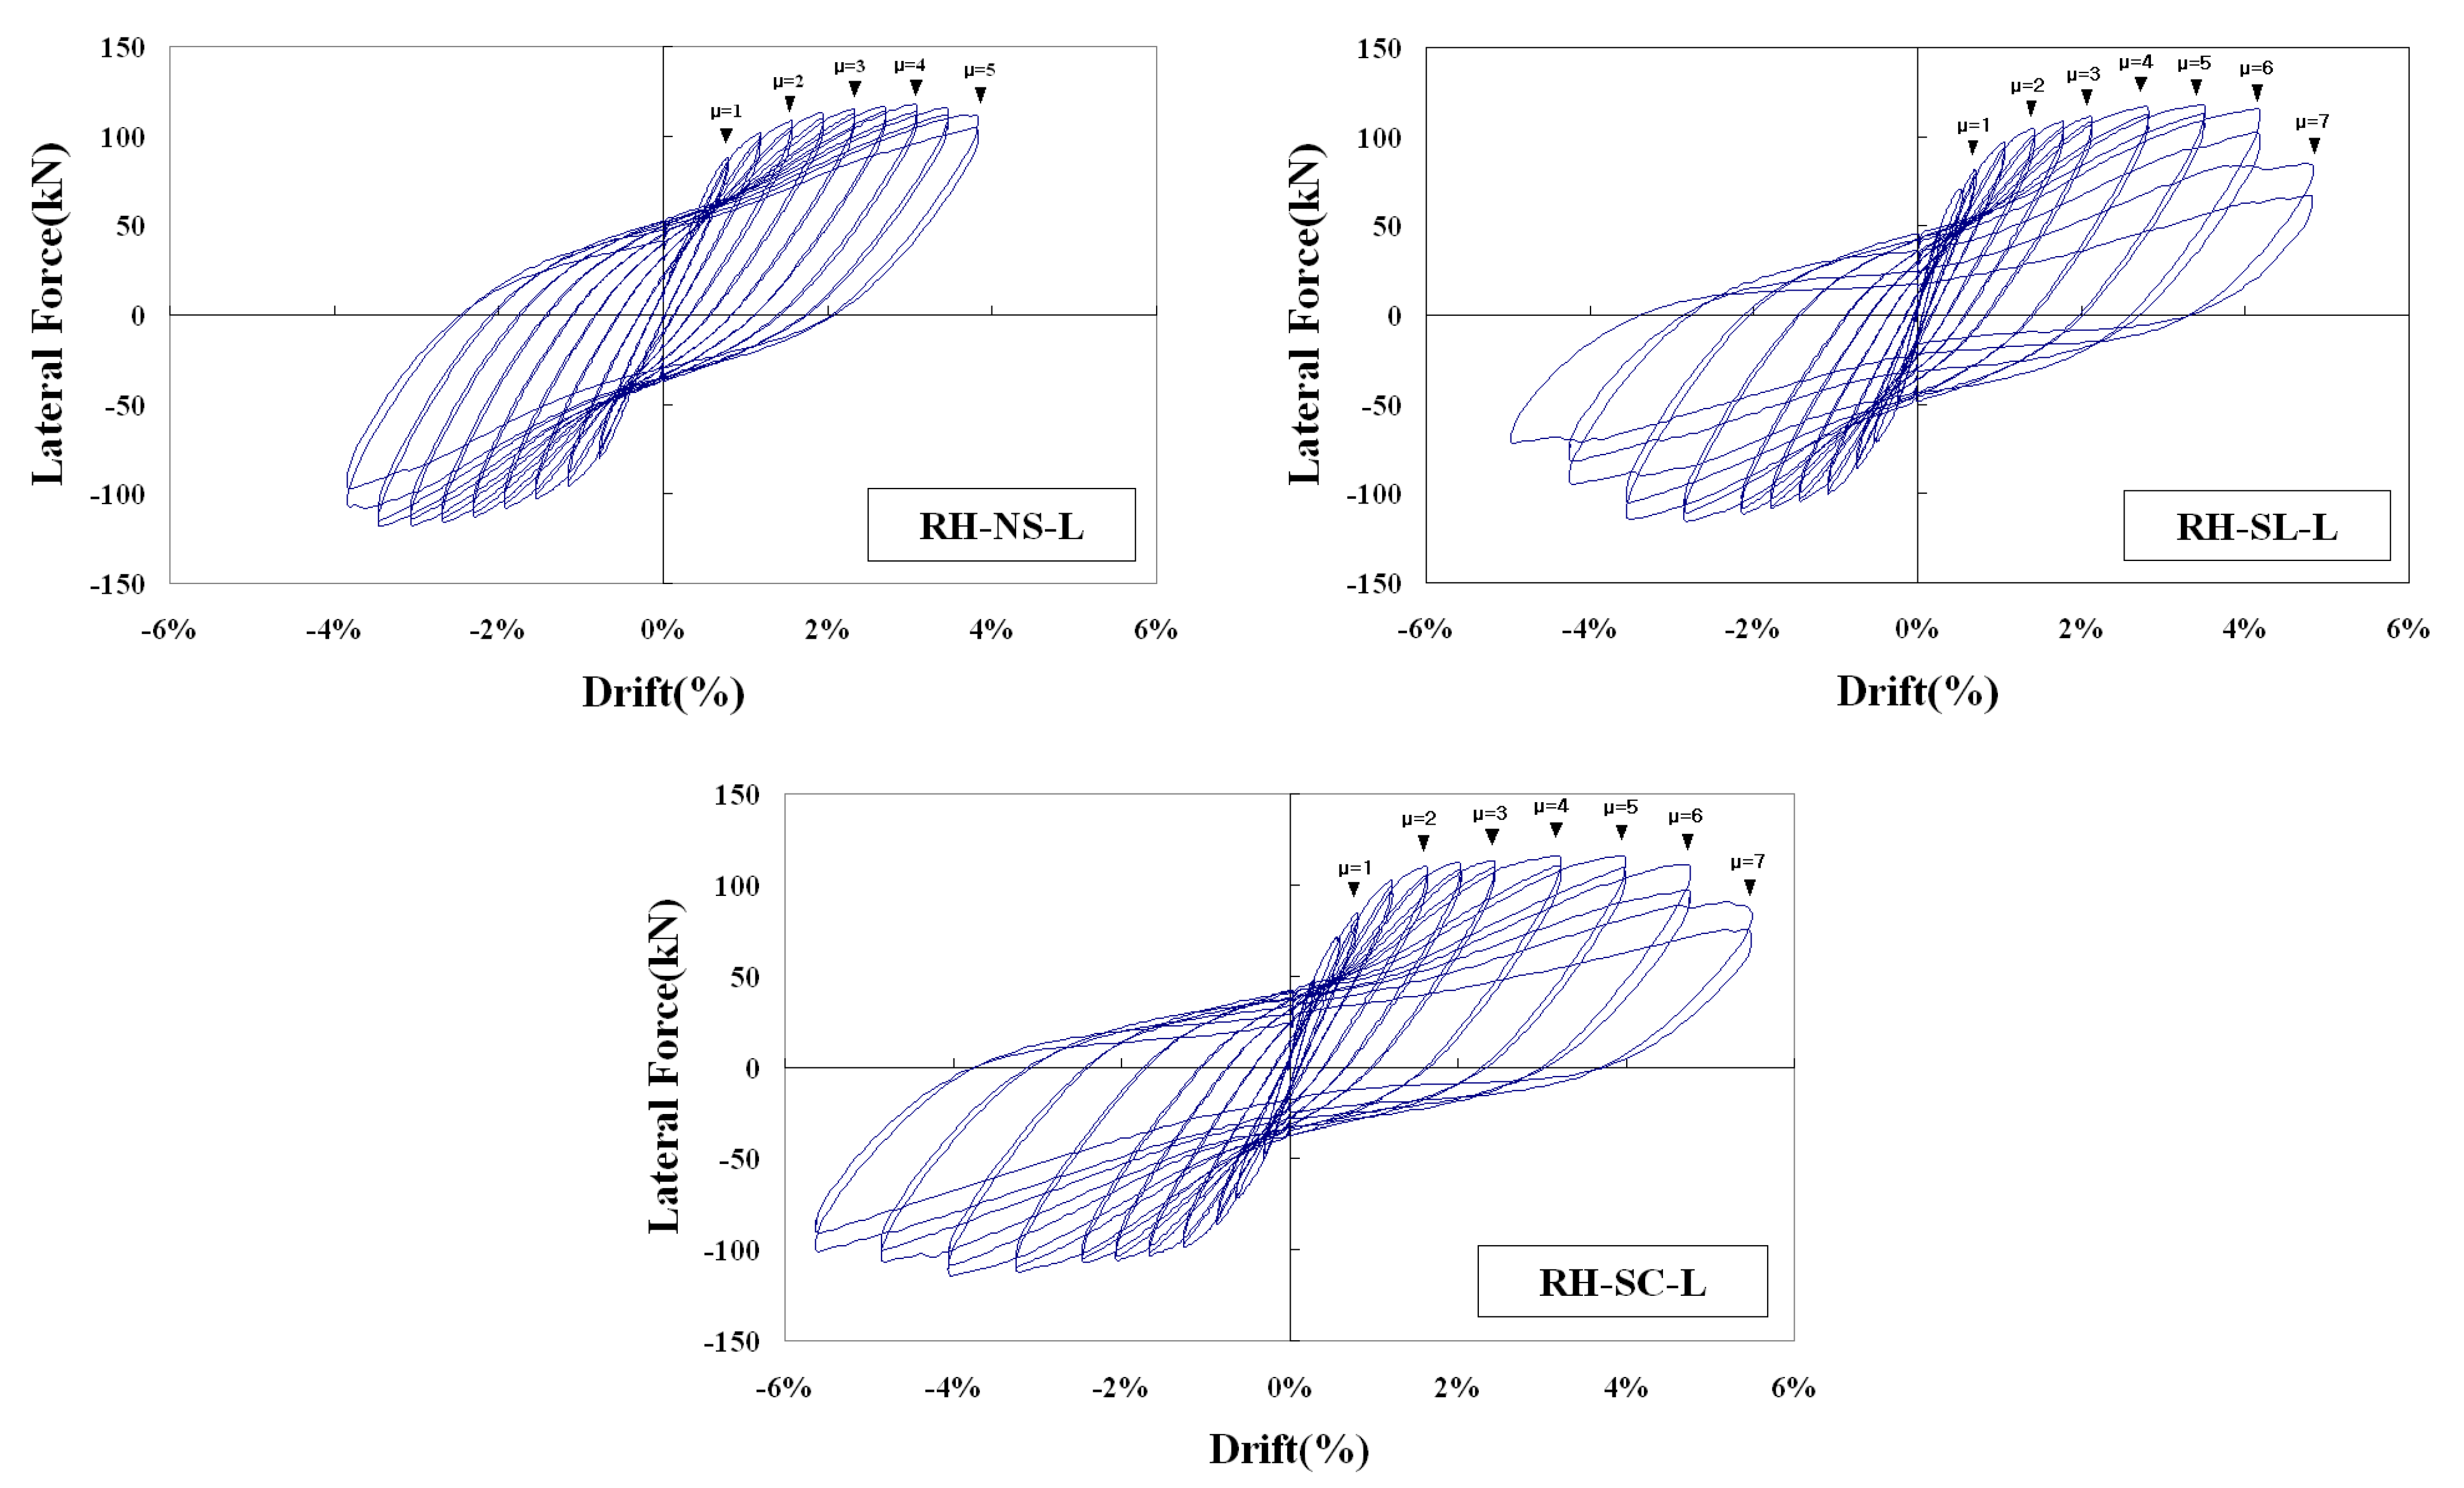
Figure 8 shows the load-drift ratio hysteresis curve of the longitudinal loading specimens. For the RH-NS-L specimen, even after the maximum load, it shows a relatively smooth decrease in the hysteresis curve. According to the results of various experiments performed so far, it is expected that the non-ductile behavior will occur due to the bond failure of the reinforcement bar. However, in this test, even if the hysteresis curve goes up to 5.0 Δ y , it can be seen that the curve is almost stable. This is because there was no slip between the reinforcement bars raised from the foundation and the column reinforcement bars, and fracturing occurred like with the continuous reinforcement bars. The load-drift ratio curve of RH-SL-L specimen shows a very stable hysteresis up to a ductility of 6.0. It shows more stable behavior than the RH-SL-L specimen because larger a transverse reinforcement ratio affected the confinement of the core concrete. In the load-drift ratio curve for RH-SC-L, displacement ductility at the maximum load capacity was 5.3 Δ y and the fracture ductility was 6.6 Δ y . This test specimen shows the most stable hysteresis curve because no lap-splicing of the reinforcing bars was applied.
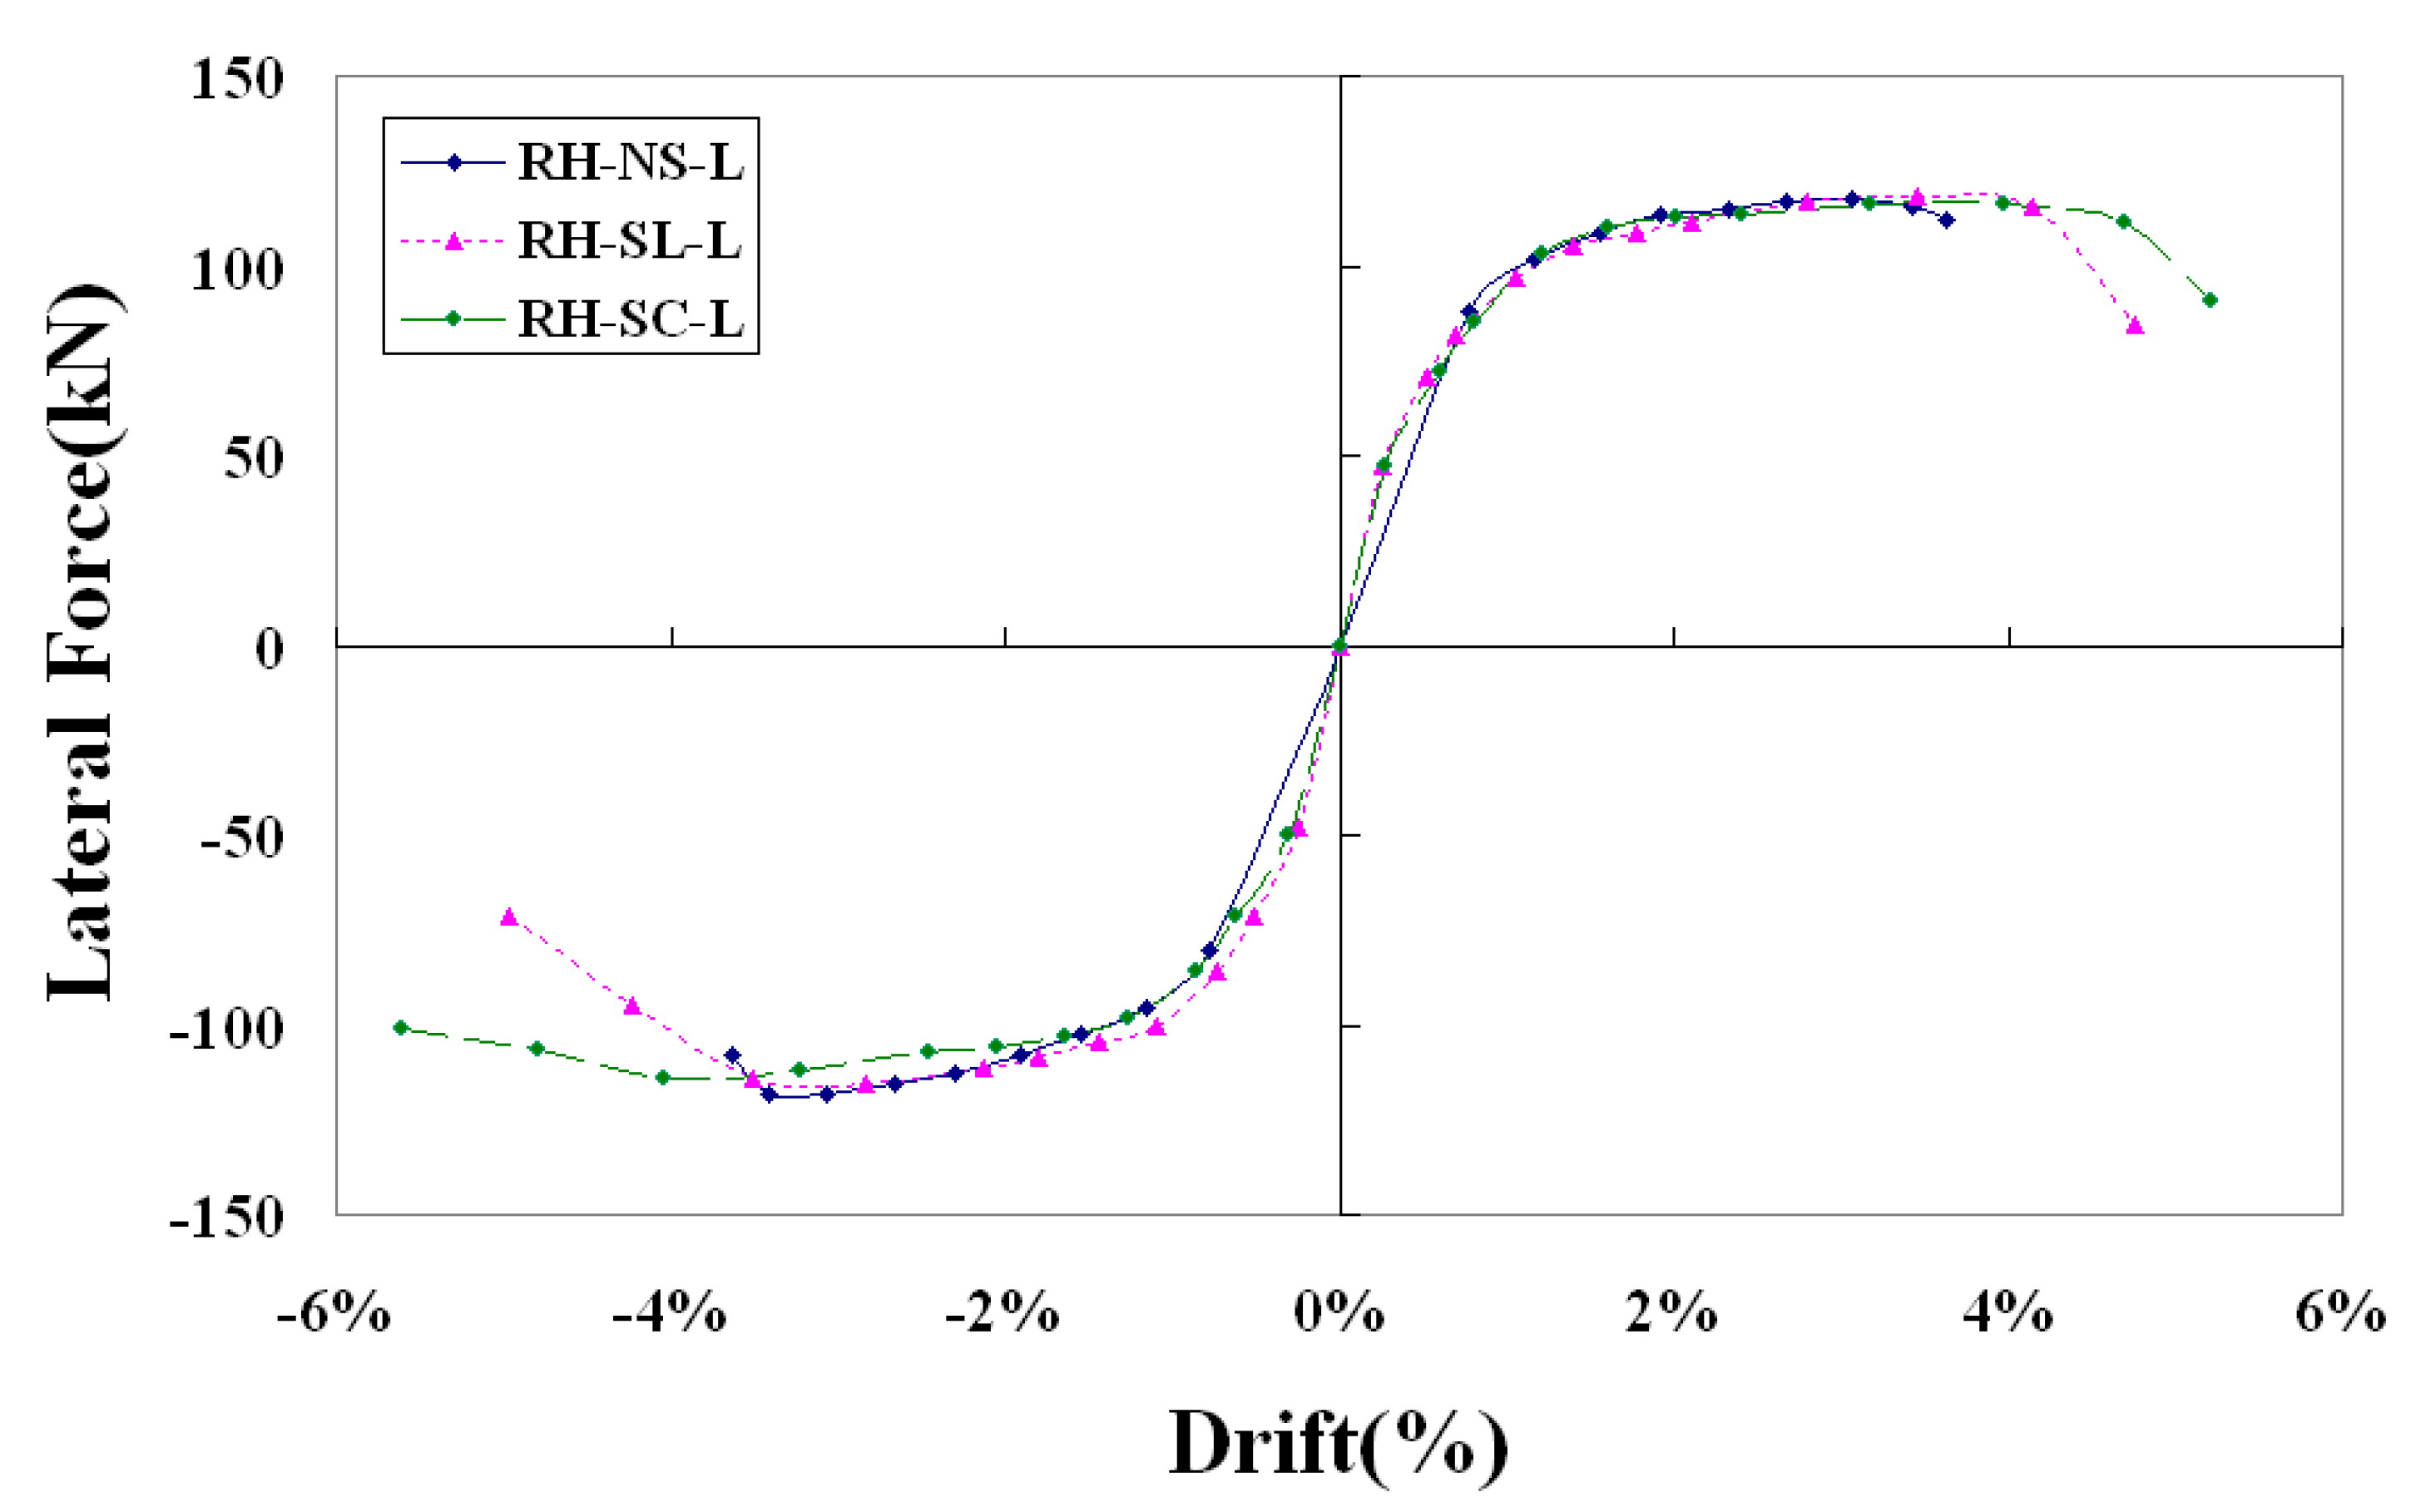
Figure 9 compares the envelope curve of the hysteresis loop for each longitudinal loading specimen. As can be seen in the figure, there was little difference in the load carrying capacity of each specimen. There was a slight difference in the displacement at failure. This is estimated to be the effect of the curvature according to the lap-splice of the reinforcing bars on the ductility. In general, because lap-slice bond failure occurs, lap-spliced specimens have remarkably low ductility. However, if bond failure does not occur, the lap-spliced section has twice the longitudinal reinforcing bar ratio, resulting in less flexural deformation. Failure will occur at the bottom section of the lap-spliced range. In this section, the longitudinal reinforcing bar ratio is the same without the lap-splice, so the strength of the member does not change significantly.

3.2. Transverse Loading Test

3.2.1. Failure Mode of Transverse Loading Specimen

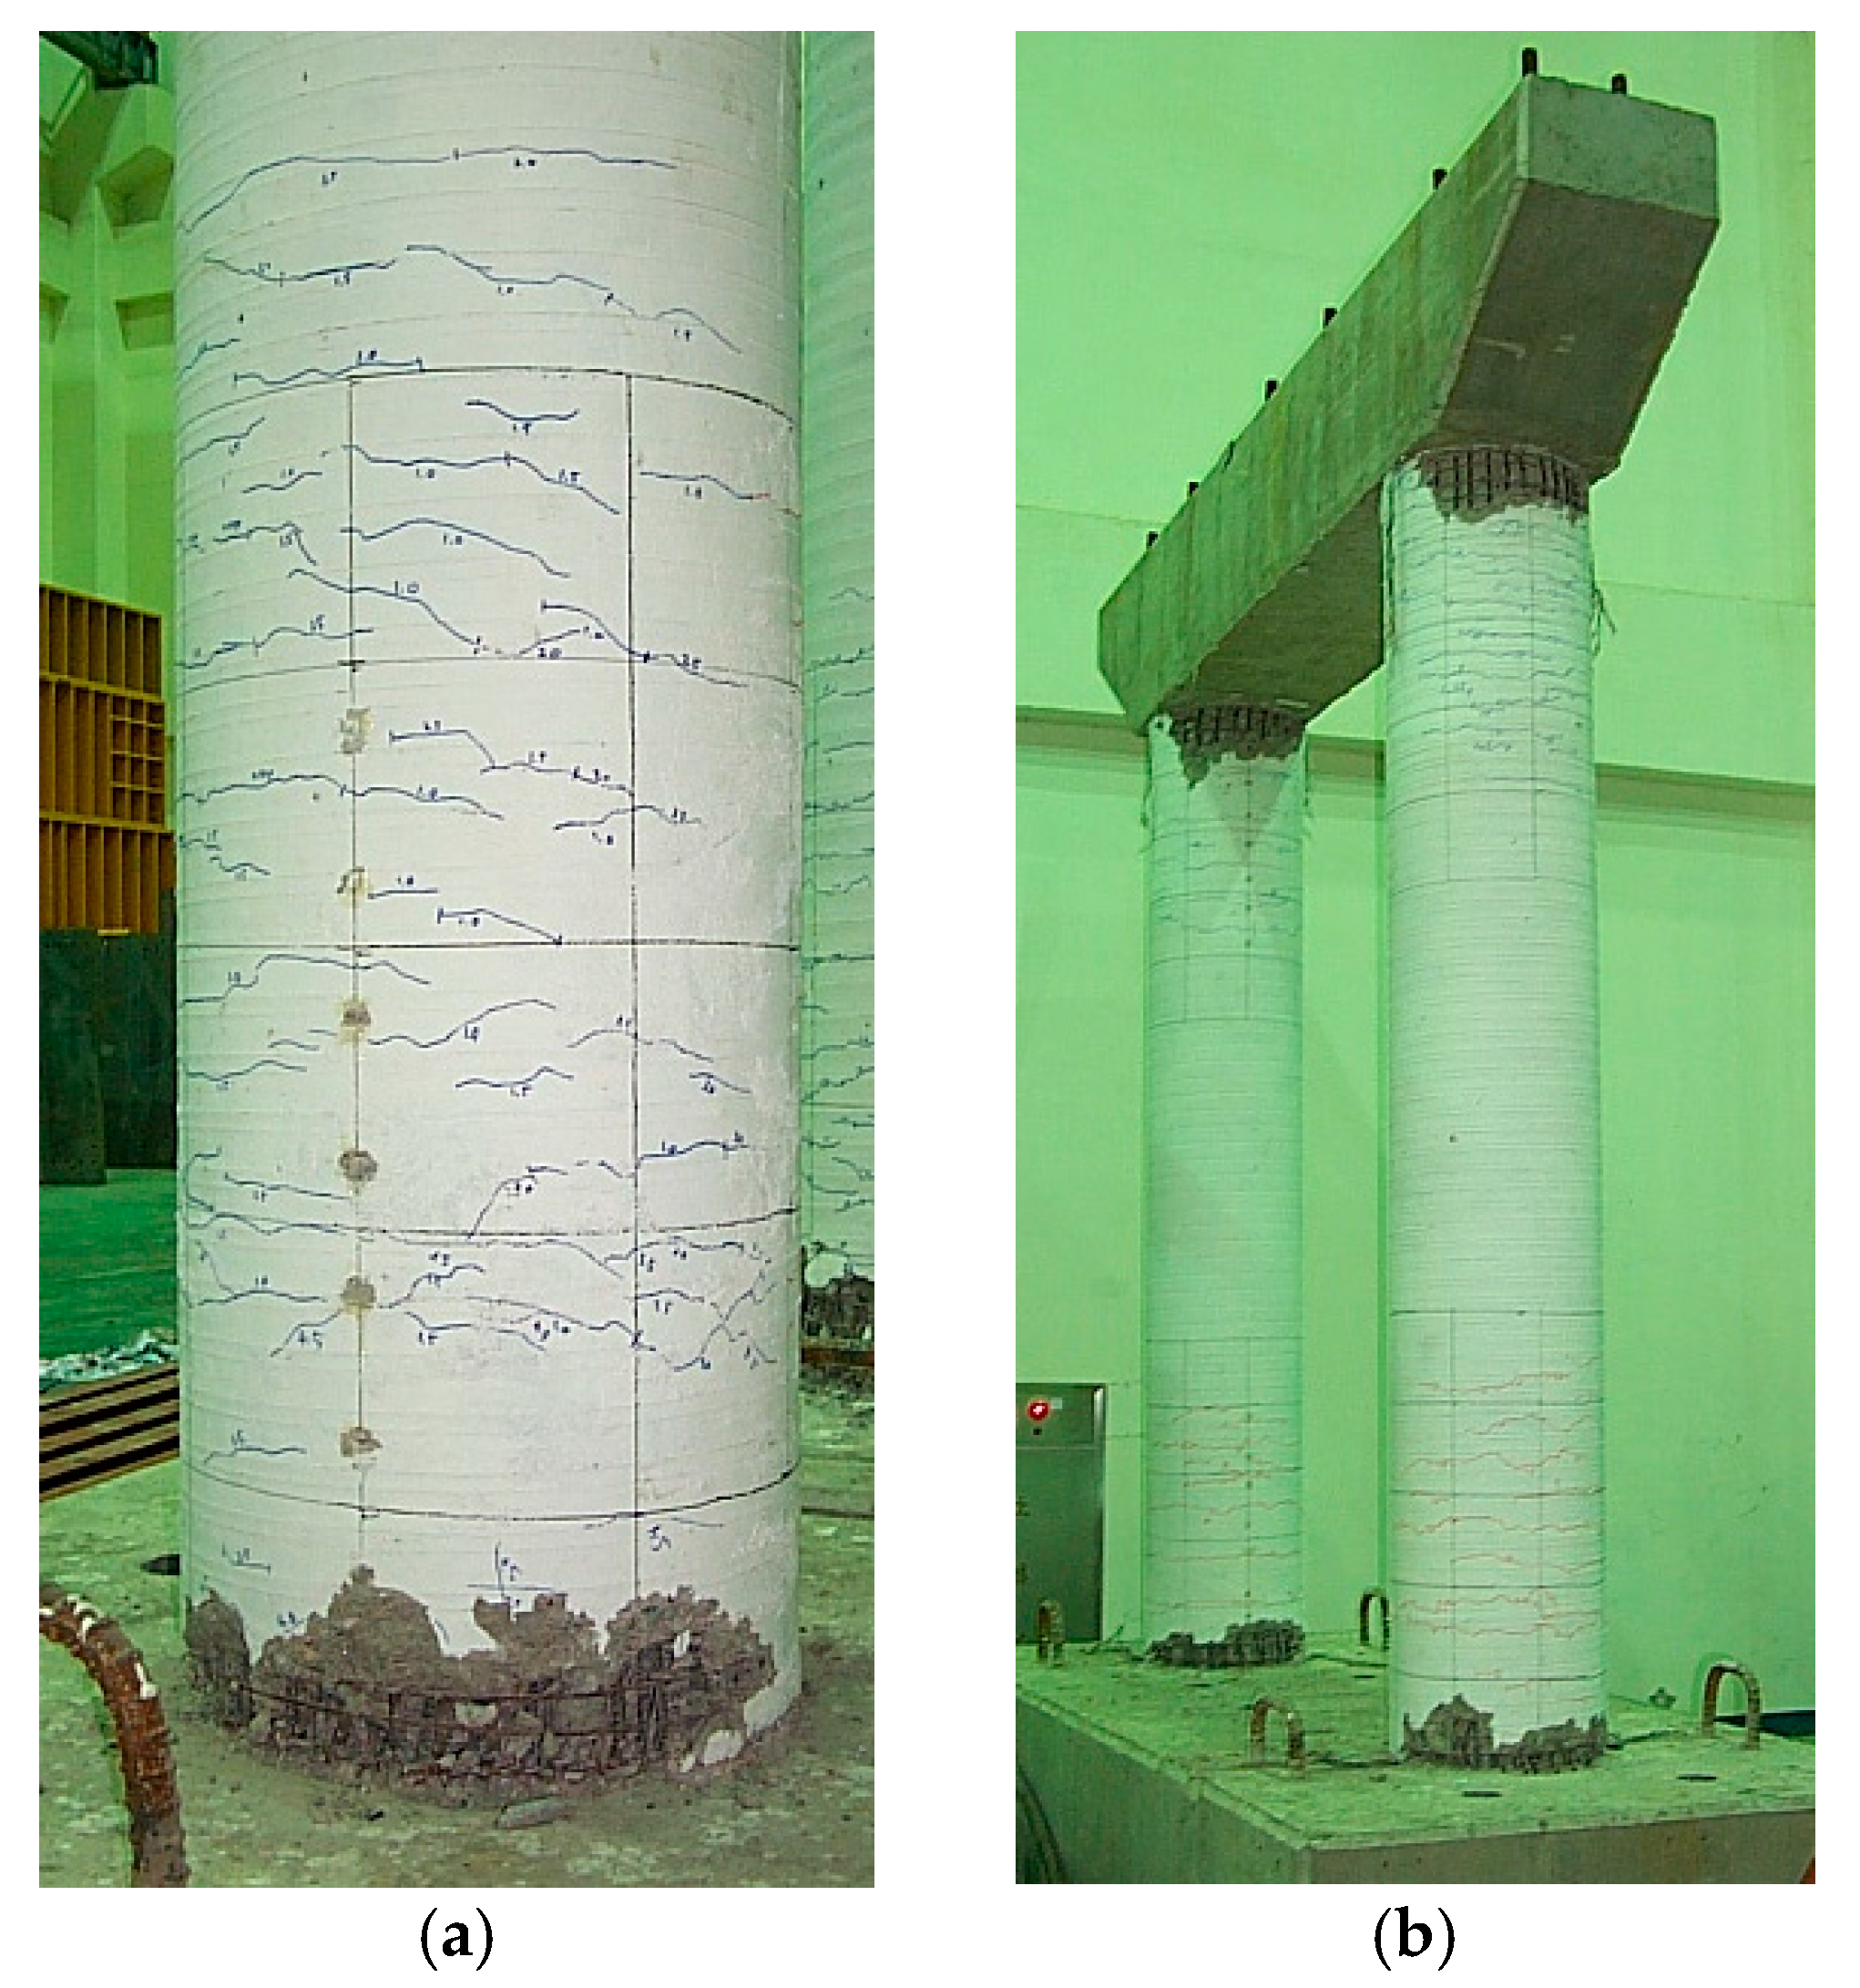
Since the two-column piers show behavior similar to frames, the behavior of two-column piers in the transverse direction is different from the behavior in the longitudinal direction, as shown in Figure 10. In the longitudinal loading specimens, damage occurs only at the bottom of the column, whereas the transverse loading specimens are damaged at both the top and bottom of the column. The specimens loaded in the transverse direction failed through flexural failure, not through bond-failure of the lap-splices as with the longitudinal loading specimens. Because plastic hinges were formed at both the top and bottom of the column, the ductility is greater than that of the longitudinal loading case. Since the cap beam is not a rigid body, it caused some deformation. Therefore, the moment at the top of the column could be absorbed by the bending deformation of the cap beam, so the failure occurred later than at the bottom, which is fixed to the foundation. The outside of the bottom experienced compression failure and the breakage of the reinforcement bar first, and then failure occurred in the inside of the bottom. Even if the bottom of the column was damaged, the top of the column was not severely damaged. When the resistant moment at bottom was weakened, the resistant moment acted on the top of the column as well, so it could absorb a large displacement. Therefore, in the case of a load in the transverse direction, the displacement ductility could be greater than that in the case of a load in the longitudinal direction.
Figure 11 shows images of the failure of the RH-NS-T specimen. The cracks were evenly distributed in the upper part of the column from 50 mm to 400 mm when the loading was applied corresponding to the yield displacement. At the bottom of the column, the lap-splice was located up to 330 mm high. In this range, the longitudinal reinforcing bar ratio is doubled, so there is little cracking, and the cracks are evenly distributed in the location from 300 mm to 700 mm at the bottom of the column. At 5.0 Δ y , the outside face of the bottom of the column had spalling first by the compressive force, and the concrete cover was damaged and fell off. Buckling of the reinforcing bar was observed at about 5 mm height. At the top of the column, many vertical cracks occurred between about 0 mm and 100 mm in height, and spalling began to appear insignificantly. At 6.0 Δ y , the longitudinal reinforcement bar was first broken in a column that was subjected to tensile force during loading. At 8.0 Δ y , the longitudinal reinforcement bar was broken at the top of the column at the time of loading. At this time, the longitudinal reinforcement bar at the bottom of the column was almost completely broken where the concrete cover was damaged.
Figure 12 shows images of the failure of the RH-SL-T specimen. The top of the column was evenly cracked in the plastic hinge area, and the bottom of the column had many cracks between 200 mm and 800 mm in height when the loading was applied corresponding to the yield displacement. At the bottom of column, the largest crack occurred at a height of about 350 mm, just above the height of the lap-splice. At 6.07 Δ y , the longitudinal reinforcement bar was first broken in a column that was subjected to tensile force during loading, as like the RH-NS-T specimen. At 8.07 Δ y , the top of the column was not broken much in spite of the severe fracture of the longitudinal reinforcement bar at the bottom of the column.
Figure 13 shows images of the failure of the RH-SC-T specimen. Unlike in the other specimens, many cracks occur below the height of 300 mm at the bottom of the column. At 7.07 Δ y , the longitudinal reinforcement bar was broken at the outside face of the column subjected to tensile force when the loading was applied. At 9.07 Δ y , the longitudinal reinforcement bar at the bottom of the column was severely fractured. The top of the column was not broken much, as like the RH-SL-T specimen.
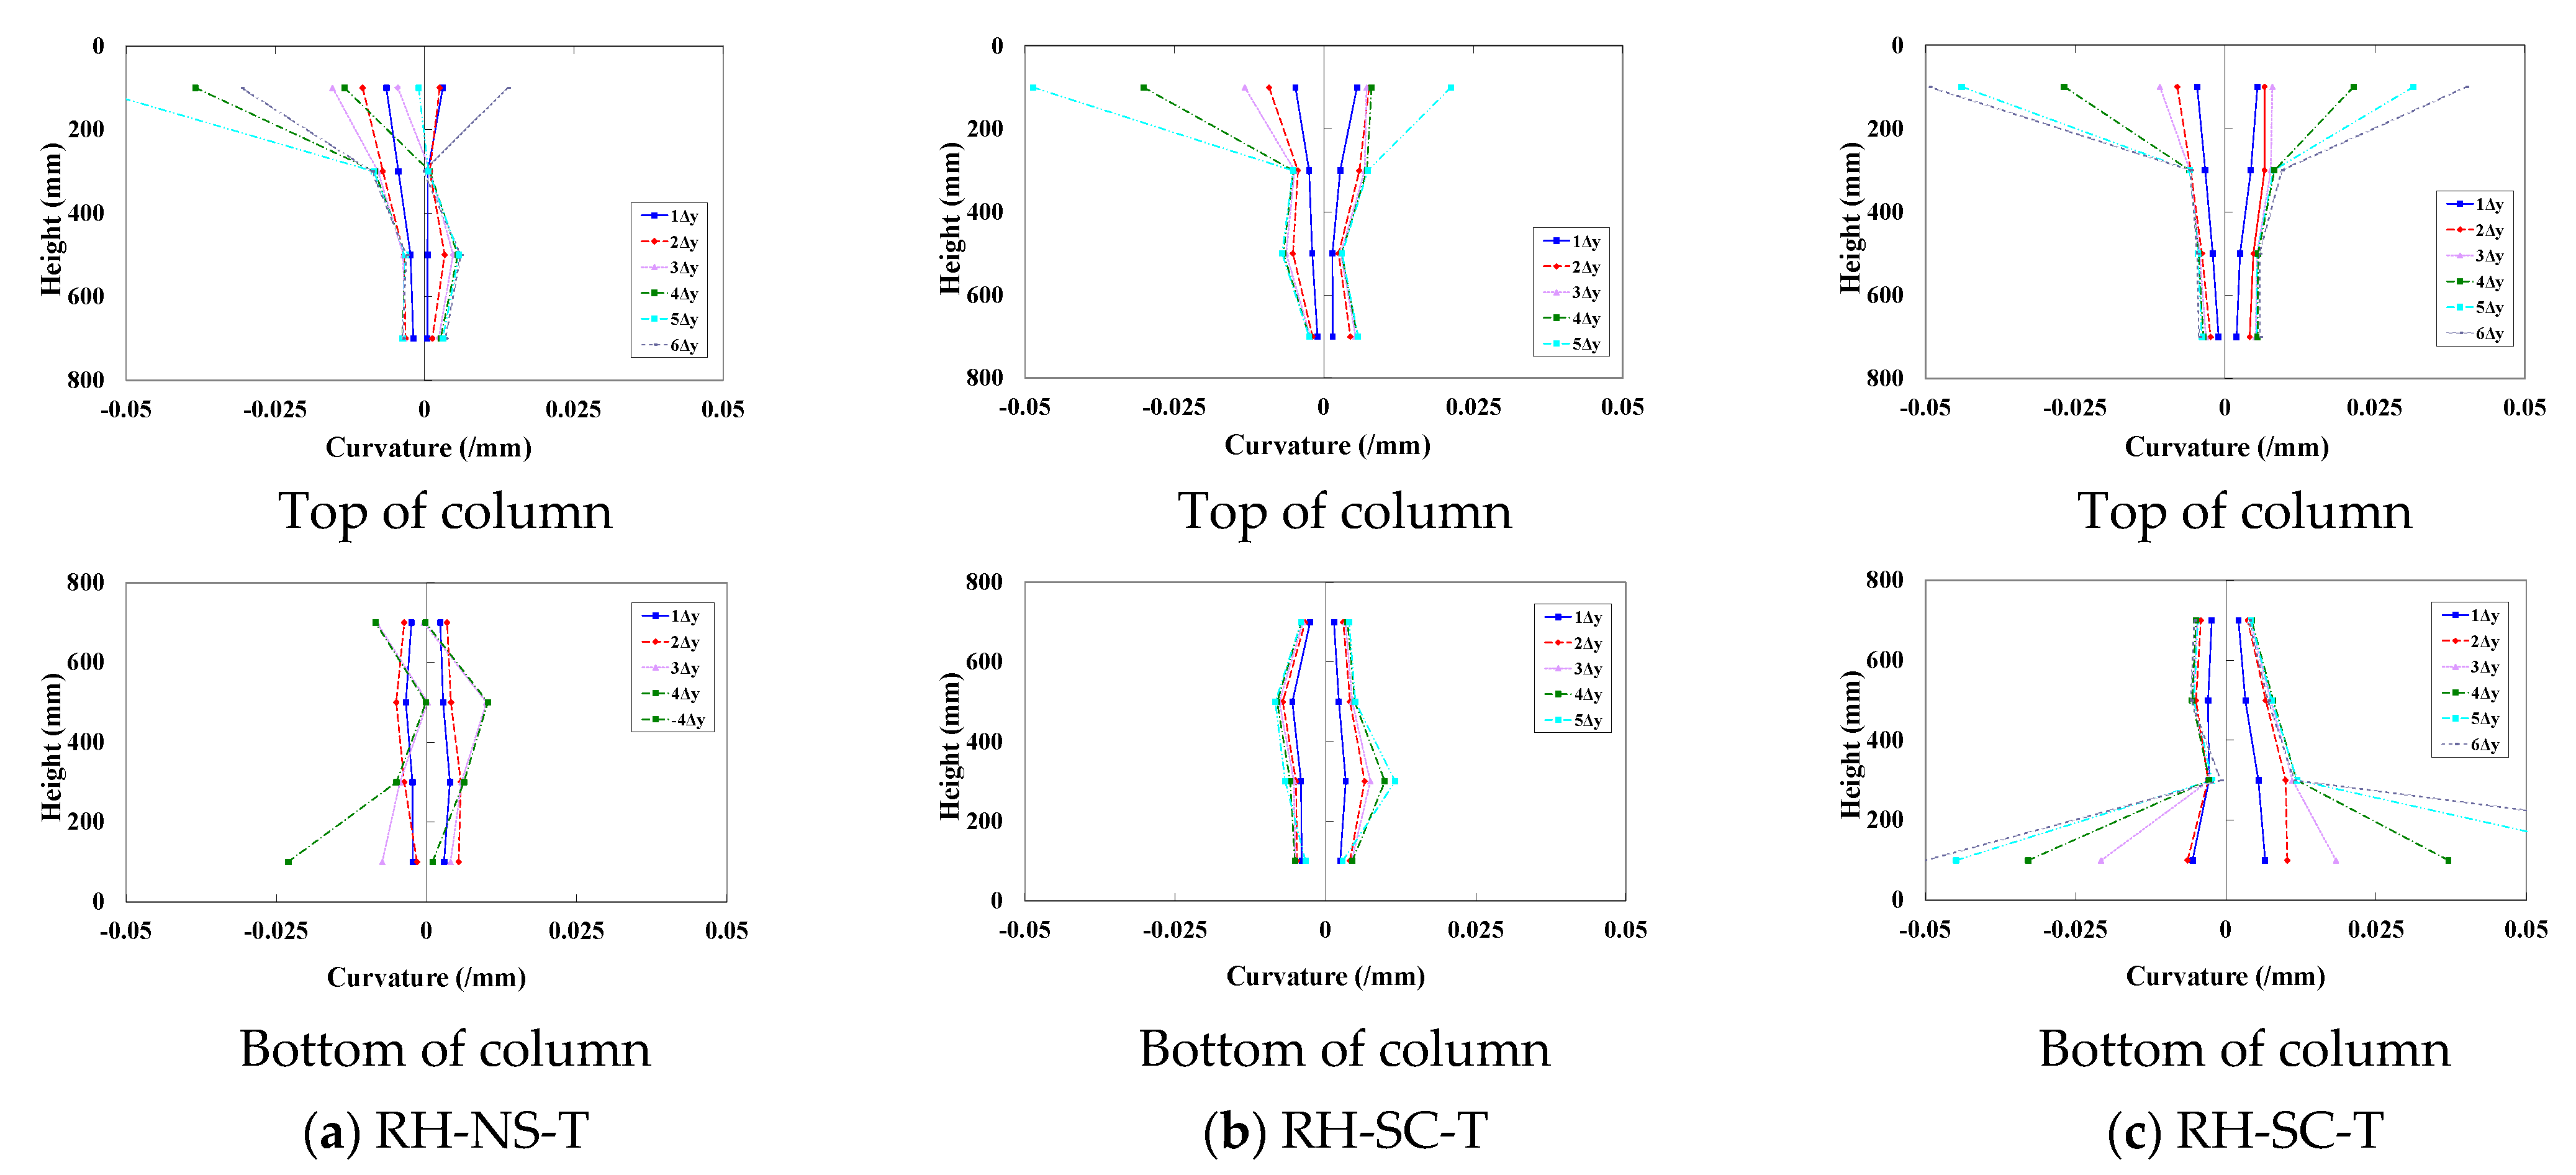
Figure 14 shows the distribution of curvature along the height for the transverse loading test specimen. Like the longitudinal loading specimen, the RH-SC-T specimen without lap-splicing had the largest curvature at the bottom of the column. On the other hand, at the top of the column, all specimens have relatively the same curvature because there is no lap-splicing. For the transverse loading specimen, double curvature occurred along the column up and down. This means that the aspect ratio is small. Therefore, the height of plastic hinge region that has a large curvature is relatively lower than that of the longitudinal loading specimen.

3.2.2. Hysteresis Curve of Transverse Loading Specimen

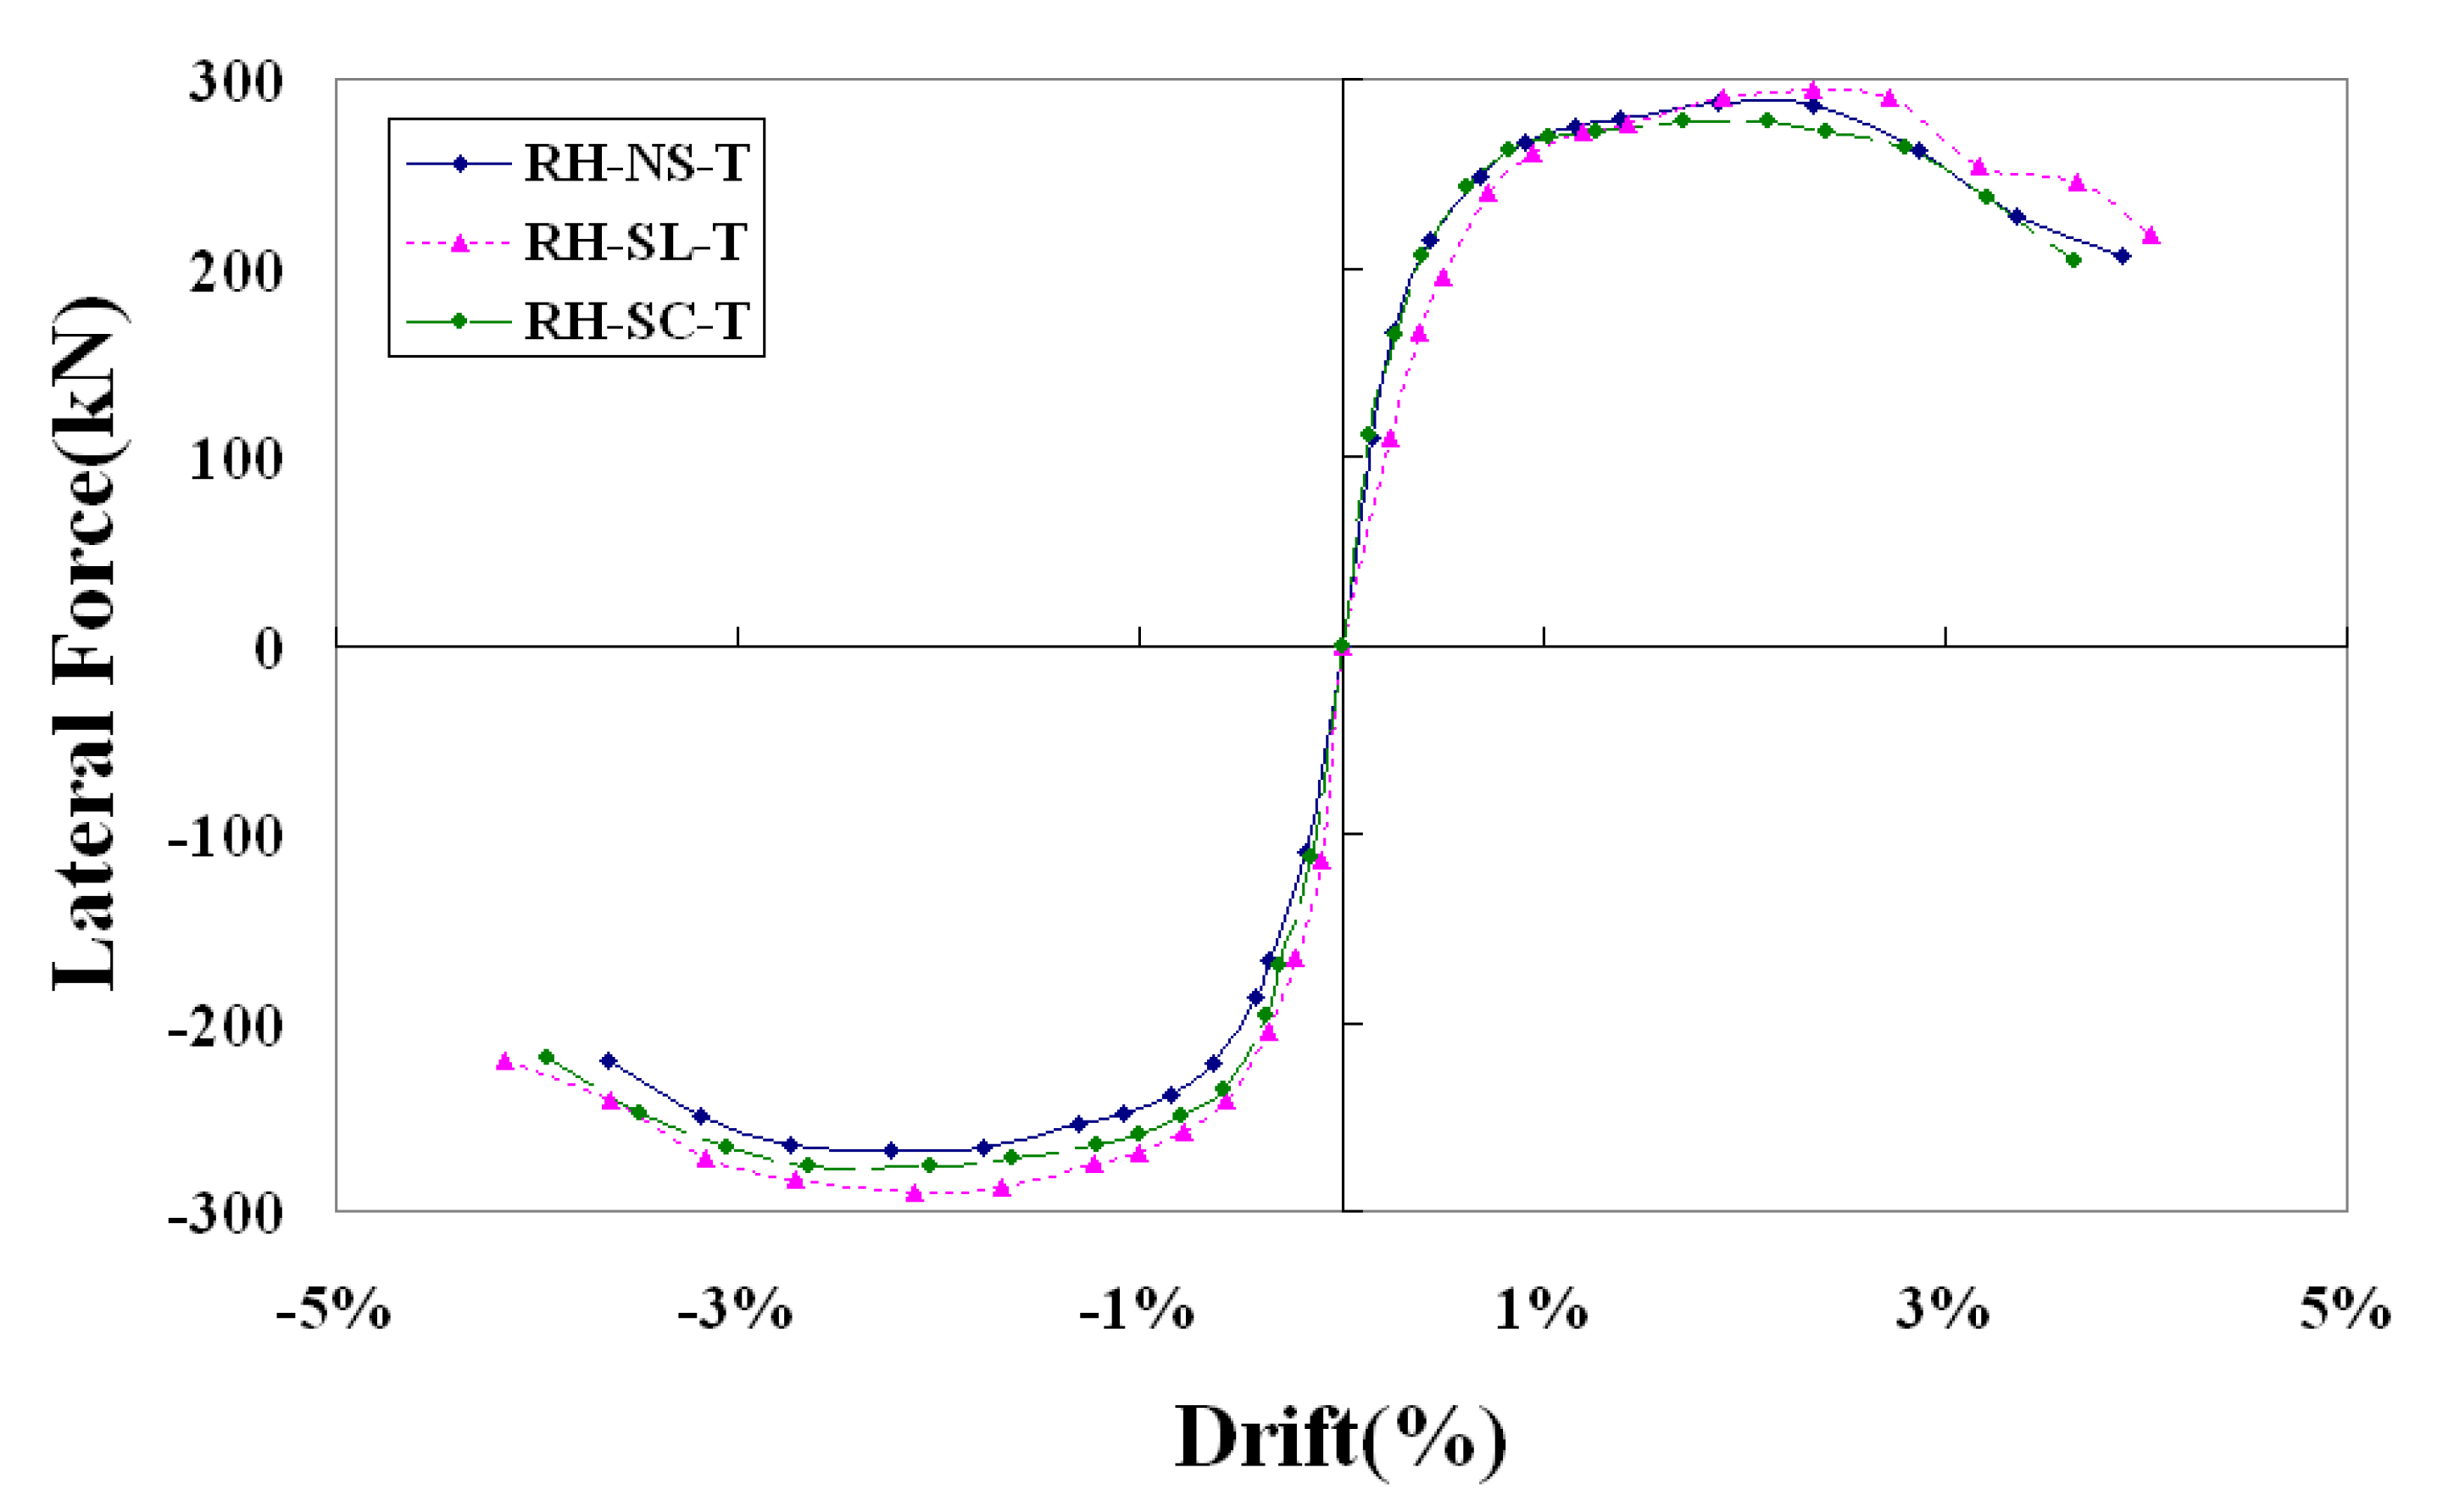
Figure 15 shows the load-drift ratio hysteresis curve of the transverse loading specimens. For the RH-NS-T specimens, it can be seen that the horizontal load capacity gradually decreases after a stable hysteresis curve up to 5.0 Δ y . In contrast to the fact that the resisting force dropped after the breakage of the longitudinal reinforcement bar in the longitudinal loading test, the lateral load was endured more by the moment resistance force, even if the reinforcing bar breaks at the bottom of the column in the transverse loading test. This is because the top of the column can resist the bending moment as the plastic hinge. Thus, it was shown that even if the displacement was applied up to 8.0 Δ y , the lateral load carrying capacity was reduced by only about 30%.
For the RH-SL-T specimens, a stable hysteresis curve was shown up to 6.0 Δ y . However, at 7.0 Δ y , the resisting force decreased significantly. After 7.0 Δ y , the resisting force decreased more slightly. In the case of these test specimens, unlike other transverse loading test specimens, even after 6 Δ y , where the fracture progressed to some extent, the lateral load-bearing capacity decreased gradually. This is because the ductility capacity of the top of the column is high, as the transverse reinforcement bar ratio is larger than that of other test specimens.
Figure 16 compares the envelope curve of the hysteresis loops of each transverse loading specimen. As can be seen in the figure, there was little difference in the lateral load carrying capacity of each specimen. This is because bond failure by lap-splice did not occur as in the longitudinal loading test. The reduction of the lateral load-bearing force after the failure of the bottom is determined by the failure of the top of the column. Since there is no lap-splice at the top of the column, the ductility difference due to the transverse reinforcement bar changes the difference in the failure drift ratio.

4. Result of Seismic Capacity

The seismic capacity of a member with nonlinear behavior can be expressed as the energy absorption and ductility factor during hysteretic behavior. The absorbing energy according to the ductility factor was calculated as the area of the hysteresis loop at each loading step. The energy absorption of each specimen is shown in Figure 17. For the case of the longitudinal loading, the energy absorption of the RH-SC-L specimen is higher because the displacement at the failure is slightly larger. For the case of transverse loading, the RH-SL-T specimen is larger than those of any other specimens. It is almost the same until 5.0, before failure occurs at the bottom of the column. After the bottom part of the column fractured, the energy absorption capacity at the top of the column contributed to the seismic performance. It is also confirmed in the failure mode that the top of the column withstands the load in the transverse direction even after damage. The energy absorption capacity at the top of the column is determined by the transverse reinforcing bar ratio at the plastic hinge region. Therefore, even if the specimen RH-SC-T without lap-splicing at the bottom of the column has the largest displacement when the initial damage occurred, the specimen RH-SL-T, which has larger transverse reinforcing bar ratio, has better seismic performance.
The test results are summarized in Table 3. The displacement ductility of the RH-SL-L specimen is smaller than that of the RH-SC-L specimen. There is a difference in ductility between the loading directions. For the longitudinal direction, the pier behaves like a single column. For the transverse direction, the pier behaves as multiple columns which generate multiple plastic hinges. This is consistent with the design value of strength reduction factor defined as three for the single column pier and five for the multi-column pier in the design code. It was expected that there would be a large difference in seismic performance according to the details of the reinforcing bar, but the bond failure in the lap-splice did not occur, so all the specimens were found to have a seismic performance, although there are slight differences. The reason why the lap-splice failure did not occur may be that the plastic hinge region is small because the cross-sectional diameter of the multi-column pier is smaller than single-column pier.

5. Conclusions

In this study, six scaled models of two-column piers were constructed and tested to investigate their behavior when seismic load is applied. Test specimens having three different reinforcement details were loaded in the longitudinal direction and the transverse directions.
Initially, bond failure was expected according to lap-splice reinforcement detail. If the longitudinal reinforcements are lap-spliced to enough length and the transverse reinforcement is appropriate, the flexural failure can be expected. Multi-column piers have a smaller cross-sectional size than single-column piers, and the fact that the plastic hinge length is small may be why there was no bond failure at the lap-splice. Accordingly, the effect of the lap-splice resulted in the reduction of the curvature of the corresponding height because the longitudinal reinforcement bar ratio was increased.
The behaviors of two-column piers in the transverse direction is different from the behavior in the longitudinal direction. For the transverse direction, high ductility was produced due to multiple plastic hinges. The ultimate failure occurs due to the bending failure of the top of the column connected to the cap beam, so the ductility is affected by the seismic reinforcement detail of this part.
In this study, lap-splicing did not have a significant effect. However, it should be noted that if there is a lap-splice in the longitudinal reinforcement of an actual pier, bond failure may occur depending on the seismic detail. In particular, since it is a result of a small-scale test, the size effect needs to be additionally considered. Nevertheless, piers with non-seismic details can withstand earthquakes to some extent if adequate details are supported.

Author Contributions

Experiment, J.H.K.; supervision, I.-H.K.; writing—review and editing J.H.L. All authors have read and agreed to the published version of the manuscript.

Funding

This work was supported by the Korea Institute of Energy Technology Evaluation and Planning (KETEP) and the Ministry of Trade, Industry & Energy (MOTIE) of the Republic of Korea (No. 20181510102410) and Basic Science Research Program through the National Research Foundation of Korea (NRF) funded by the Ministry of Education (2019R1I1A3A01058812).

Institutional Review Board Statement

Not applicable.

Informed Consent Statement

Not applicable.

Data Availability Statement

Not applicable.

Conflicts of Interest

The authors declare no conflict of interest.

References

  1. Cheok, G.S.; Stone, W.C. Behavior of 1/6-scale model bridge columns subjected to inelastic cyclic loading. ACI Struct. J. 1990, 87, 630–638. [Google Scholar]
  2. Brito, M.B.; Ishibashi, H.; Akiyama, M. Shaking table tests of a reinforced concrete bridge pier with a low-cost sliding pendulum system. Earthq. Eng. Struct. Dyn. 2019, 48, 366–386. [Google Scholar] [CrossRef]
  3. Kim, T.; Lee, K.; Yoon, C.; Shin, H.M. Inelastic behavior and ductility capacity of reinforced concrete bridge piers under earthquake. I: Theory and formulation. ASCE J. Struct. Eng. 2003, 129, 1199–1207. [Google Scholar] [CrossRef]
  4. Mander, J.B.; Priestley, M.J.N.; Park, R. Theoretical stress–strain model for confined concrete. ASCE J. Struct. Eng. 1998, 114, 1804–1826. [Google Scholar] [CrossRef] [Green Version]
  5. Priestley, M.J.N.; Park, R. Strength and ductility of concrete bridge columns under seismic loading. ACI Struct. J. 1987, 84, 61–76. [Google Scholar]
  6. Chai, Y.H.; Priestley, M.J.N.; Seible, F. Seismic retrofit of circular bridge columns for enhanced flexural performance. ACI Struct. J. 1991, 88, 572–584. [Google Scholar]
  7. Hoshikuma, J.; Kawashima, K.; Nagaya, K.; Taylor, A.W. Stress-strain model for confined reinforced concrete in bridge piers. J. Struct. Eng. 1997, 123, 624–633. [Google Scholar] [CrossRef]
  8. Sheikh, S.A.; Uzumeri, S.M. Strength and ductility of tied concrete columns. ASCE J. Struct. Div. 1980, 106, 1079–1102. [Google Scholar] [CrossRef]
  9. Saadatmanesh, H.; Ehsani, M.R.; Li, M.W. Strength and ductility of concrete columns externally reinforced with fiber composite straps. ACI Struct. J. 1994, 91, 434–447. [Google Scholar]
  10. Moehle, J.P.; Cavanagh, T. Confinement effectiveness of crossties in RC. ASCE J. Struct. Eng. 1985, 111, 2105–2120. [Google Scholar] [CrossRef]
  11. Lukkunaprasit, P.; Sittipunt, C. Ductility enhancement of moderately confined concrete tied columns with hook-clips. ACI Struct. J. 2003, 100, 422–429. [Google Scholar]
  12. Lee, T.; Chen, C.; Tsou, P.; Lin, K.; Lee, W.; Pan, A.D.E. Experimental evaluation of crossties in large reinforced concrete columns under pure compression. Adv. Struct. Eng. 2012, 15, 1717–1727. [Google Scholar] [CrossRef]
  13. Sheikh, S.A.; Toklucu, M.T. Reinforced concrete columns confined by circular spirals and hoops. ACI Struct. J. 1993, 90, 542–553. [Google Scholar]
  14. Tanaka, T.H.; Park, R. Behavior of axially loaded concrete columns confined by elliptical hoops. ACI Struct. J. 1999, 96, 967–971. [Google Scholar]
  15. Jaradat, O.A.; McLean, D.I.; Marsh, M.L. Performance of existing bridge columns under cyclic loading-Part1: Experimental results and observed behavior. ACI Struct. J. 1998, 95, 695–704. [Google Scholar]
  16. Ichinose, T. Splitting Bond Failure of Columns under Seismic Action. ACI Struct. J. 1995, 92, 535–542. [Google Scholar]
  17. Sultana, N.; Ray, T. Implications of bond-slip in inelastic dynamic responses of degrading structural systems. Int. J. Civ. Eng. 2020, 18, 1039–1052. [Google Scholar] [CrossRef]
  18. Mousa, M.I. Flexural behaviour and ductility of high strength concrete (HSC) beams with tension lap splice. Alex. Eng. J. 2015, 54, 551–563. [Google Scholar] [CrossRef]
  19. Rakhshanimehr, M.; Reza Esfahani, M.; Reza Kianoush, M.; Ali Mohammadzadeh, B.; Roohollah Mousavi, S. Flexural ductility of reinforced concrete beams with lap-spliced bars. Can. J. Civ. Eng. 2014, 41, 594–604. [Google Scholar] [CrossRef]
  20. Azizinamini, A.; Pavel, R.; Hatfield, E.; Ghosh, S. Behavior of lap-spliced reinforcing bars embedded in high strength concrete. ACI Struct. J. 1999, 96, 826–835. [Google Scholar]
  21. Hamad, B.S.; Najjar, S.S. Evaluation of the role of transverse reinforcement in confining tension lap splices in high strength concrete. Mater. Struct. 2002, 35, 219–228. [Google Scholar] [CrossRef]
  22. Bournas, D.A.; Triantafillou, T.C. Bond strength of lap-spliced bars in concrete confined with composite jackets. Asce J. Compos. Constr. 2011, 15, 156–167. [Google Scholar] [CrossRef]
  23. Hadhood, A.; Agamy, M.H.; Abdelsalam, M.M.; Mohamed, H.M.; El-Sayed, T.A. Shear strengthening of hybrid externally-bonded mechanically-fastened concrete beams using short CFRP strips: Experiments and theoretical evaluation. Eng. Struct. 2019, 201, 109795. [Google Scholar] [CrossRef]
  24. Sexsmith, R.; Anderson, D.; English, D. Cyclic behavior of concrete bridge bents. ACI Struct. J. 1997, 94, 103–113. [Google Scholar]
  25. Mander, J.B.; Kim, J.H.; Ligozio, C.A. Seismic Performance of a Model Reinforced Concrete Bridge Pier before and after Retrofit; Technical Report NCEER-96-0009; NCEER: New York, NY, USA, 1996. [Google Scholar]
  26. Wua, R.; Pantelides, C.P. Seismic evaluation of repaired multi-column bridge bent using static and dynamic analysis. Constr. Build. Mater. 2019, 208, 792–807. [Google Scholar] [CrossRef]
  27. Kar, D.; Roy, R. Seismic behavior of RC bridge piers under bidirectional excitations: Implications of site effects. J. Earthq. Eng. 2018, 22, 3030–3331. [Google Scholar] [CrossRef]
  28. AASHTO. Standard Specifications for Highway Bridges, 17th ed.; American Association of State Highway and Transportation Officials: Washington, DC, USA, 2010. [Google Scholar]
  29. Prestley, M.J.N.; Seible, F.; Calvi, G.M. Seismic Design and Retrofit of Bridges; John Wiley & Sons, Inc.: New York, NY, USA, 1996. [Google Scholar]
  30. Lee, J.H.; Seok, S.G.; Yun, S.G.; Kang, S.K. Seismic performance of circular columns considering transverse steel details. In Proceedings of the EESK Conference, Seoul, Korea, 4 March 2000; Volume 4, pp. 259–266. [Google Scholar]
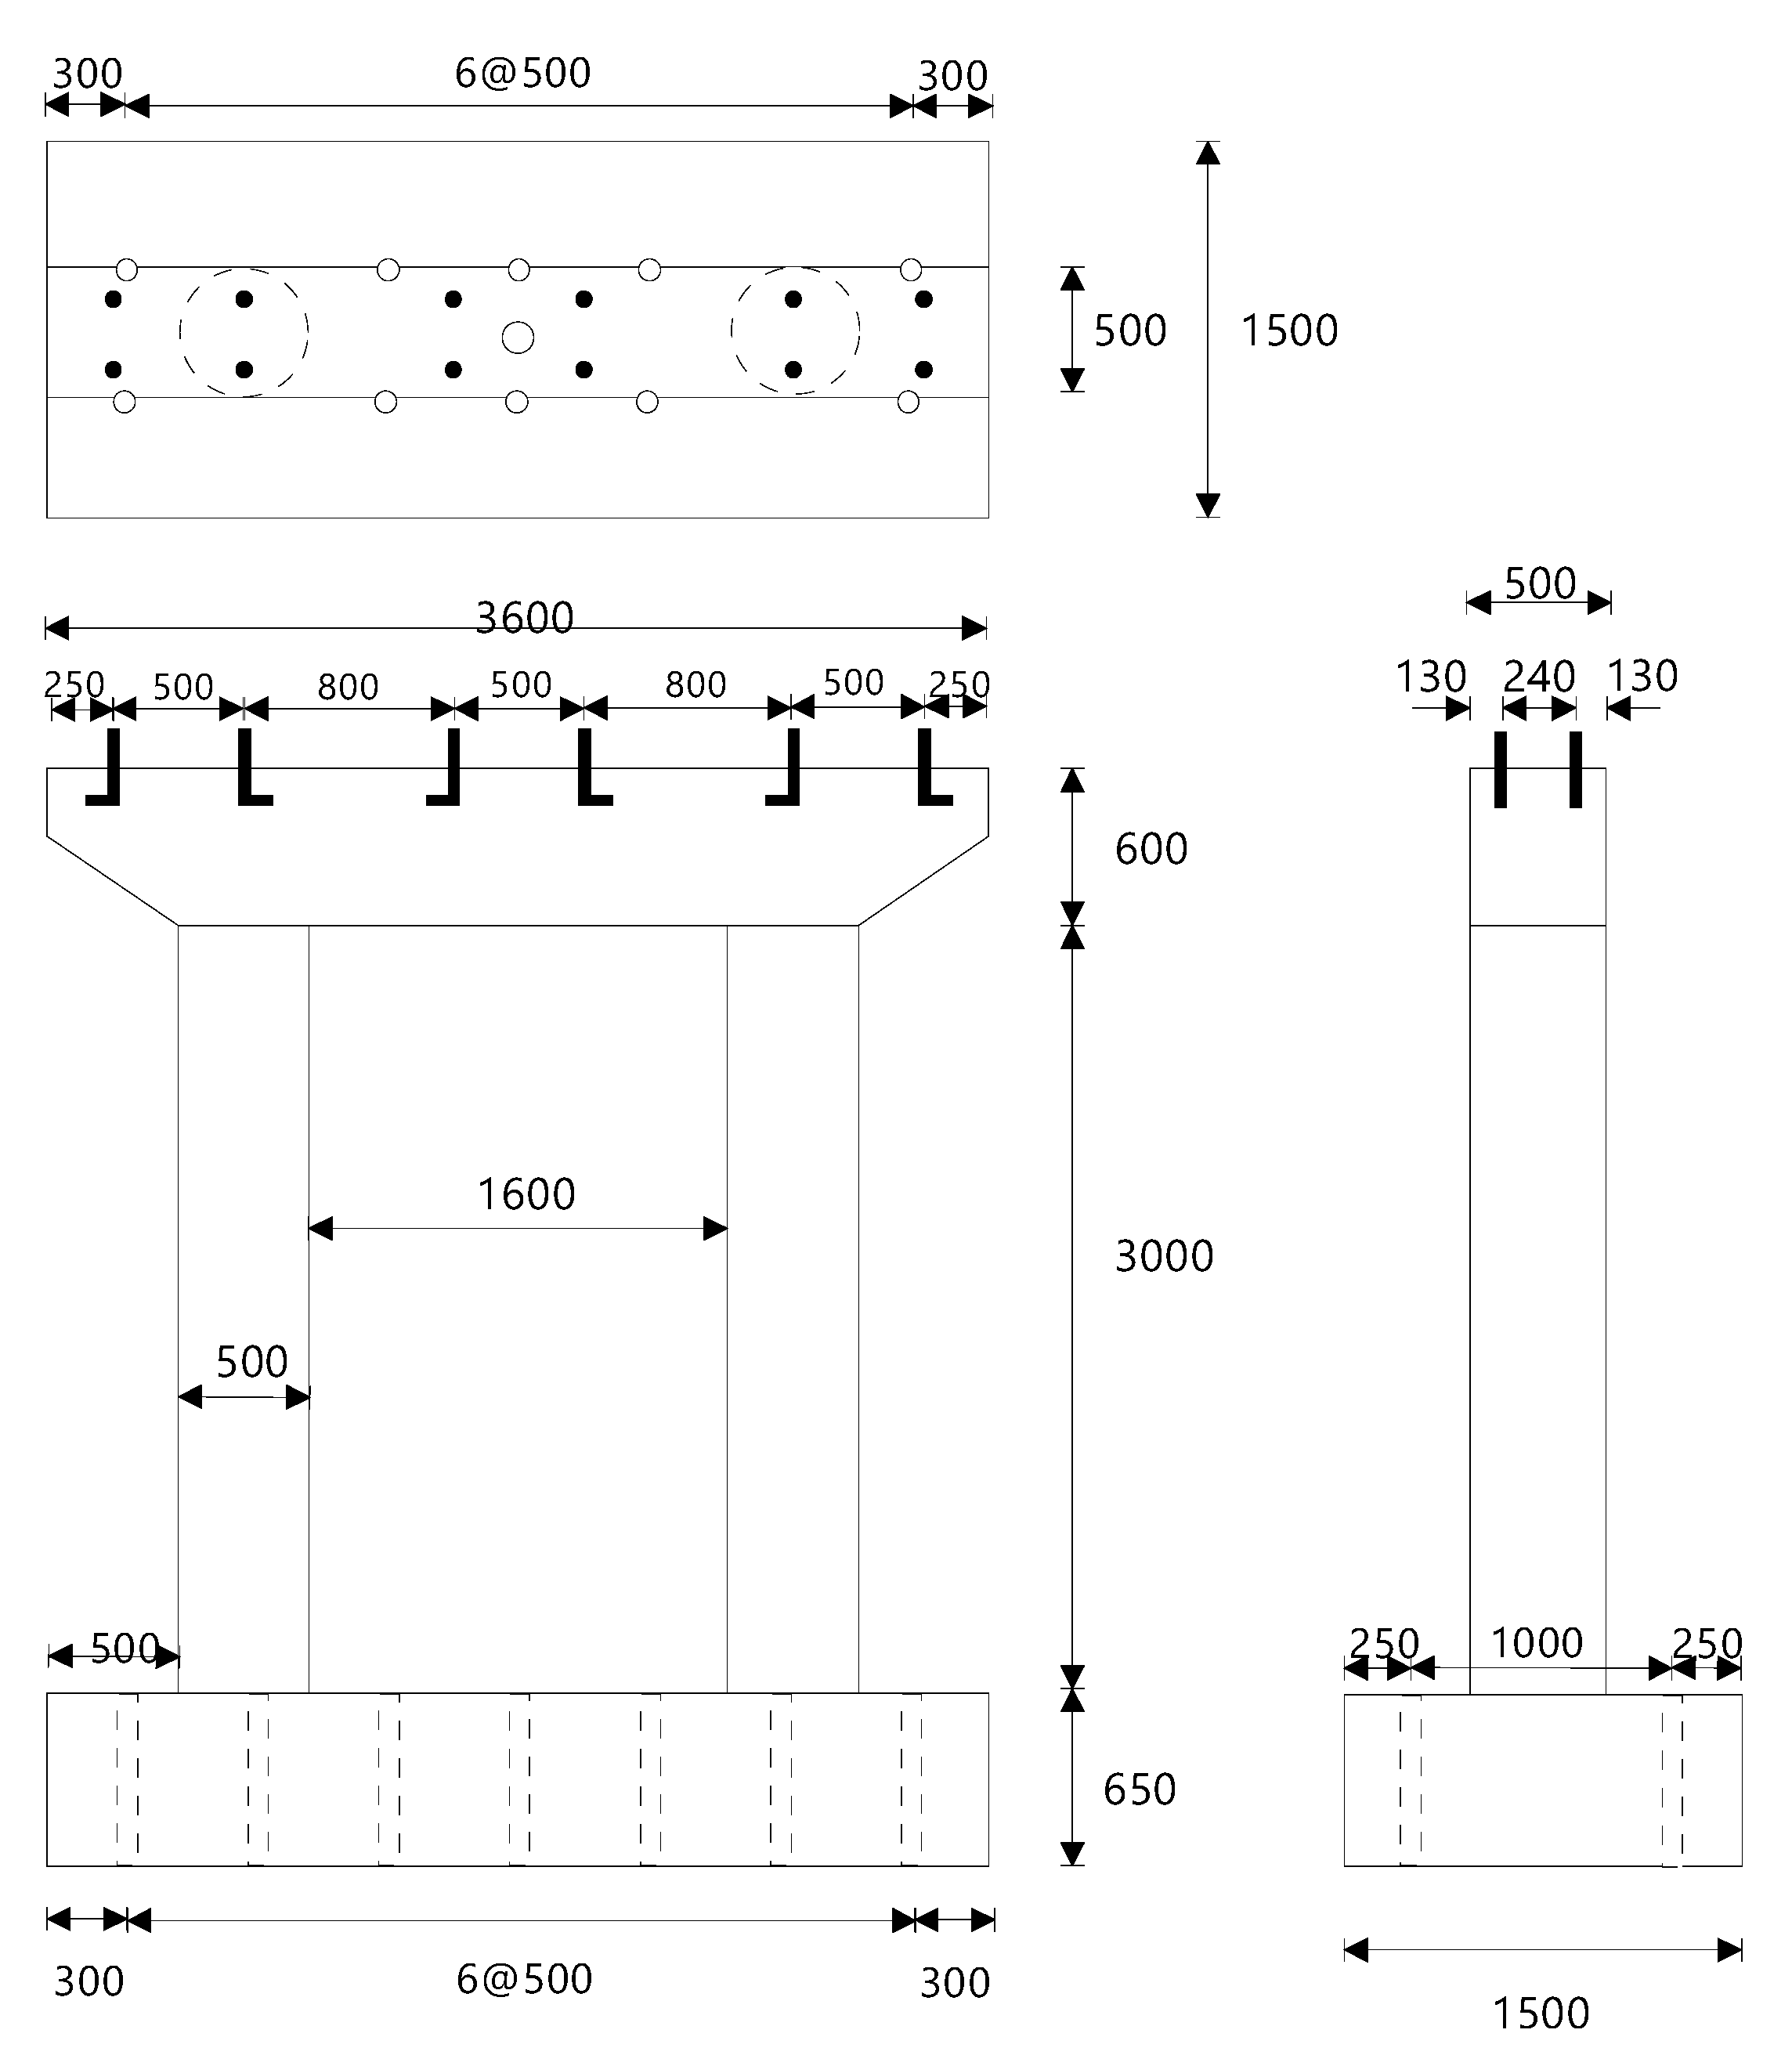
Figure 1. Geometry of the test specimen (units: mm).
Applsci 11 02652 g001
Figure 2. Reinforcement details (unit: mm).
Applsci 11 02652 g002
Figure 3. Transverse reinforcement details with hook.
Applsci 11 02652 g003
Figure 4. Test setup for lateral loading and axial loading.
Applsci 11 02652 g004aApplsci 11 02652 g004b
Figure 5. Loading patterns of lateral displacement.
Applsci 11 02652 g005
Figure 6. Failure of the longitudinal loading specimens. (a) Buckling and fracture of the longitudinal reinforcement bar of the RH-NS-L specimen (5 Δ y ); (b) Fracture of the longitudinal reinforcement bar of the RH-SL-L specimen (7 Δ y ); (c) Buckling and fracture of the longitudinal reinforcement bar of the RH-SC-L specimen (7 Δ y ).
Applsci 11 02652 g006
Figure 7. Distribution of curvature of the longitudinal loading test.
Applsci 11 02652 g007
Figure 8. Load-displacement hysteresis curve of the longitudinal loading specimens.
Applsci 11 02652 g008
Figure 9. Load-displacement envelop curve of the longitudinal loading specimens.
Applsci 11 02652 g009
Figure 10. Failure of a longitudinal loading specimen and a transverse loading specimen. (a) Failure at the bottom of the column of the RH-NS-L specimen; (b) Failure at the top and bottom of the column of the RH-NS-T specimen.
Applsci 11 02652 g010
Figure 11. Failure of the transverse loading specimens (RH-NS-T). (a) Spalling of the concrete on the outside face of the bottom (5 Δ y ); (b) Failure of the concrete cover concrete on the outside face of the top (8 Δ y ); (c) Failure of the concrete cover concrete on the inside face of the top (8 Δ y ).
Applsci 11 02652 g011
Figure 12. Failure of the transverse loading specimens (RH-SL-T). (a) Concrete crack on the inside face of the top (7 Δ y ); (b) Spalling of the concrete on the inside face of the bottom (9 Δ y ); (c) Fracture of the longitudinal reinforcement bar on the inside face of the bottom (9 Δ y ).
Applsci 11 02652 g012
Figure 13. Failure of the transverse loading specimens (RH-SC-T). (a) Failure of the concrete and the reinforcement bar on the outside face of the bottom (9 Δ y ); (b) Failure of the concrete on the inside face of the top (9 Δ y ); (c) Failure of the concrete on the outside face of the top (9 Δ y ).
Applsci 11 02652 g013
Figure 14. Distribution of curvature of a transverse loading test.
Applsci 11 02652 g014
Figure 15. Load-displacement hysteresis curve of transverse loading specimens.
Applsci 11 02652 g015
Figure 16. Load-displacement envelope curve of transverse loading specimens.
Applsci 11 02652 g016
Figure 17. Energy absorption with respect to displacement ductility factor.
Applsci 11 02652 g017
Table 1. Properties of the test model.
PropertyPrototypeModel
Material strength (MPa)Concrete strength (MPa)2424
Reinforcement steel bar strength (MPa)300300
ColumnDiameter (m)2.00.5
Height (m)12.03.0
Longitudinal reinforcementDiameter (mm)2910
Reinforcement ratio (%)1.1741.174
Diameter of lateral reinforcement (mm)164
Axial force0.052 σ c k A g 0.052 σ c k A g
Table 2. Comparison of the characteristics of each specimen.
SpecimenLoading DirectionLap-Splice of Longitudinal ReinforcementLateral Reinforcement DetailSpacing of Lateral ReinforcementVolumetric Reinforcement Ratio
RH-NS-LLongitudinal100% in the lower regionNo consideration of seismic performance37.5 mm0.268%
RH-NS-TTransverse
RH-SL-LLongitudinal50% in the lower region50% of what is required by AASHTO specifications20 mm0.503%
RH-SL-TTransverse
RH-SC-LLongitudinalNo lap-splicePreventing local buckling of the longitudinal bar30 mm0.335%
RH-SC-TTransverse
Table 3. Comparison of failure displacement and ductility.
RH-NS-LRH-SL-LRH-SC-LRH-NS-TRH-SL-TRH-SC-T
Yield displacement Δ y (mm)43.6719.21
Maximum lateral force, P m (kN)117.72118.13116.06287.93294.06277.06
Displacement at P m (mm)118.34132.94153.3056.2570.2763.58
Displacement at failure (mm) 171.47193.4693.68101.6996.73
Drift ratio at failure 4.45%5.02%3.12%3.39%3.22%
Displacement ductility at failure 3.924.434.875.295.03
Publisher’s Note: MDPI stays neutral with regard to jurisdictional claims in published maps and institutional affiliations.