Article

Evaluation of the Mechanical Properties of Normal Concrete Containing Nano-MgO under Freeze–Thaw Conditions by Evolutionary Intelligence

1
Department of Civil Engineering, University of Tabriz, 29 Bahman Blvd., Tabriz 5166616471, Iran
2
Engineering Faculty, Near East University, North Cyprus, 10 Mersin, Nicosia 99138, Turkey
3
Faculty of Engineering & IT, University of Technology Sydney, Ultimo, NSW 2007, Australia
*
Author to whom correspondence should be addressed.
Appl. Sci. 2021, 11(6), 2529; https://doi.org/10.3390/app11062529
Submission received: 11 January 2021 / Revised: 19 February 2021 / Accepted: 24 February 2021 / Published: 12 March 2021

Abstract

:
In this research, different amounts of nano-MgO were added to normal concrete samples, and the effect of these particles on the durability of the samples under freeze and thaw conditions was investigated. The compressive and tensile strength as well as the permeability of concrete containing nanoparticles were measured and compared to those of plain samples (without nanoparticles). The age of concrete samples, percentage of nanoparticles, and water-to-binder ratio are the variables of the current research. Based on the results, the addition of 1% nano-MgO to the normal concrete with a water-to-binder ratio of 0.44 can reduce the permeability up to 63% and improve the compressive and tensile strengths by 9.12% and 10.6%, respectively. Gene Expression Programming (GEP) is applied, and three formulations are derived for the prediction of mechanical properties of concrete containing nano-MgO. In this method, 80% of the dataset is used randomly for the training process and 20% is utilized for testing the formulation. The results obtained by GEP showed acceptable accuracy.

1. Introduction

Concrete is among the most widely used materials in the construction industry owing to the ease of access to ingredients, construction in different shapes, and rapidity in operation; therefore, the life span of concrete structures is an important matter for engineers due to the economic and environmental effects of reconstruction. One of the contributing factors in the deterioration of concrete in cold regions is the repeated freeze–thaw cycles (the so-called F-T action). This repeated action causes (1) an increase in the number of micro-cracks, (2) a loss of mass, and (3) a reduction in the mechanical properties of the concrete. According to Powers’ hydraulic pressure theory [1], the concrete is a porous material, so decreased temperature leads to the formation of ice in its pores. The formation of ice requires more volume and applies pressure to the texture of the concrete; the repetition of this action leads to the destruction of the concrete.
There are several approaches to enhance the concrete performance in freeze–thaw conditions [2]: (1) using air bubbles for providing more space for ice expansion, [3,4] (2) using fillers (micro fillers and nano fillers) and pozzolans for reducing the pores such as fly ash, silica fume, nano silica, and nano MgO [5], (3) using some other mechanism by applying fibers, tubes, and sheets for the prevention of crack propagation [6], and (4) using hydrophobic materials for reducing the water absorption of concrete [7]. In the current research, the second approach is chosen by using nano-MgO, which has filler and expansive features to prevent water penetration in concrete and reduce permeability.
Permeability is one of the major destructive factors for concrete. Theoretically, nanosized particles can act as fillers, and if they are properly distributed in the concrete, they can fill nanosized pores and reduce the permeability; thereby, concrete resistivity to freeze–thaw action will enhance. The nano-filler effect enables nano-powders to decrease the permeability of concrete, especially by creating the interfacial transition zone (ITZ) with homogeneous texture and less porosity [8]. There are several research studies on the effect of nanomaterials on the durability of concrete in freeze–thaw condition; for instance, Wang et al. [9] have done research with different amounts of nano SiO2 in High-Performance Concrete (HPC) to investigate the resistivity of HPC against freeze–thaw conditions; they made concrete samples in three grades, C60, C70, and C80. The results showed that the additions of nano SiO2 improve compressive strength by 8%, 6%, and 5%, respectively. Fan et al. [10] added different percentages of nano-kaolinite clay to concrete. After repeated freeze–thaw cycles, they measured concrete properties such as the compressive strength and dynamic modulus of elasticity. Based on their findings, samples with 5% kaolinite had the highest compressive strength and relative dynamic modulus of elasticity following 125 freeze–thaw cycles. In 2016, Gonzalez et al. [11] added nano-silica to Portland cement concrete (PCC) to fulfill this aim. They reported that nano-silica improved the compressive strength as well as paste density and reduced the external damage of samples subjected to freeze–thaw cycles. In Reference [12], nano additives with graphite were added to concrete to study the concrete characteristics such as the compressive strength and thermo-frost resistivity. The findings showed that using nano additives improved the properties of concrete. Shahrajabian and Behfarnia [13] analyzed the effect of nano-silica, nano-alumina, and nano-clay on the durability of alkali-activated slag (AAS) concrete samples subjected to freeze–thaw cycles. Their results showed that nano-silica and nano-clay improved the concrete durability more than nano-alumina. In the experimental study [14], the effect of nano-powders on the mechanical properties and freeze–thaw resistance of shotcrete was investigated; in this regard, nano-clay and nano-silica were used, and different percentages of the mentioned nano-powders were replaced with the cement. According to the results, using 6% of nano-silica played an effective role in the frost resistance of shotcrete. Adding nano clay had less impact on the improvement of mechanical properties in comparison to the nano-silica, but it was more effective in comparison with the control sample. Another type of materials that have an effective role in the reduction of permeability of concrete is MgO. This type of material has an expanding feature that means that during the completion of the hydration process of MgO, the product occupies a larger volume that fills the pores and micro-cracks of concrete. The usage of MgO in conventional Portland cements results in the production of Mg(OH)2 i.e.,
(MgO + H2O → Mg(OH)2)
and its subsequent carbonation
(Mg(OH)2 + CO2 + 2H2O → MgCO3.3H2O)
increases hydrated magnesium carbonates. Due to the long-term instability observed in concrete with a high amount of MgO, standards limited the usage of MgO in cement and concrete [15].
MgO is used as an additive in mass concrete and has been utilized widely for more than 40 years in concrete dams. Regarding the effect of high temperature on mass concrete, thermal shrinkage is inevitable, and MgO plays a role as an expansive additive to compensate for the thermal shrinkage. While the usage of MgO reduces thermal shrinkage, it helps to speed up the construction process as well [16]. The delayed expansion of MgO recovers the thermal shrinkage of concrete due to delayed hydration. An appropriate amount of MgO can prevent the formation of micro-cracks, but an excessive amount of MgO produces high inner pressure, which destroys the structure of concrete and deteriorates mechanical properties such as the compressive strength and permeability. In an experimental study [17], nano-MgO was utilized in cement mortar to investigate its effect on the compressive strength of cement mortar samples. They reached the result that samples with nano-MgO have a denser microstructure, and for this reason, they have a higher compressive strength than plain samples.
In the current research, nano-MgO as an additive is mixed with the normal concrete paste. According to previous research studies [18,19], it has expanding properties, and an appropriate amount of this nanomaterial can have an efficient role in enhancing the mechanical properties of concrete such as permeability. In previous research studies about nano-MgO, the freeze–thaw condition was not studied, while this study covers this matter by investigating the freeze–thaw resistivity of concrete.
In addition to the experimental work, it is important to propose a mathematical model that is able to predict concrete features. Gene expression programming (GEP) is a powerful numerical algorithm that is selected in the present research to fulfill this aim. GEP is basically similar to genetic algorithms (GAs) and genetic programming (GP) [20]. However, it is an extended version of GA and GP, which are inspired by Darwin’s theory of “survival of the fittest”. Similar to GA and GP, GEP uses different evolutionary mechanisms such as cross over, mutation, and reproduction to generate new individuals [21]. The differences among the three algorithms stem from the nature of the individuals. In GAs, the individual has a fixed length in linear strings (chromosomes); in contrast, the individuals in the GP are nonlinear entities of different sizes and shapes (parse trees), while the individuals in GEP are made as linear strings of fixed length (the genome or chromosomes) that are then expressed as nonlinear entities of different sizes and shapes (simple diagram representations or expression trees) [22]. It has been reported that the model generated by GEP is superior to other regression techniques. In regression techniques, the function is analyzed once it is defined, whereas, in the GEP method, there is no predefined function. Moreover, GEP has a more powerful performance compared to other regression methods and Artificial Neural Network (ANN), [23].
Many studies utilize GEP for engineering problems. Deriving a model for the flow number of dense asphalt–aggregate mixtures was the topic of a research study in 2011 [24]. The results indicated that the proposed model has a high ability of evaluation of the flow number of asphalt mixtures. In Ref. [25], the GEP formulation for predicting the splitting strength of cylindrical samples was developed. Data gained from predicting the formula were compared with real experimental data and other formulas from some well-known standards. In 2012, a prediction model for the compressive strength of concrete under triaxial loading was proposed by Gandomi et al. [26]. They used GEP for this purpose, and the derived model had a superior performance comparing with empirical models. In 2014, a design equation for the shear strength of slender RC beams was derived by GEP [27]. The proposed formulation was compared to the formulation that was recommended by several building codes, and the GEP code was found to be more accurate. In 2015, Alkroosh and Ammash [28] used a GEP-based method to predict the punching shear strength of normal and high strength reinforced concrete flat slabs. They applied 58 case stories that measured the punching shear strength; it was shown that the model proposed by GEP has high accuracy and ability to define the important parameters, which significantly influenced the punching shear strength. In the other study [29], different cement strength classes were used to prepare the samples, and their compressive strengths were measured. The results indicated the strong potential of GEP in predicting the compressive strength of cement mortar. In Shahmansouri et al. [30], GEP is used to predict the compressive strength and electrical resistivity of concrete with natural zeolite. They stated that GEP is capable of predicting the considered properties with a high accuracy. Iqbal et al. [31] used waste foundry sand in the concrete and applied GEP as a tool for predicting the mechanical properties of concrete. They also compared the GEP model with other regression techniques and proved that it has high accuracy and potential for prediction. Behnia et al. [32] developed a model for predicting the static modulus of elasticity and uniaxial compressive strength (UCS) by a GEP method, and for this purpose, 42 datasets from previous studies were utilized. Of these, 22 sets were considered for training, and the rest were used for testing. In the other recent study [33], GEP was utilized to predict the compressive strength of geopolymer mortars with ferrosialate basement. Two GEP models were proposed in this research that both have a good fit with real data. According to the lack of an evolutionary intelligence method in previous research studies about the effect of nano-MgO on concrete, the current research utilizes GEP to produce a mathematical formula that is applicable for civil engineers for designing purposes or the prediction of the mechanical properties of concrete containing nano-MgO in the freeze–thaw condition.

2. Materials and Methods

2.1. Materials

In this study, a cement type 2 with a density of 3.15 gr/cm3 and blaine fineness of 3210 cm2/gr (confirming ASTM C150 [34]) was utilized in all mixes. The related properties are presented in Table 1.
Fine and coarse aggregates were extracted from a local mine. Grading tests were done on the coarse and fine aggregates, and results are shown in Table 2; Table 3. According to Table 3, the fine aggregate is coarse-grained (sieve No. 4 has 17% remaining mass), and the fineness modulus is 3.8. Therefore, fine aggregates are modified to reduce the fineness modulus to meet the recommended amount in the standard of ASTM C33, [35]. In this regard, the aggregates of sieve No. 4 and half of sieve No. 8 were assumed as a part of coarse aggregates. This matter is considered in the mixture designation of concrete, and the required water content of concrete is modified due to this issue.
Nano-MgO particles are used as admixture by the percentage of cement weight. The nanoparticles are less than 40 nm, and the density of nano-MgO is 3.58 g/cm3 with a purity of 99%. Table 4 presents the details of nano-MgO analysis.

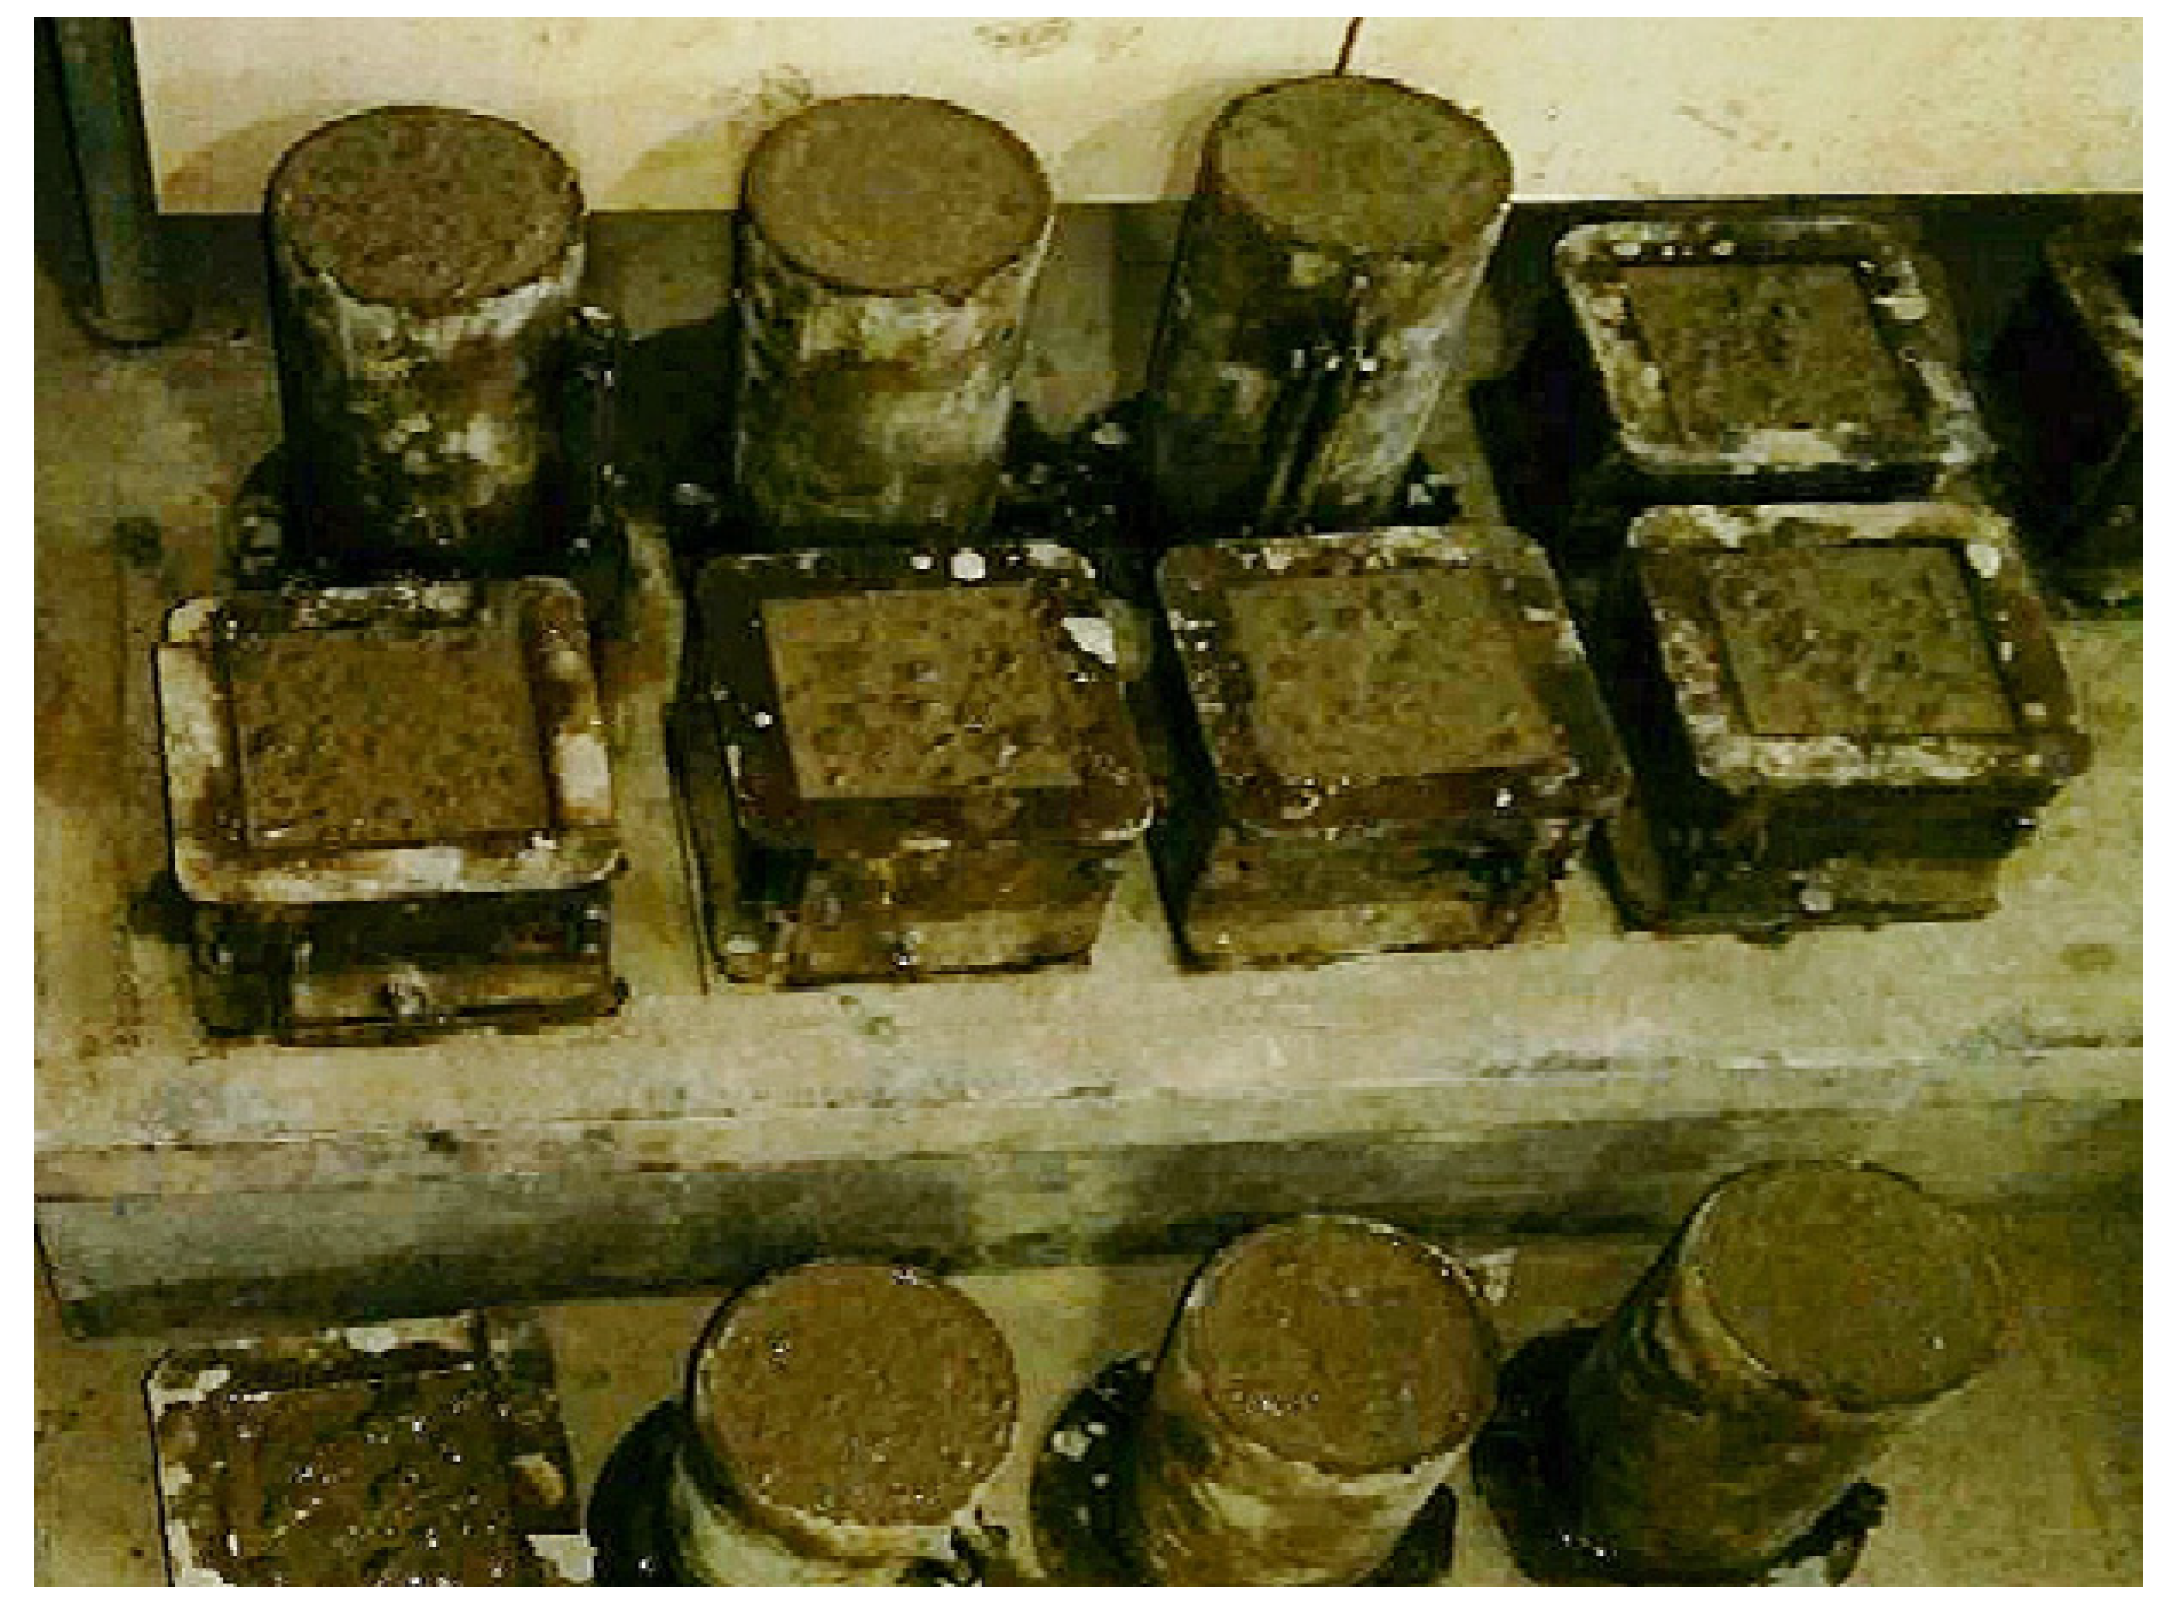
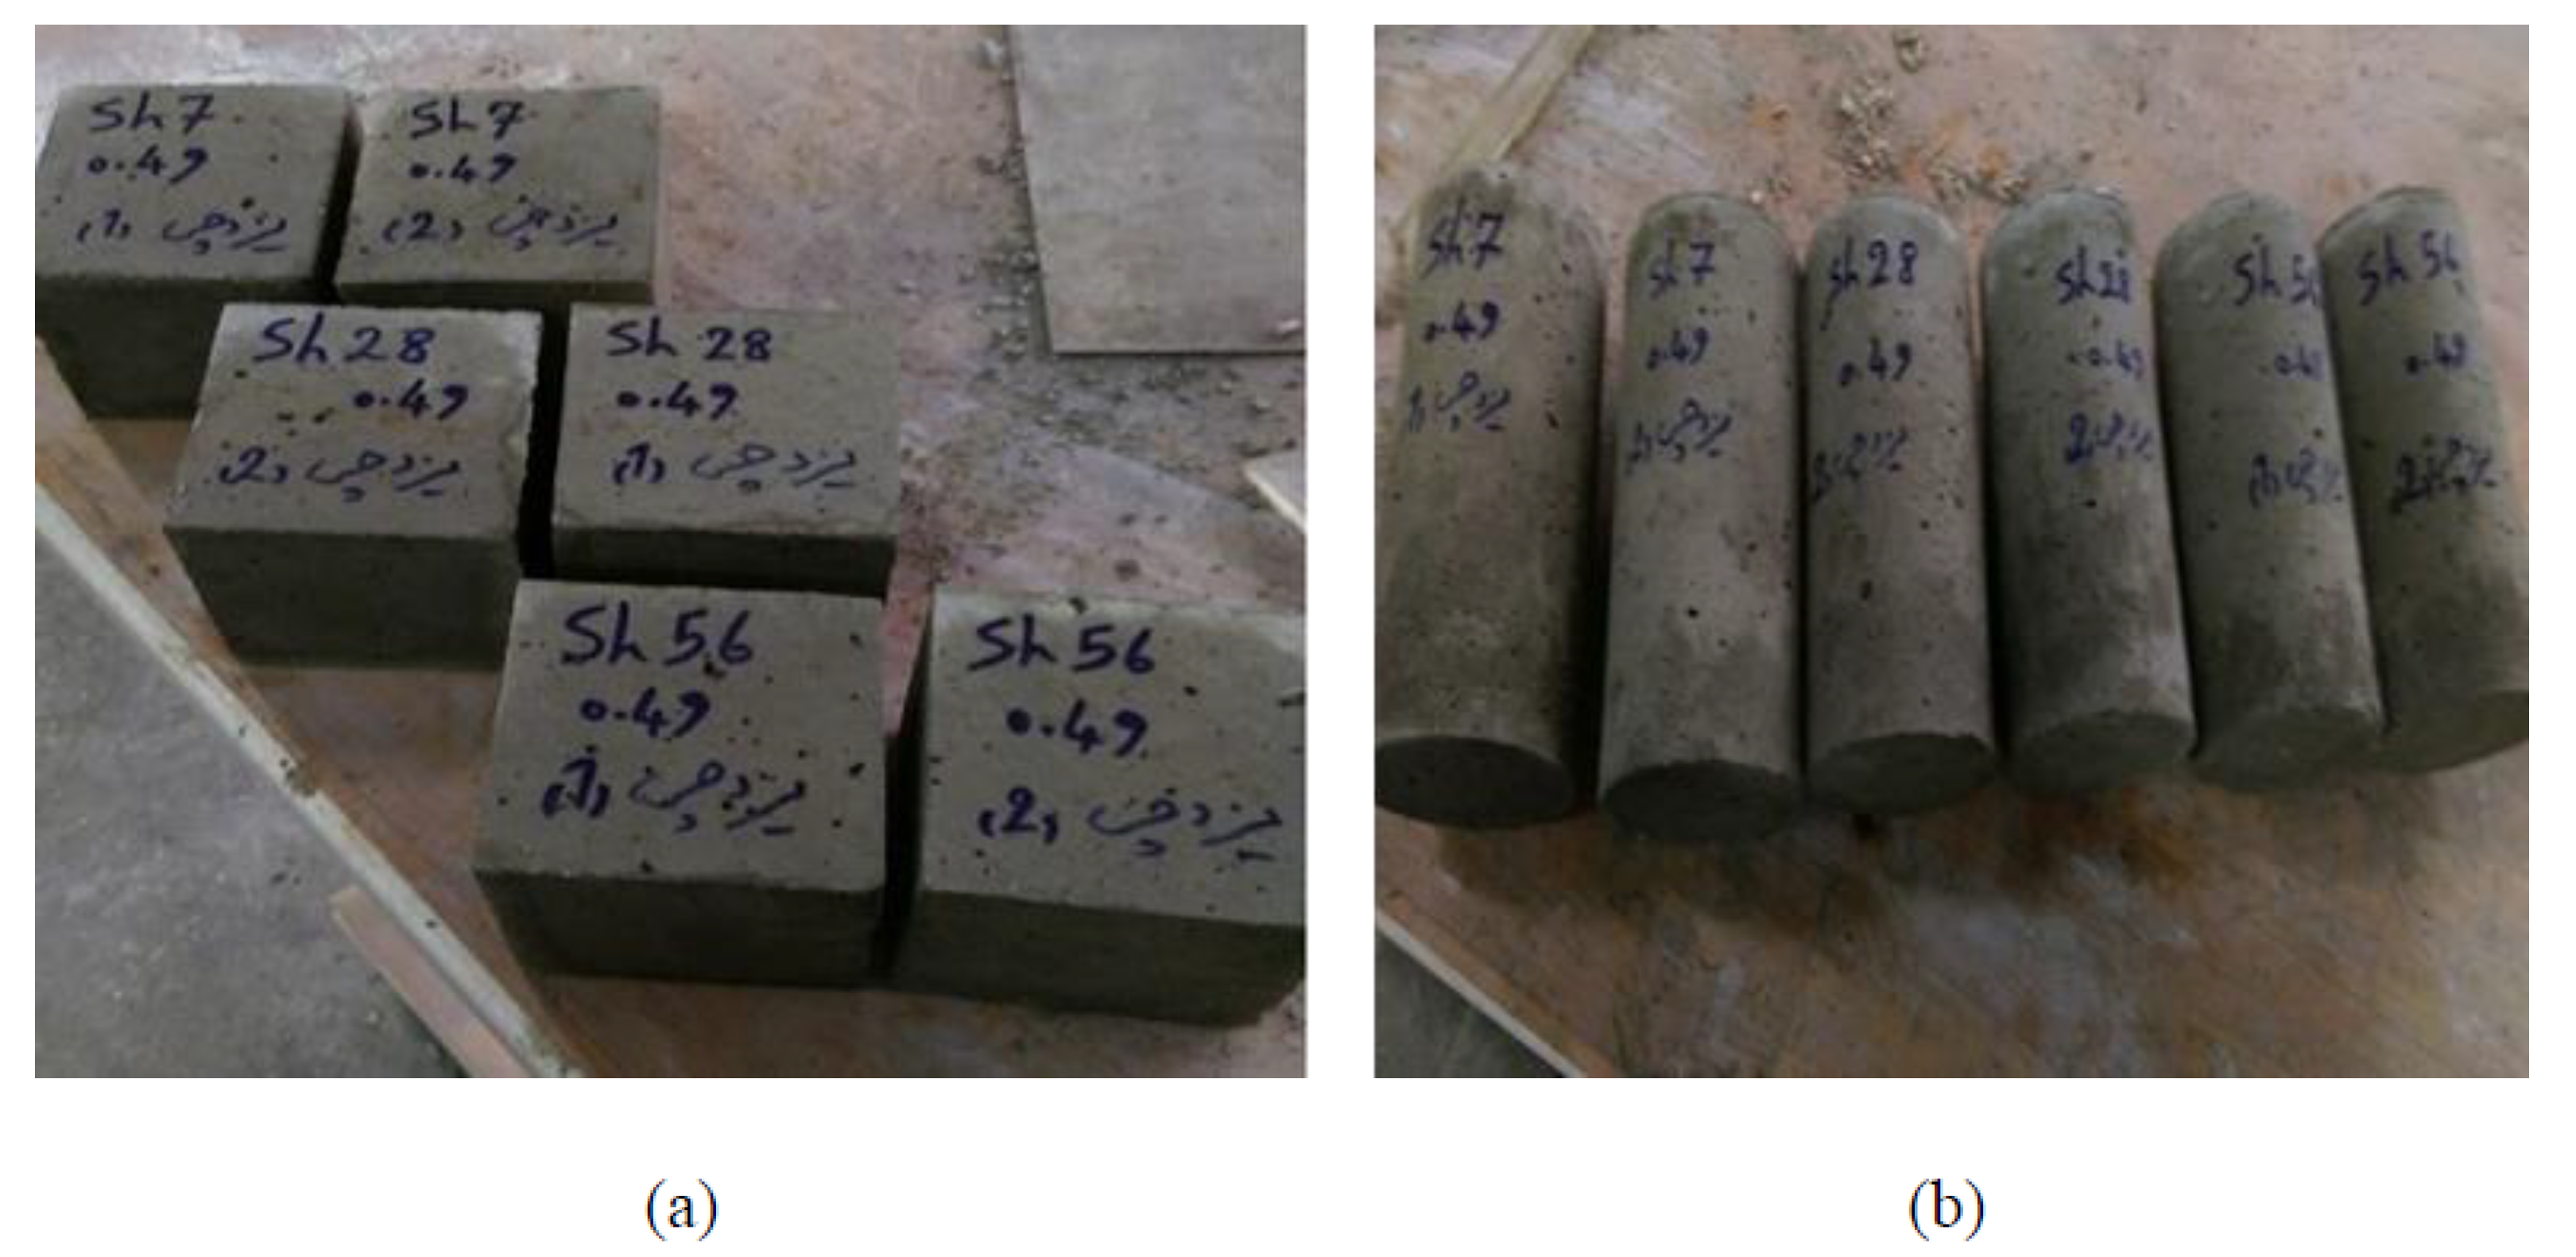
2.2. Mixture and Sample Preparation

In this study, 98 cubic concrete samples (10 × 10 × 10 cm) and 78 cylindrical concrete samples (10 × 20 cm) are made with different percentages of nano-MgO. The amount of nano-MgO in concrete is specified by the percentage of the cement weight. The assumed amounts of nano-MgO are 0%, 0.5%, 1%, and 1.5% of the cement weight. For the regular and identical distribution of nanoparticles in the mixture, they should be used in a solution form; otherwise, the mixture leads to agglomeration, entailing an inevitable reduction in the mechanical properties of concrete. In this regard, an ultrasonic stirring instrument is used, and different amounts of nano-MgO are dissolved at a high speed in water for 5 min [36]. This solution is added to the mixture and stirred for 3 min to reach uniform nano-powder dispersion. Finally, the concrete mixture is poured into cubic and cylindrical molds. The molds are filled with concrete over three steps. Three or 4 cm of the mold height is filled with concrete in each step and vibrated for 5 s to remove the air voids. Figure 1 shows fresh concrete in molds.
Samples without nano-powder are called plain samples or control samples, which are used to compare the effect of nano-MgO on the mechanical properties of the concrete. The other variable was water-to-binder ratio. Samples with three water-to-binder ratios (0.44, 0.49, and 0.62) were prepared and subjected to the curing process. To cure the samples, a water tank with a temperature of 23 ± 2 °C is utilized and concrete samples are placed in a water tank for 7, 28, and 56 days. The variables of the samples are presented in Table 5.

2.3. Experimental Tests

2.3.1. Freeze–Thaw Test

To investigate the effect of nano-MgO on the freeze–thaw resistivity of concrete samples, a rapid freeze–thaw machine is required to simulate the periodic freeze–thaw cycles in nature. In this connection, we utilized a programmable freeze–thaw machine that is capable of determining the freeze–thaw time periods according to ASTM C666 [37]. There are two procedures for performing the freeze–thaw experiment: (A) rapid freezing and thawing in water and (B) rapid freezing in air and thawing in water. In this research, procedure A is selected. The nominal temperatures for freezing and thawing are the same for both procedures, and the temperature of the sample is decreased until 18 °C and raised up to 4 °C. According to the guideline, the procedure should take between 2 and 5 h. Furthermore, the thawing time should be at least 25% of one cycle time. At the end of the cooling and heating procedures, the temperature in the center of the sample should be −18 ± 2 °C and 4 ± 2 °C, respectively. A thermometer is installed in the center of a cubic (10 × 10 × 10) sample. This method ensures accuracy regarding the temperature of the sample’s center. The sensors are connected to a computer that controls the temperatures; for example, when the temperature reaches −18 °C, it stops the freezing process and starts the heating process up to 4 °C and vice versa. Concrete samples are placed in molds containing 3 mm water around the samples, and all samples are subjected to 300 freeze–thaw cycles. Figure 2 shows the cubic and cylindrical samples.

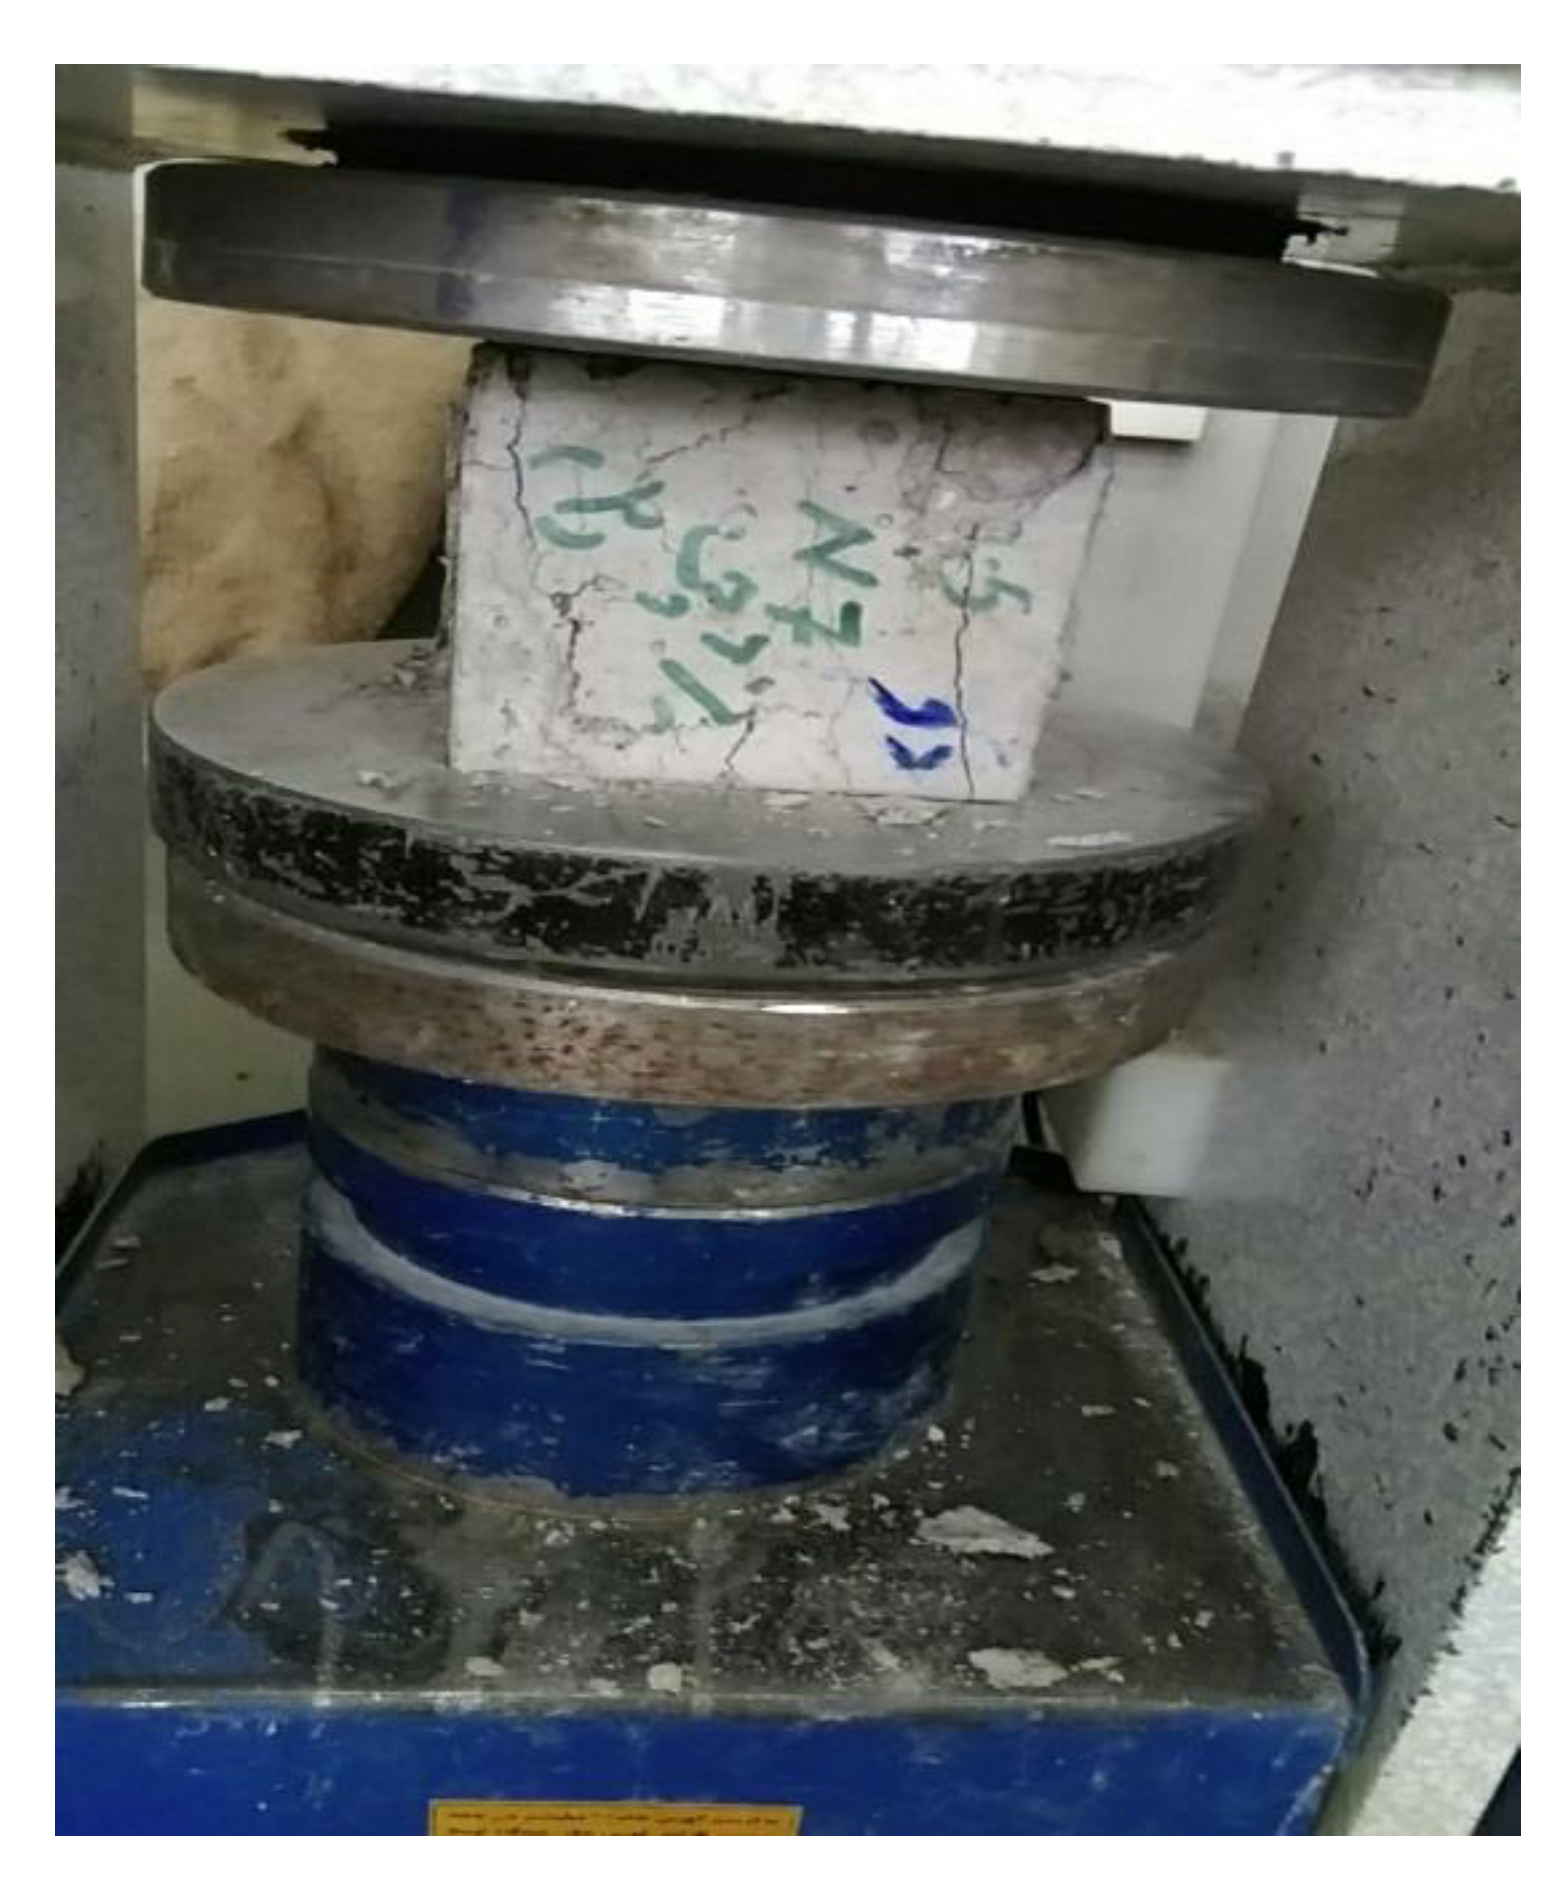
2.3.2. Compressive Test
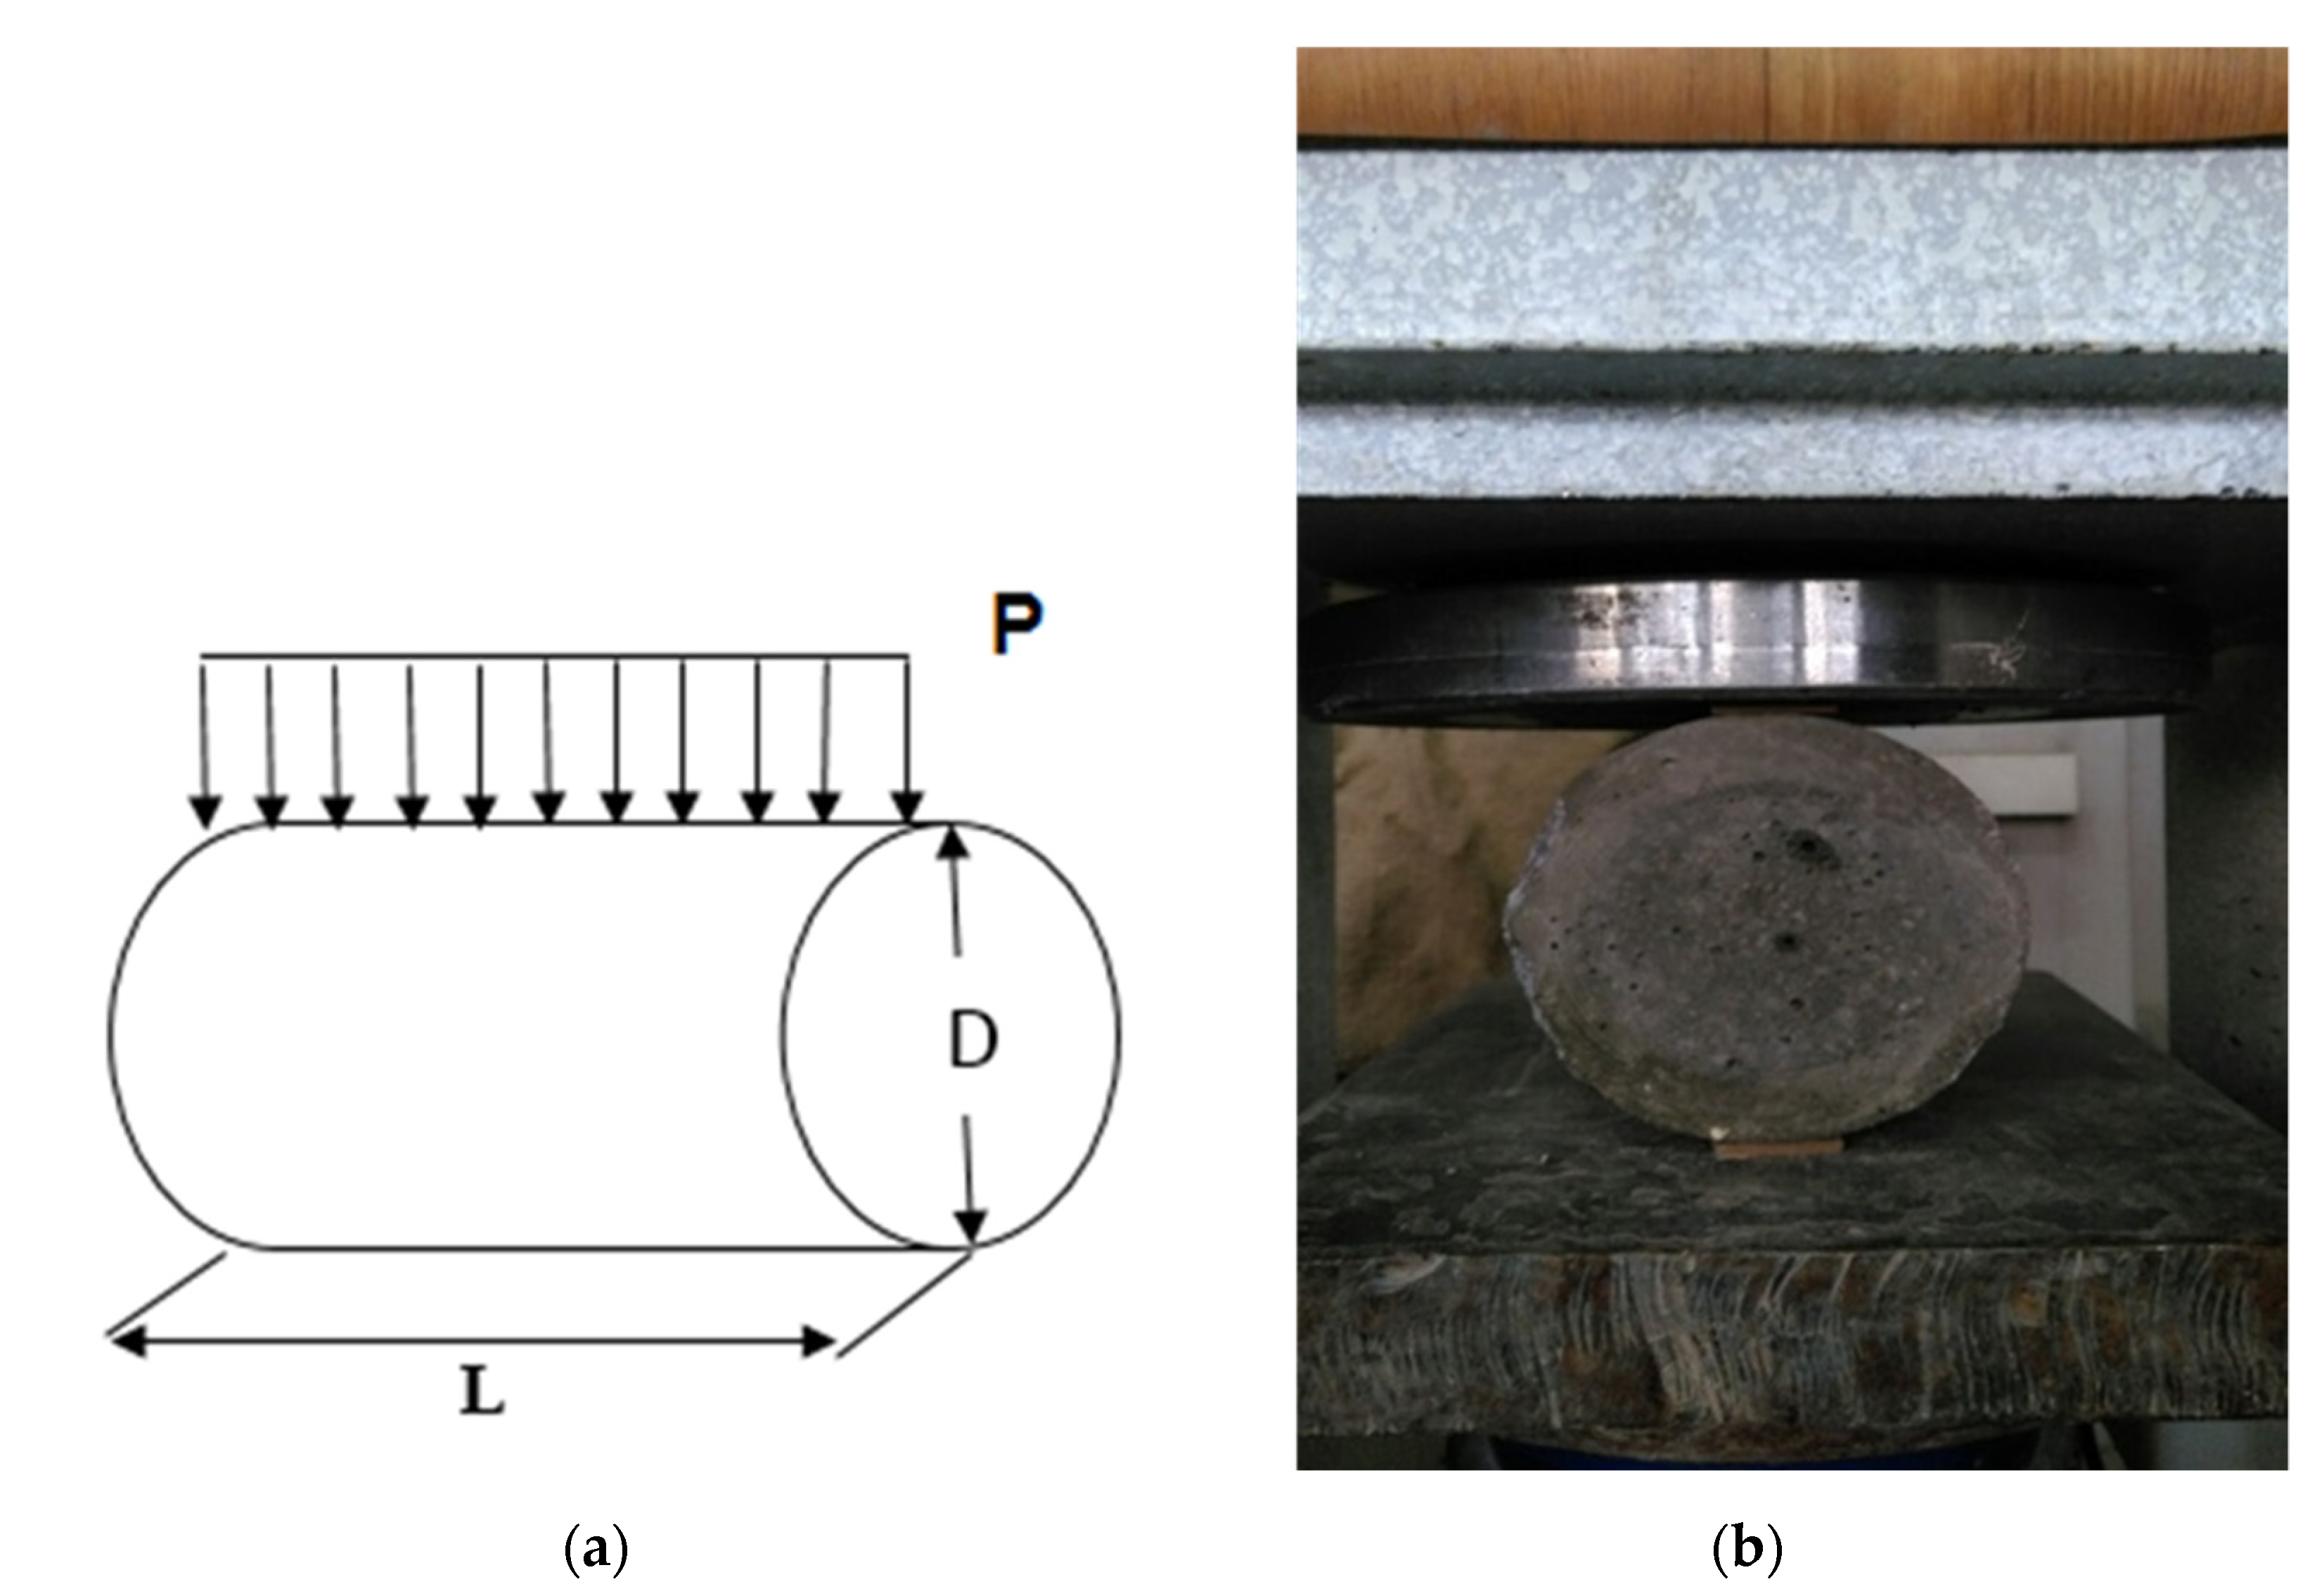
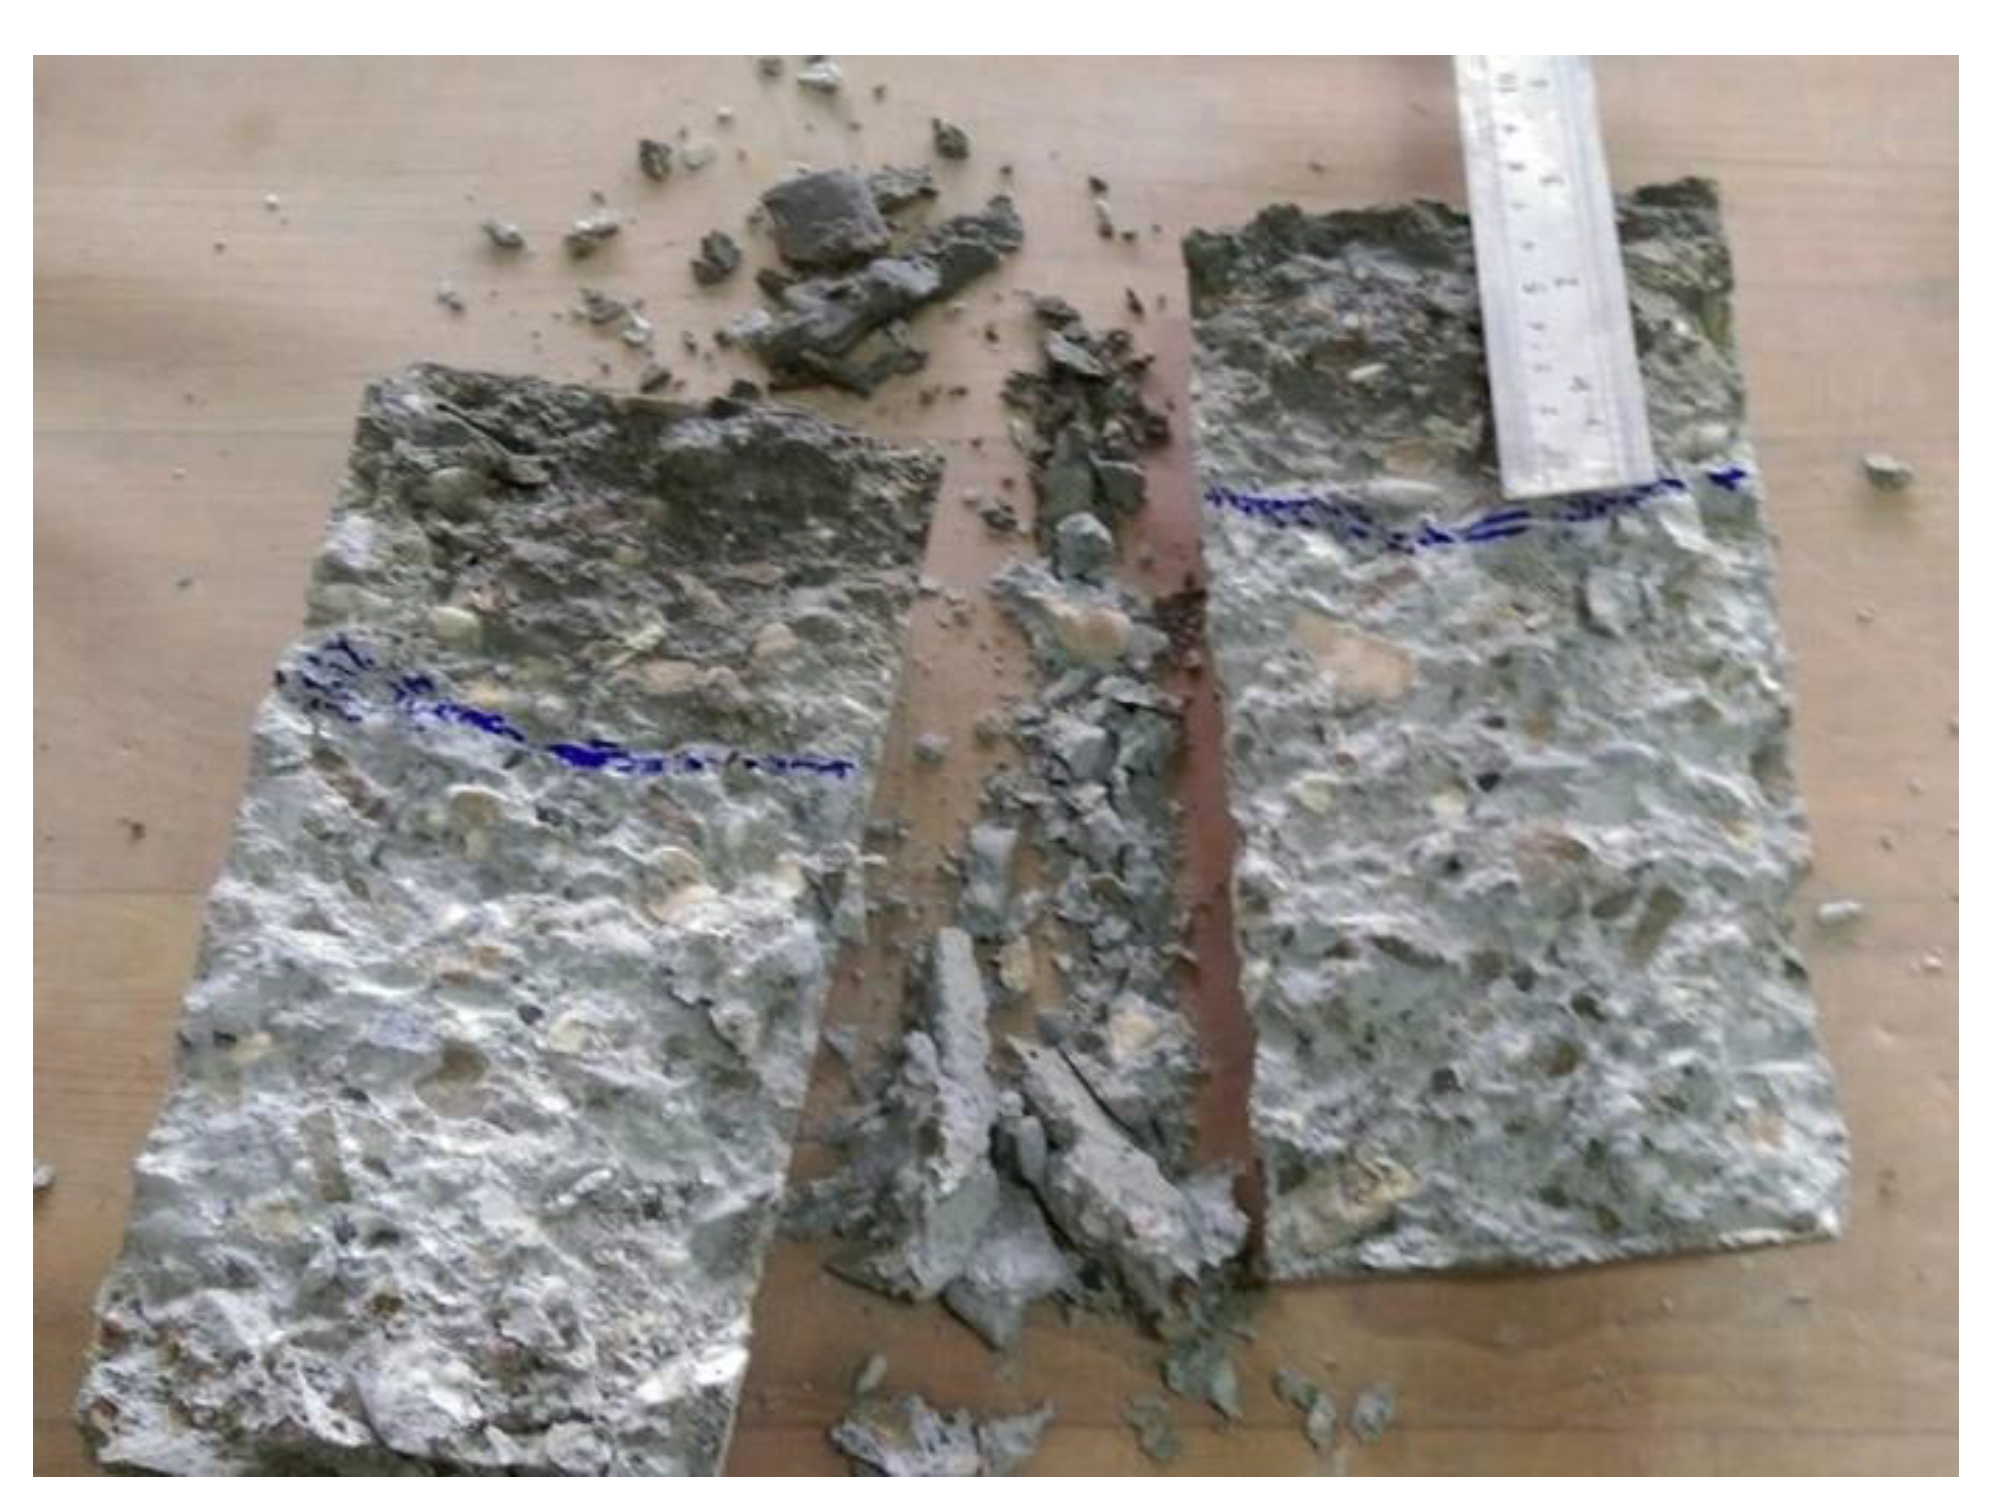
The compressive test is performed using the cubic 10 cm samples. The compressive test shows the general properties of concrete; it determines whether the concrete is acceptable for special usage or not. The process is done by using a compressive test machine that has two parallel plates; the sample is placed between two plates, while the upper plate comes down at a steady rate. The rate of load velocity applied to the specimens is 140 kg/cm2/min. The loading continued until the failure of the specimens. Figure 3 demonstrates a cubic sample under the compressive test machine.

2.3.3. Tensile Test

The splitting tensile test is a method for measuring the tensile strength of cylindrical concrete samples. This test is done according to ASTM C496 [38]. The splitting tensile test machine is applied by the load within a range of 0.7 to 1.4 MPa/min at a constant rate without any shock. To ensure that the load is uniformly imposed on the sample, two wooden sticks are put on the bottom and top of the samples (Figure 4).
The tensile strength of the specimen can be calculated as follows:
T = 2 P / ( π L D )
where T is the splitting tensile strength (MPa), P is the maximum force indicated by the testing machine before the failure of the specimen (N), L is the length of the specimen (mm), and D is the diameter of the specimen (mm). Figure 4a shows the parameters of this equation in a schematic form.

2.3.4. Permeability Test

The water permeability test is also applied to the cylindrical samples according to the standard of DIN 1048 [39]. At the end of the curing period, the specimens are put in a freeze–thaw chamber and subjected to 300 cycles of the freezing and heating action. The samples are dried in an oven for 24 h and then placed in a permeability apparatus under 5 bar pressure of water for 24 h. Afterwards, the splitting test is performed, and the length of the water penetration is measured (Figure 5).

3. Evolutionary Intelligence Method

The GEP method was used to find a mathematical formula between the parameters and properties of concrete samples containing nano-MgO particles under the freeze–thaw condition. This section describes this method briefly.

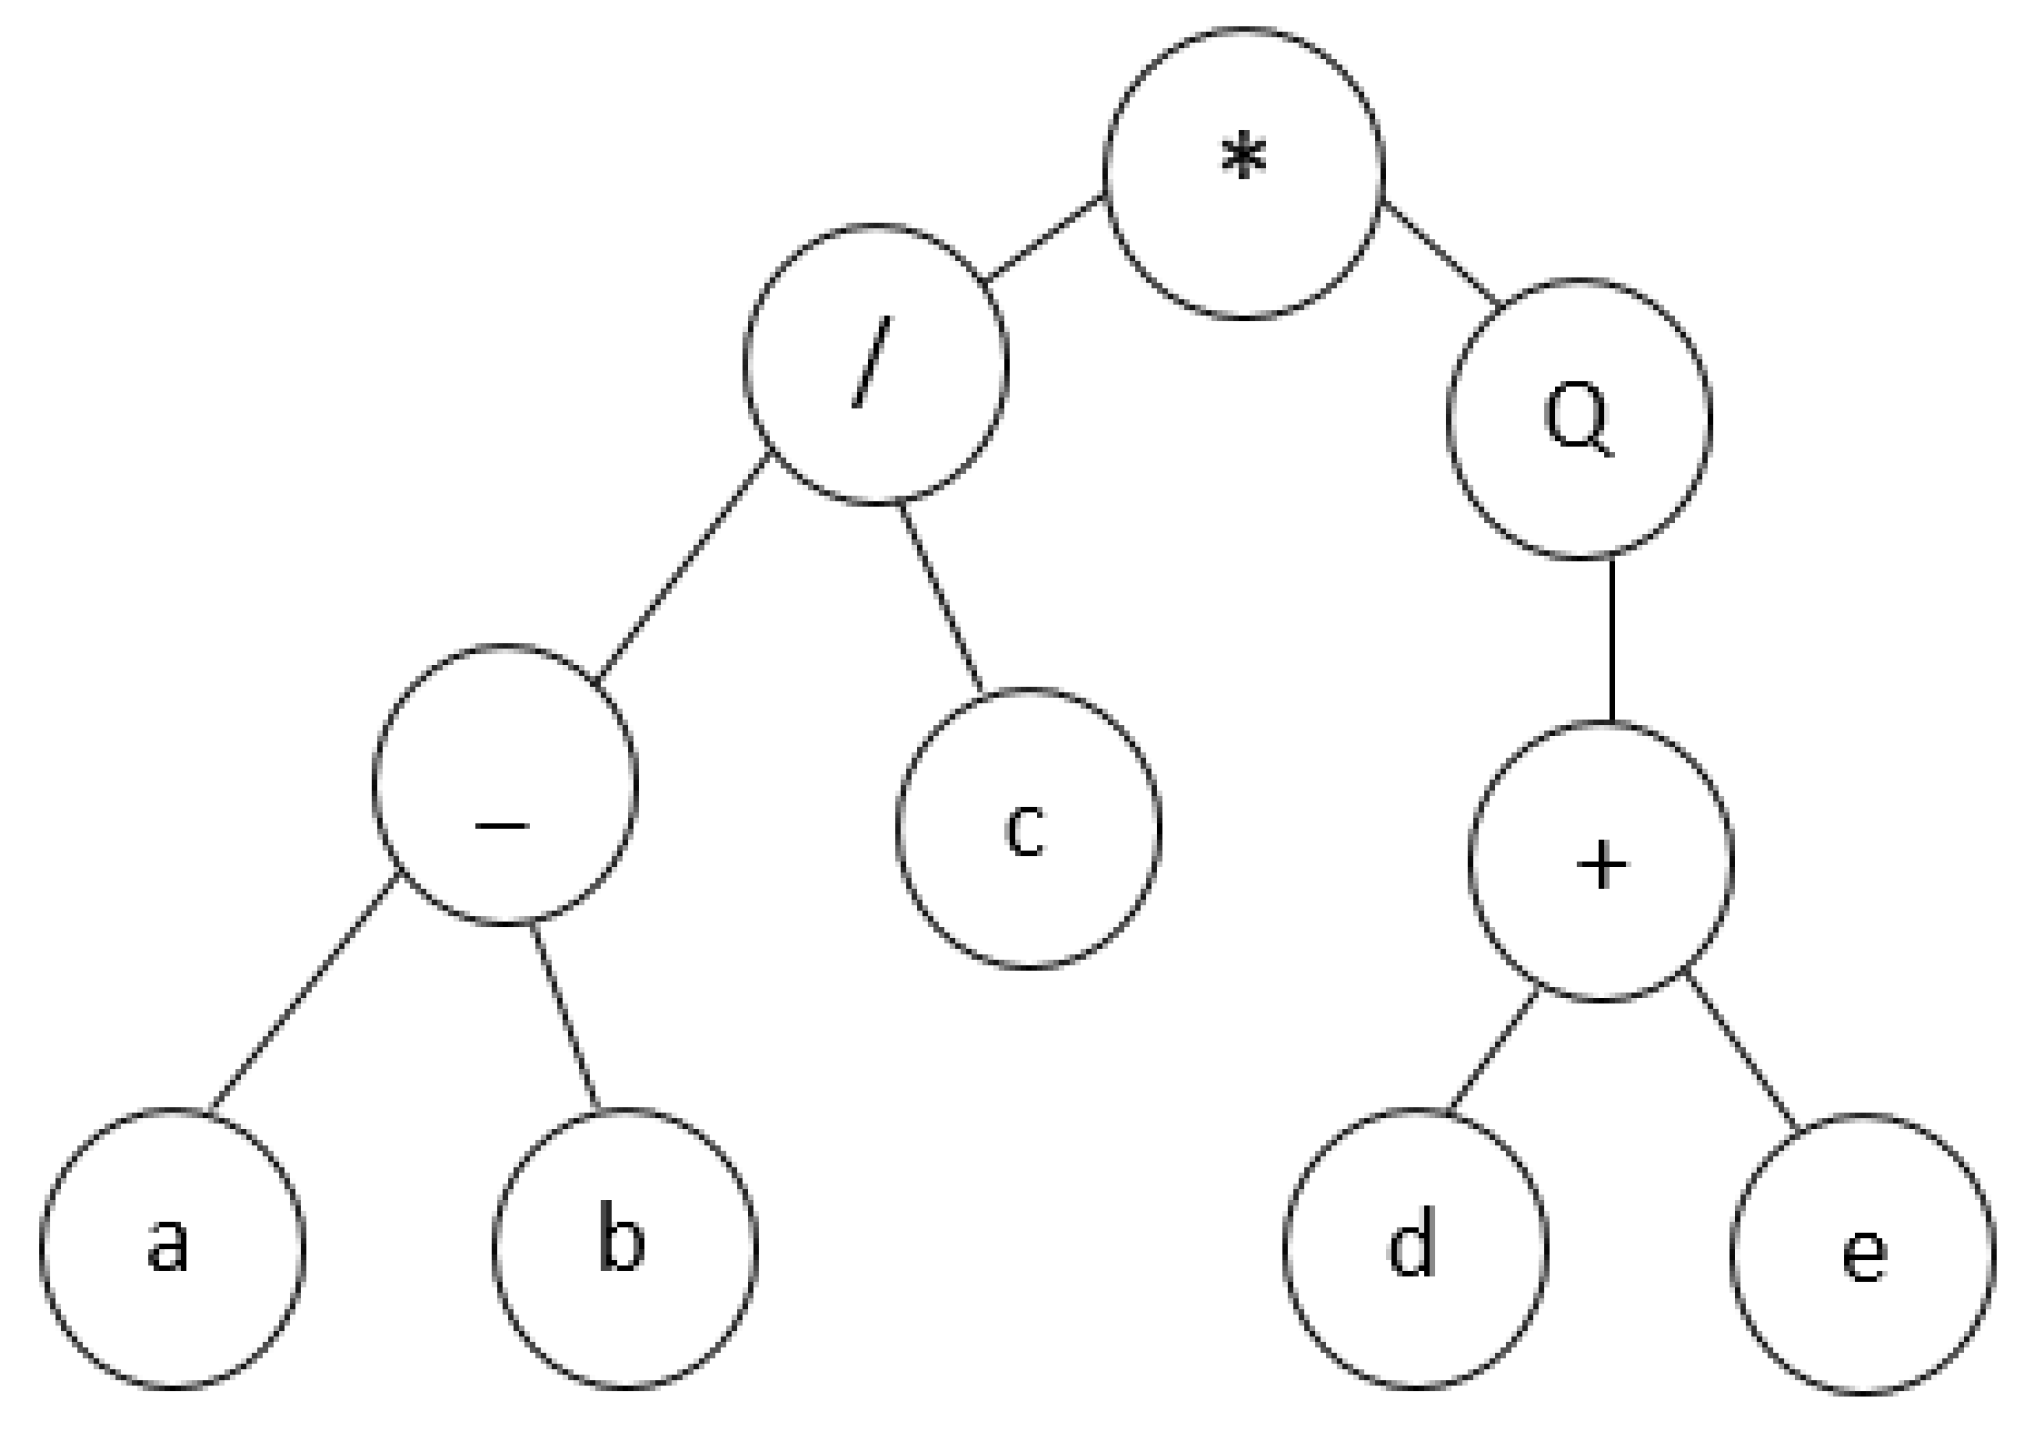
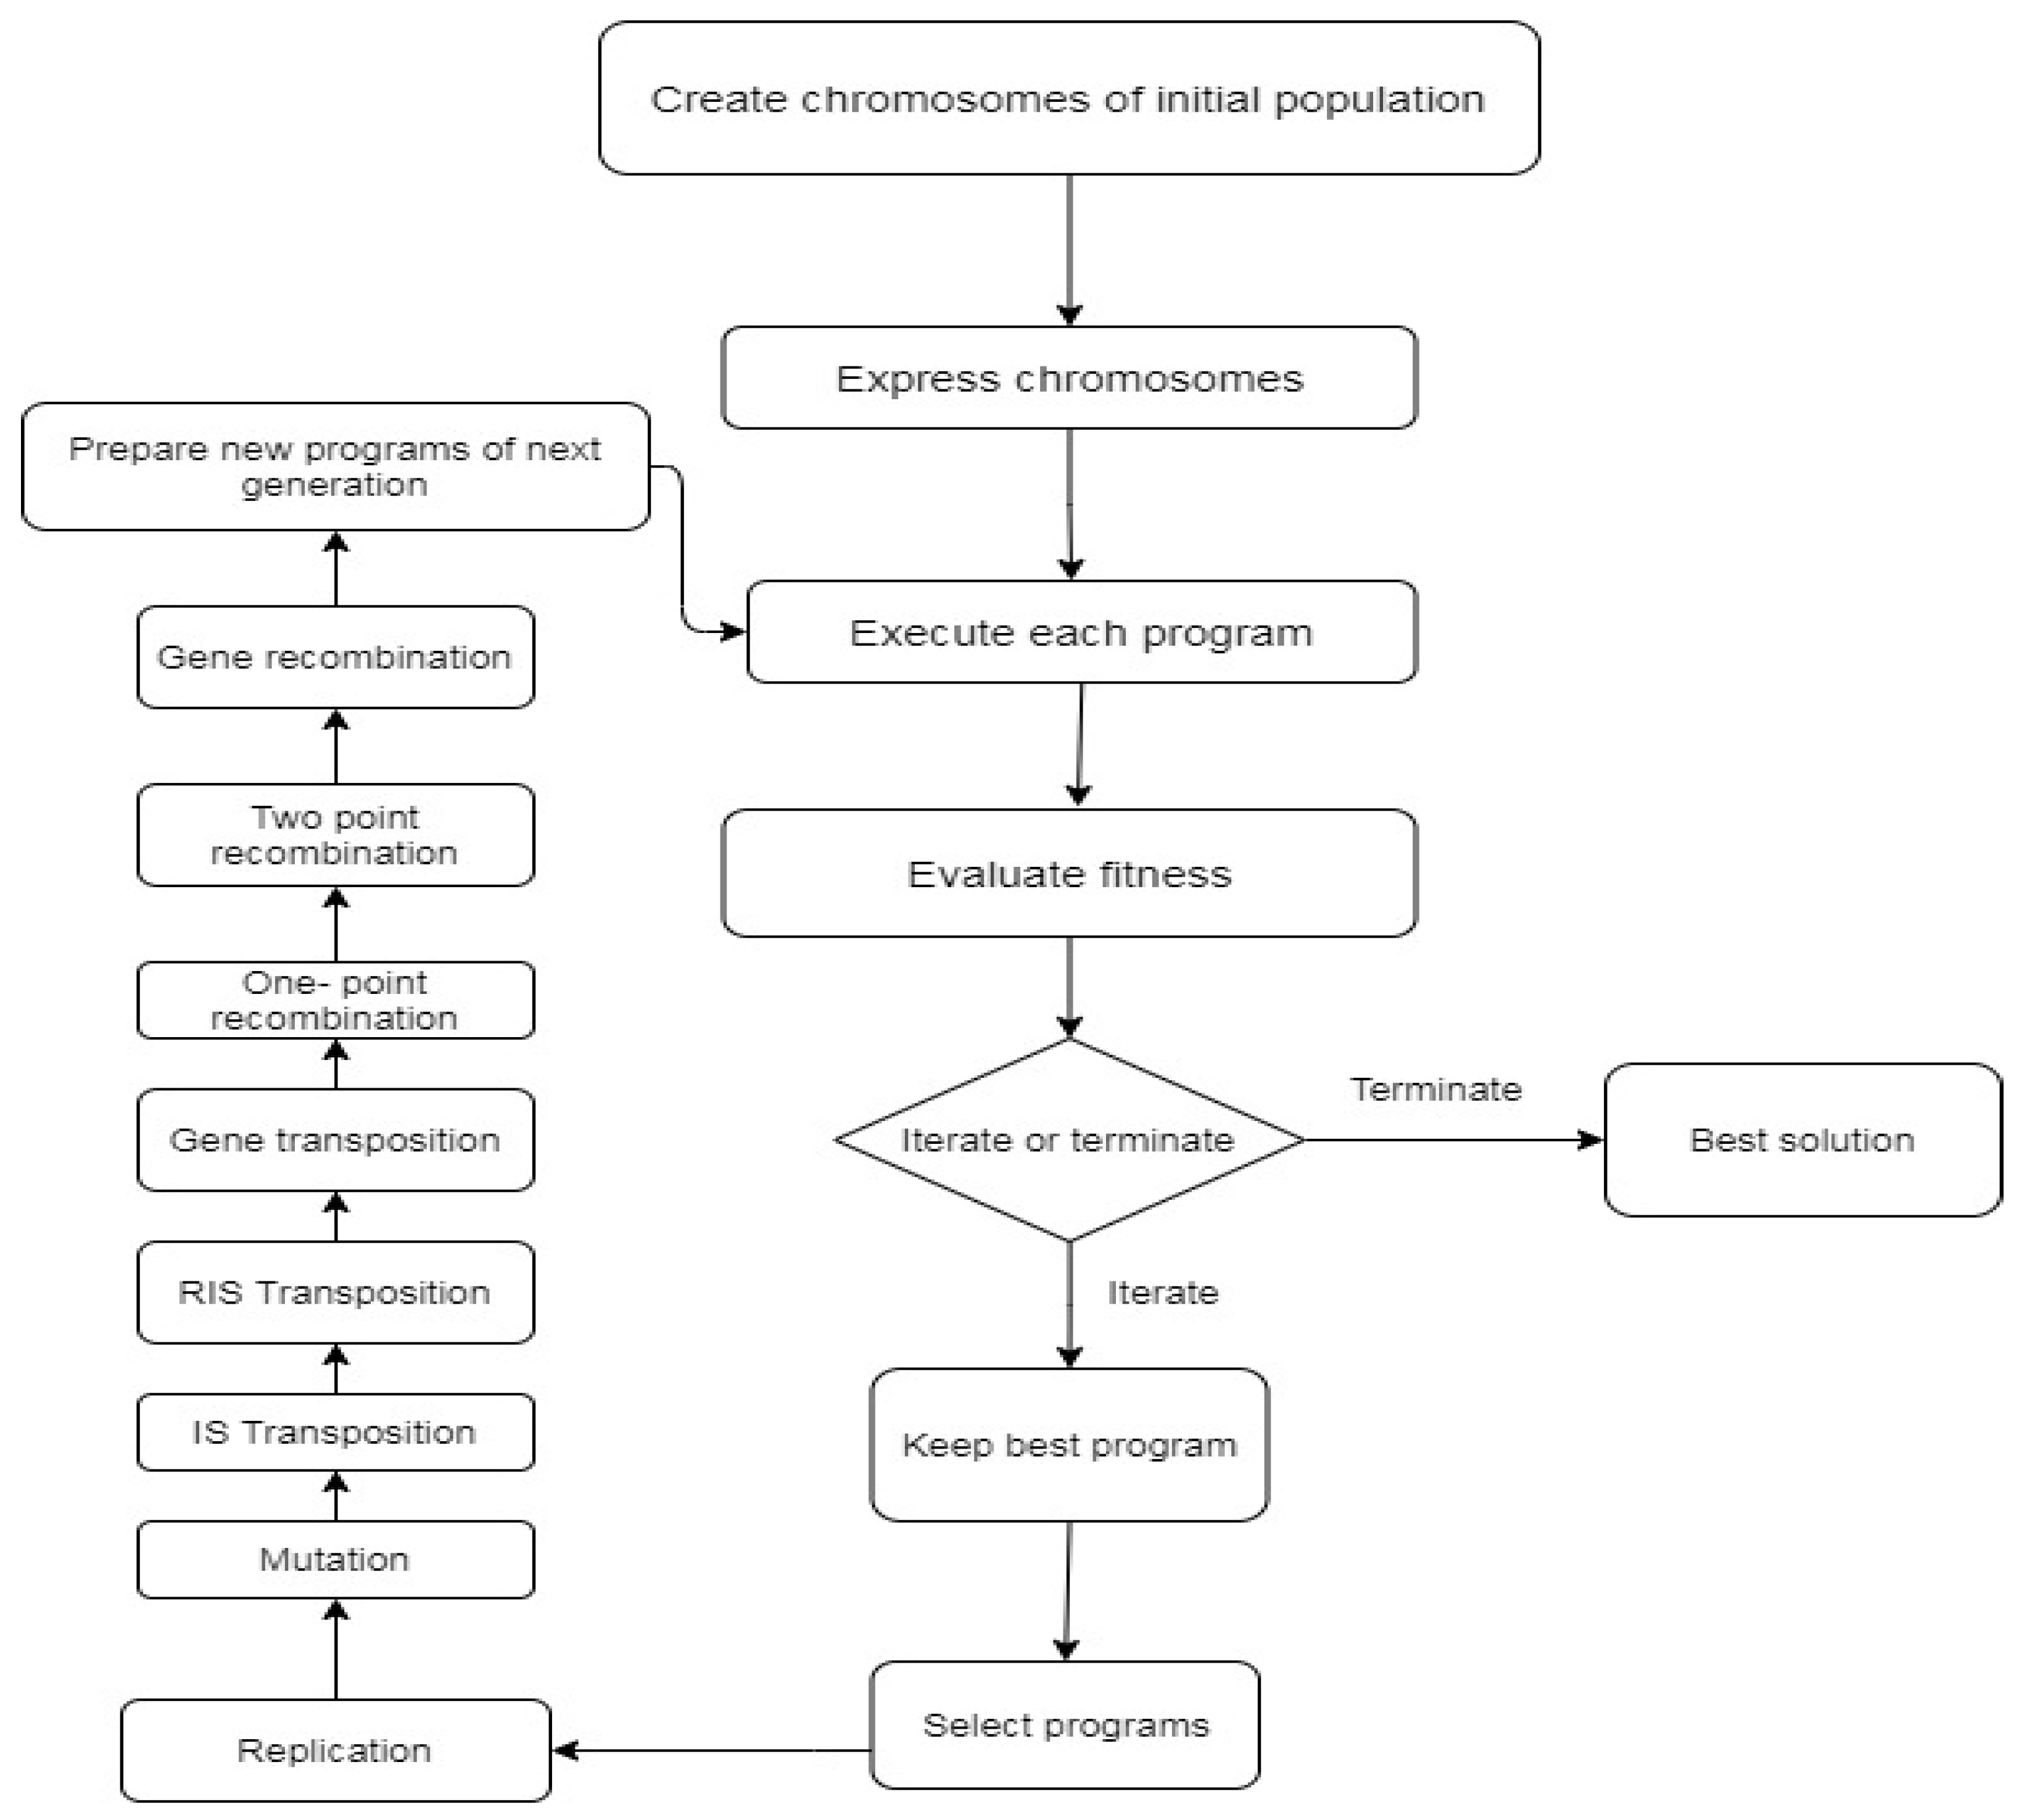
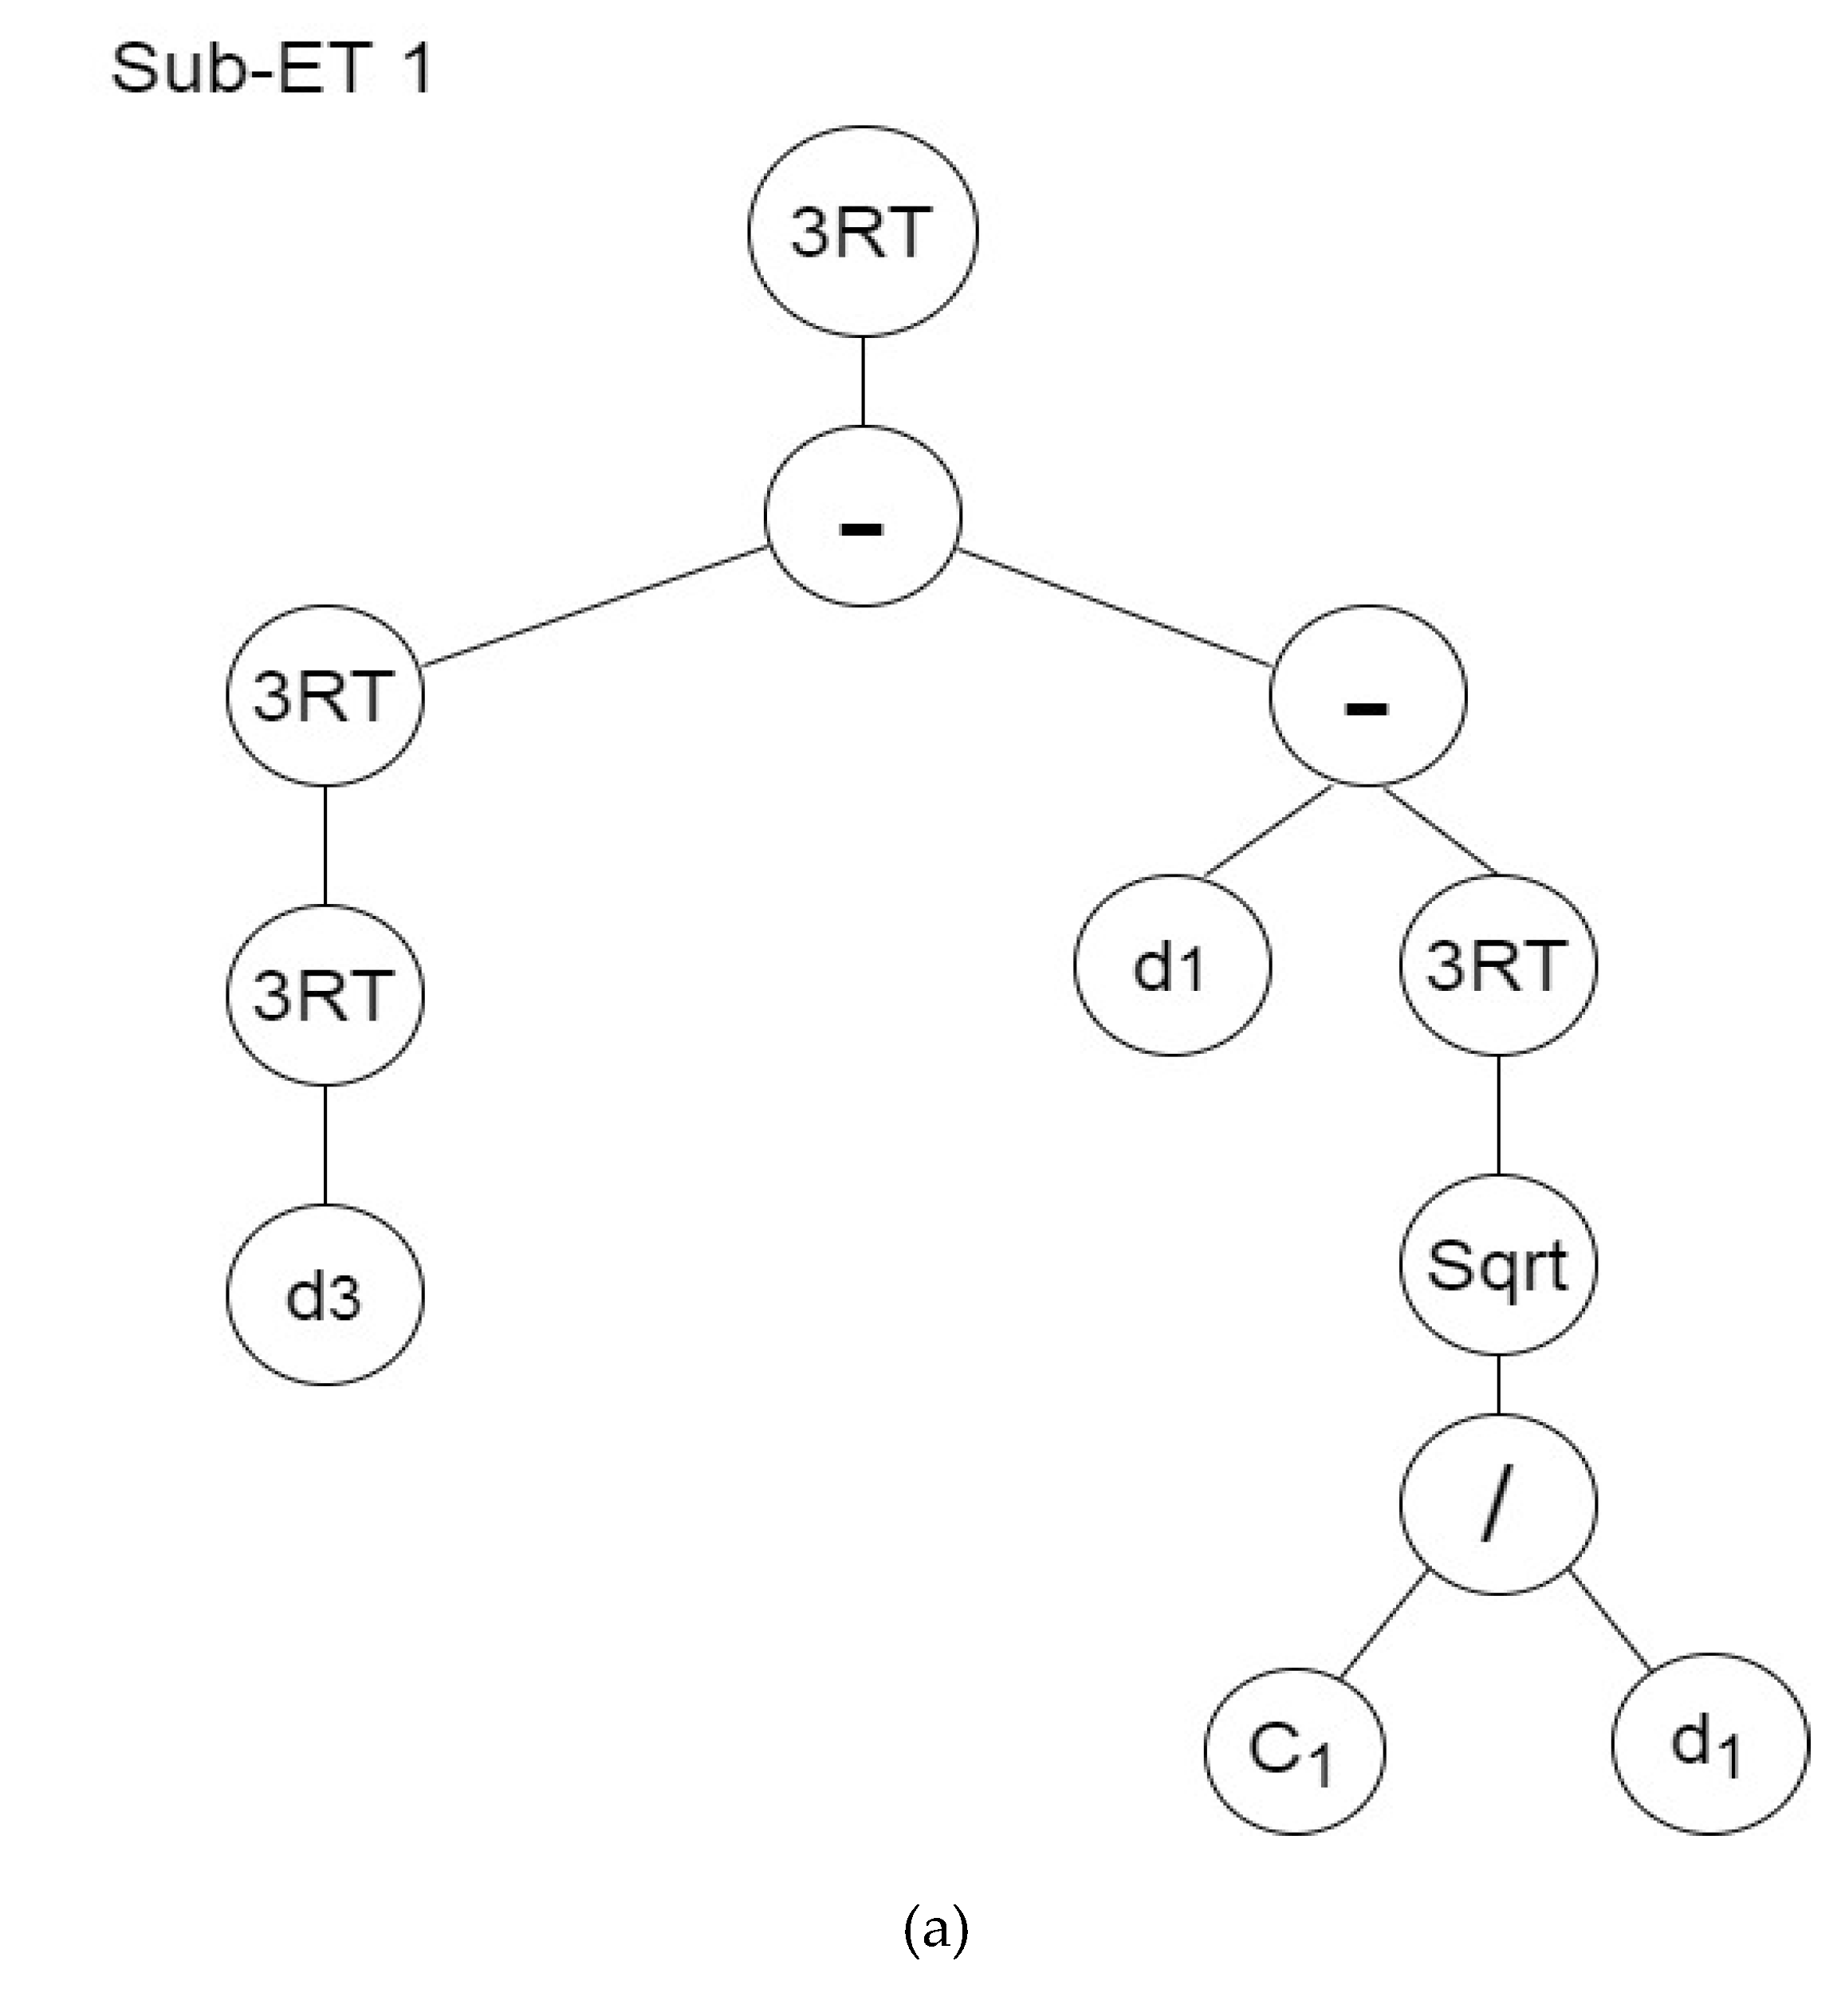
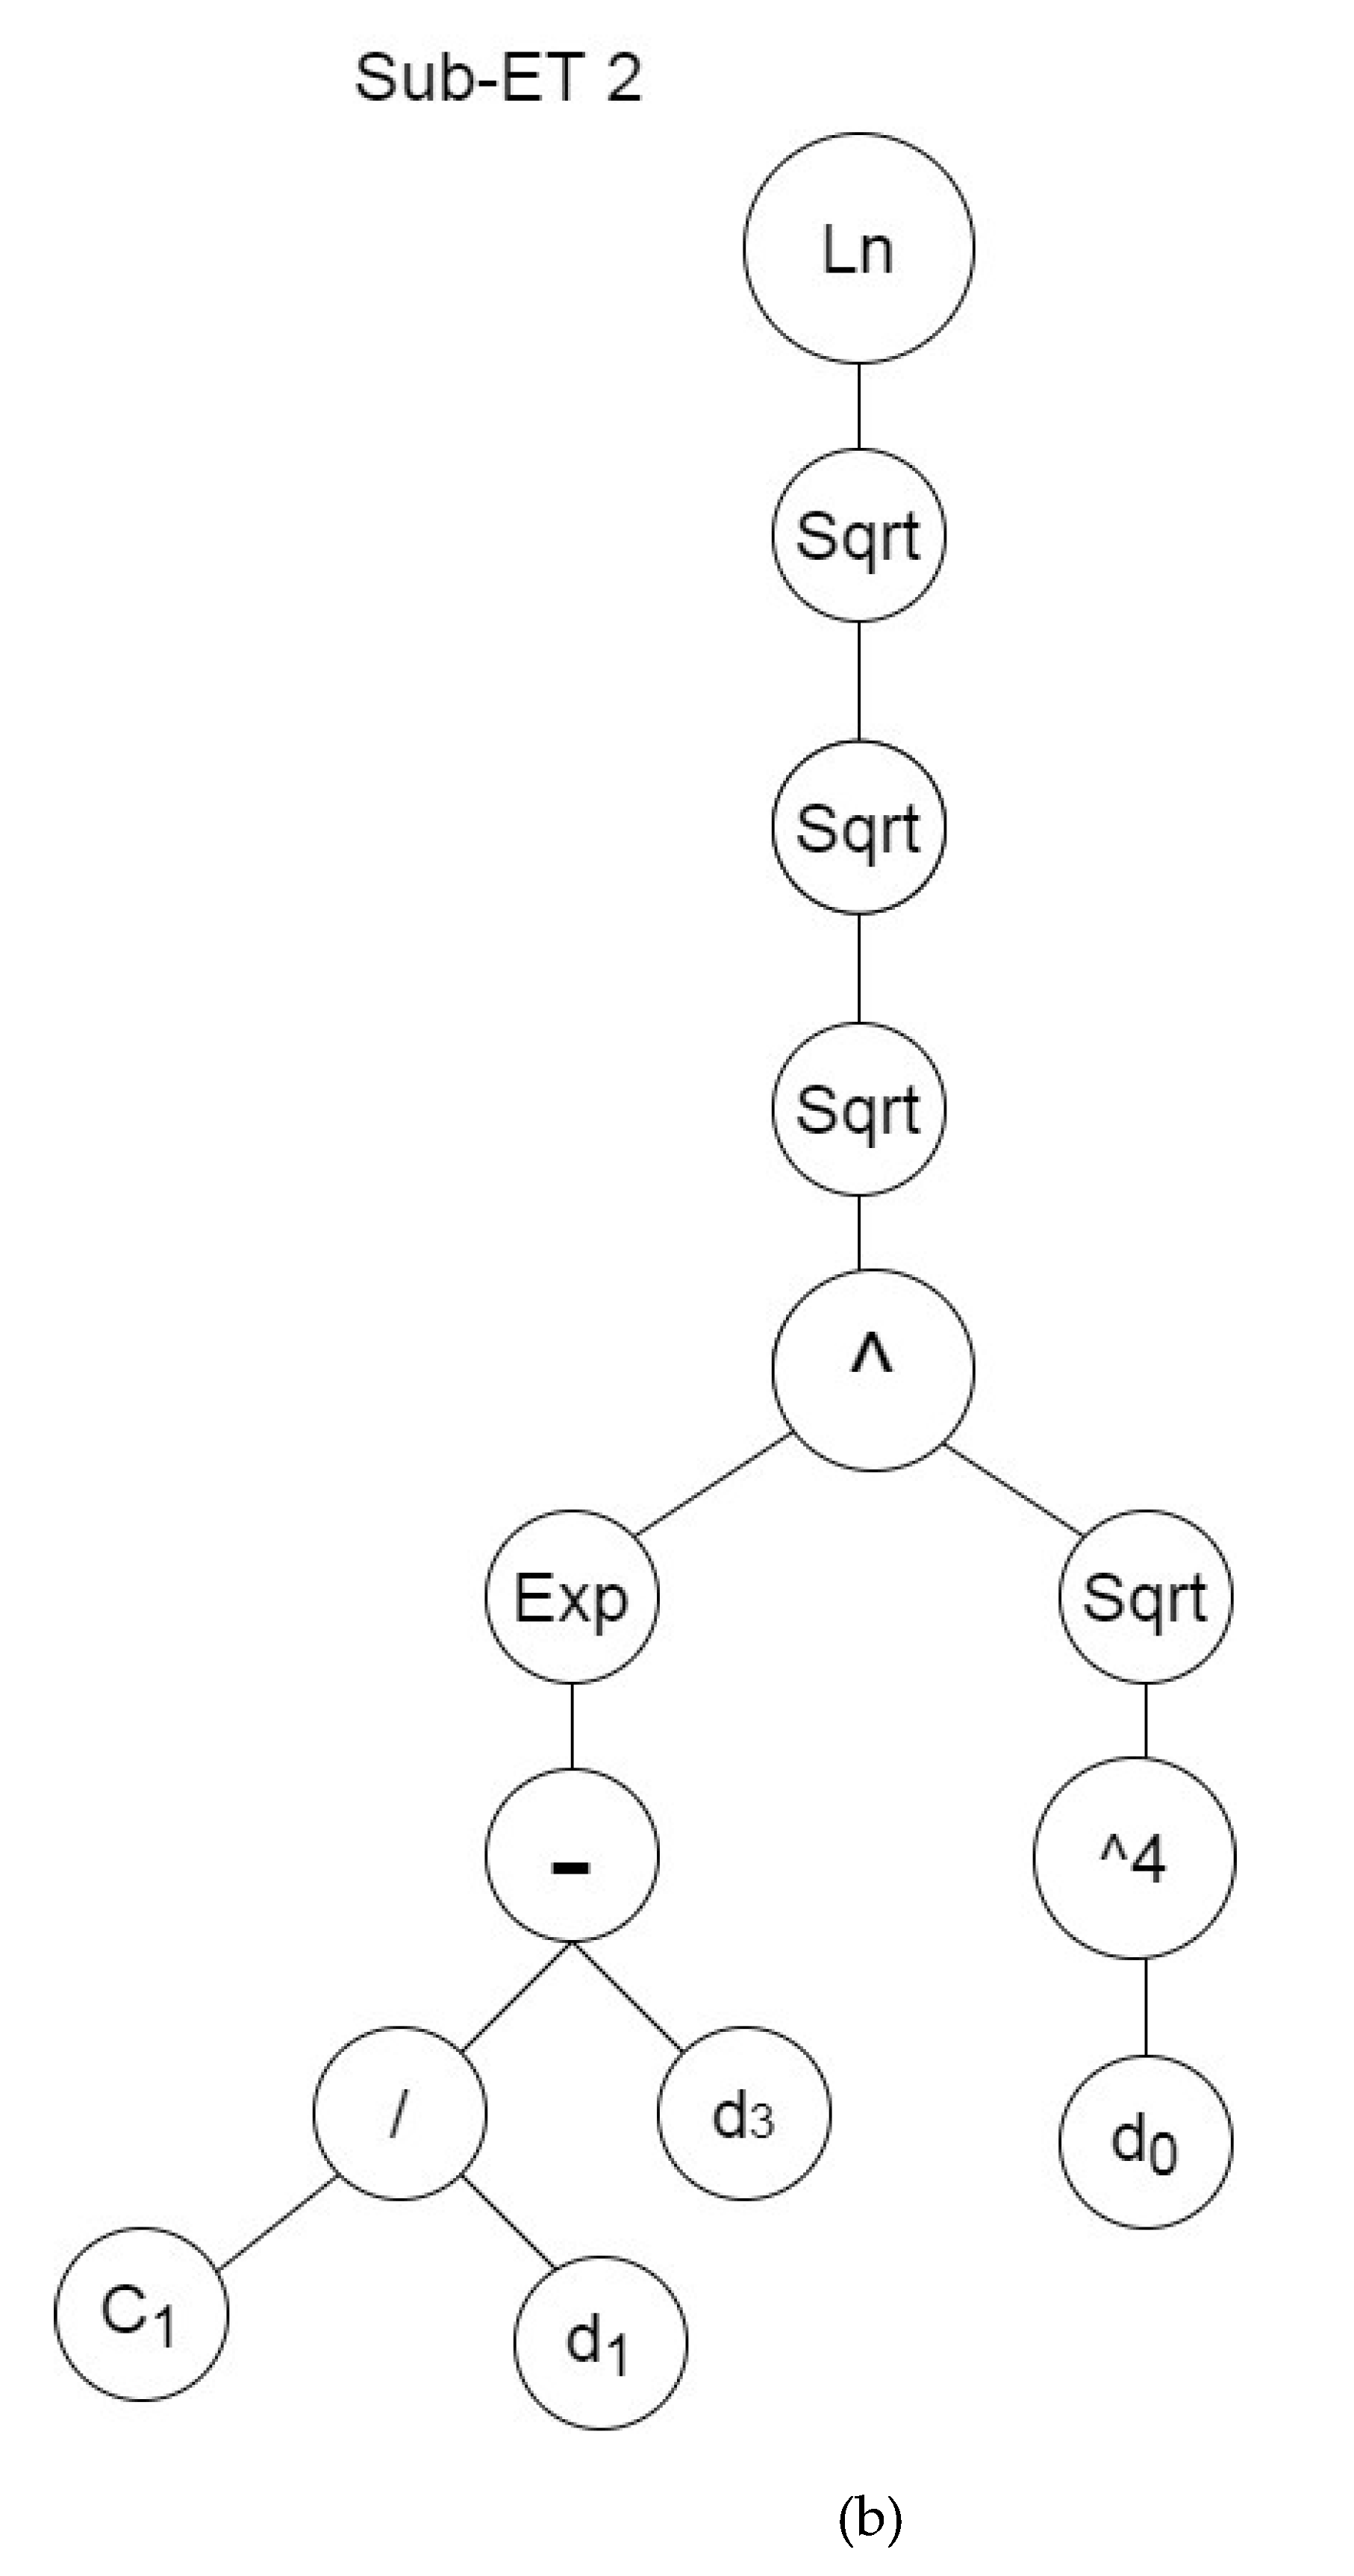
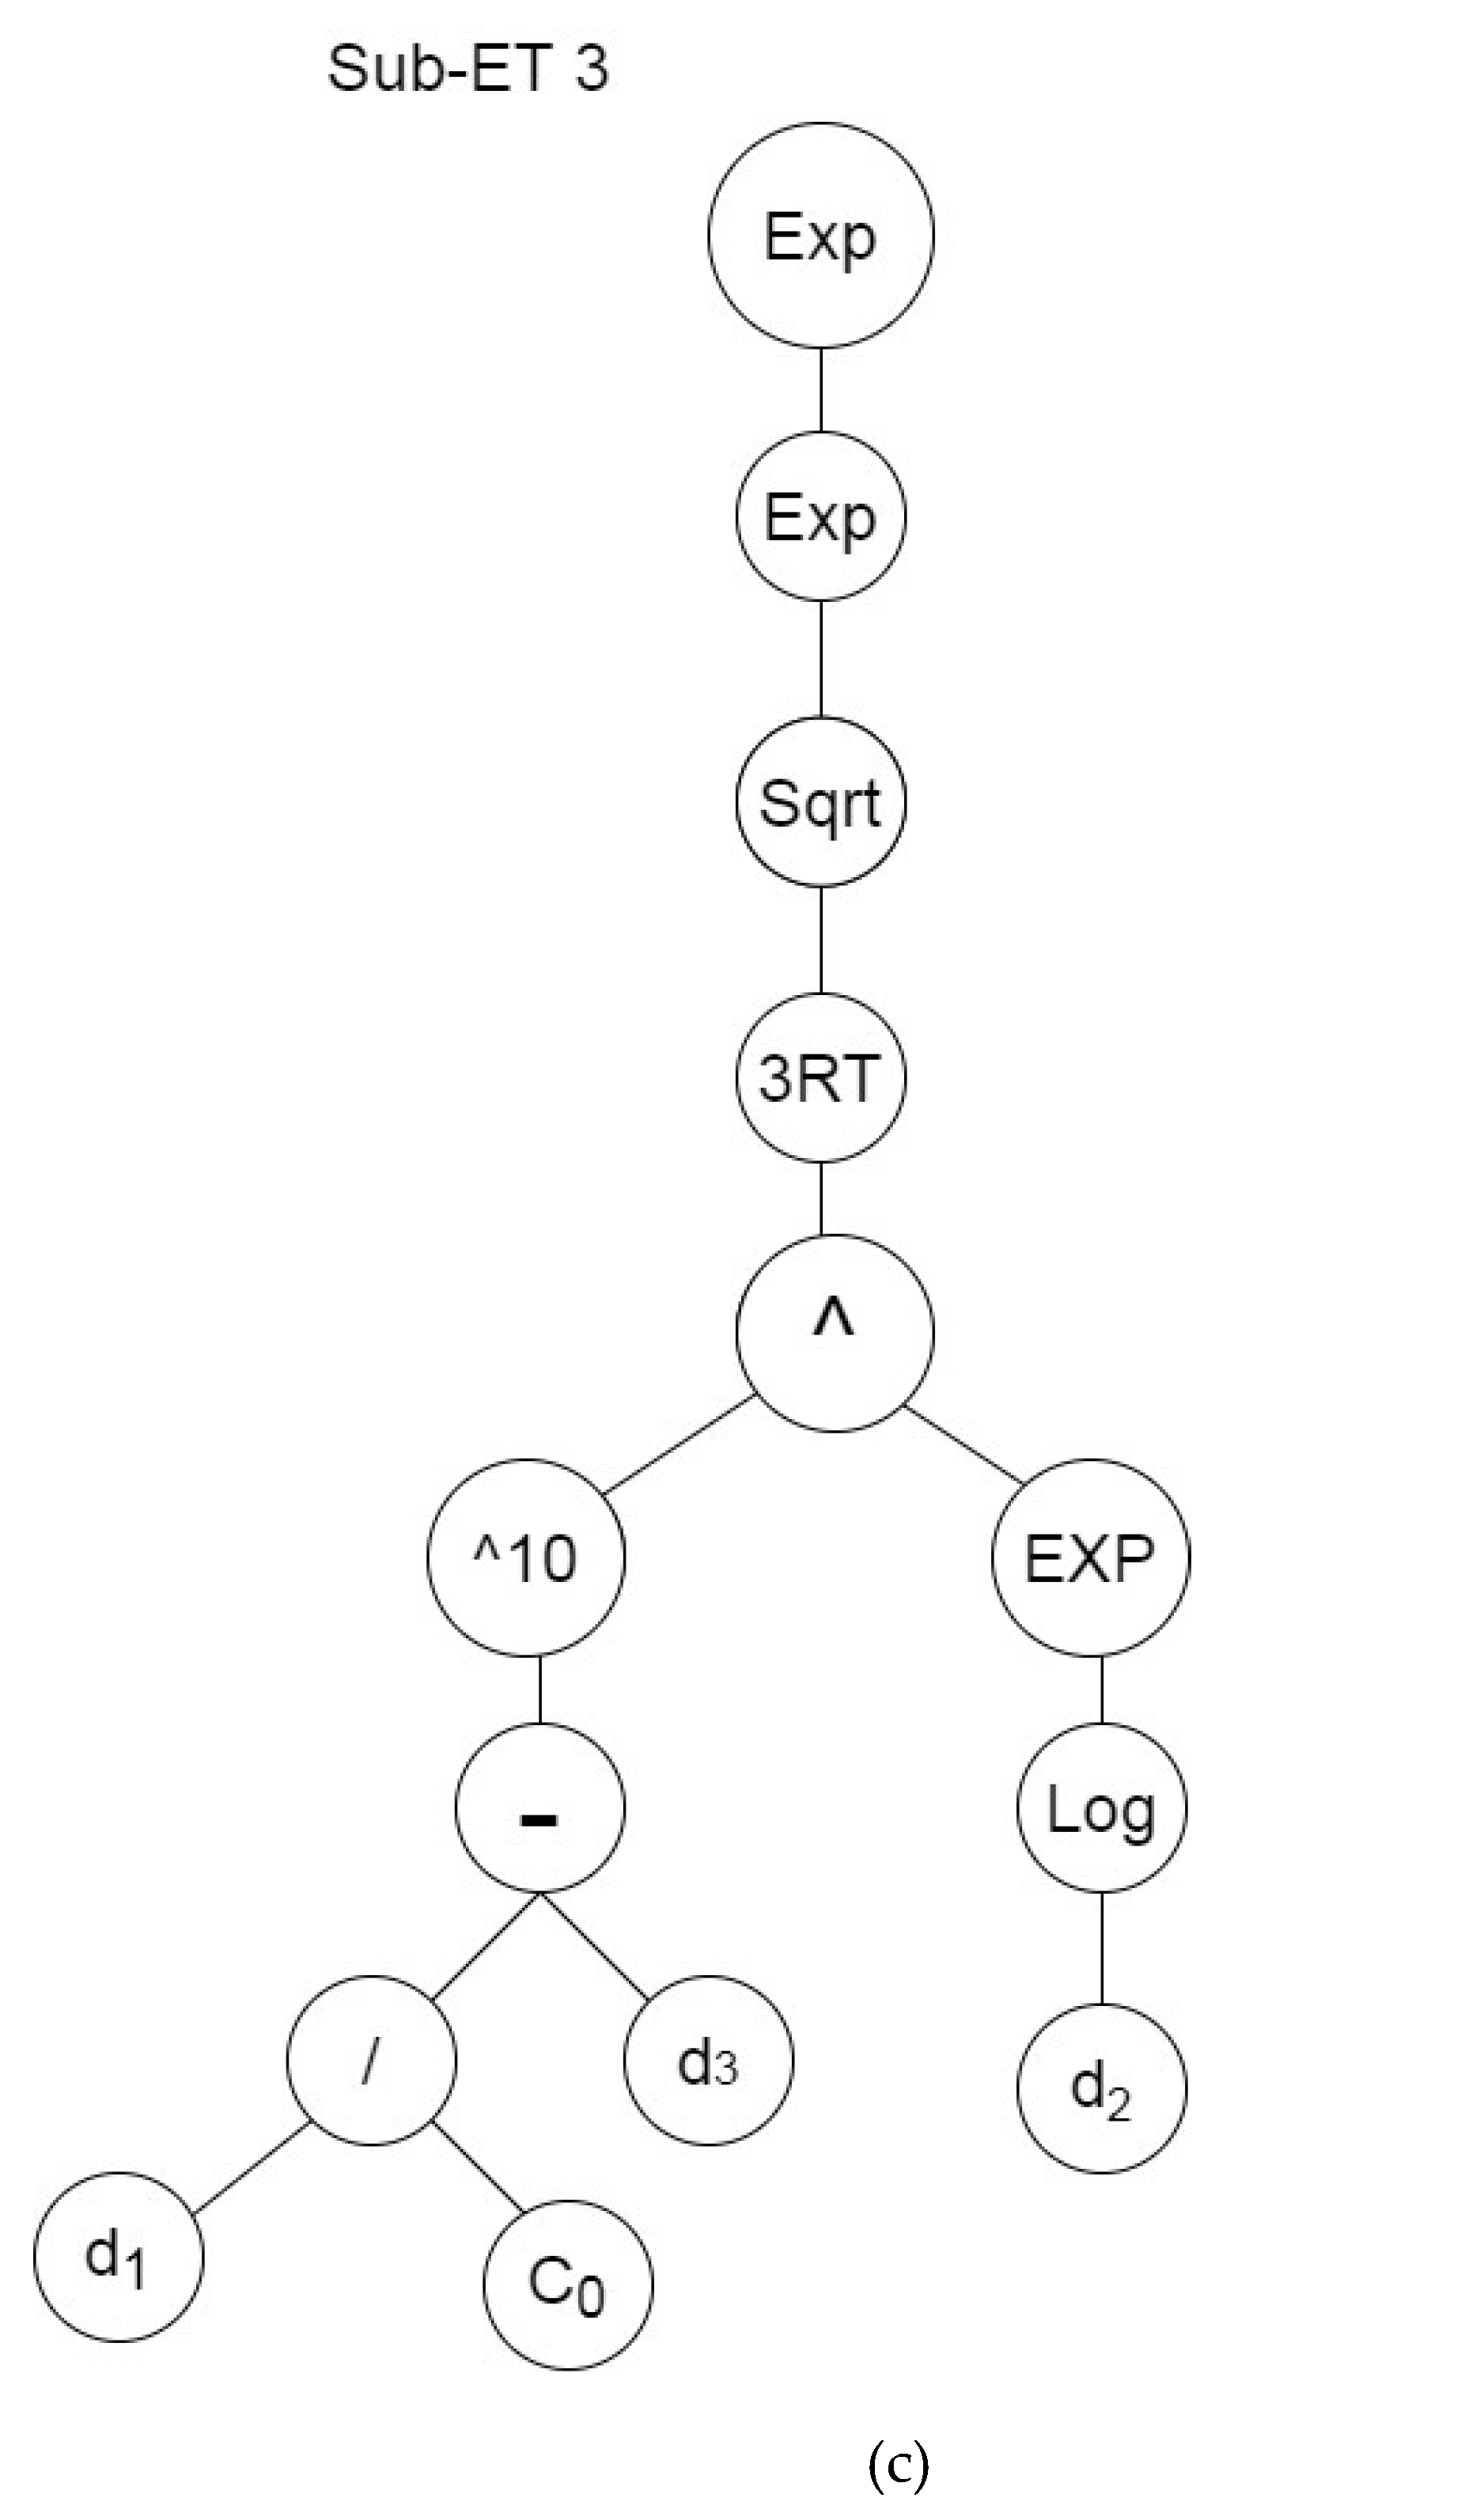
3.1. Gene Expression Programming

As proposed by Ferriera [40], Gene Expression Programming (GEP) is an extension of genetic programming (GP) and genetic algorithm (GA) models. In GEP, primary chromosomes are created from characters. Genes have a fixed length, and the used language is called the Karva language (K-language). GEP is able to translate the K-language to expression trees (ETs). ETs are a type of diagram that shows mathematical relations. They look similar to a tree. On the leaf of the tree (nodes), operators or variables are placed. Each node could have one or more sub-nodes. The reading order is from left to right and top to bottom as we read the text. Figure 6 shows the ET of expression a b c × d + e .
Then, the genotype or k-expression of Figure 6 can be derived as follows:
  • 0123456789
  • */Q-c+abde.
In this genotype, Q represents the square root function and “a, b, c, d, e” are arguments. The genotype comprises two parts: head (containing functions and terminals) and tail (only containing terminals). For example:
  • 012345678901234567890
  • *ba-Qbaa+babbabaabbab.
The italic part is the gene head, and the ET ends at position 8, while the gene ends at position 20. It is obvious that the maximum size of the ET is equal to the size of the gene, but it can be smaller. By linking functions, several genes can assemble and build a chromosome. In other regression models, certain functions are defined beforehand, while there is no predefined function in GEP. It is also believed that GEP is more applicable to solve multivariable problems compared to other techniques [40]. Each ET created by GEP is mathematically meaningful, whereas in the GP, a new offspring is not necessarily correct. This important point makes GEP more efficient than the GP. To create new individuals, the regular operations of GA and GP are also applicable to GEP. Mutation, crossover, recombine, transpose, and replication are these operations. Figure 7 depicts the flow-chart of GEP [40]. To obtain highly accurate results, effective parameters should be defined. To solve a problem, a chromosome with one gene is utilized. By adding to the head length and making multi-gene functions, it is possible to have a solution with a high accuracy; the operations between genes in a solution are defined by the linking functions. Linking functions are addition, subtraction, multiplication, and division.
In this research, the terminals are independent variables as:
W/C, NMgO, CP, SP
where W/C is the water-to-binder ratio (water-to-cementitious material ratio), NMgO is the percentage of nano-MgO, CP is the curing period, and SP is the percentage of the superplasticizer. Four basic algebraic operators (+, −, ×, /) and other operators (Sqrt, Ln, ^2…) are applied in the models. The third step is to specify the properties of the chromosomes such as the head length and the gene number. In this research, three genes and a head length of 6 were assumed. The fourth step is to define the linking functions; here, “addition” and “multiplication” are selected as linking functions for connecting sub-ETs with each other. The fifth step is choosing genetic operations such as mutation, transposition, and crossover.

3.2. Required Data for Modeling

In this research, the required data for GEP (in the training and testing) are associated with the compressive strength of 98 cubic samples (10 cm), while 78 cylindrical (10 × 20) samples are used for the tensile strength and permeability models obtained by the experimental tests. The concrete samples are fabricated by different percentages of nano-MgO under 300 freeze–thaw cycles. Table 6 illustrates the model variables as input data and concrete properties as output data and their range of values.
The input variables of the model are water-to-binder ratio, nano-MgO percentage, curing period, and percentage of superplasticizer. Randomly, 80% of the dataset is used for training and 20% is used for testing. Fitness function is necessary for assessing the accuracy in every program, and in this research, the root mean square error (RMSE) is assumed as the fitness function. According to Equation (3), the RMSE can be calculated:
R M S E = 1 n i = 1 n ( p i e i ) 2
where p is the prediction value, e stands for experimental values, and n is the number of specimens.
Several models with different amounts of head size, number of chromosomes, and number of genes were examined. Higher amounts of head size and a higher population of chromosomes lead to the higher complexity of the model, which prolongs the time it takes for the programs to run; also, high complexity does not lead to a highly accurate model necessarily. The proper amounts of head size, number of chromosomes, and other parameters are obtained by the trial-and-error method. As a result, eight models are chosen due to the best R2 values. Table 7 presents the properties of these models. The program was run until there was no longer a significant improvement in the performance of the model.

4. Results and Discussion

The experimental and modeling results are summarized and presented in this section.

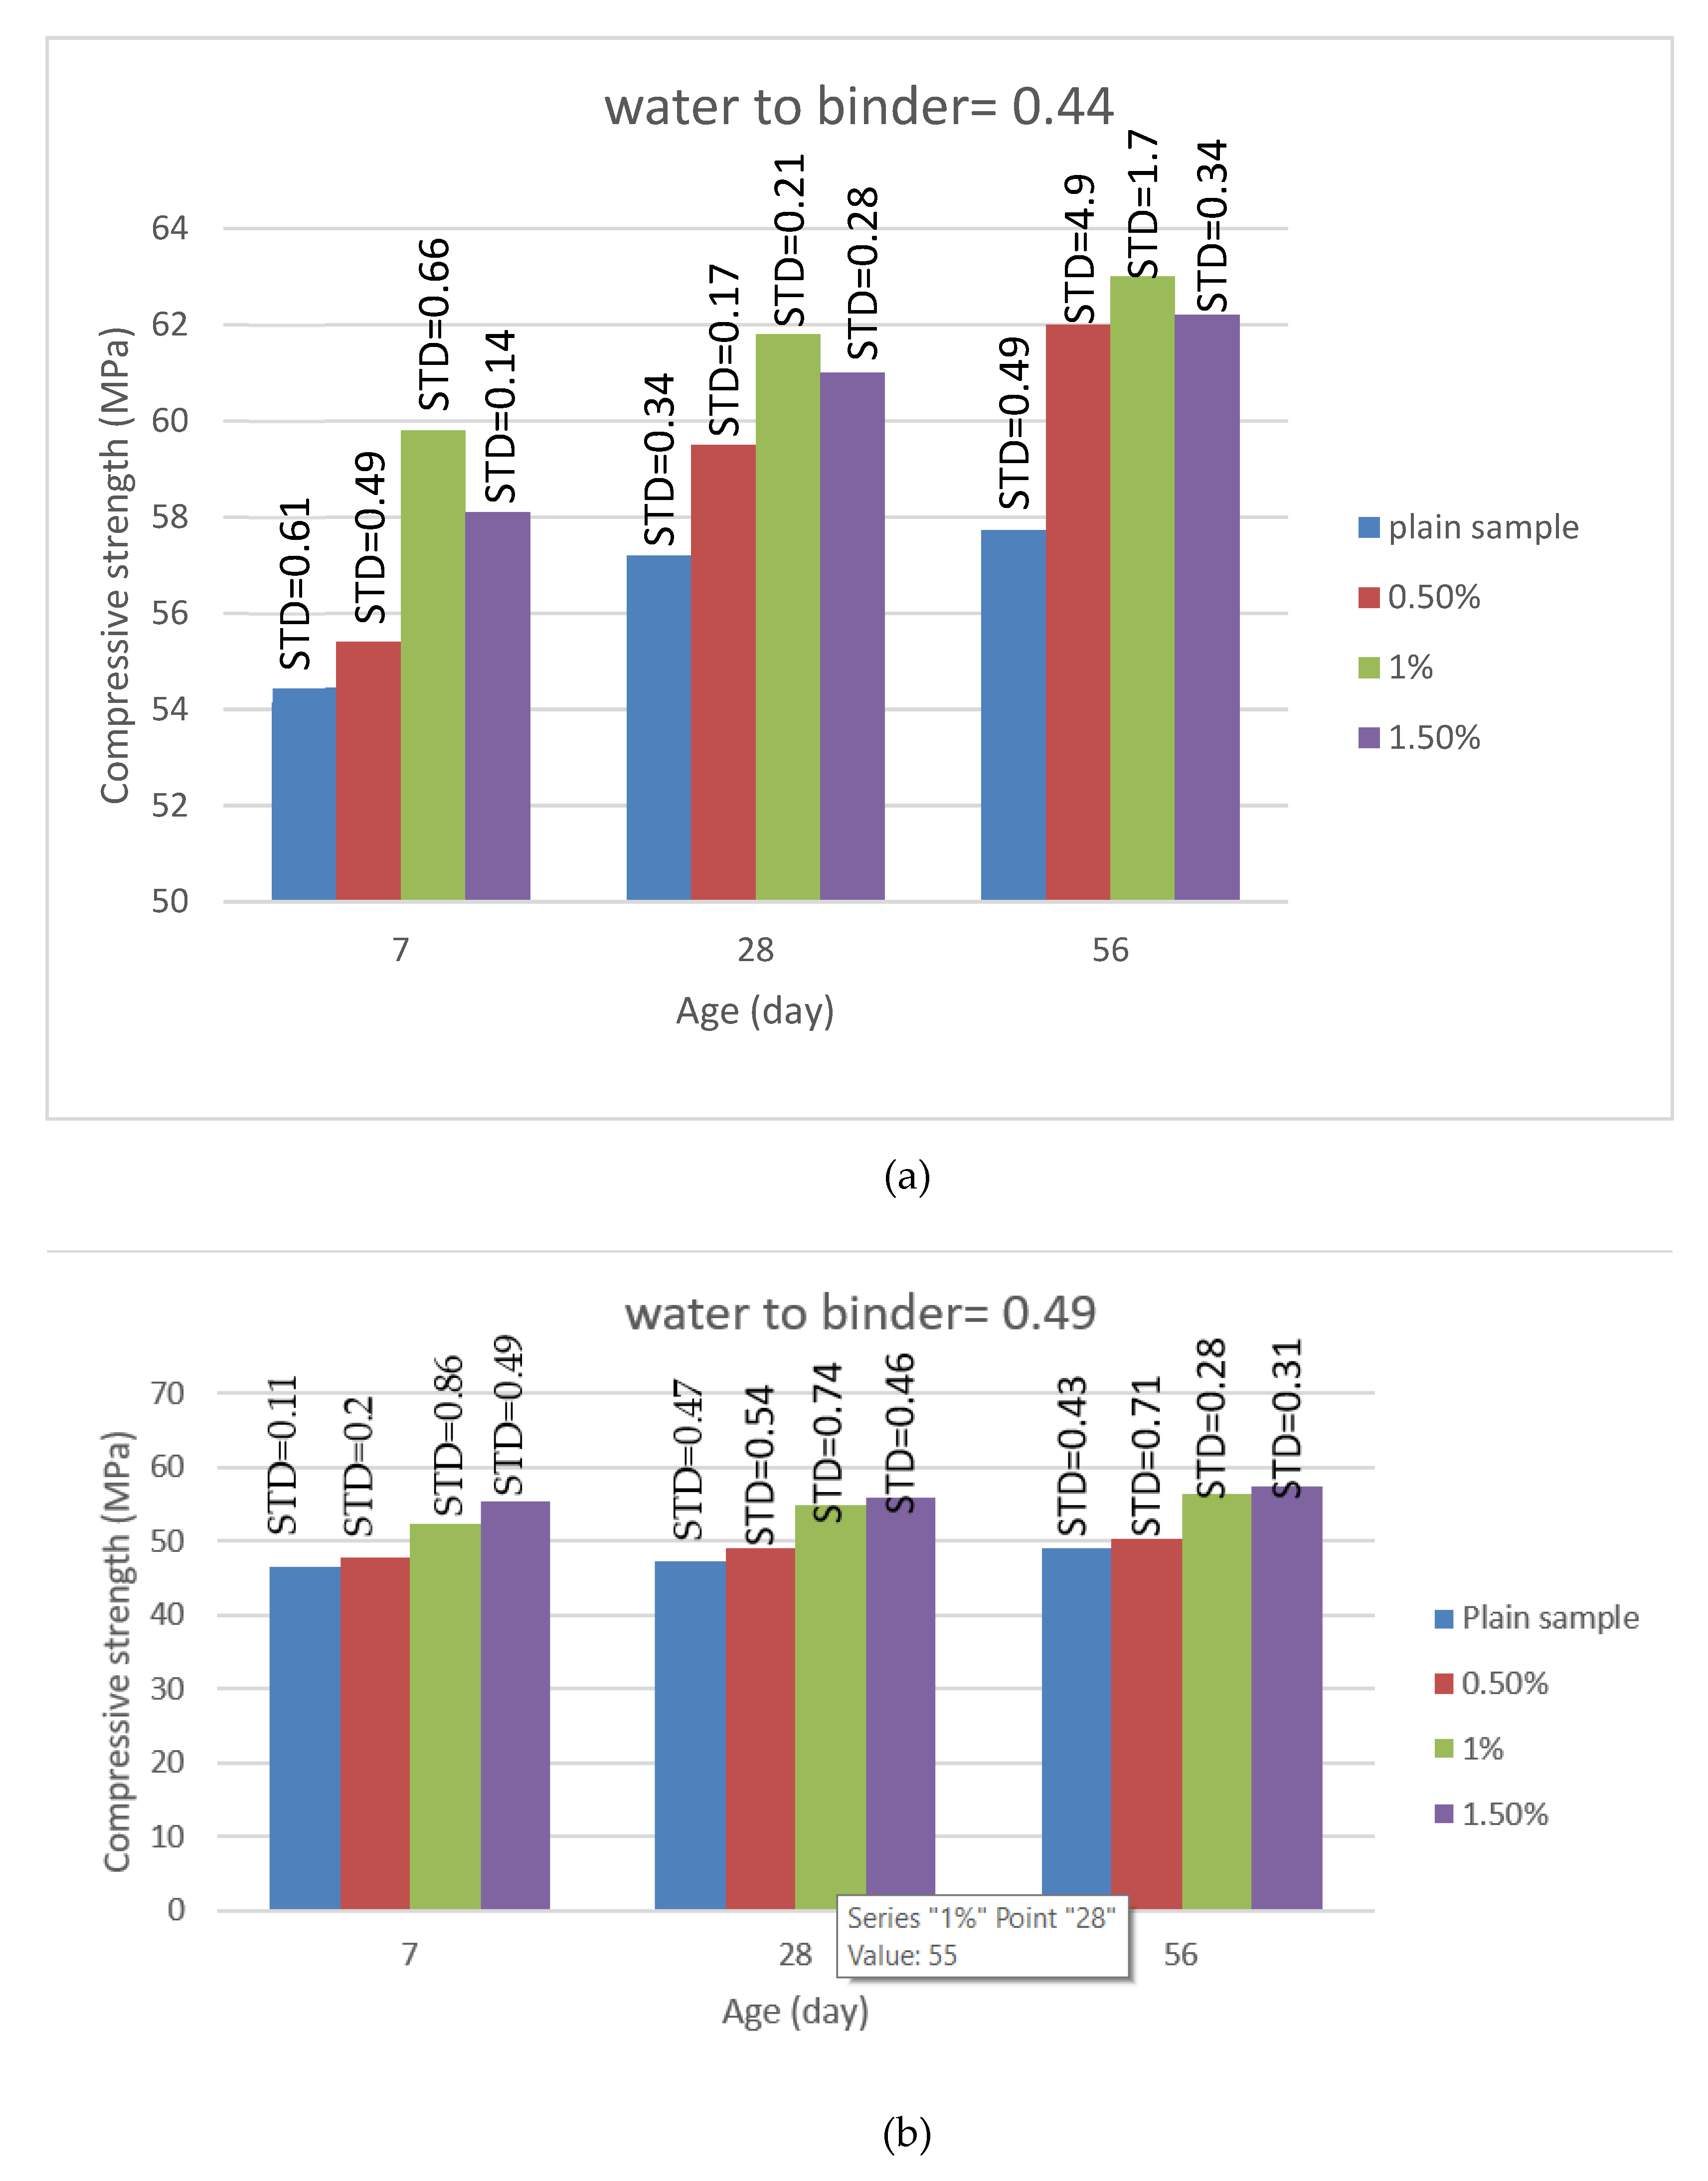
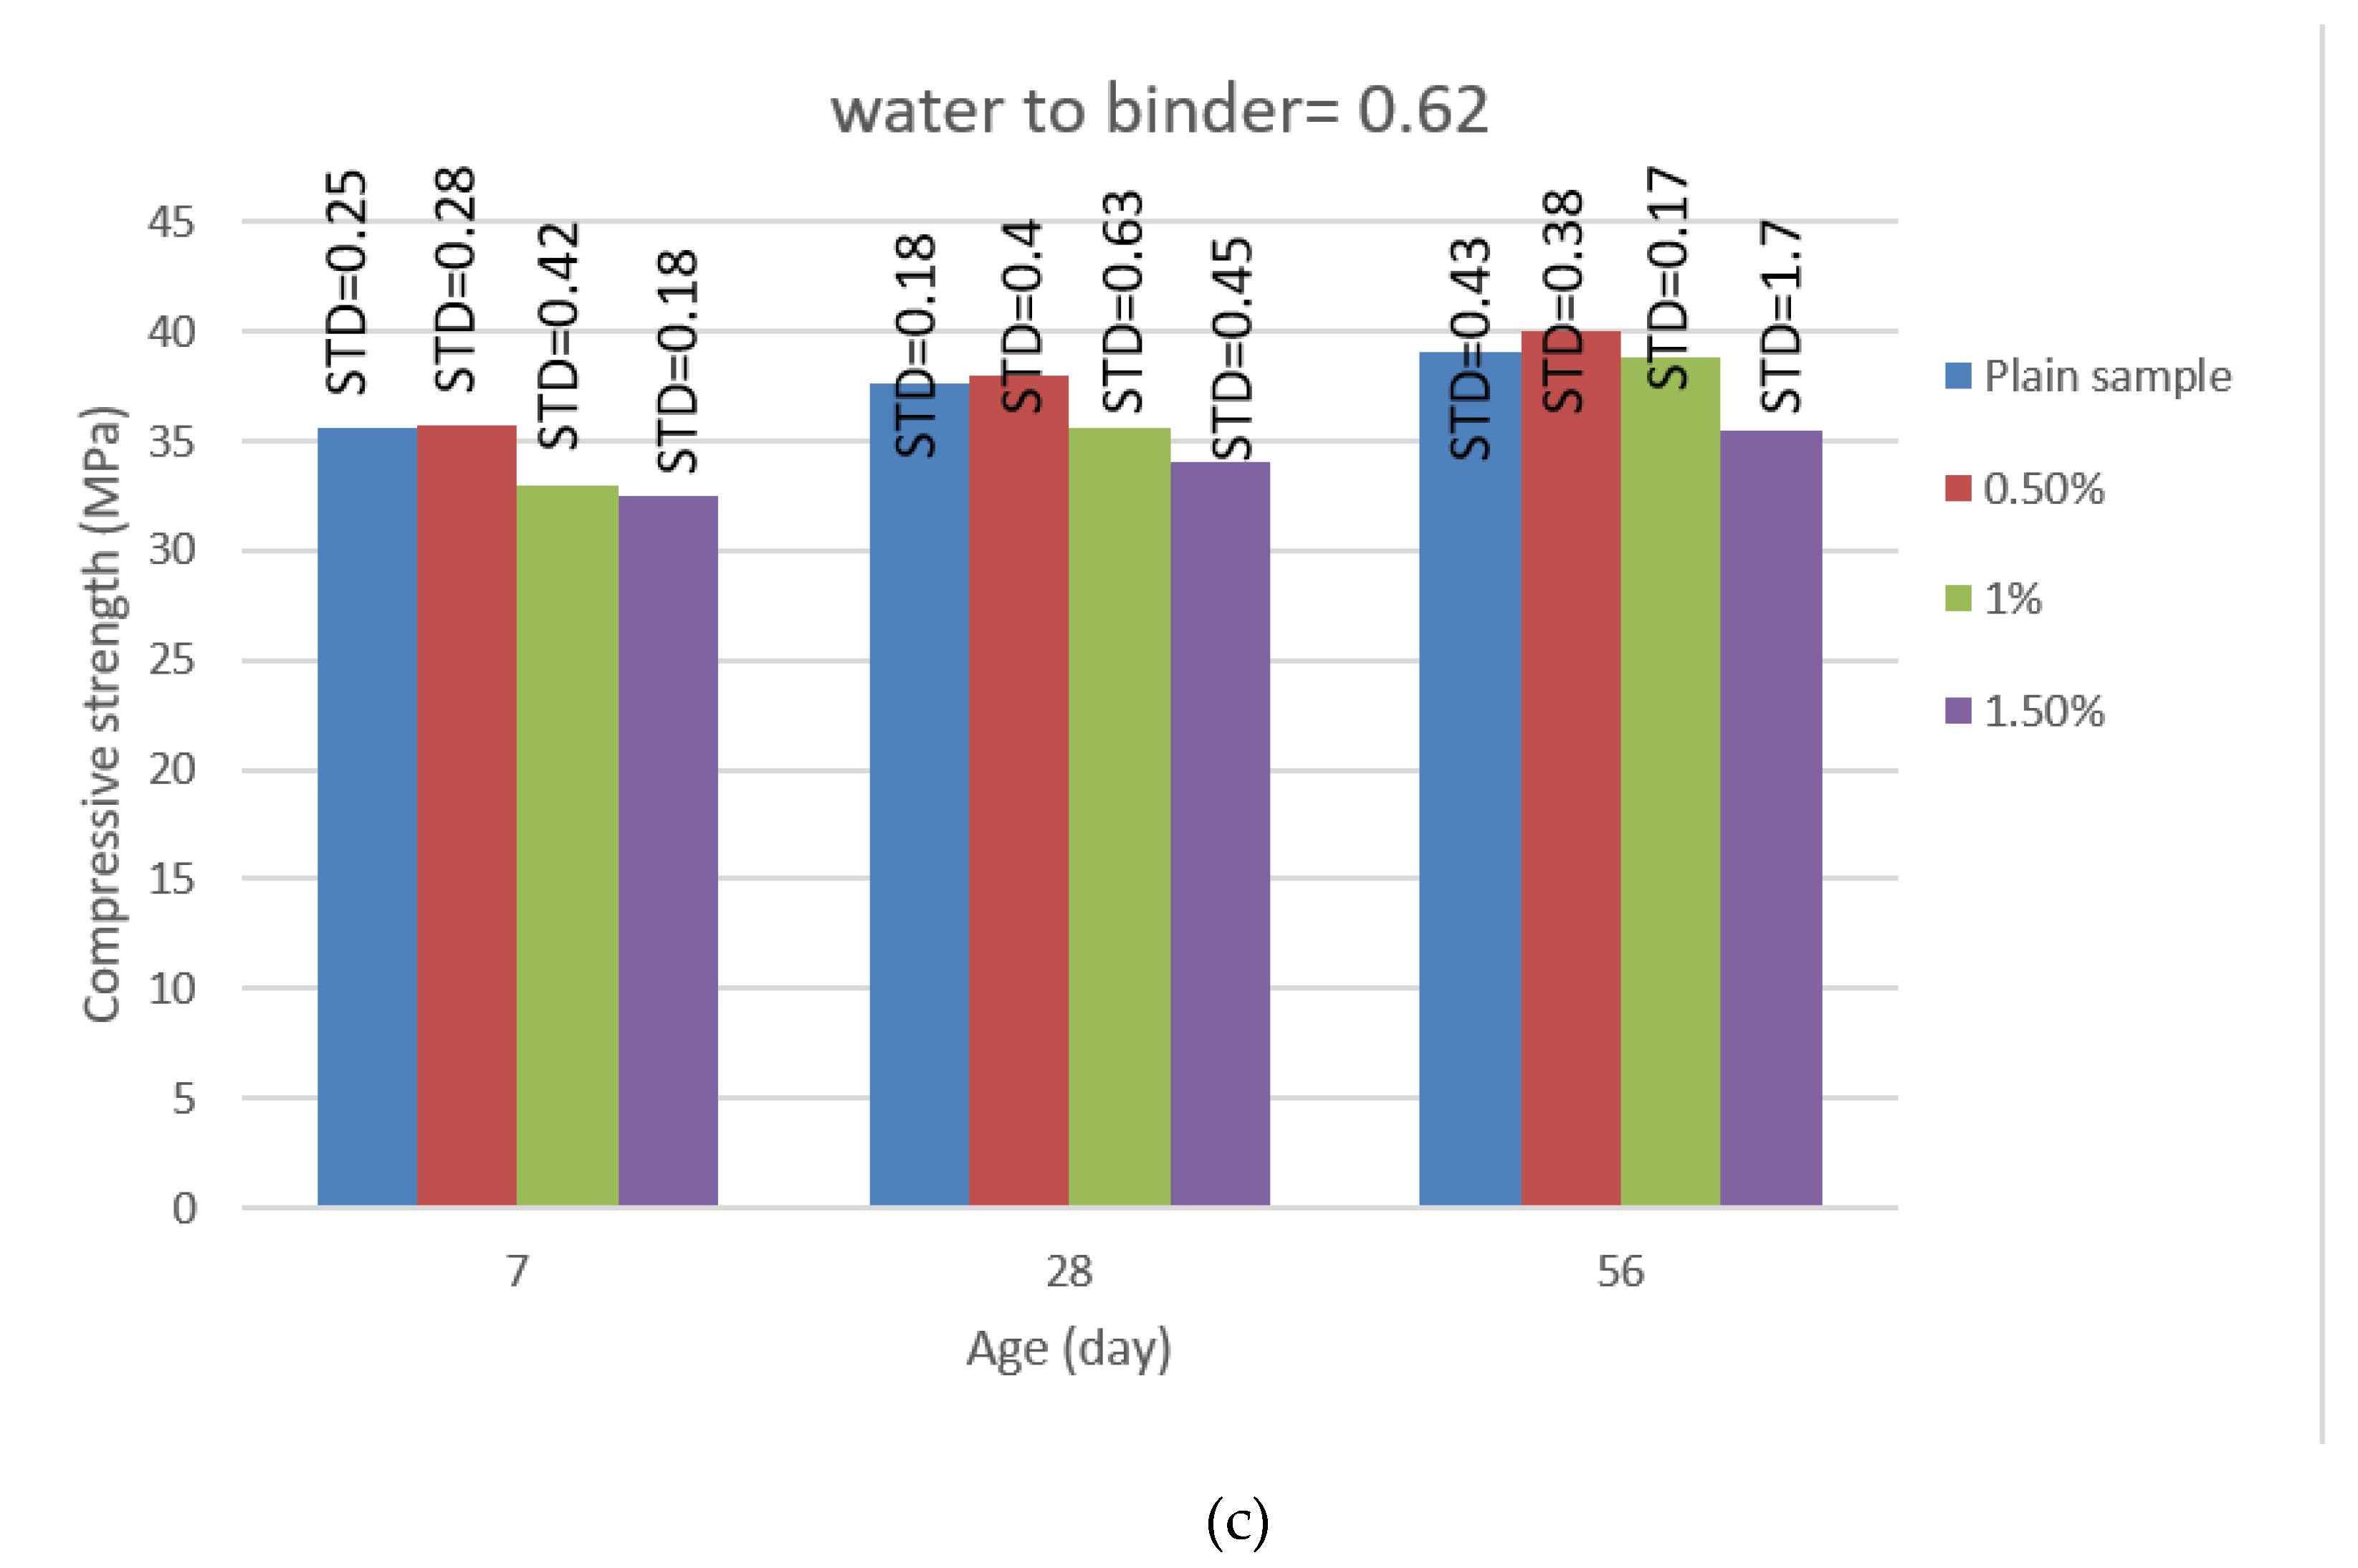
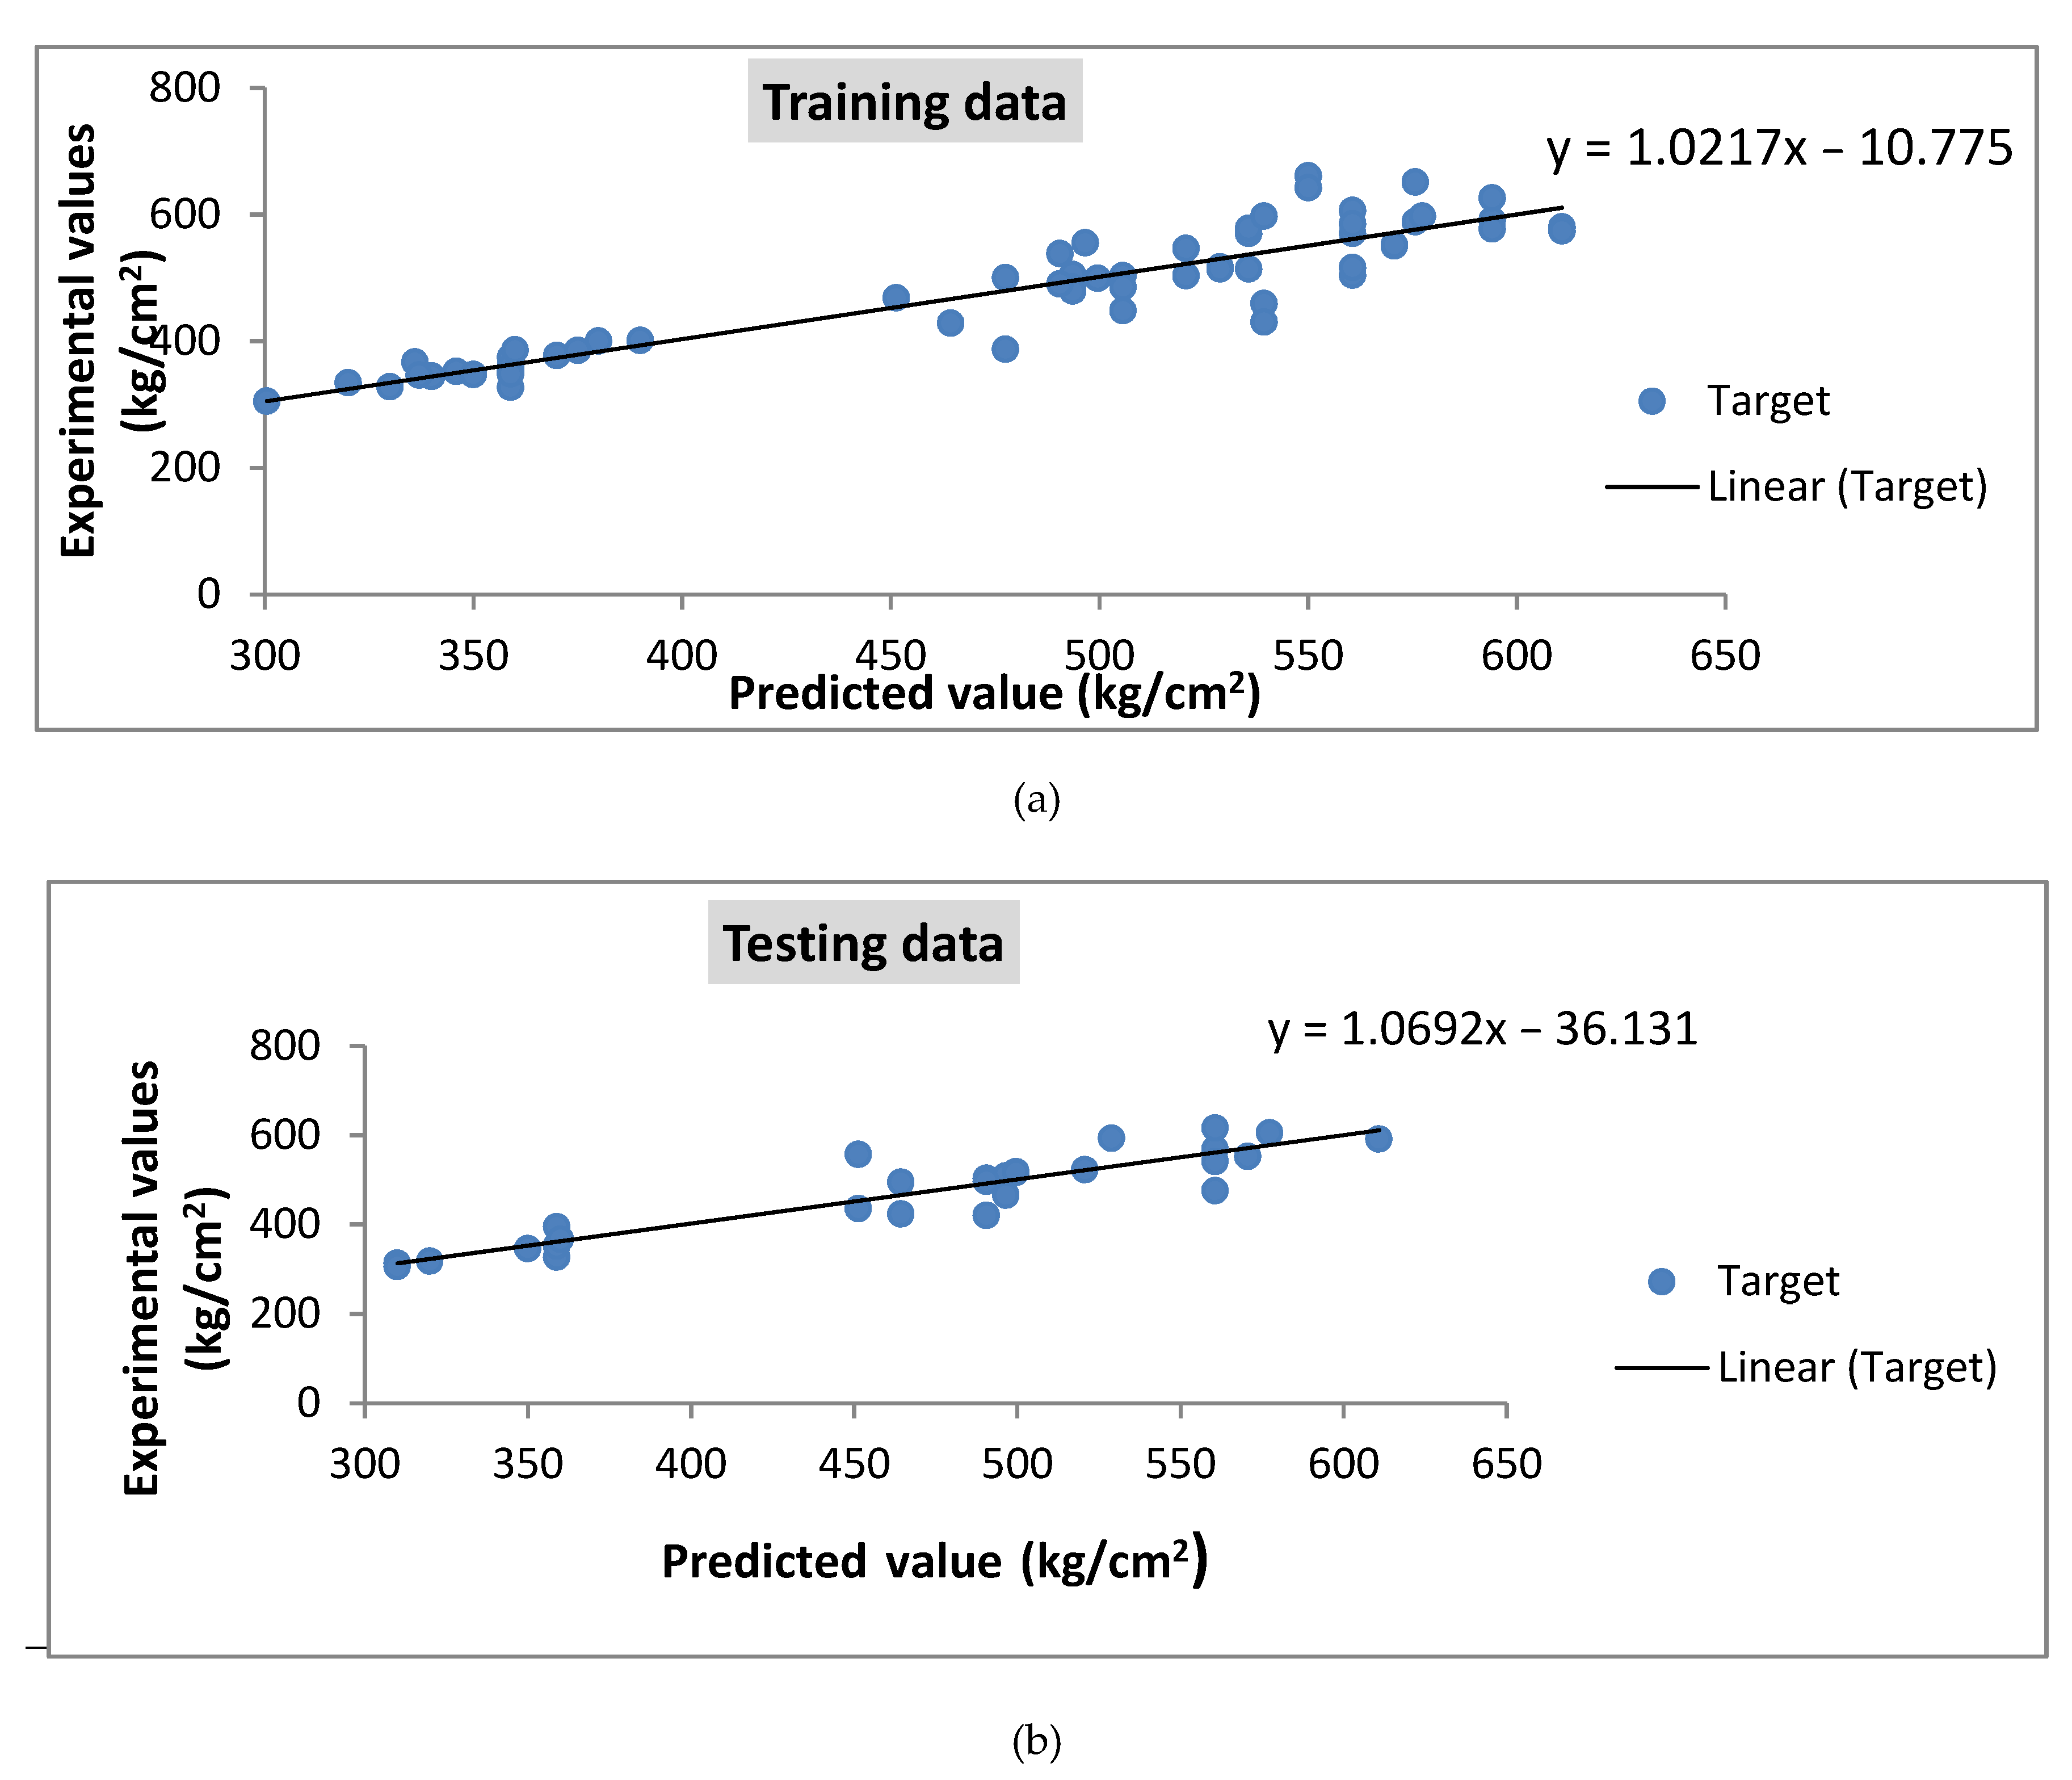
4.1. Compressive Strength

In this research, 98 cubic (100 mm) concrete samples are made, and the compressive strength of the specimens is measured. Since several samples were constructed with the same percentage of materials, the mean compressive strength of the specimens is used in Figure 8, which includes three diagrams for three water-to-binder ratios: (a) 0.44, (b) 0.49, and (c) 0.62.
For specimens with a water-to-binder ratio of 0.44 and a curing period of 56 days, the mean value of the compressive strength reaches 6.20 MPa for samples with 0.5% nano-MgO, showing a 7.4% increase in comparison to the control samples. With the same percentage of materials, the mean compressive strength reaches 6.30 MPa for samples with 1% nano-MgO, which is 9.12% more than the control samples. As observed in Figure 8a,b, in all cases, there is a positive effect of nano-MgO on compressive strength. By increasing the water-to-binder ratio, the effect of nano-MgO becomes clearer. The role of nano-MgO on the compressive strength of the samples is different depending on the water-to-binder ratio. For instance, when the water-to-binder ratio is 0.44, the maximum compressive strength is belonging to samples with 1% nano-MgO. It is noteworthy that the same amount of nano-MgO in samples with a higher water-to-binder ratio leads to a smaller compressive strength. It seems that there are two reasons for this behavior. The first one is that nano-MgO has an expansive feature which means the production of hydration needs more space; therefore, excessive pressure is created in the texture of concrete by the completion of the hydration process. The other reason is related to the high specific surface of nano-MgO. Regarding this matter, during the dispersion process, nano-MgO can be swelled, which increases the viscosity of suspension, and as a result, when the amount of nanomaterial is growing, the uniform dispersion of nano-MgO becomes difficult. By non-uniform dispersion of nano-MgO, the agglomeration will be inevitable, and compressive strength can be decreased. Figure 8 shows the standard deviation (STD) for compressive strength data, as well. In statistics, the standard deviation is a factor that means how the dataset is dispersed and shows that every piece of data tends to be close to the mean value.

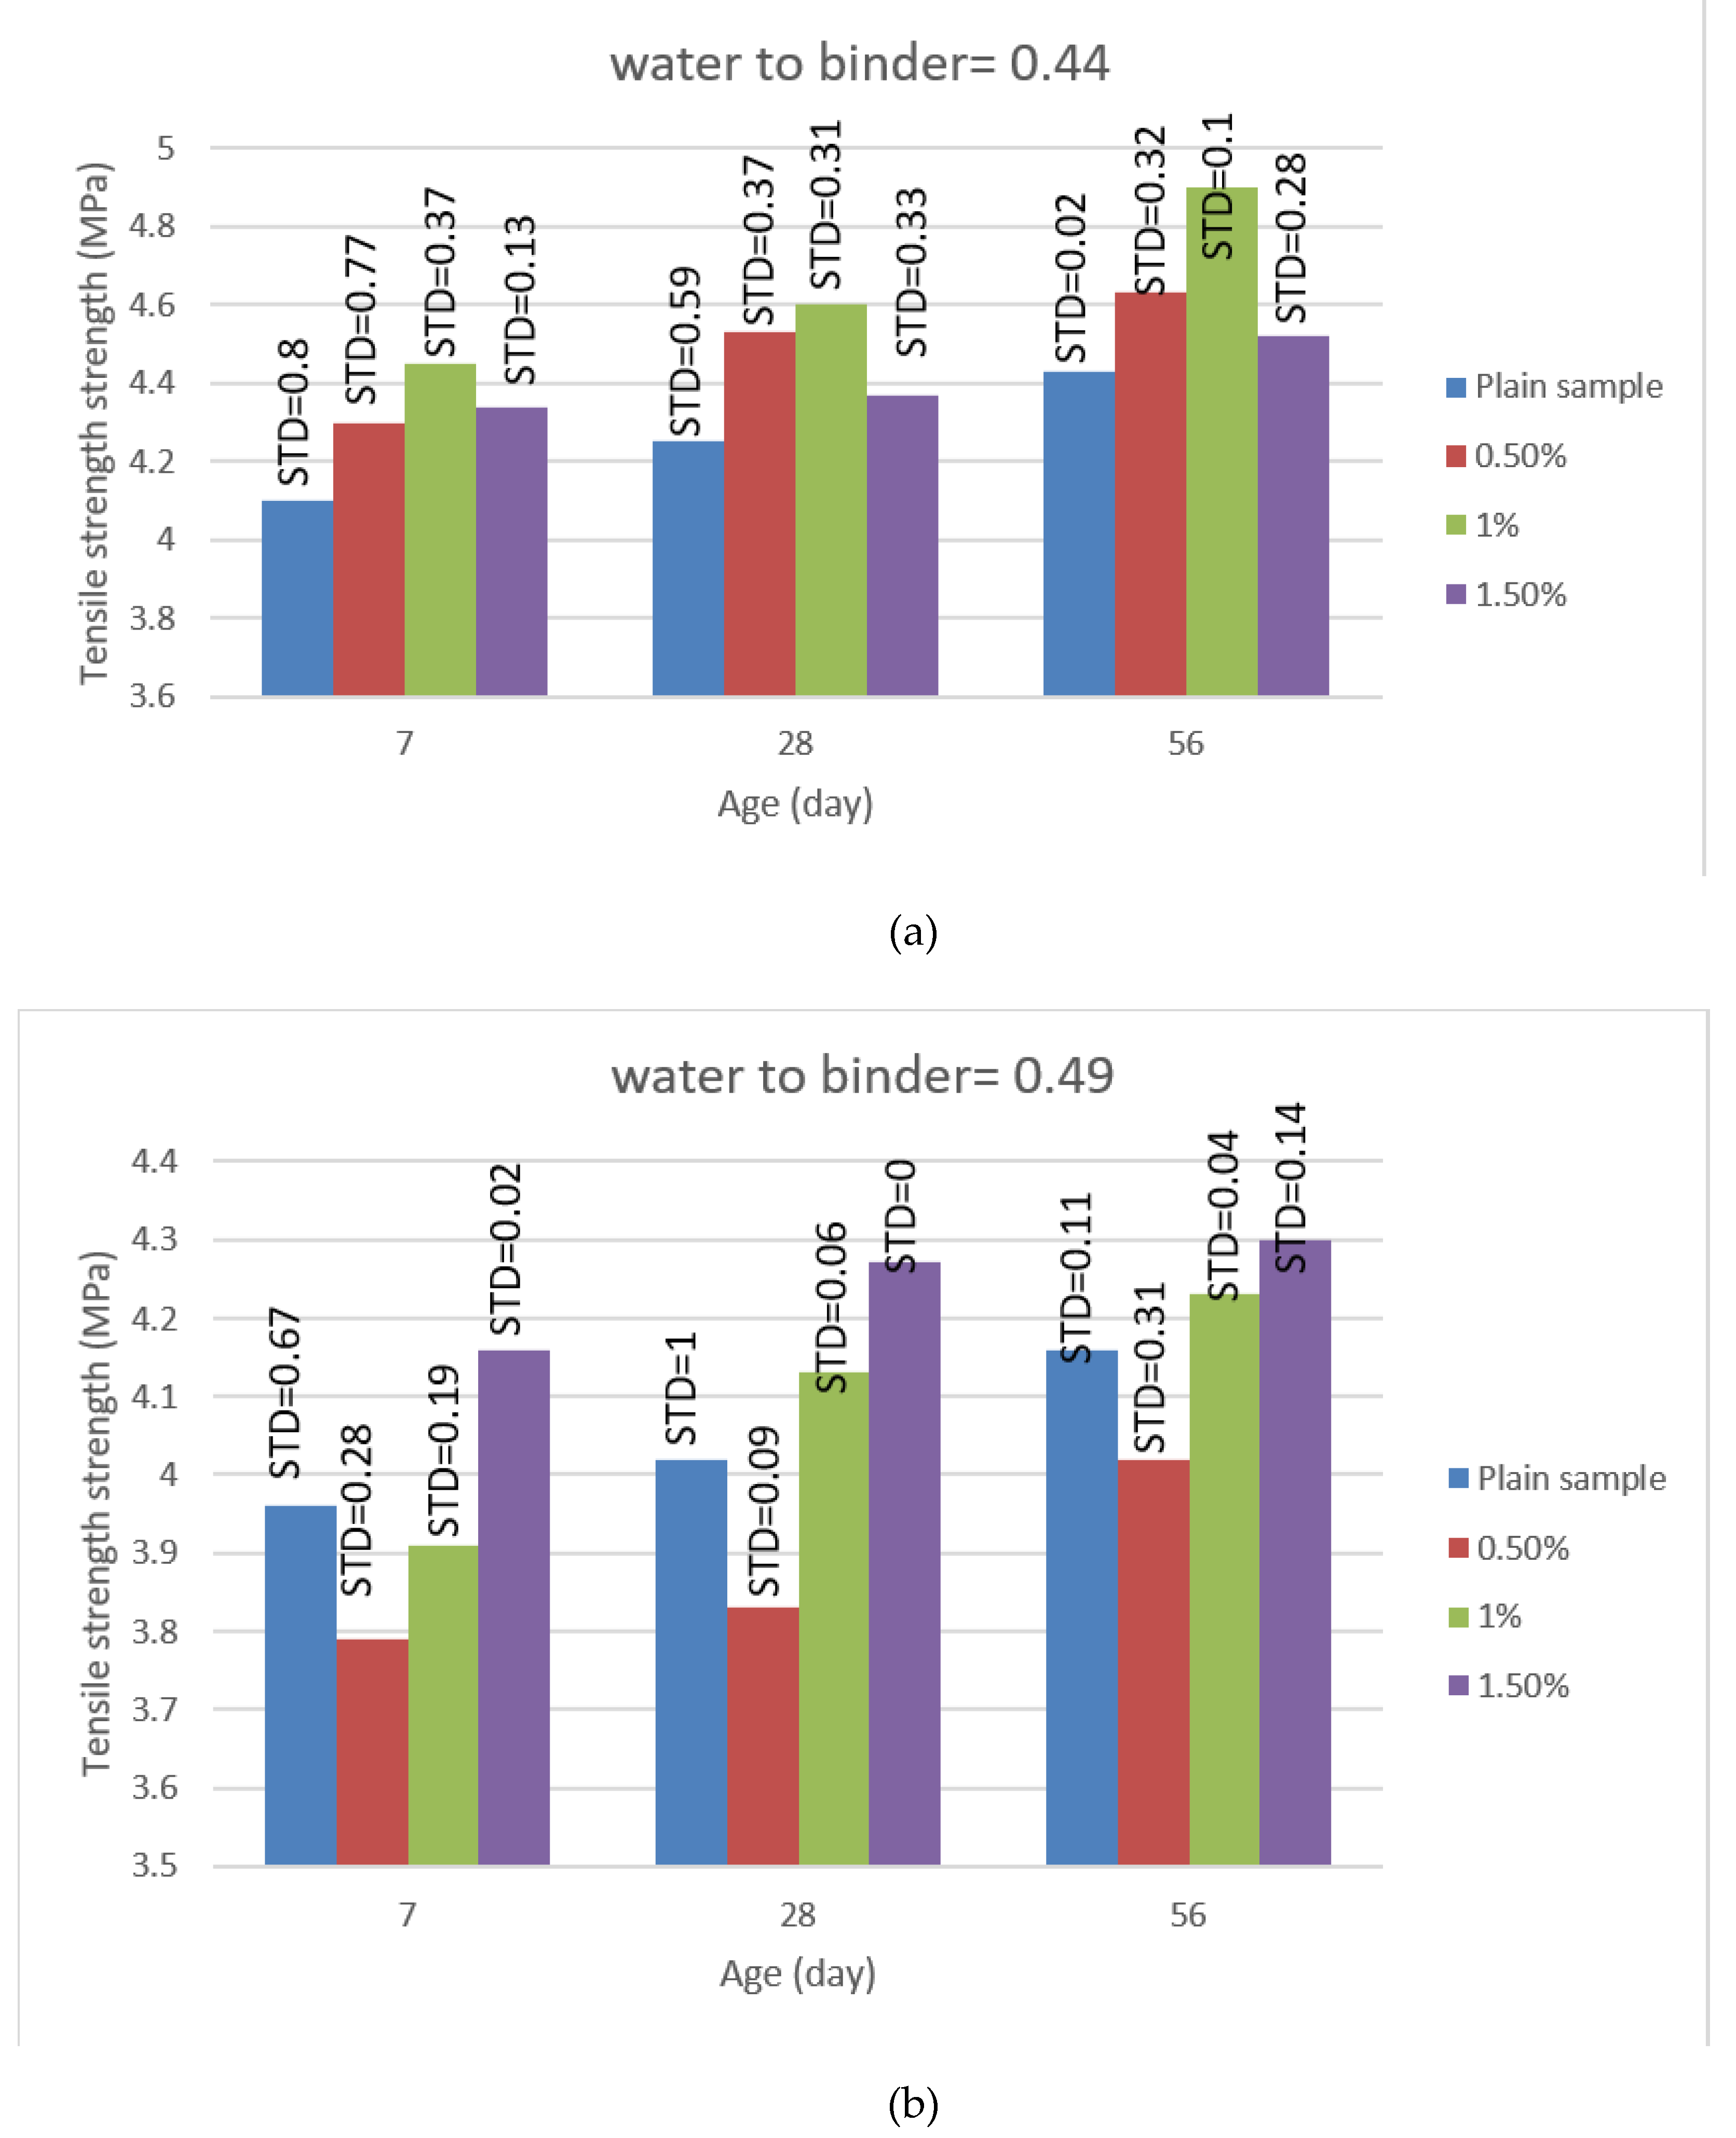
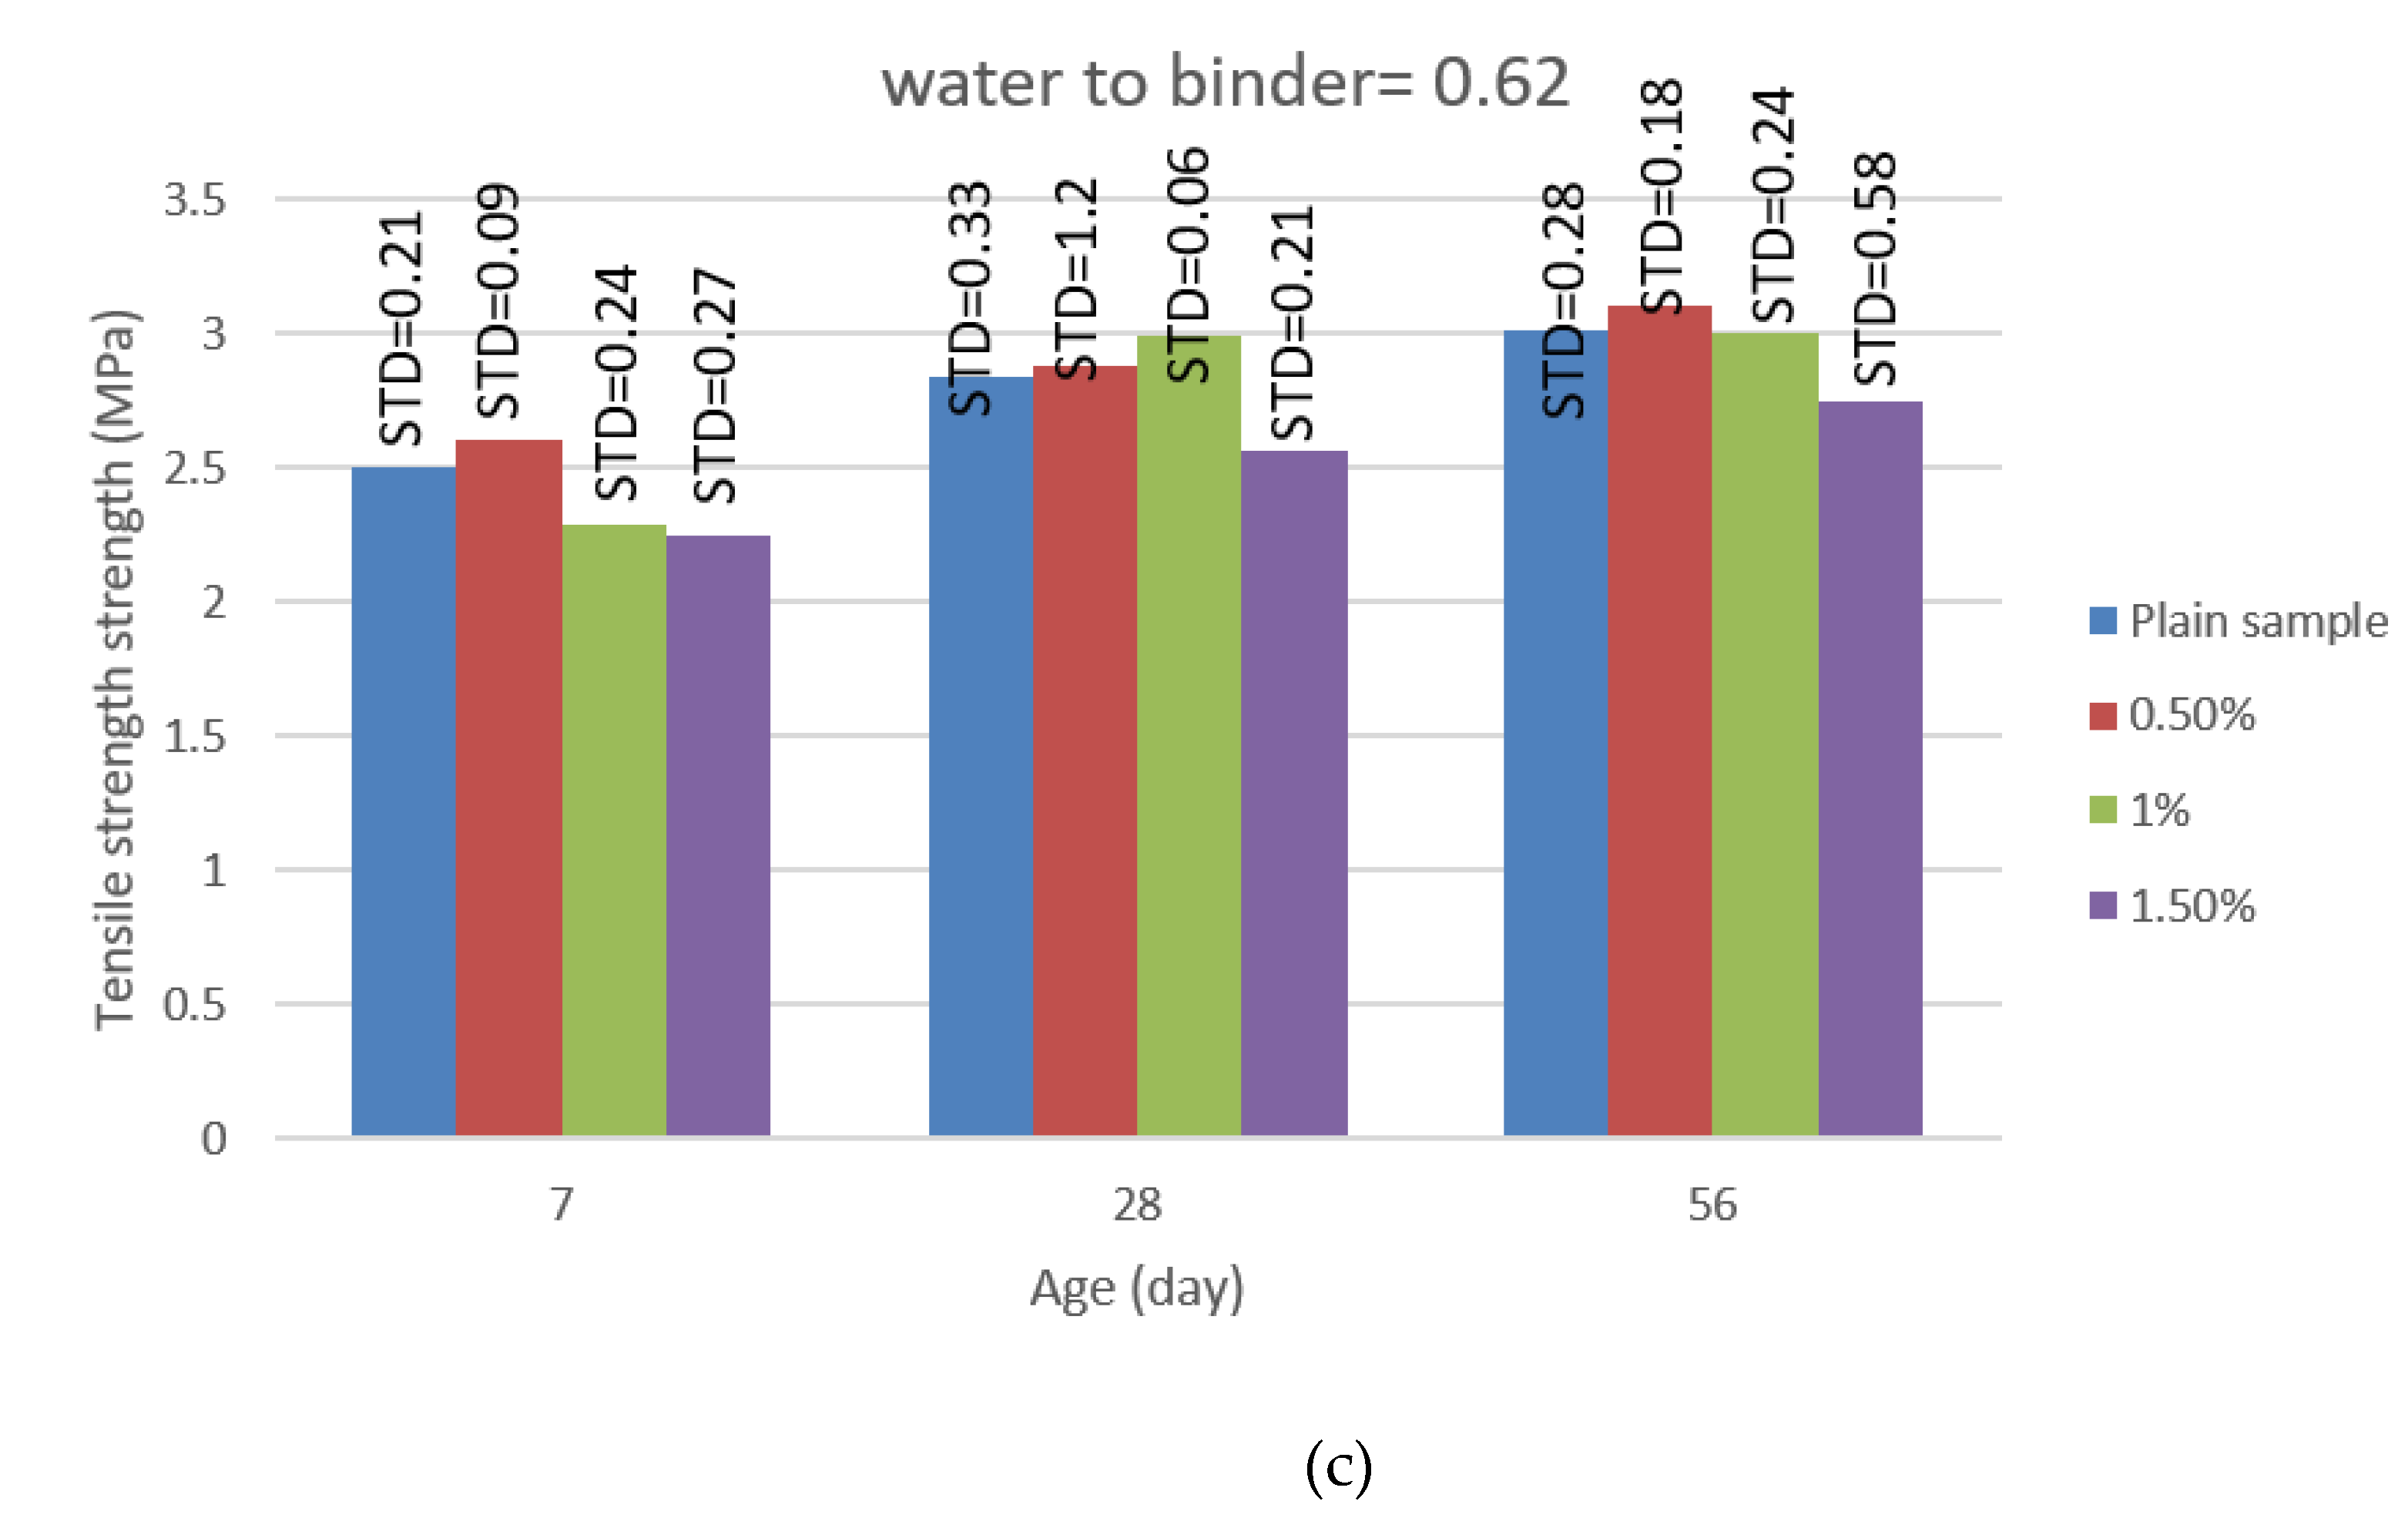
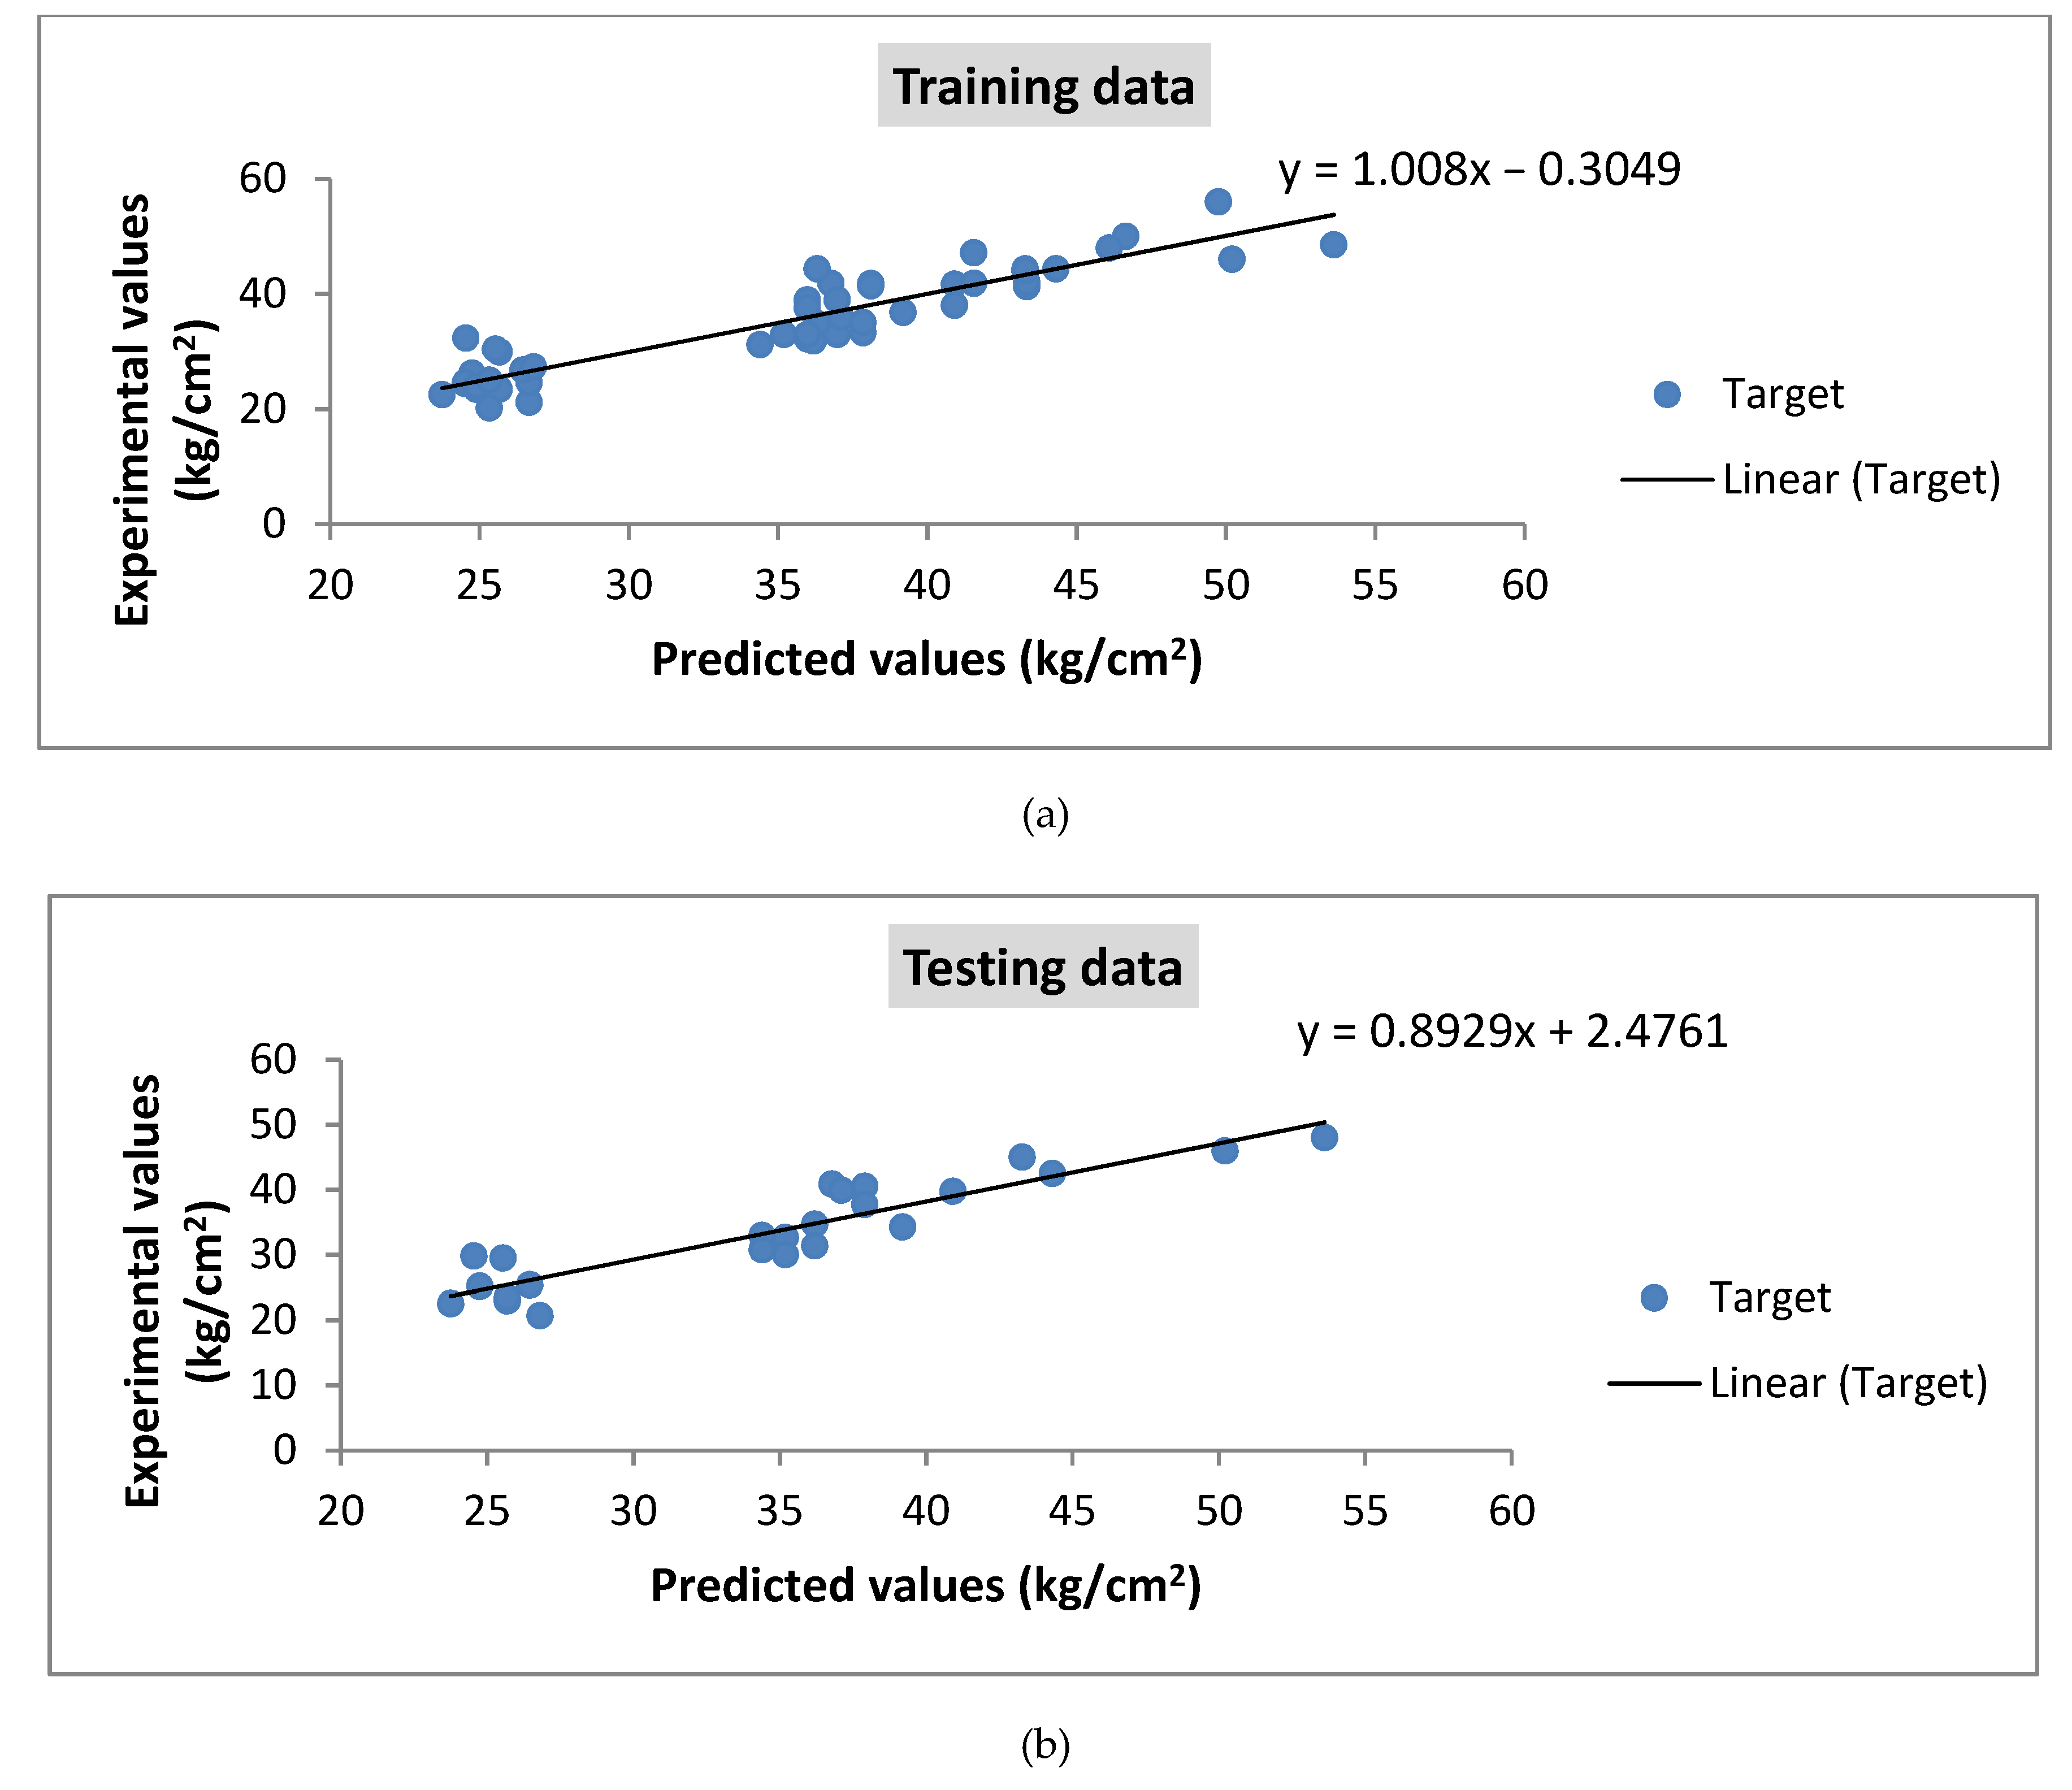
4.2. Tensile Strength

The results of the splitting test are shown in Figure 9a–c for water-to-binder ratios of 0.44, 0.49, and 0.62, respectively. The improvement trend of tensile strength is the same as the compressive strength. The highest tensile strength (4.9 MPa) is about 10.6% more than the control samples belonging to the samples with water-to-binder ratio of 0.44 and replacement of 1% nano-MgO after 56 days of curing. Maximum improvement in the tensile strength for a water-to-binder ratio of 0.49 is obtained by replacing 1.5% nano-MgO after 56 days of curing; the tensile strength is 4.3 MPa, which is 3.3% more than the control samples. As discussed in the previous section, the expanding effect of nano-MgO causes excessive inner pressure after the completion of hydration, which leads to the creation of micro-cracks in higher percentages of nano-MgO usage. The other result of Figure 9 is that the optimum amount of nano-MgO differs by variation of the water-to-binder ratio. For example, the optimum amount of nano-MgO for a water-to-binder ratio of 0.44 and 0.49 is 1% and 1.5%, respectively. While for a water-to-binder ratio of 0.62, the optimum amount is 0.5%, and the reason can be because of the high viscosity of the fresh concrete mixture due to high special surface of nano-MgO. The viscosity becomes extensively high at higher water-to-binder ratios, which can be the reason for the non-uniform dispersion of nano-MgO, which decreases the compressive and tensile strength.

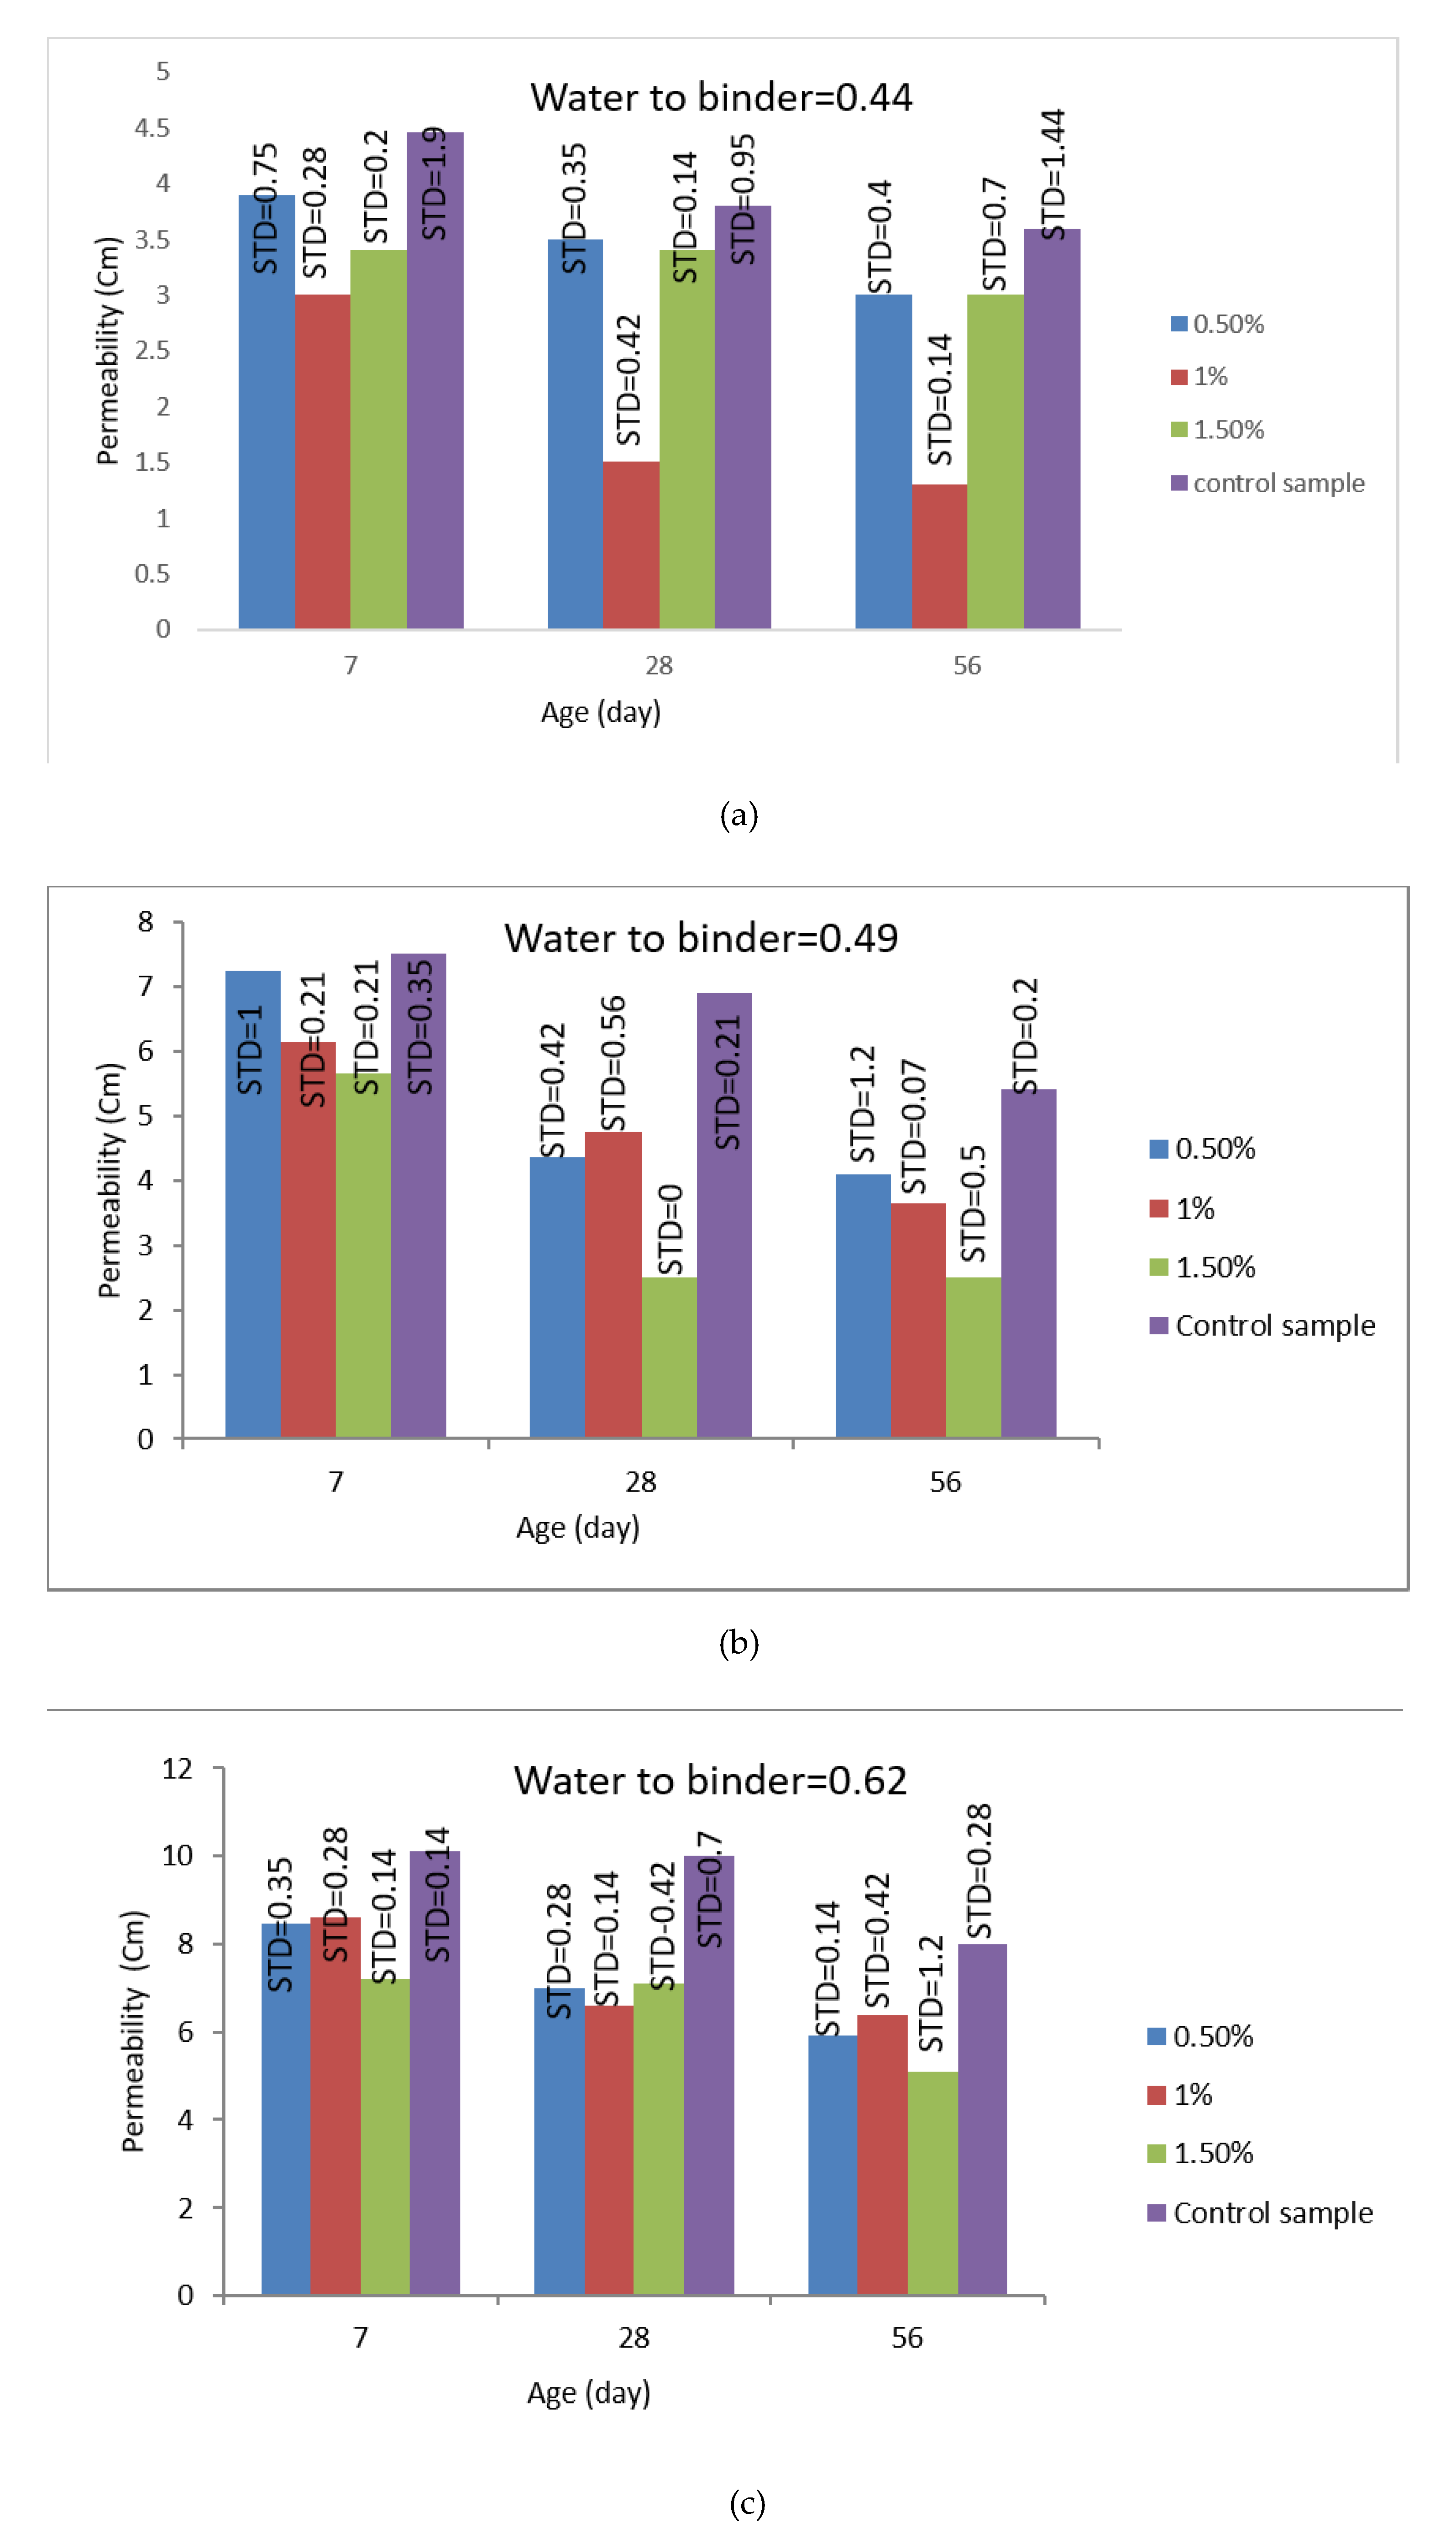
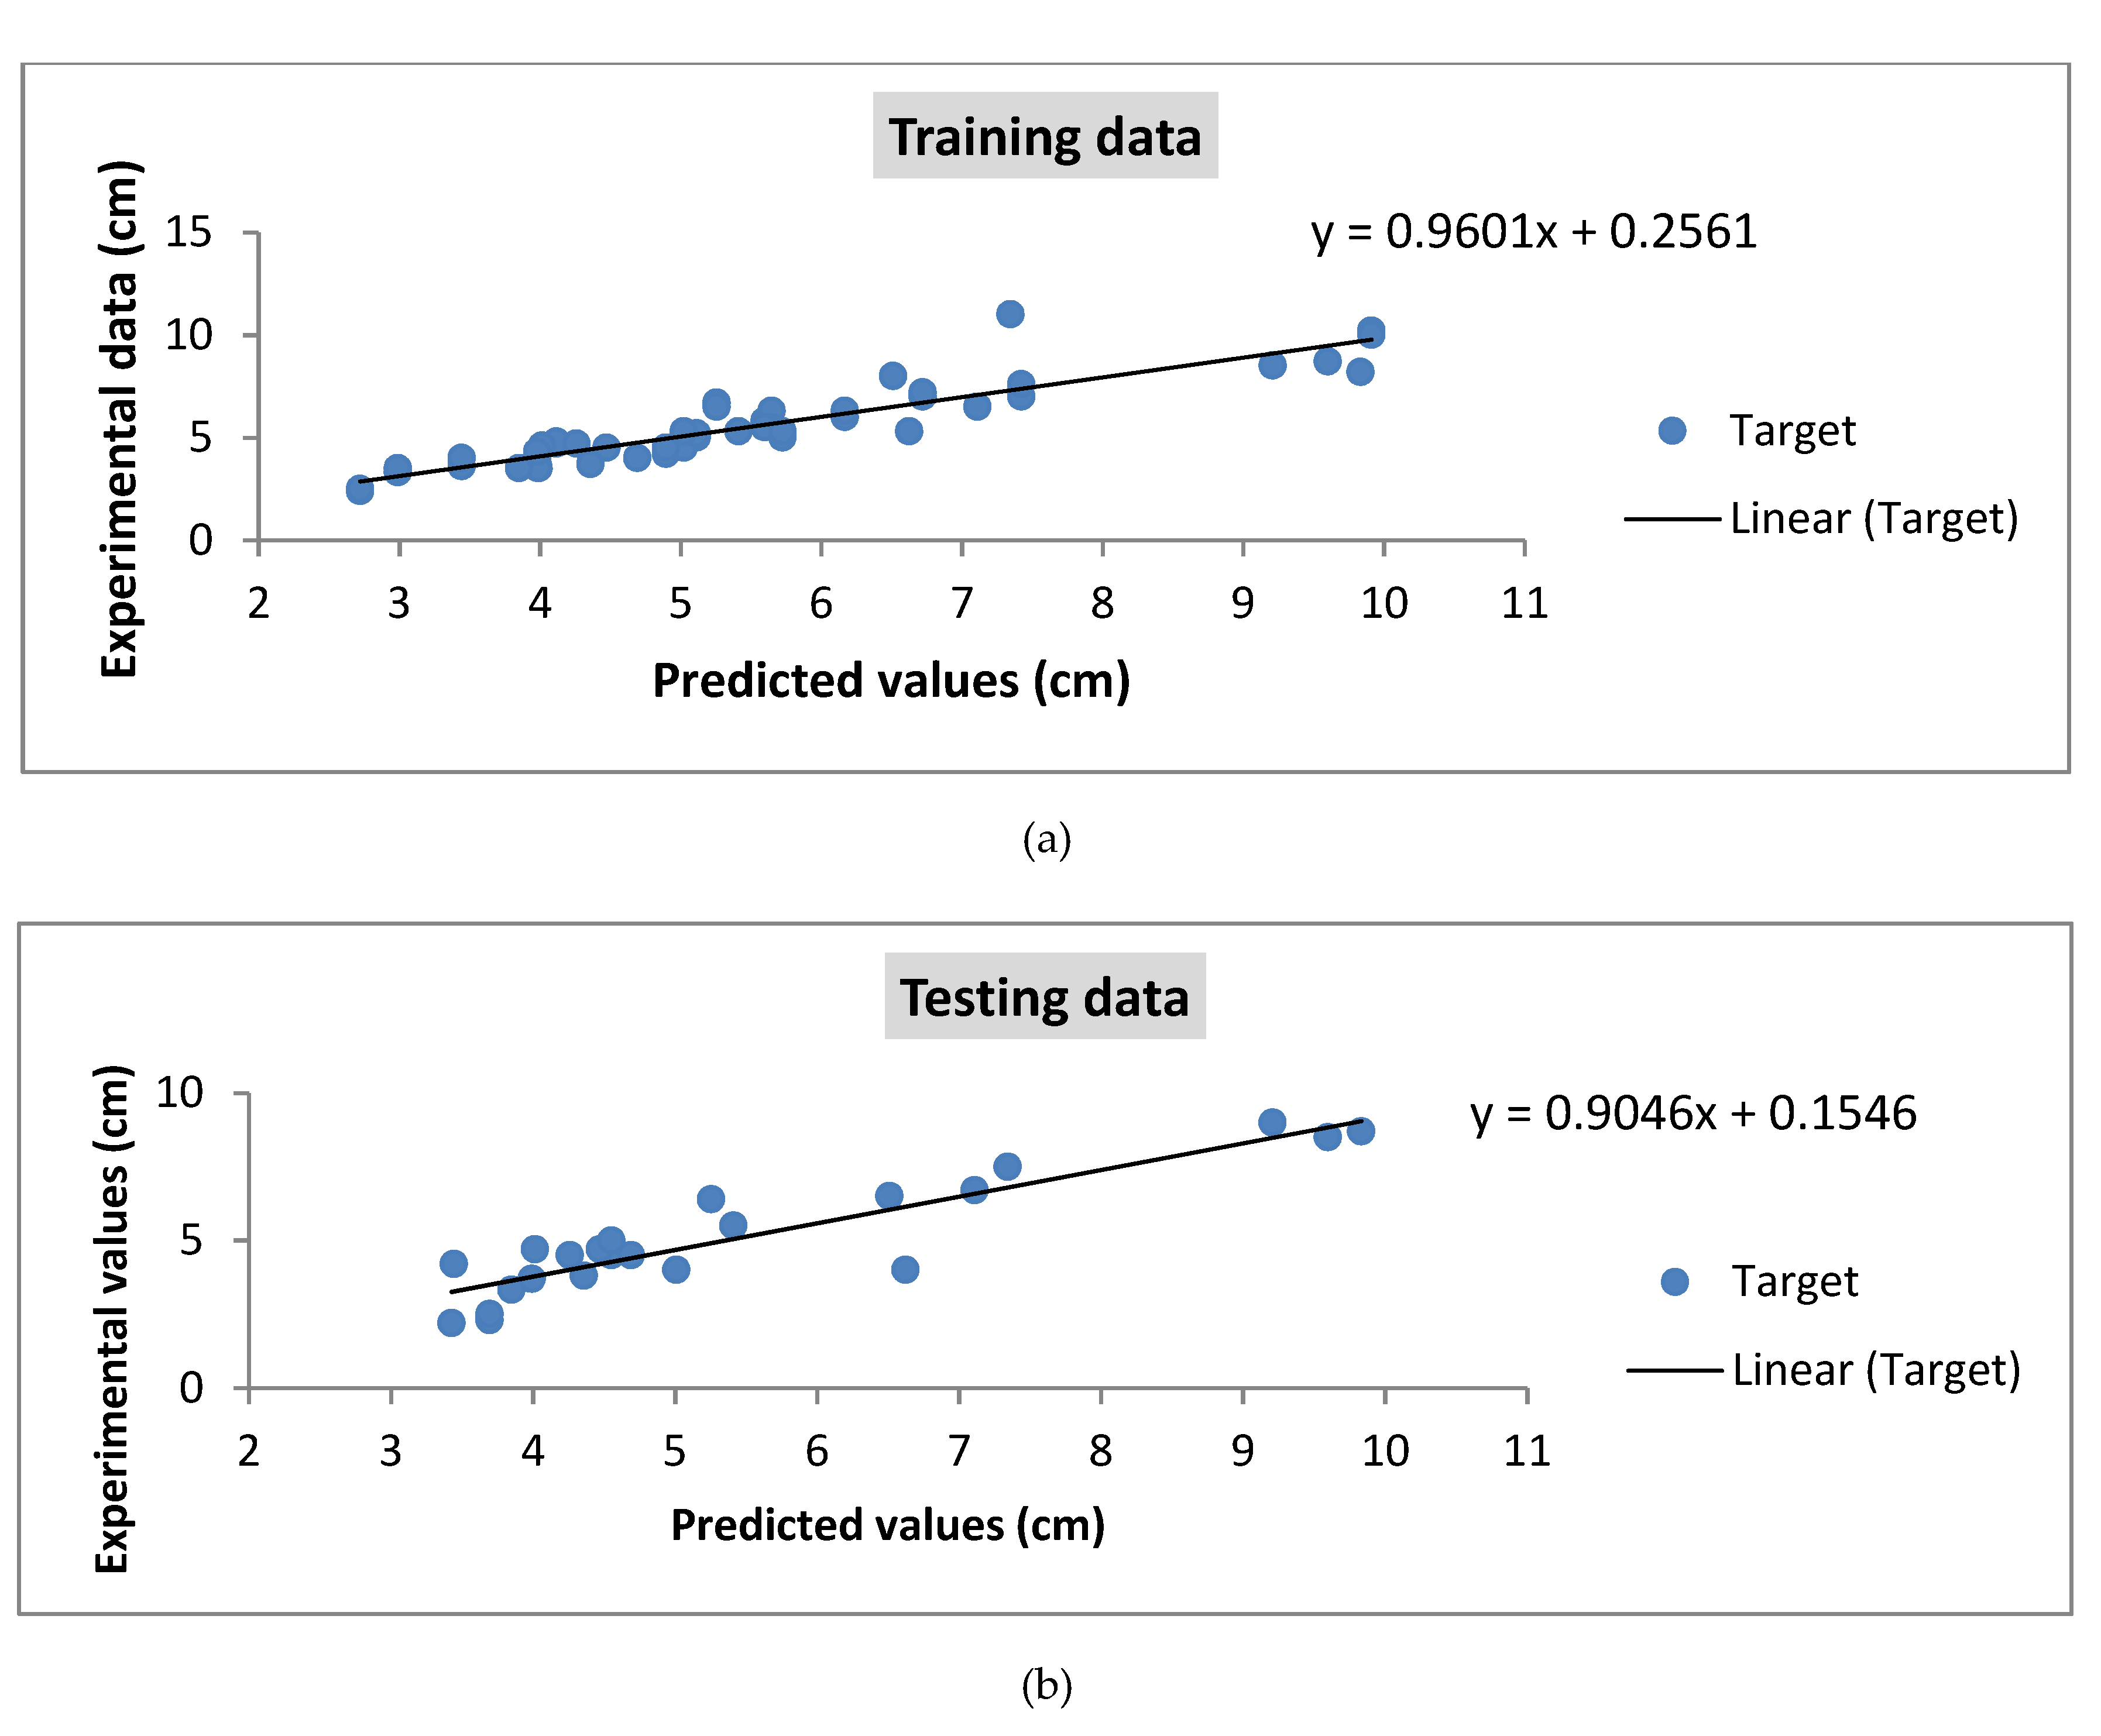
4.3. Permeability Test

A total of 78 cylindrical samples are placed in a permeability gage and subjected to 5 bar water pressure for 24 h. Then, the splitting test is conducted, and the depth of water penetration is measured. The results of the permeability test on the 78 cylindrical samples are demonstrated in Figure 10 for different water-to-binder ratios. As seen in Figure 10, the positive effect of nano-MgO on permeability is available in all samples. The most optimal result (minimum amount of permeability) belonged to the water-to-binder ratio equal to 0.44 for samples with 1% nano-MgO. As expected, the addition of nano-powder filled the nanosized pores and reduced water penetration. In addition, the expansive feature of nano-MgO plays an effective role in the reduction of concrete permeability. By the completion of the hydration process of nano-MgO, the product of hydration needs more space, pores of the concrete are occupied, and as a result, permeability comes down. As seen in Figure 10a, 1% of nano-MgO is the optimum amount of this nanomaterial for the 0.44 water-to-binder ratio. It reduces the permeability of concrete up to 63%. In addition, 1.5% of nano-MgO has reduced permeability, but the reduction is not as strong as that of 1% nano MgO. As observed in Figure 10, increasing the water-to-binder ratio causes the optimum amount of nano-MgO to differ. Regarding Figure 10b,c, the best results are gained with 1.5% nano-MgO for samples cured for 56 days. Regarding the high standard deviation of these samples (STD = 1.2) in comparison with other samples, it seems that the least permeability for this group (w/c = 0.62, nano-MgO = 1.5% and samples cured for 56 days) is not reliable; as a result, 0.5% of nano-MgO plays the most efficient role in decreasing the permeability, which is 26% less than that of plain samples.

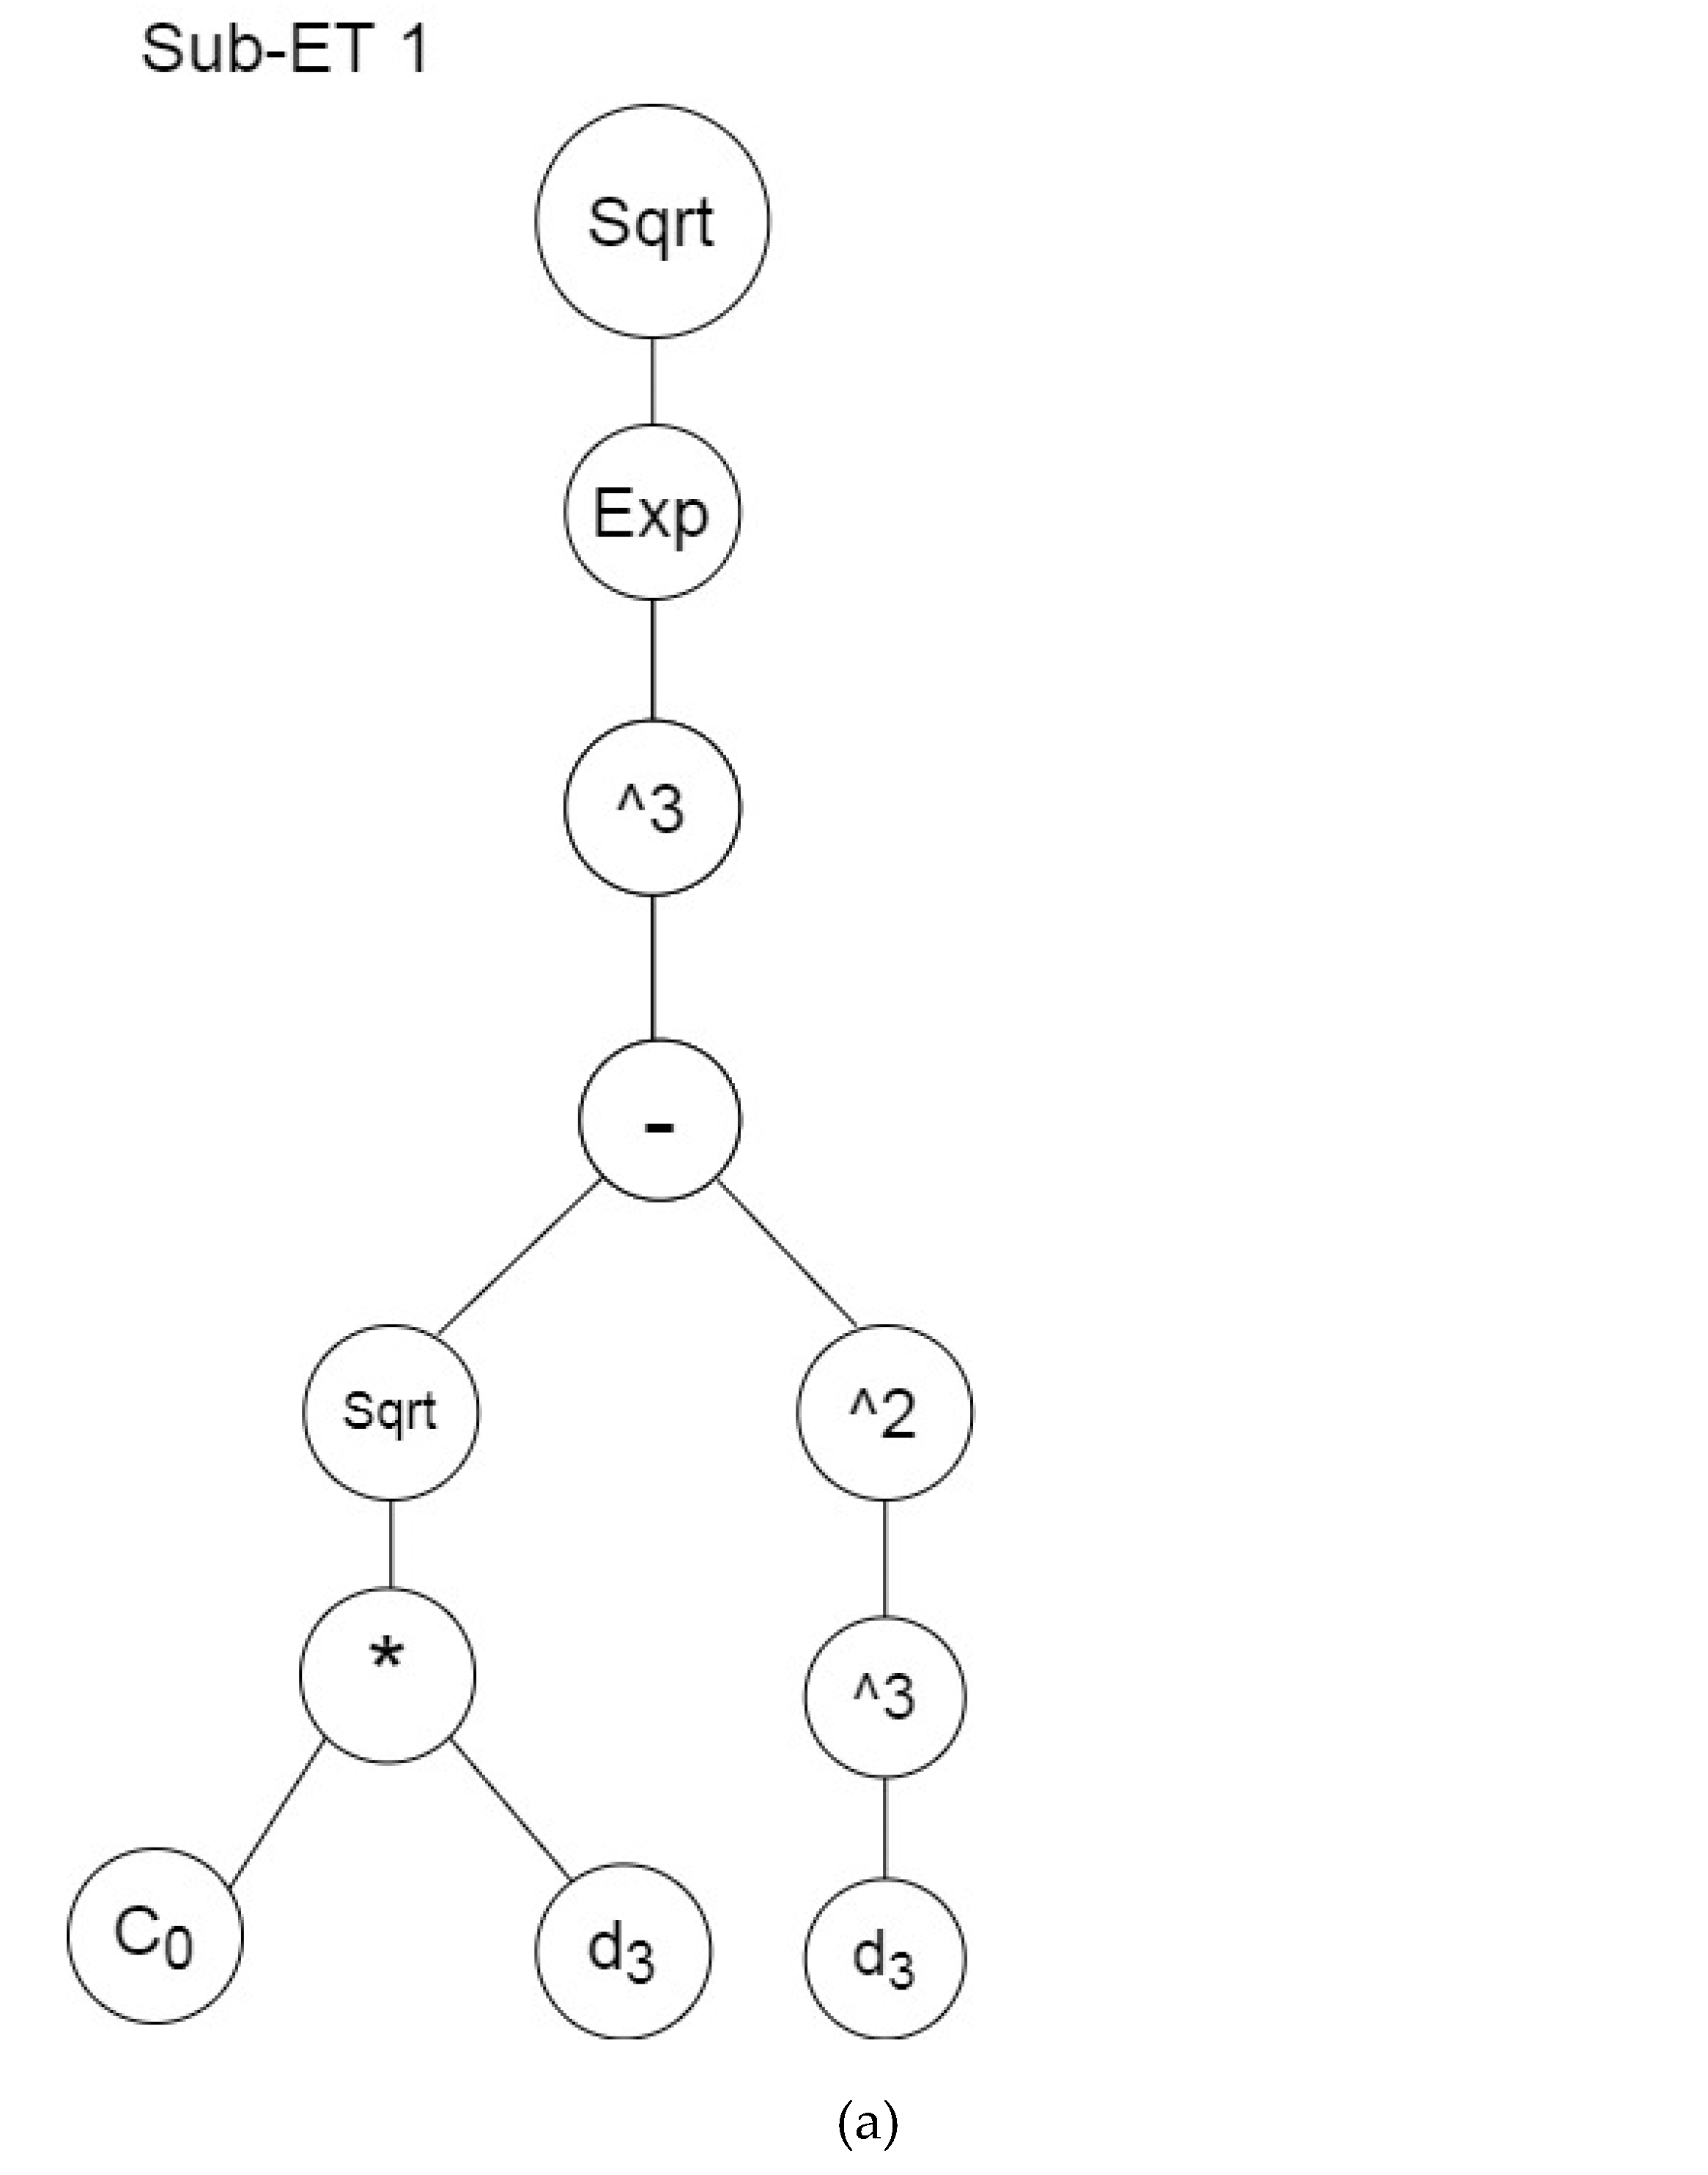
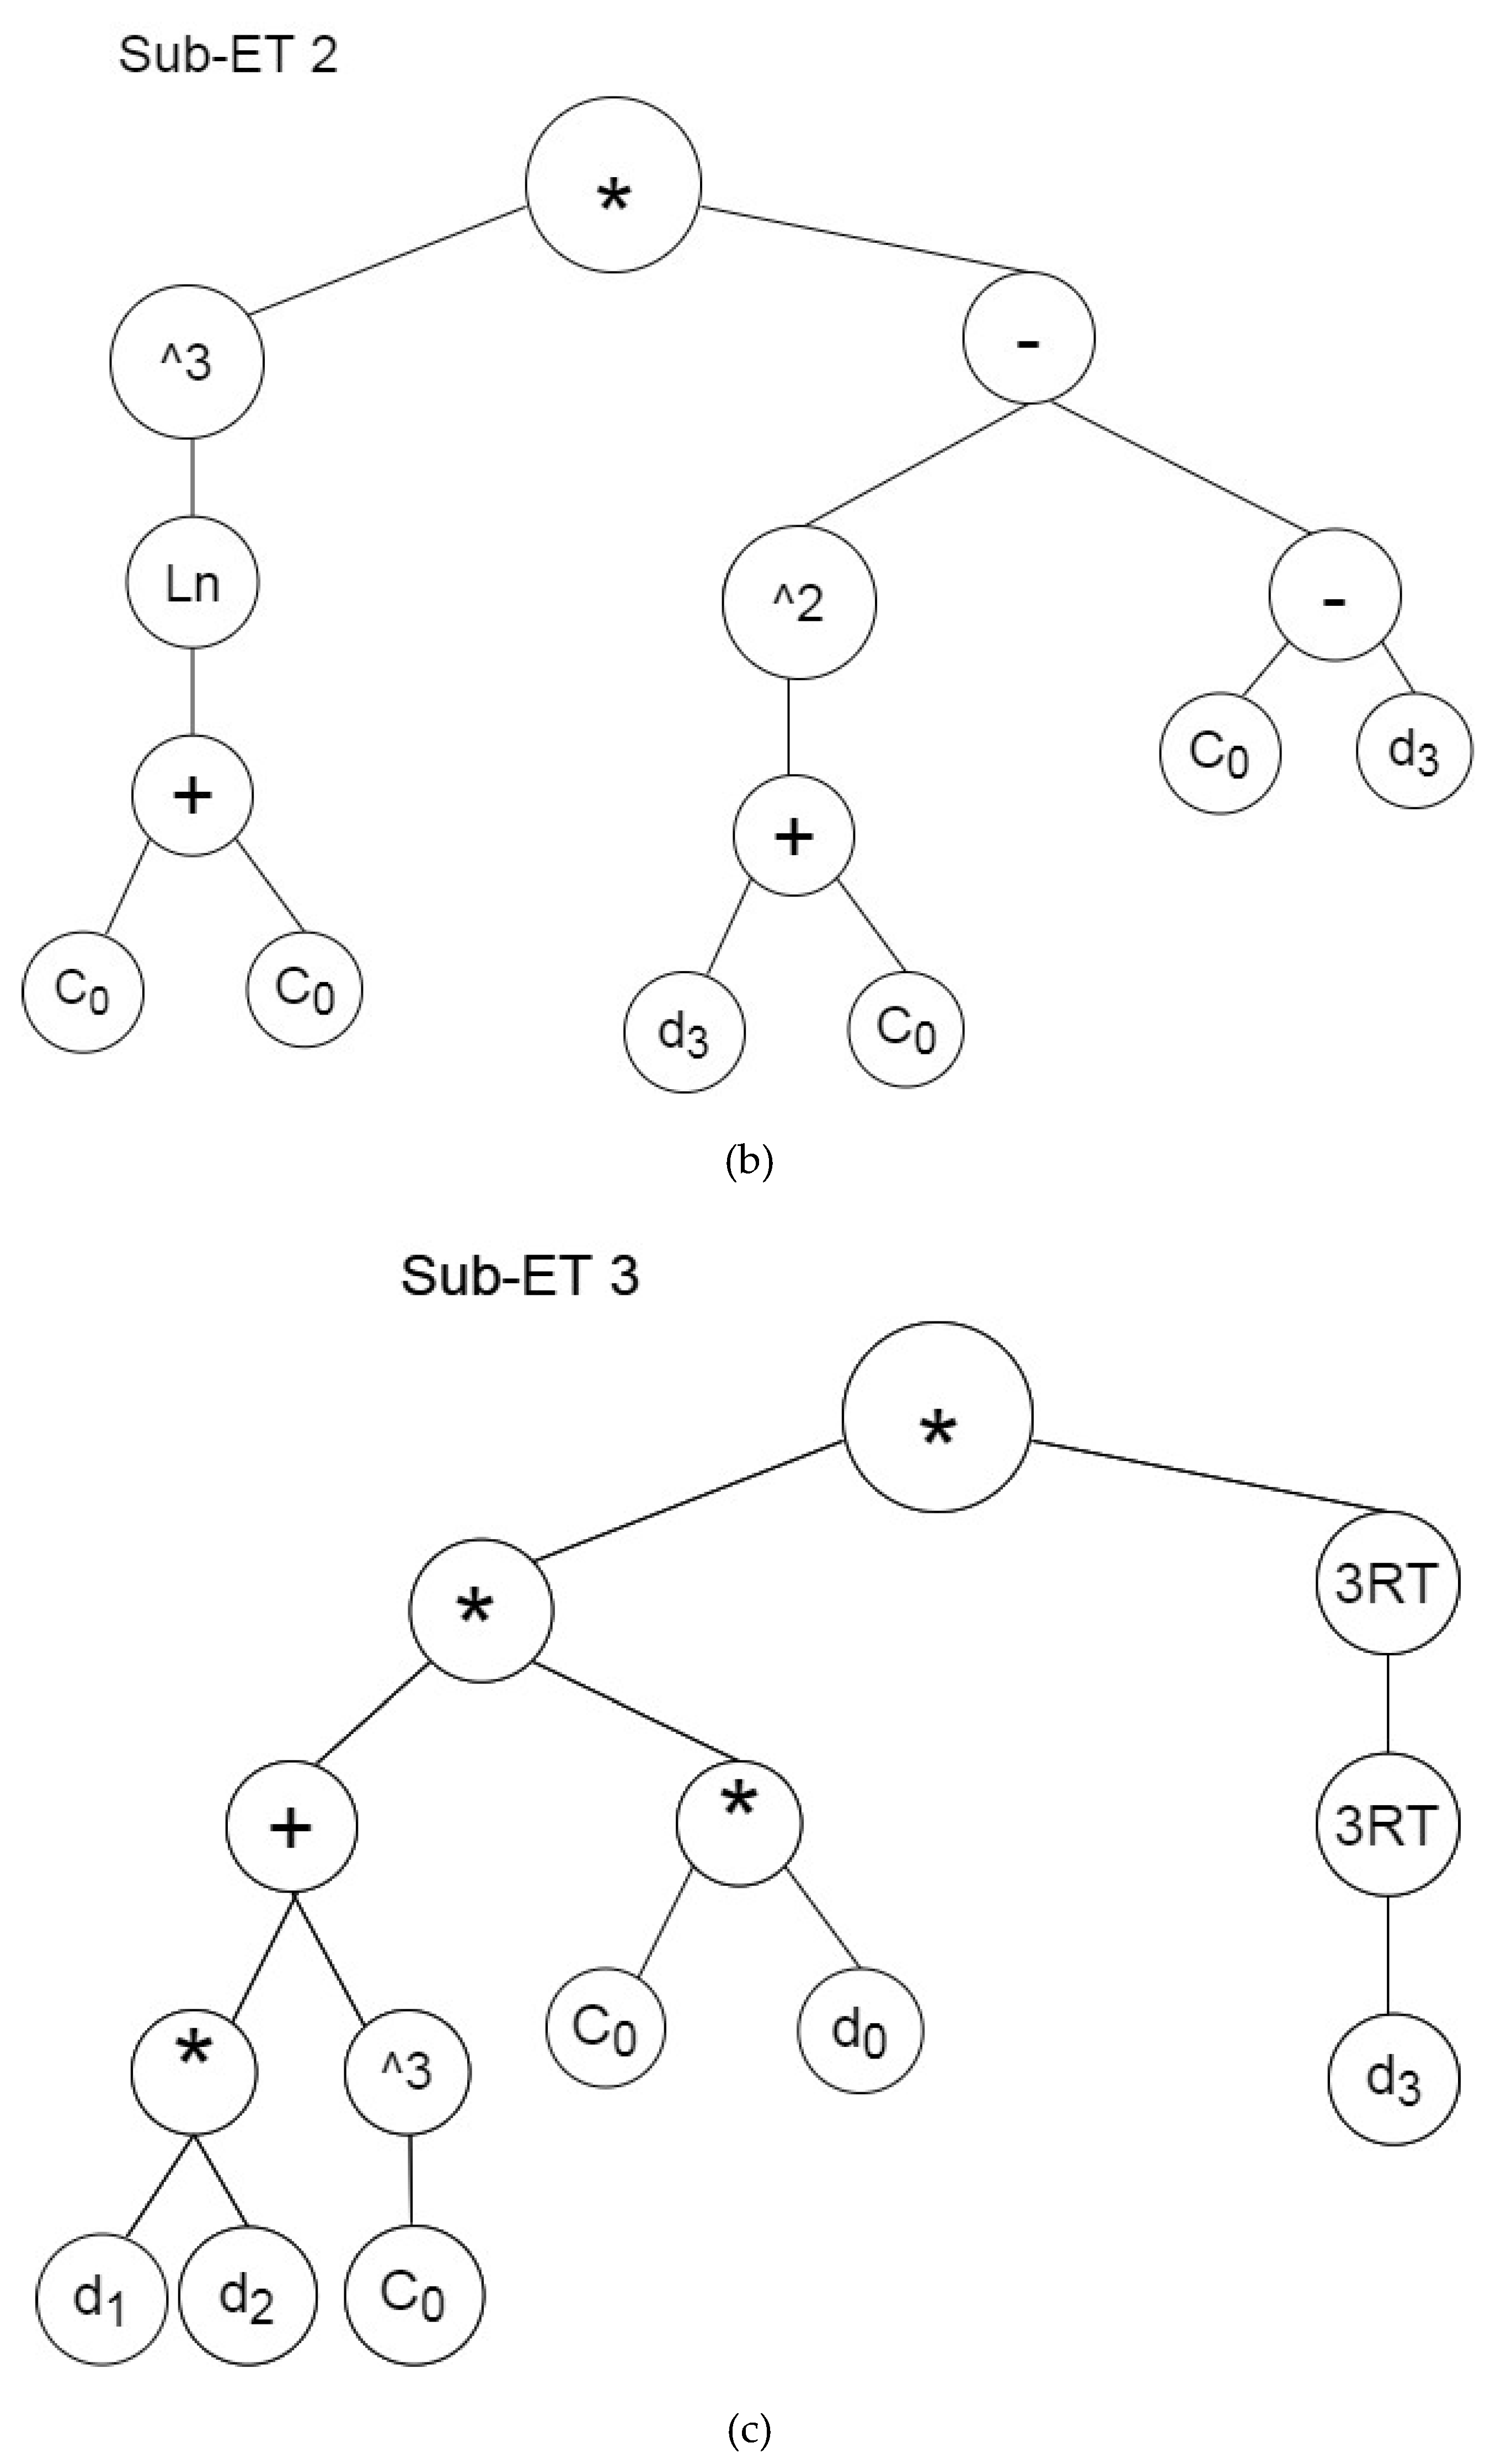
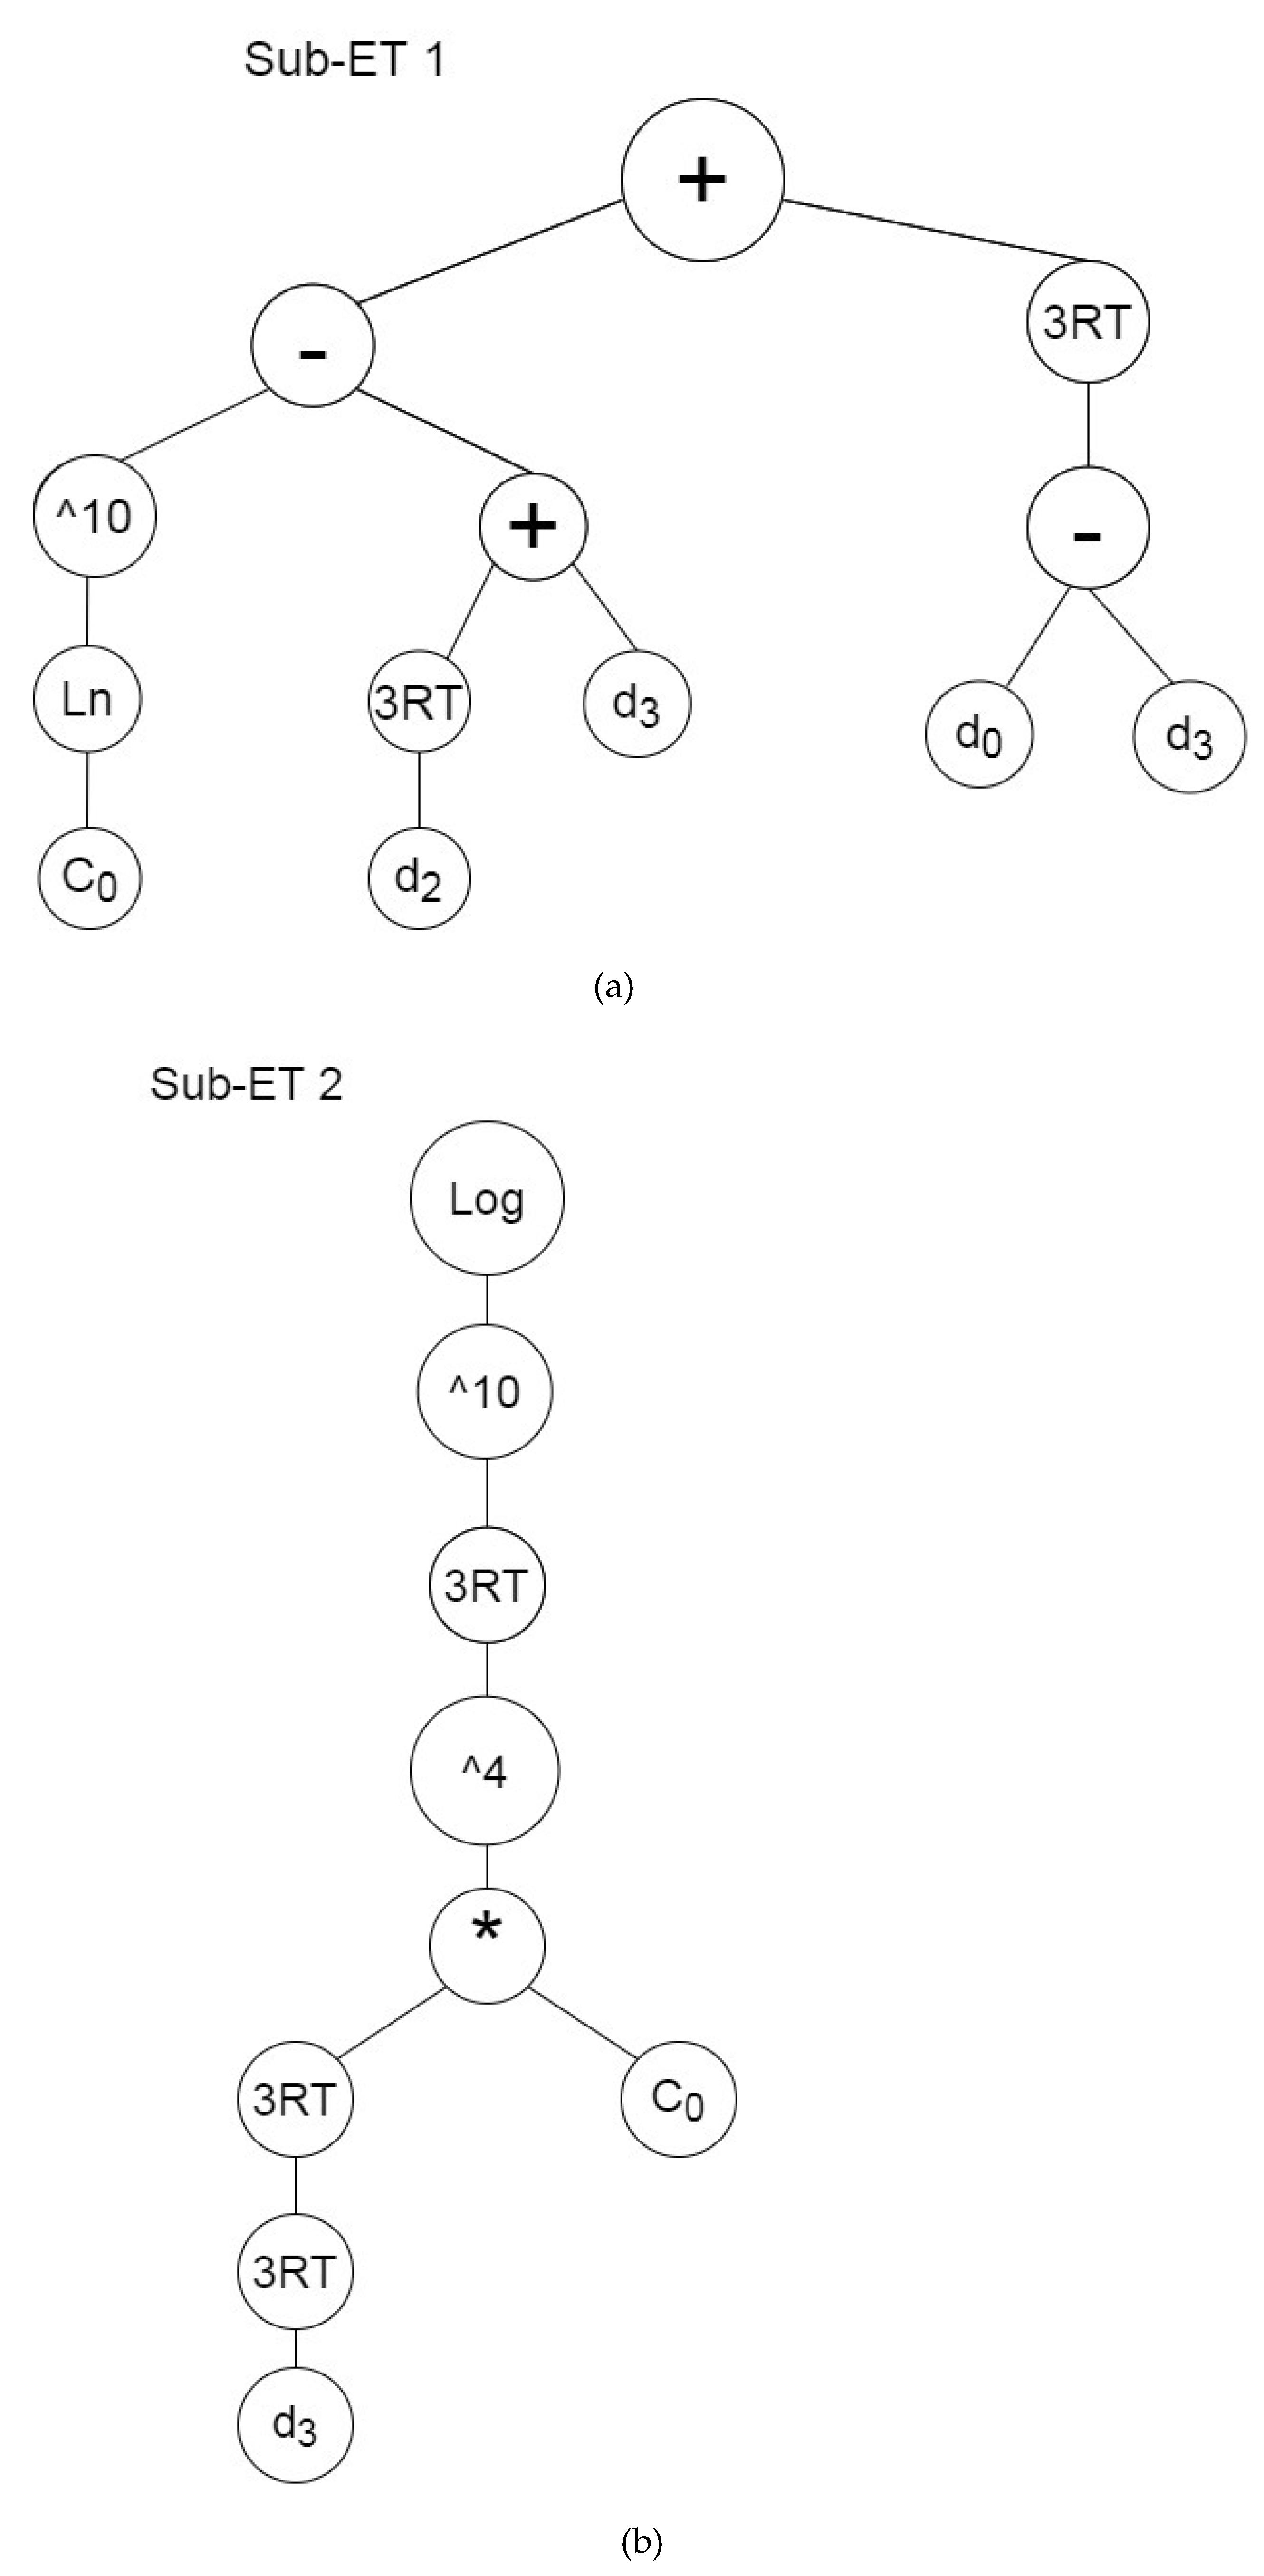
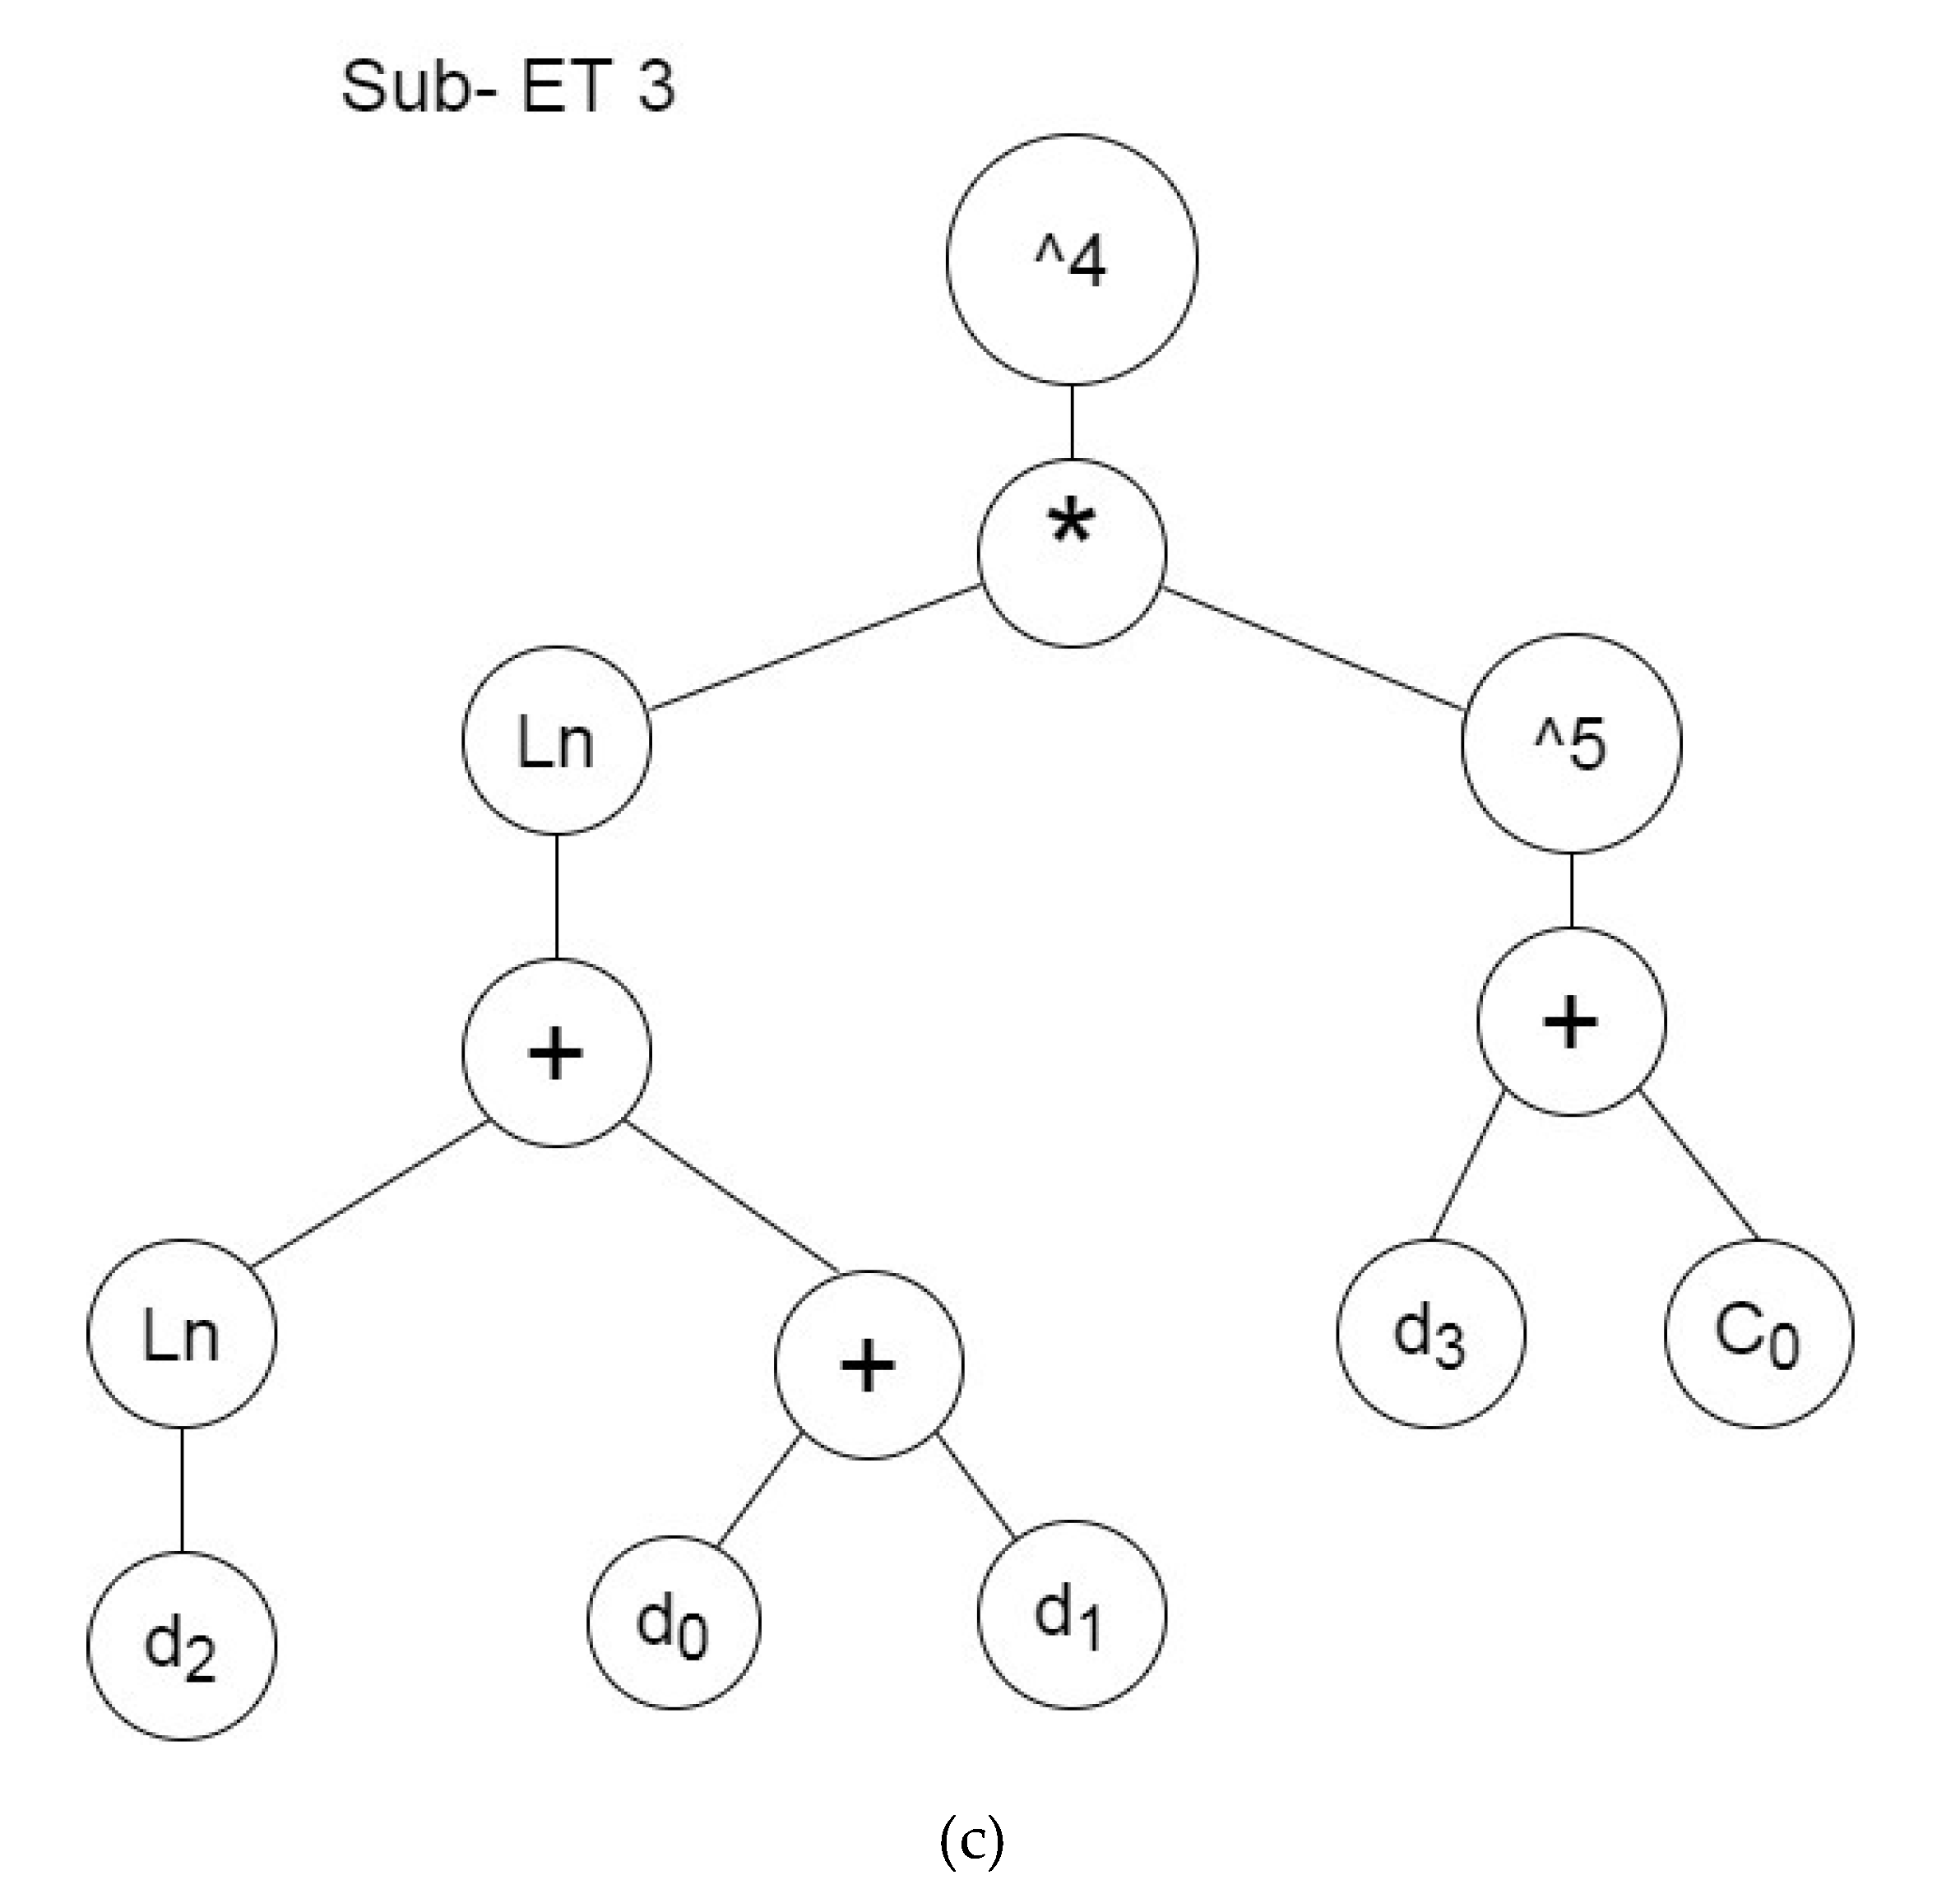
4.4. Modeling and Discussion

A mathematical formulation is presented to numerically assess the effects of utilized materials on the concrete properties. To fulfill this purpose, the GEP method is applied. GeneXpro tools 5.0 [41] was utilized to generate the mathematical expressions between the variables and the objectives. For every objective, eight models were run with different properties such as the number of chromosomes, number of head size, linking function, and number of constants per gene (Table 5). The dataset is divided into two parts by the GEP algorithm randomly; 80% of the dataset is training data and 20% is testing data. Testing data do not have any role in the training process and building of the model. In Figure 11, Figure 12 and Figure 13, the best results of GEP are shown as ETs, in which d0, d1, d2, and d3 represent the percentage of nano-MgO, water-to-binder ratio, curing age of concrete, and superplasticizer percentage, respectively.
Table 8, Table 9 and Table 10 show the best mathematical formulation for the prediction of the compressive strength, tensile strength, and permeability, respectively. Every formulation consists of three genes that are linked to each other by linking functions such as addition or multiplication. For finding the proper formulation, GEP uses different operators such as powers, Sqrt, e^, Ln, Log, etc. All four variables are utilized in formulations; it shows that selected variables are effective in the performance of the concrete.
Regression analysis is a type of statistical modeling that estimates the relation between dependent variables and independent variables. Linear regression is the most common regression. The aim of linear regression is finding the best fitting line to data. Figure 14, Figure 15 and Figure 16 depict the regression diagrams by experimental data and the predicted data for the compressive strength, tensile strength, and permeability, respectively. The horizontal axis shows predicted values by GEP, and the vertical axis is experimental data. The error is named “coefficient of determination” and is shown by R2. An ideal line has R2 = 1, which means that the predicted values and real data are the same. The model is created by a training dataset, and it is examined by the testing dataset. The formulation of the compressive strength has an R2 value of 0.98 for both the training and testing data. For the tensile strength formula, this value is 0.97 and 0.96 for the training and testing data, respectively. From Table 11, it can be concluded that GEP is an applicable and beneficial tool for predicting the concrete properties, which has been confirmed by the results.

5. Conclusions

In this study, the effect of nano-MgO on the durability of normal concrete under freeze–thaw conditions is investigated. A total of 98 cubic 10 × 10 × 10 concrete samples are created for the compressive strength test, while 78 cylindrical concrete 10 × 20 samples are considered for the tensile strength and permeability tests. All of the samples are subjected to 300 freeze–thaw cycles. Variables of the study are the water-to-binder ratio (0.44, 0.49, 0.62), percentage of nano-MgO (0, 0.5%, 1%, 1.5%), curing period (7, 28, 56 days), and percentage of superplasticizer (0, 0.5%, 1%). The results are summarized below.
By comparing the results of the compressive strength for the three water-to-binder ratios, the maximum compressive strength belongs to the water-to-binder ratio of 0.44 with samples containing 1% nano-MgO that were cured for 56 days. This amount of nano-MgO can enhance the compressive strength to 63 MPa, which is 9.12% more than the control samples (57.7 MPa) on average. For the water-to-binder ratio of 0.49, the best compressive strength is gained by the sample with 1.5% nano-MgO (57.4 MPa), which is 17% more than the control samples (49 MPa). The least positive effect of nano-MgO on the compressive strength of concrete samples occurs in samples with a water-to-binder ratio of 0.62 with 0.5% nano-MgO (2.6% increase). The best results of tensile strength and permeability can be gained by the same amounts of nano-MgO. As an example, the addition of 1% nano-MgO to the mixture with a water-to-binder ratio of 0.44 can increase the tensile strength 10.6% more than the control sample and decrease the permeability by 63% in comparison to the control samples. The same trend of effect is gained from the permeability test results.
For assessment of the results numerically and proposing a mathematical formulation for predicting the mechanical properties of concrete with nano-MgO, the GEP method is applied. Different models are examined, and the best models are chosen regarding statistical results. For the compressive and tensile strengths, GEP1 is selected as the best model in which the amount of R2 is 0.98 and 0.97 for training and test data, respectively. For permeability, GEP6 is introduced as the best model, while it has an R2 of 0.96 and 0.95 for the training and testing data, respectively. GEP can provide a simple and very useful formulation that can be used easily. As a result of the acceptable accuracy of the models provided by GEP, they are applicable in further designation and investigation programs, and it is useful for the prediction of the mechanical properties of the concrete with nano-MgO in cold regions.

Author Contributions

The authors confirm contribution to the paper as follows: Study conception and design: A.F.A.; S.T.; M.Y. Data collection: M.Y., A.F.A. Analysis and interpretation of results: A.F.A.; S.T.; M.Y.; Draft manuscript preparation: M.Y., A.F.A., S.T., A.H.G. All authors have read and agreed to the published version of the manuscript.

Funding

Not applicable.

Institutional Review Board Statement

Not applicable.

Informed Consent Statement

Not applicable.

Data Availability Statement

The data presented in this study are available on request from the corresponding author.

Conflicts of Interest

The authors declare no conflict of interest.

Abbreviations

Symbols
C(i,j)Value obtained by chromosome i for fitness case j
CPCuring period of concrete samples
DDiameter of specimen (mm)
eiExperimental value
FiFitness function
hHead length of chromosome
LLength of specimen (mm)
MSelection range
nNumber of arguments
NMgOPercentage of nano-MgO
PMaximum force indicated by the testing machine (N)
PiPrediction value
R2Statistical error value
RMSERoot mean square error
SPPercentage of super plasticizer
tTail length of chromosome
TTensile strength of cylindrical sample (MPa)
TjThe target value for fitness case j
W/CWater-to-cement ratio

References

  1. Powers, T.C. A Working Hypothesis for Further Studies of Frost Resistance of Concrete. J. Am. Concr. Inst. 1945, 16, 245–272. [Google Scholar]
  2. Ebrahimi, K.H.; Daiezadeh, M.J.; Zakertabrizi, M.; Zahmatkesh, F.; Habibnejad Korayem, A. A review of the impact of micro- and nanoparticles on freeze-thaw durability of hardened concrete: Mechanism perspective. Constr. Build. Mater. 2018, 186, 1105–1113. [Google Scholar] [CrossRef]
  3. Du, L.; Folliard, K.J. Mechanisms of air entrainment in concrete. Cem. Concr. Res. 2005, 35, 1463–1471. [Google Scholar] [CrossRef]
  4. Halbiniak, J.; Langier, B. Research on the frost resistance of concretes modified with fly ash. Teka Kom. Motoryz. Energetyki Rolnictwa. 2014, 14, 23–30. [Google Scholar]
  5. Chung, C.W.; Shon, C.S.; Kim, Y.S. Chloride ion diffusivity of fly ash and silica fume concretes exposed to freeze–thaw cycles. Constr. Build. Mater. 2010, 24, 1739–1745. [Google Scholar] [CrossRef]
  6. Cwirzen, A.; Habermehl-Cwirzen, K. The Effect of Carbon Nano- and Microfibers on Strength and Residual Cumulative Strain of Mortars Subjected to Freeze-Thaw Cycles. J. Adv. Concr. Tech. 2013, 11, 80–88. [Google Scholar] [CrossRef] [Green Version]
  7. Wong, H.S.; Barakat, R.; Alhilali, A.; Saleh, M.; Cheeseman, C.R. Hydrophobic concrete using waste paper sludge ash. Cem. Concr. Res. 2015, 70, 9–20. [Google Scholar] [CrossRef]
  8. Du, H.; Du, S.; Liu, X. Durability performances of concrete with nano-silica. Constr. Build. Mater. 2014, 73, 705–712. [Google Scholar] [CrossRef] [Green Version]
  9. Wang, B.; Wang, L.; Lai, F. Freezing resistance of HPC with nano-SiO2. J. Wuhan Univ. Technol. Mater. Sci. 2008, 23, 85–88. [Google Scholar] [CrossRef]
  10. Fan, Y.; Zhang, S.; Wang, Q.; Shah, S.P. Effects of nano-kaolinite clay on the freeze–thaw resistance of concrete. Cem. Concr. Compos. 2015, 62, 1–12. [Google Scholar] [CrossRef]
  11. Gonzalez, M.; Tighe, S.L.; Hui, K.; Rahman, S.; Lima, A.O. Evaluation of freeze-thaw and scaling response of nano concrete for Portland Cement Concrete (PCC) pavements. Constr. Build. Mater. 2016, 120, 465–472. [Google Scholar] [CrossRef]
  12. Yanturina, R.A.; Trofimov, B.Y.; Ahmedjanov, R.M. The Influence of Graphite-Containing Nano-Additives on Thermo-Frost Resistance of Concrete. Proc. Eng. 2017, 206, 869–874. [Google Scholar] [CrossRef]
  13. Shahrajabian, F.; Behfarnia, K. The effects of nano particles on freeze and thaw resistance of alkali-activated slag concrete. Constr. Build. Mater. 2018, 176, 172–178. [Google Scholar] [CrossRef]
  14. Kalhori, H.; Bagherzadeh, B.; Bagherpour, R.; Akhlaghi, M.A. Experimental study on the influence of the different percentage of nanoparticles on strength and freeze–thaw durability of shotcrete. Constr. Build. Mater. 2020, 256, 119470. [Google Scholar] [CrossRef]
  15. Nobre, J.; Hawreen, A.; Evangelista, L.; Bravo, M. Magnesia (MgO) Production and Characterization, and Its Influence on the Performance of Cementitious Materials: A Review. Materials 2020, 13, 4752. [Google Scholar] [CrossRef]
  16. Mo, L.; Deng, M.; Tang, M.; Al Tabbaa, A. MgO expansive cement and concrete in China: Past, present and future. Cem. Concr. Res. 2014, 57, 1–12. [Google Scholar] [CrossRef]
  17. Moradpour, R.; Taheri-Nassaj, E.; Parhizkar, T.; Ghodsian, M. The effects of nanoscale expansive agents on the mechanical properties of non-shrink cement-based composites: The influence of nano-MgO addition. Compos. Part B 2013, 5, 193–202. [Google Scholar] [CrossRef]
  18. Dung, N.; Unluer, C. Improving the performance of reactive MgO cement-based concrete. Constr. Build. Mater. 2016, 126, 747–758. [Google Scholar] [CrossRef]
  19. Kabir, H.; Hooton, R. Evaluating soundness of concrete containing shrinkage-compensating MgO admixtures. Constr. Build. Mater. 2020, 253, 119141. [Google Scholar] [CrossRef]
  20. Gandomi, A.H.; Alavi, A.H.; Ryan, C. Handbook of Genetic Programming Applications; Springer: Cham, Switzerland, 2015. [Google Scholar]
  21. Ferreira, C. Gene expression programming: A new adaptive algorithm for solving problems. Complex. Syst. 2011, 13, 87–129. [Google Scholar]
  22. Ferreira, C. Gene Expression Programming in Problem Solving. In Soft Computing and Industry; Roy, R., Köppen, M., Ovaska, S., Furuhashi, T., Hoffmann, F., Eds.; Springer: London, UK, 2002. [Google Scholar] [CrossRef] [Green Version]
  23. Ferreira, C. Gene Expression Programming: Mathematical Modeling by an Artificial Intelligence, 2nd ed.; Springer: Berlin/Heidelberg, Germany, 2006. [Google Scholar]
  24. Gandomi, A.H.; Alavi, A.H.; Mirzahosseini, M.R.; Moghadasnejad, F. Nonlinear Genetic-Based Models for Prediction of Flow Number of Asphalt Mixtures. J. Mater. Civil. Eng. 2011, 23, 248–263. [Google Scholar] [CrossRef]
  25. Ozcan, F. Gene expression programming based formulations for splitting tensile strength of concrete. Constr. Build. Mater. 2012, 26, 404–410. [Google Scholar] [CrossRef]
  26. Gandomi, A.H.; ASCE, S.M.; Karim Babanajad, S.; Alavi, A.H.; Farnam, Y. Novel Approach to Strength Modeling of Concrete under Triaxial Compression. J. Mater. Civil. Eng. 2012, 24, 1132–1143. [Google Scholar] [CrossRef]
  27. Gandomi, A.H.; Alavi, A.H.; Kazemi, S.; Gandomi, M. Formulation of shear strength of slender RC beams using gene expression programming, part I: Without shear reinforcement. Auto. Constr. 2014, 42, 112–121. [Google Scholar] [CrossRef]
  28. Alkroosh, I.; Ammash, H. Soft computing for modeling punching shear of reinforced concrete flat slabs. Ain. Shams. Eng. J. 2015, 6, 439–448. [Google Scholar] [CrossRef] [Green Version]
  29. Mahdinia, S.; Eskandari-Naddaf, H.; Shadnia, R. Effect of cement strength class on the prediction of compressive strength of cement mortar using GEP method. Constr. Build. Mater. 2019, 198, 27–41. [Google Scholar] [CrossRef]
  30. Shahmansouri, A.A.; Akbarzadeh Bengar, H.; Jahani, E. Predicting compressive strength and electrical resistivity of eco-friendly concrete containing natural zeolite via GEP algorithm. Constr. Build. Mater. 2019, 223, 116883. [Google Scholar] [CrossRef]
  31. Farjad Iqbal, M.; Liu, Q.F.; Azim, I.; Zhu, X.; Yang, J.; Javed, M.F.; Rauf, M. Prediction of mechanical properties of green concrete incorporating waste foundry sand based on gene expression programming. J. Hazard. Mater. 2020, 384, 121322. [Google Scholar] [CrossRef] [PubMed]
  32. Behnia, D.; Behnia, M.; Shahriar, K.; Goshtasbi, K. A New Predictive Model for Rock Strength Parameters Utilizing GEP Method. Proc. Eng. 2017, 191, 591–599. [Google Scholar] [CrossRef]
  33. Yeddula, B.S.R.; Karthiyaini, S. Experimental investigations and GEP modelling of compressive strength of ferrosialate based geopolymer mortars. Constr. Build. Mater. 2020, 236, 117602. [Google Scholar] [CrossRef]
  34. ASTM C150. Standard Specification for Portland Cement; ASTM International: West Conshohocken, PA, USA, 2020. [Google Scholar]
  35. ASTM C33/C33M-18. Standard Specification for Concrete Aggregates; ASTM International: West Conshohocken, PA, USA, 2018. [Google Scholar]
  36. Baghdadi, Y.; Youssef, L.Y.; Bouhadir, K.; Harb, M.; Mustapha, S.; Tehrani-Bagha, A. The effects of modified zinc oxide nanoparticles on the mechanical/thermal properties of epoxy resin. J. Appl. Polym. Sci. 2020, 137, 43–49330. [Google Scholar] [CrossRef]
  37. ASTM C666/C666M-15. Standard Test Method for Resistance of Concrete to Rapid Freezing and Thawing; ASTM International: West Conshohocken, PA, USA, 2015. [Google Scholar] [CrossRef]
  38. ASTM C496/C496M-17. Standard Test Method for Splitting Tensile Strength of Cylindrical Concrete Specimens; ASTM International: West Conshohocken, PA, USA, 2017. [Google Scholar]
  39. DIN 1048 (Part-5): German Standard for determination of Permeability of Concrete. Available online: https://www.mystandards.biz/standard/din-1048-5-1.6.1991.html (accessed on 1 January 1991).
  40. Ferreira, C. Automatically Defined Functions in Gene Expression Programming. In Genetic Systems Programming. Studies in Computational Intelligence; Nedjah, N., Mourelle, L.M., Abraham, A., Eds.; Springer: Berlin/Heidelberg, Germany, 2006. [Google Scholar] [CrossRef]
  41. GEPSOFT, GeneXproTools. Version 5.0. 2013. Available online: https://www.gepsoft.com/ (accessed on 1 May 2013).
Figure 1. Fresh concrete in cubic and cylindrical molds.
Applsci 11 02529 g001
Figure 2. Concrete samples: (a) cubic samples, (b) cylindrical samples.
Applsci 11 02529 g002
Figure 3. A cubic sample during the compressive strength test.
Applsci 11 02529 g003
Figure 4. (a) Schematic diagram of the splitting test, (b) a cylindrical concrete sample during the splitting test.
Applsci 11 02529 g004
Figure 5. Measuring water penetration in the cylindrical sample.
Applsci 11 02529 g005
Figure 6. Expression tree of the chromosome (ET).
Applsci 11 02529 g006
Figure 7. The flow-chart of Gene Expression Programming.
Applsci 11 02529 g007
Figure 8. Compressive strength vs. age of concrete for water-to-binder ratios of (a) 0.44, (b) 0.49, and (c) 0.62.
Applsci 11 02529 g008aApplsci 11 02529 g008b
Figure 9. Tensile strength vs. age for water-to-binder ratios of (a) 0.44, (b) 0.49, and (c) 0.62.
Applsci 11 02529 g009aApplsci 11 02529 g009b
Figure 10. Permeability vs. age for water-to-binder ratios of (a) 0.44, (b) 0.49, and (c) 0.62.
Applsci 11 02529 g010
Figure 11. Expression trees (ETs) of Gene Expression Programming (GEP1) for compressive strength (a) sub-ET1 (b) sub-ET2, (c) sub-ET3.
Applsci 11 02529 g011aApplsci 11 02529 g011b
Figure 12. Expression trees of GEP1 for tensile strength (a) sub-ET1, (b) sub-ET2, (c) sub-ET3.
Applsci 11 02529 g012aApplsci 11 02529 g012b
Figure 13. Expression trees of GEP6 for permeability (a) sub-ET1, (b) sub-ET2, (c) sub-ET3.
Applsci 11 02529 g013aApplsci 11 02529 g013bApplsci 11 02529 g013c
Figure 14. Regression chart for the GEP1 prediction model of compressive strength: (a) training data, (b) testing data.
Applsci 11 02529 g014
Figure 15. Regression chart for the GEP1 prediction model of tensile strength: (a) training, (b) testing data.
Applsci 11 02529 g015
Figure 16. Regression chart for GEP6 prediction model of permeability: (a) training data, (b) testing data.
Applsci 11 02529 g016
Table 1. Chemical composition and properties of cement type 2.
Chemical Analysis (%)Cement Type 2 Portland
CaO63.35
SiO221.32
Fe2O33.77
MgO2.44
SO32−1.98
Na2O0.24
K2O0.63
Cl0.01
Blaine (cm2/g)3210
Table 2. Grading of coarse aggregates.
Sieve No. (BS)Remaining Mass on Sieve
(gr)
Remaining Mass on Sieve
(%)
Cumulative Fraction Passing (%)Cumulative Fraction Remaining (%)
1”001000
3/4”1505955
1/2”100033.461.638.4
3/8”8702932.667.4
#493031.11.598.5
Pan401.30100
Table 3. Grading of fine aggregates.
Sieve No.Remaining Mass (gr)Remaining Mass (%)Cumulative Fraction Remaining
#41701717
#828028.545.5
#1614014.259.7
#3018018.378
#5013013.291.2
#100707.198.3
#200101.0299.3
Table 4. Chemical properties of nano-powder.
Magnesium Oxide Nano-Powder (MgO) Certificate of Analysis
MgONaKCa
>99%<750 ppm<218<760
Table 5. Properties and variables of experimental samples.
Type of SamplesWater-to-Binder RatioPercentage of Nano-MgOSuper PlasticizerCuring Period
Cubic samples
(10 × 10 × 10)
0.44
0.49
0.62
0%, 0.5%, 1%, 1.5%0%, 0.5%, 1%7, 28, 56 days
Cylinder samples (10 × 20)
Table 6. Input and output variables and range of variance.
Input VariablesRange of VariationOutput VariablesRange of Variables
Water-to-binder ratio0.44–0.62Compressive strength (kg/cm2)305–661
Curing Age (day)7–56Tensile strength (kg/cm2)20–56
Nano-MgO %0–1.5Permeability (cm)2.4–11
Super Plasticizer %0–1
Table 7. Properties of different Gene Expression Programming (GEP) models.
Model’s PropertiesGEP 1GEP 2GEP 3GEP 4GEP 5GEP6GEP 7GEP 8
Number of chromosomes3030303035353535
Number of head size888810101010
Number of genes33333333
Linking functionAdditionAdditionMultiplicationMultiplicationAdditionAdditionMultiplicationMultiplication
Constant per gene12121212
Table 8. The mathematical formulation of compressive strength of concrete samples containing nano-MgO proposed by the GEP tool.
GEP ModelPredictive Equation of GEP for Compressive Strength
GEP 1 e ( C 0 × d 3 d 3 6 ) 3 + ( l n 2 C 0 ) 3 × ( d 3 + C 0 ) 2 + d 3 C 0 + d 1 × d 2 + C 0 3 × C 0 × d 0 × d 3 1 / 9
Gene 1 C 0 = 7.83280702670388 Gene 2 C 0 = 5.57594309191839 Gene 3 C 0 = 2.53441575642642
Table 9. The mathematical formulation of tensile strength of concrete samples containing nano-MgO proposed by the GEP tool.
GEP ModelPredictive Equation of GEP for Tensile Strength
GEP 1 [ 10 l n C 0 ( d 2 3 + d 3 ) + d 0 d 3 3 ] + ( d 3 ) 1 / 9 × C 0 4 / 3 + l n [ ln d 2 + d 0 + d 1 ] × ( d 3 + C 0 ) 5 4
Gene   1 C 0 = 4.22343540914285 Gene   2 C 0 = 6.93788025316173 Gene   3 C 0 = 2.54902402849616 × 10 2
Table 10. The mathematical formulation of permeability of concrete samples containing nano-MgO proposed by the GEP tool.
GEP ModelPredictive Equation of GEP for Permeability
GEP 6 ( d 3 ) 1 / 9 ( d 1 ( C 1 d 2 ) 1 / 6 ) 3 + l n e C 1 d 1 d 3 d 0 2 1 / 8 + e e 10 1 6 × e l o g d 2 × d 1 C 0 d 3
Gene   1 C 0 = 1.75695059053316 × 10 2 C 1 = 2.79598577259418 Gene   2 C 0 = 1.36482746154668 C 1 = 1.5475468457684 Gene   3 C 0 = 2.50445673280235 C 1 = 7.70746482741783
Table 11. Statistical errors for best models of GEP.
GEP ModelR2Root Mean Square Error (RMSE) (Fitness Value)
GEP1 for compressive strengthTraining = 0.98
Testing = 0.98
Training = 24.16
Testing = 24.28
GEP1 for tensile strengthTraining = 0.97
Testing = 0.96
Training = 227.1
Testing = 225.25
GEP6 for permeabilityTraining = 0.96
Testing = 0.95
Training = 558.14
Testing = 528.16
Publisher’s Note: MDPI stays neutral with regard to jurisdictional claims in published maps and institutional affiliations.

