
An Information Recommendation Technique Based on Influence and Activeness of Users in Social Networks


Abstract
Featured Application
Abstract
1. Introduction
2. Related Work
2.1. Recommendation Based on Social Networks
2.2. Yelp Data
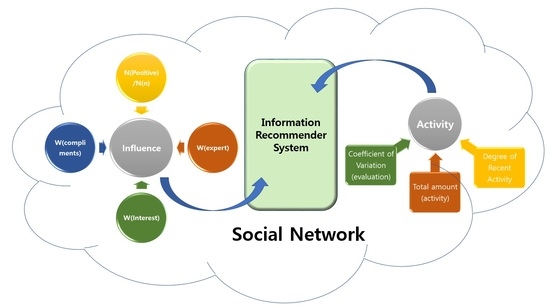
3. User Influence and User Activity
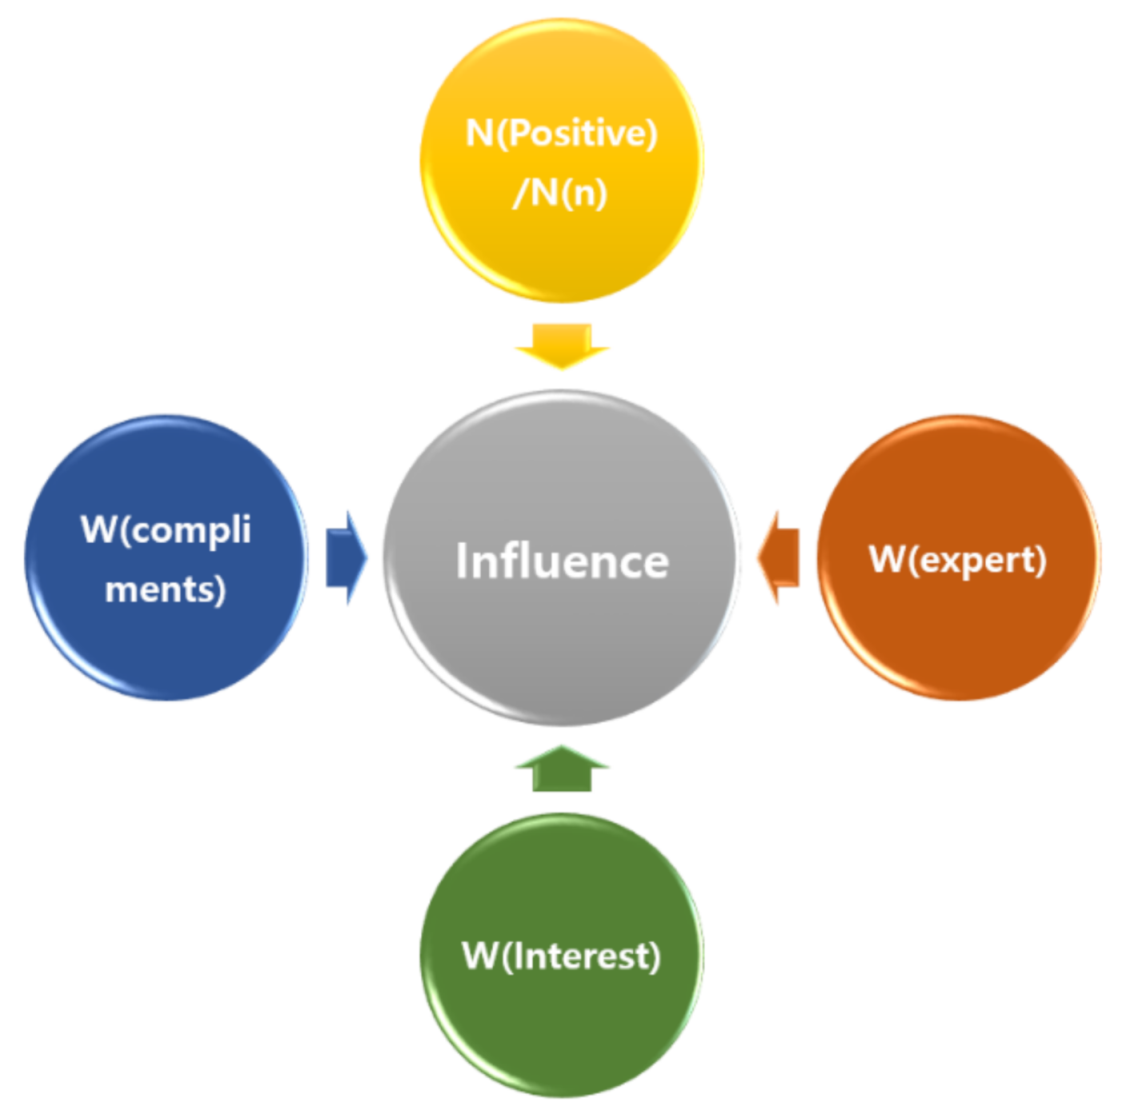
3.1. User Influence
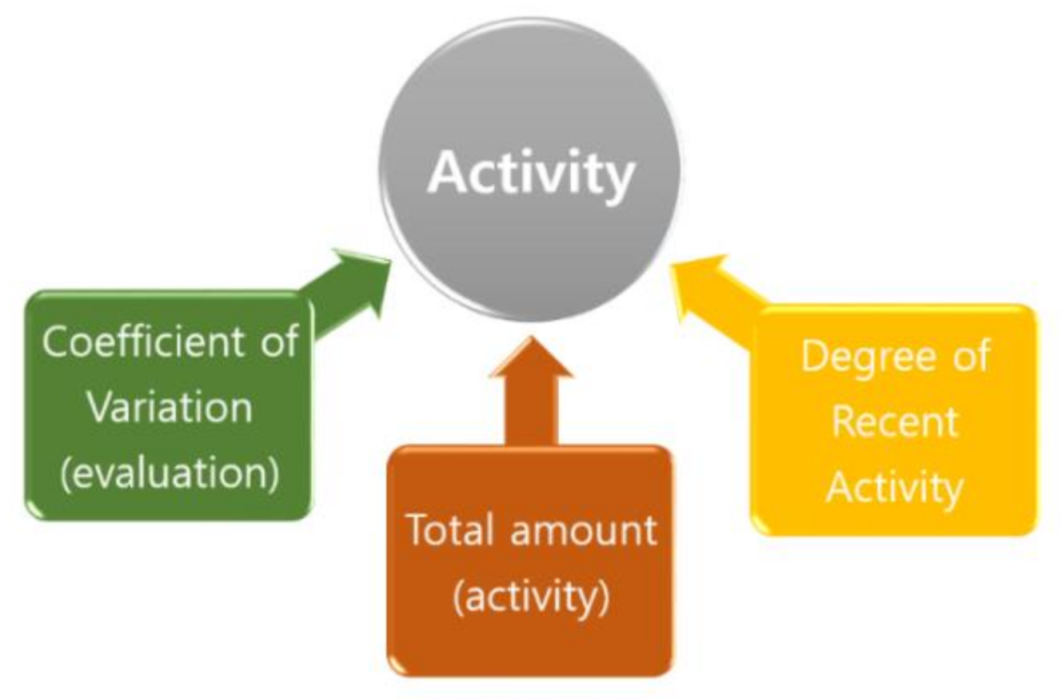
3.2. User Activity
4. Performance Evaluation Results and Discussion
4.1. Experimental Setup and Method for Performance Evaluation
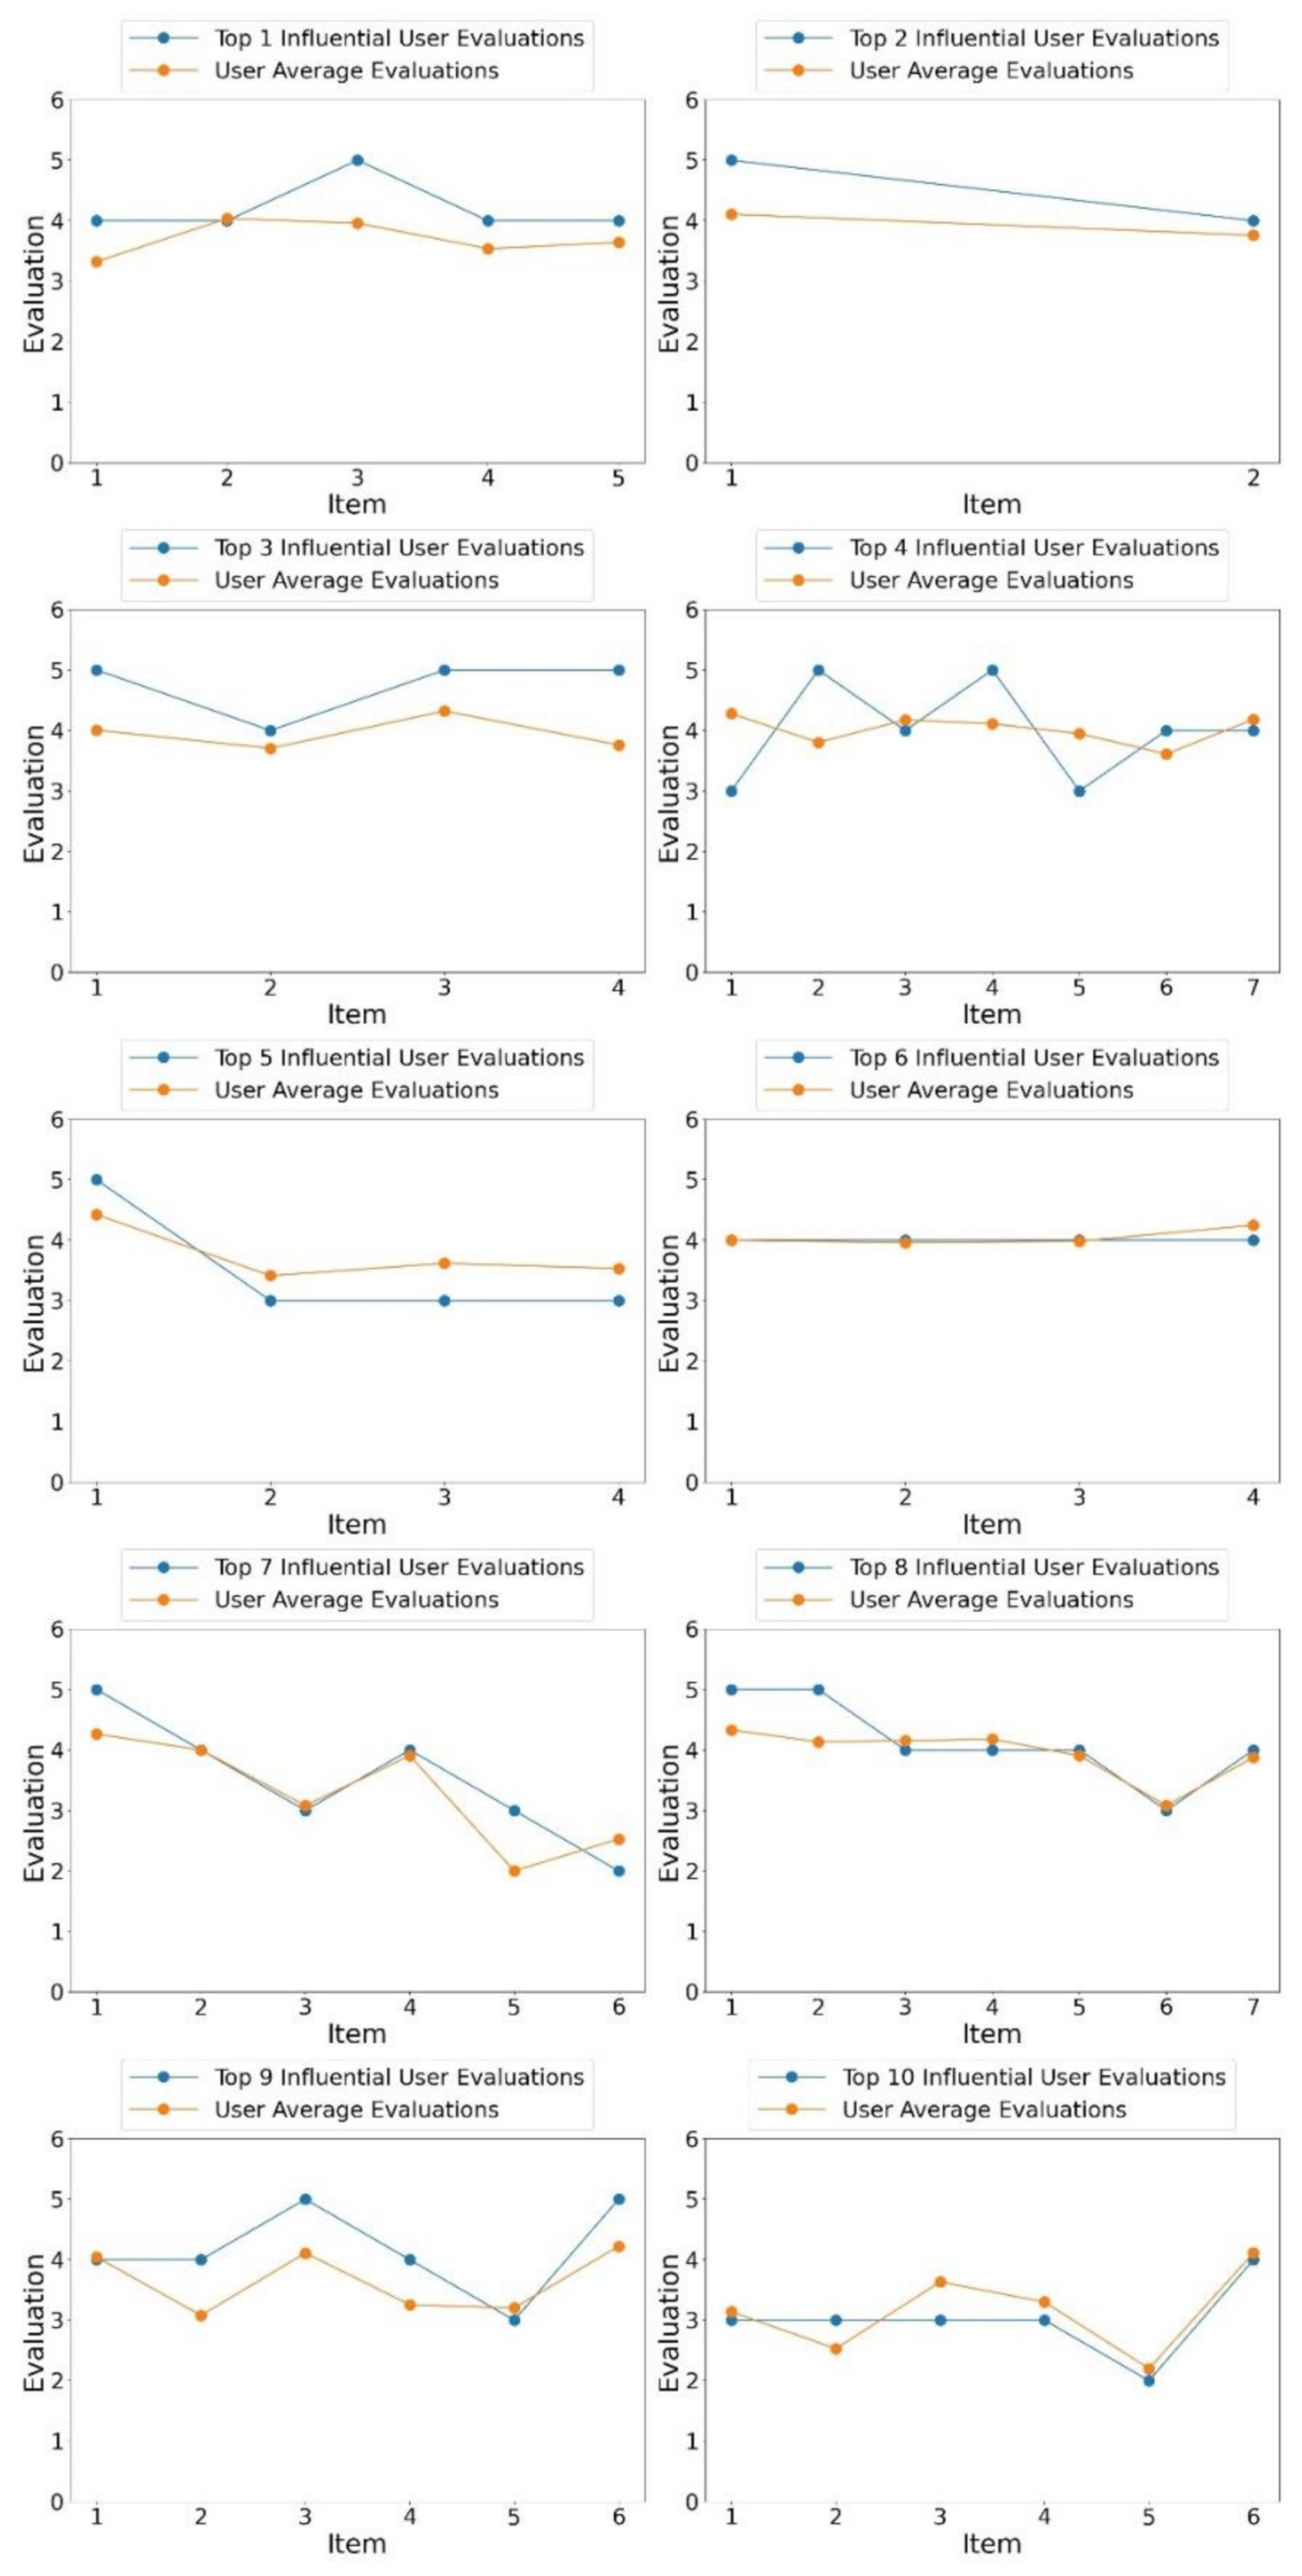
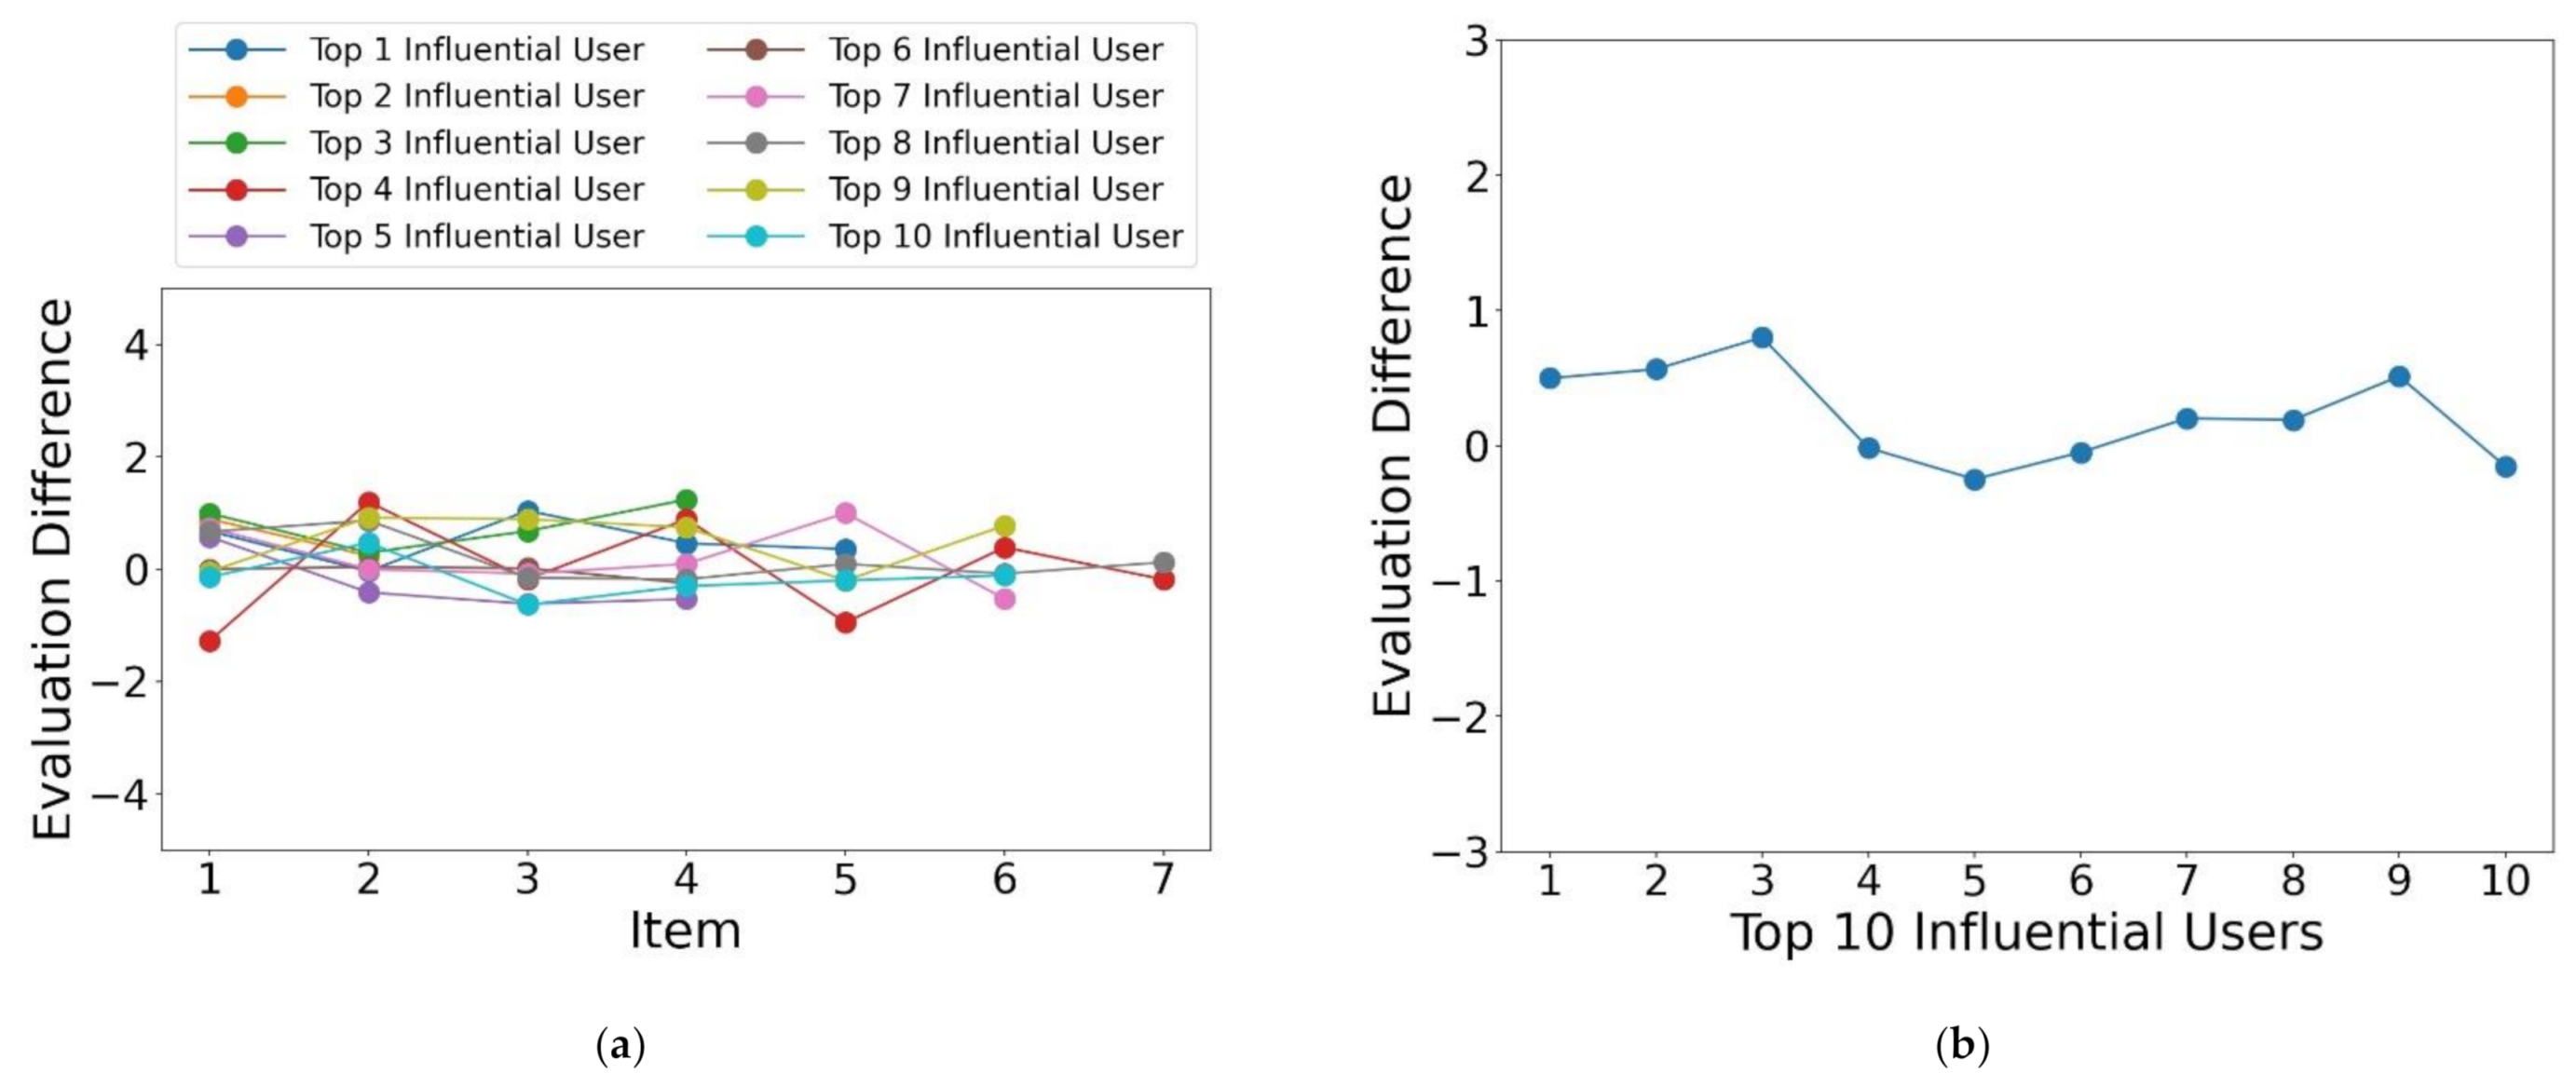
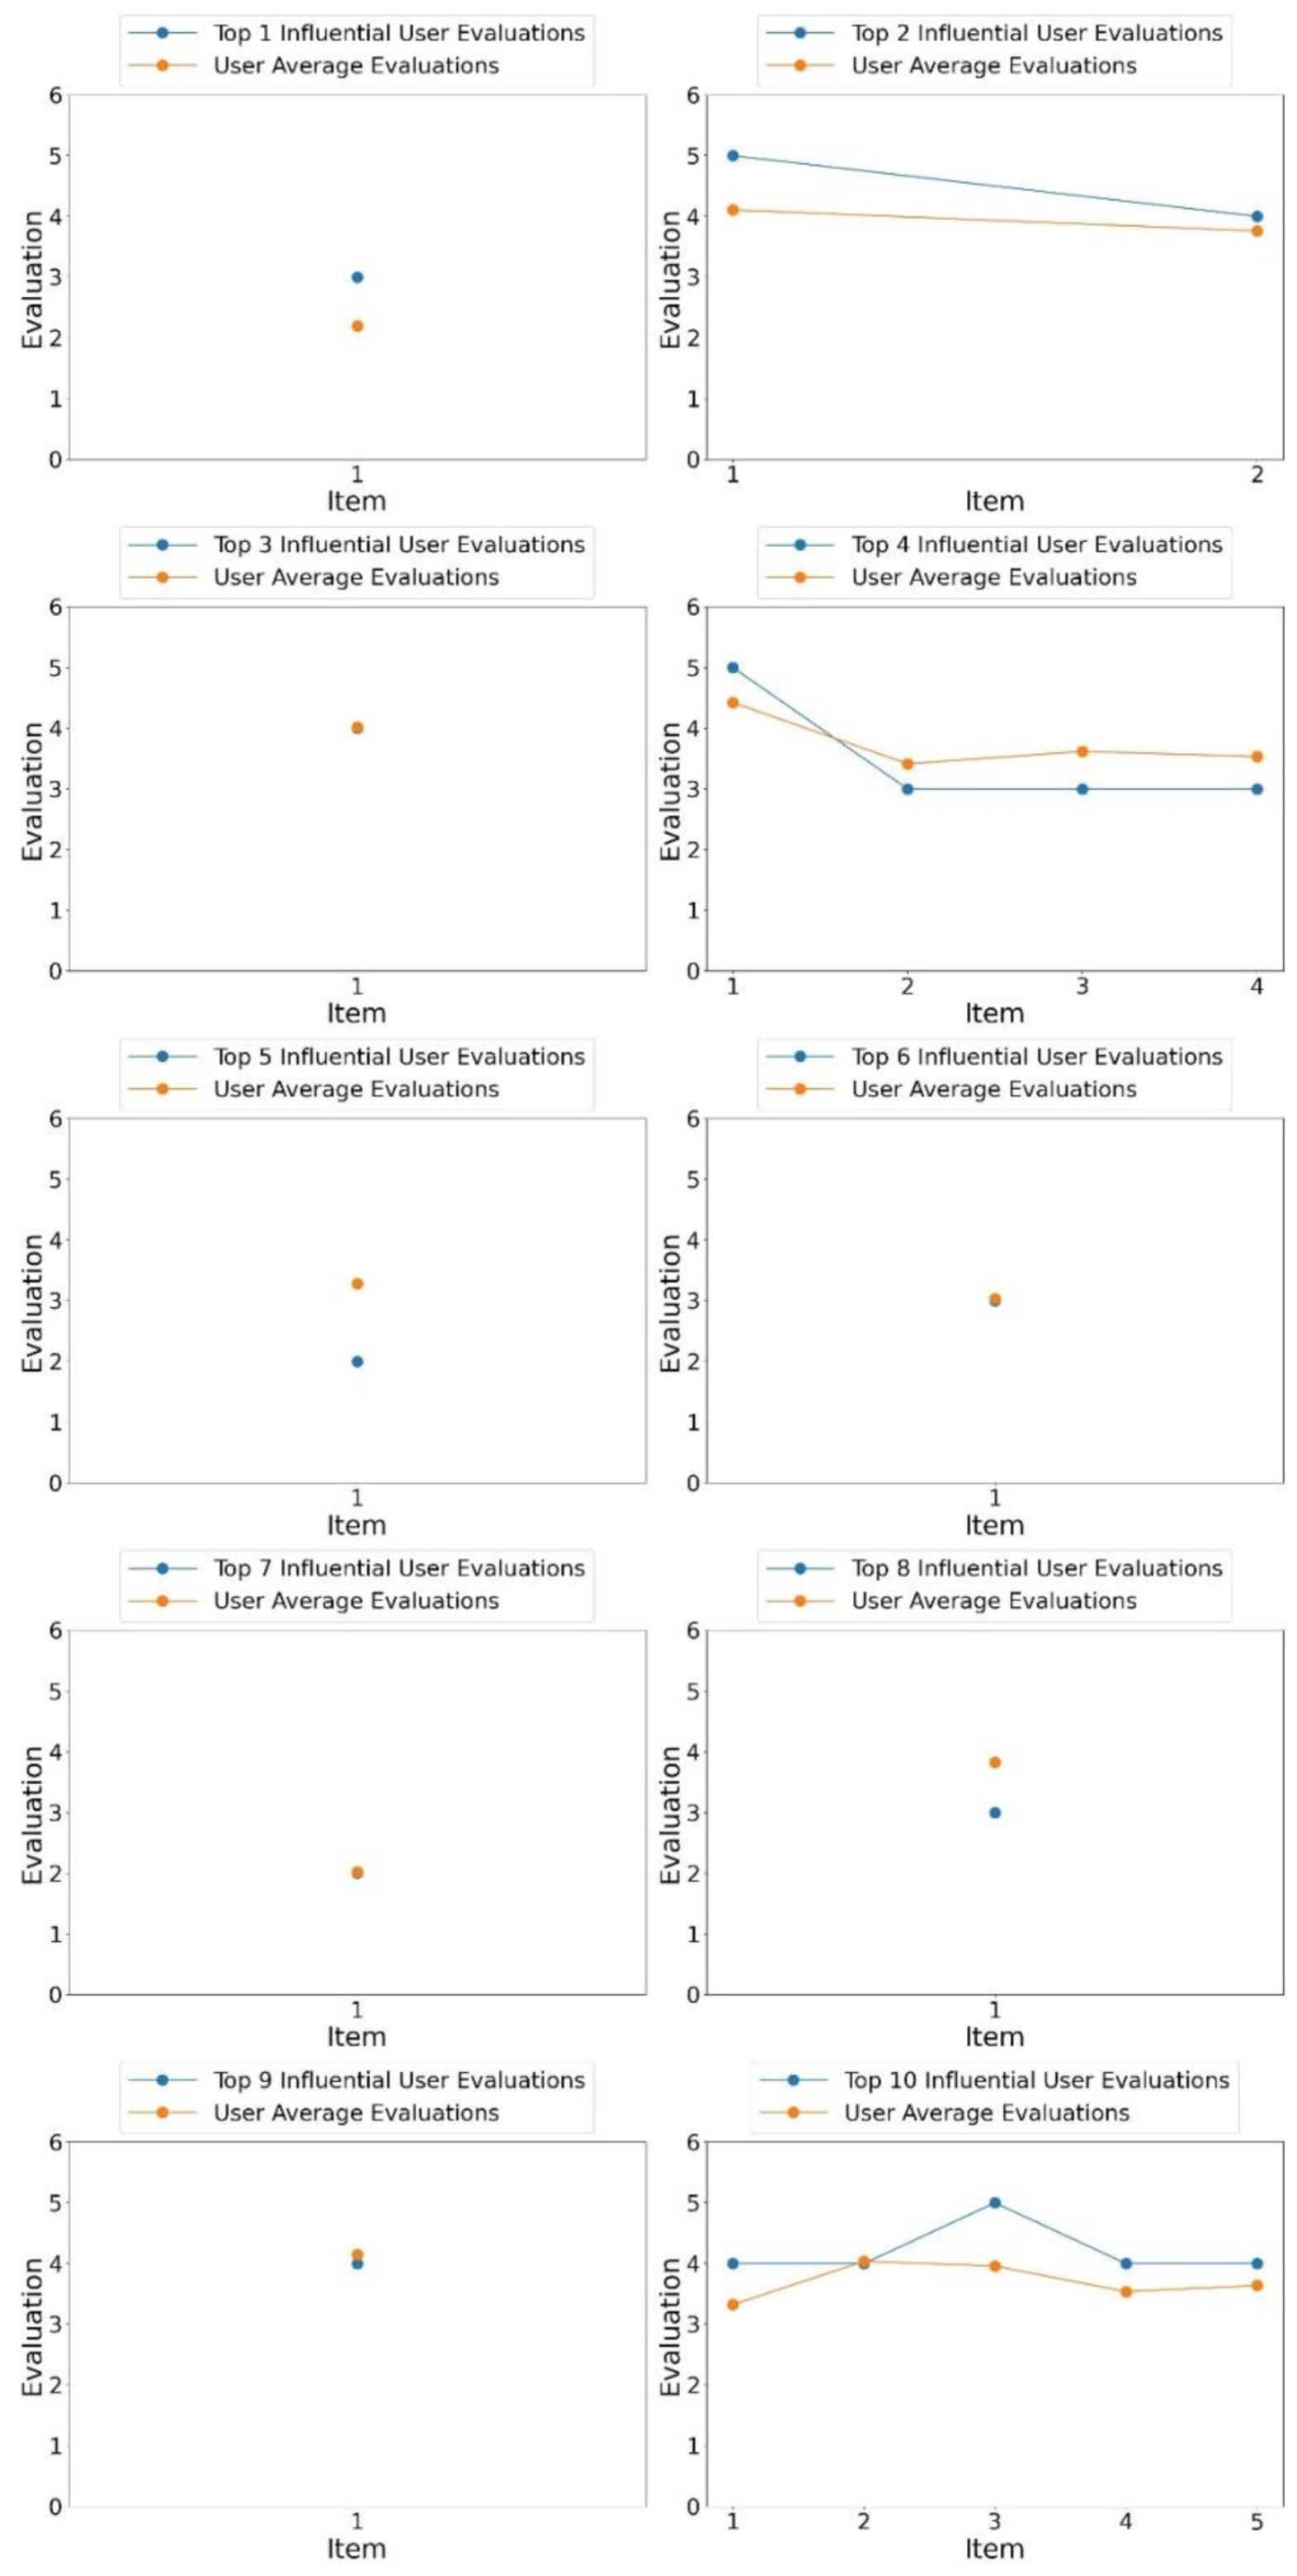
4.2. Performance Evaluation for User Influence
4.3. Performance Evaluation for User Activity
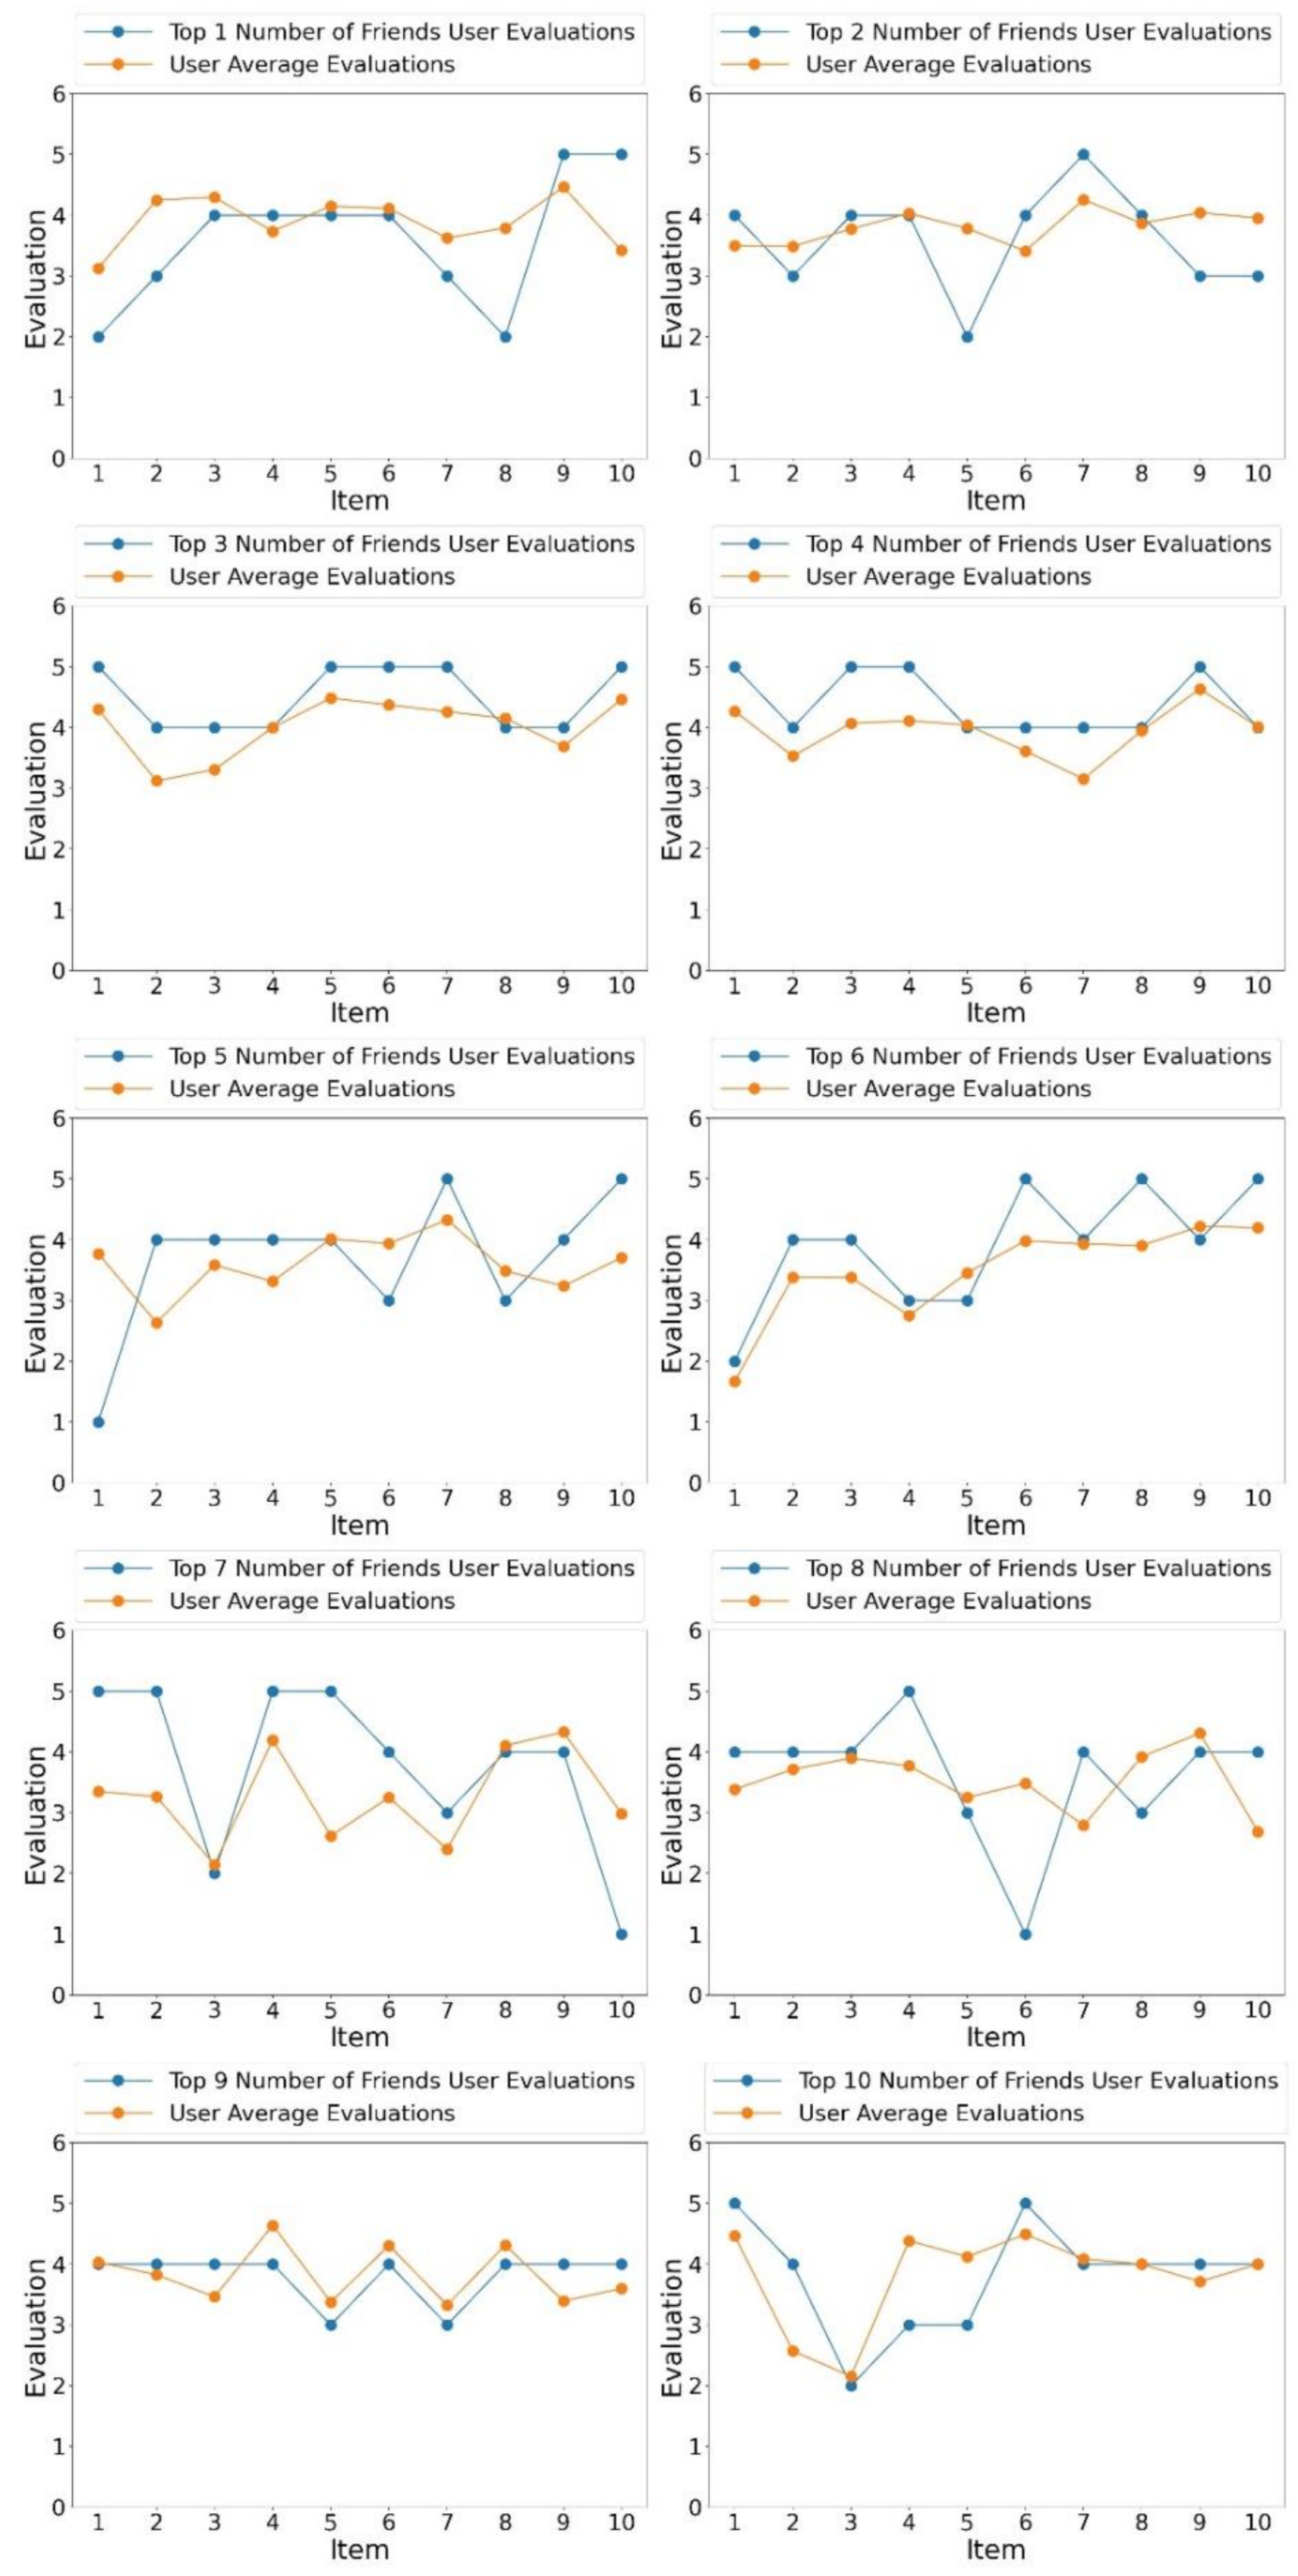
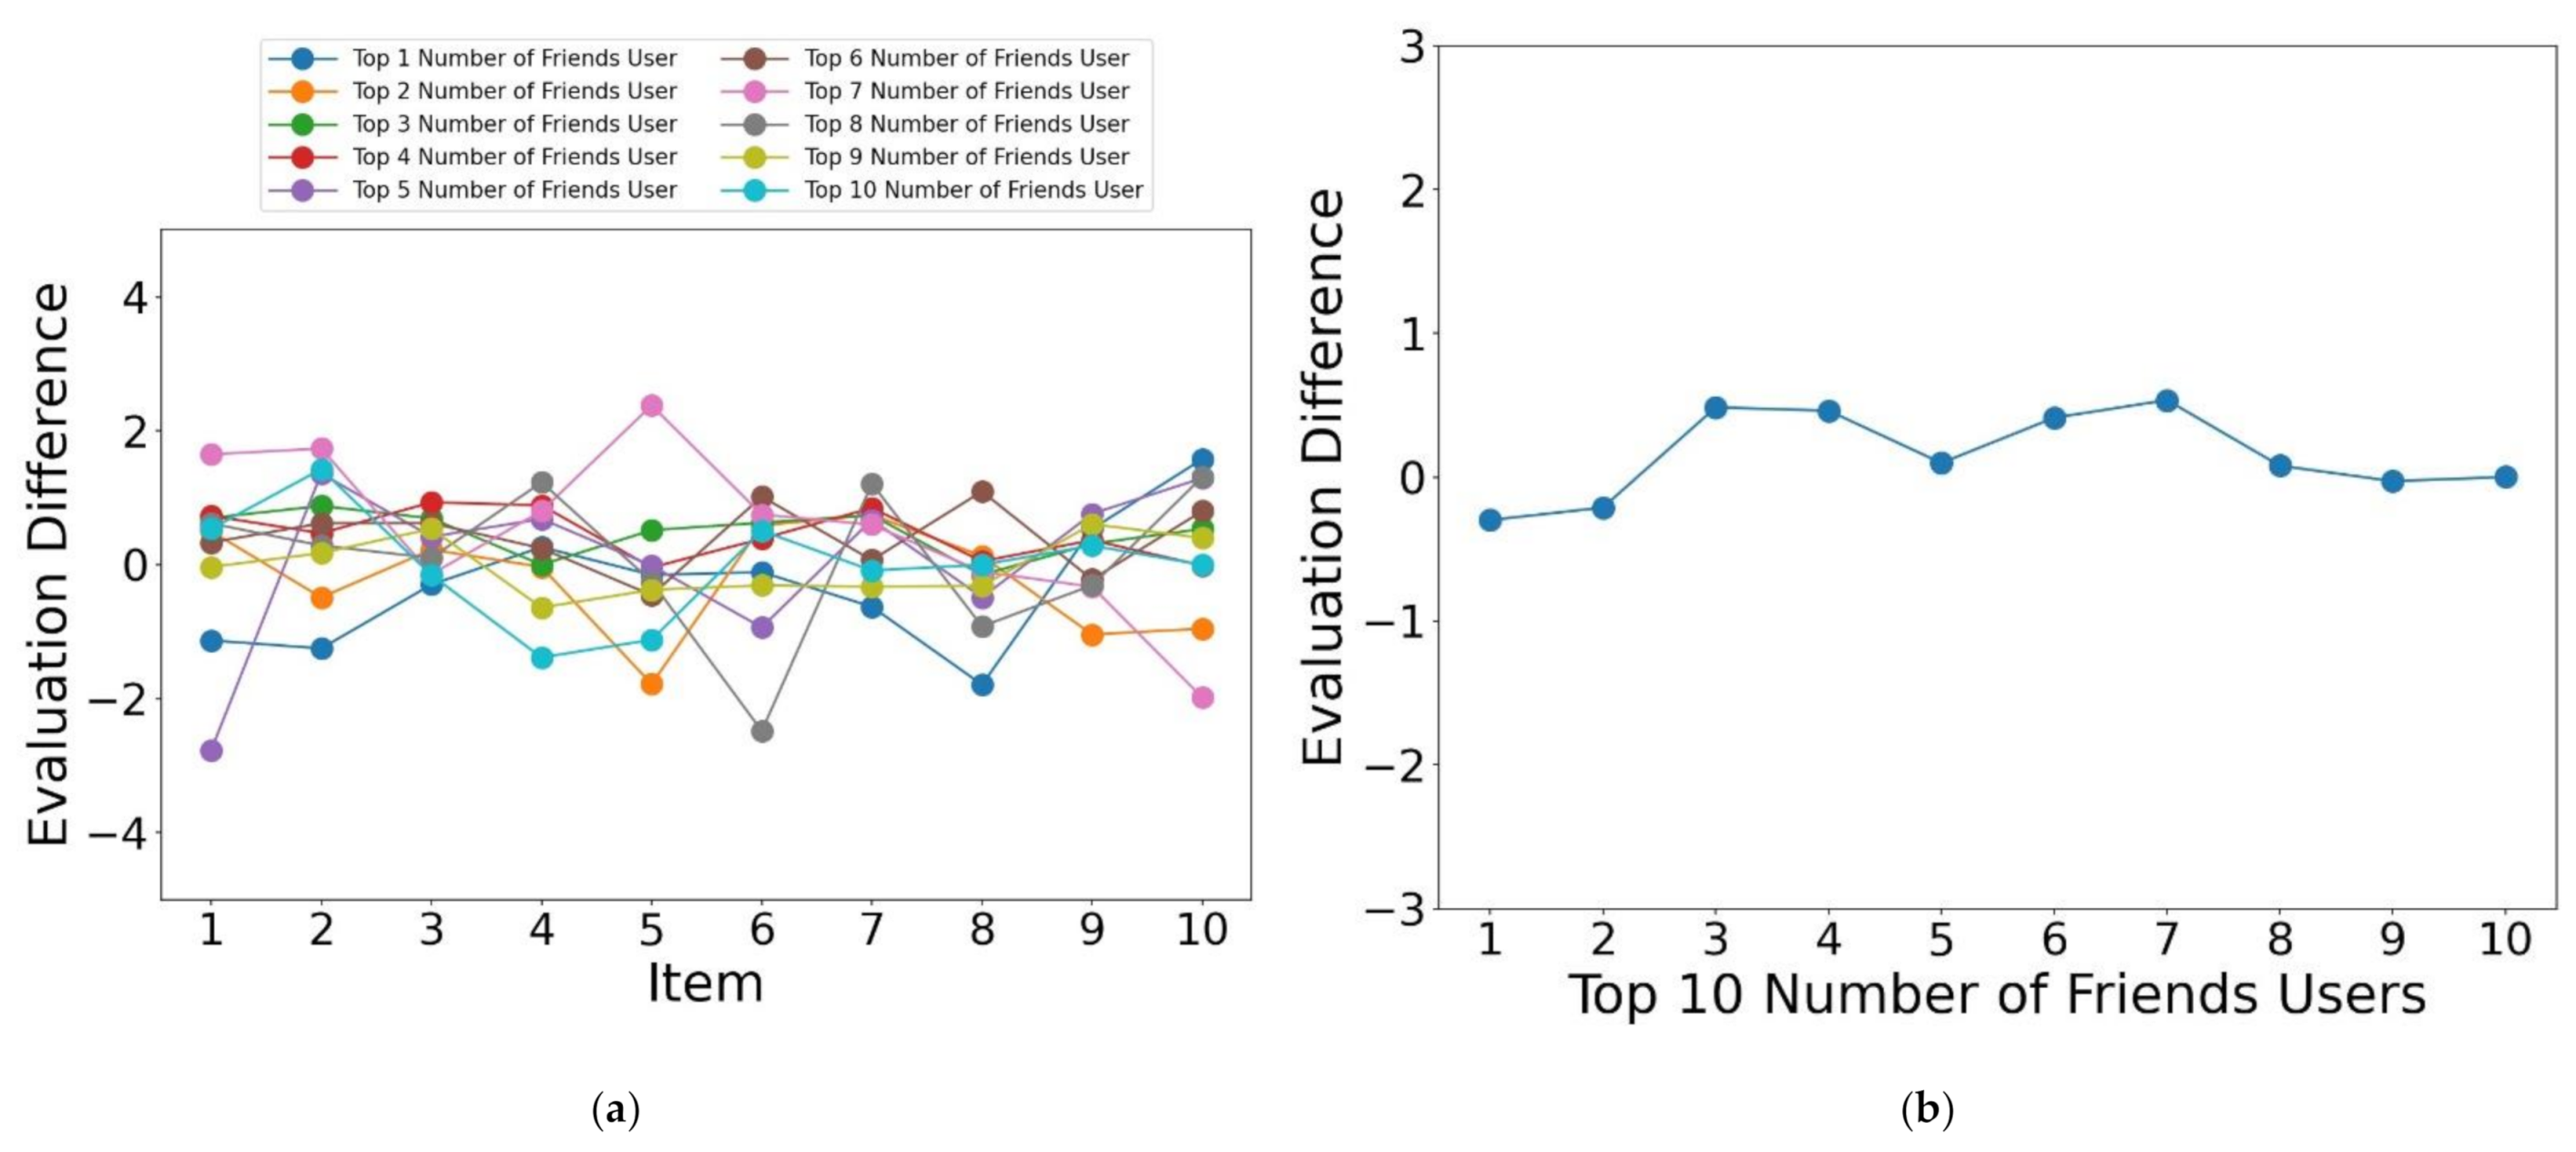
4.4. Comparison with User Friends
4.5. Analysis of the Correlations between User Influence, User Activity, and Yelp Variables
4.6. Considering Normalization of Components in User Influence, User Activity
5. Conclusions
Author Contributions
Funding
Institutional Review Board Statement
Informed Consent Statement
Data Availability Statement
Conflicts of Interest
References
- Li, Y.; Liu, J.; Ren, J. Social Recommendation Model Based on User Interaction in Complex Social Networks. PLoS ONE 2019, 14, e0218957. [Google Scholar] [CrossRef] [PubMed]
- Chen, S.; Owusu, S.; Zhou, L. Social Network Based Recommendation Systems: A Short Survey. In Proceedings of the 2013 International Conference on Social Computing, Alexandria, VA, USA, 8–14 September 2013; pp. 882–885. [Google Scholar] [CrossRef]
- Anandhan, A.; Shuib, L.; Ismail, M.A.; Mujtaba, G. Social Media Recommender Systems: Review and Open Research Issues. IEEE Access 2018, 6, 15608–15628. [Google Scholar] [CrossRef]
- King, I.; Lyu, M.R.; Ma, H. Introduction to Social Recommendation. In Proceedings of the 19th International Conference on World Wide Web—WWW ’10; ACM Press: New York, NY, USA, 2010; p. 1355. [Google Scholar] [CrossRef]
- Castillejo, E.; Almeida, A.; López-de-Ipiña, D. Social Network Analysis Applied to Recommendation Systems: Alleviating the Cold-User Problem. In Ubiquitous Computing and Ambient Intelligence; Bravo, J., López-de-Ipiña, D., Moya, F., Eds.; Springer: Berlin/Heidelberg, Germany, 2012; Volume 7656, pp. 306–313. ISBN 978-3-642-35376-5. [Google Scholar] [CrossRef]
- Burgess, E. Recommendations from Influencers Rival That of Friends. Influencer Orchestration Network (ION). Available online: https://www.ion.co/twitter-has-released-a-report-showing-consumers-seek-product-recommendations-from-influencers-almost-as-much-as-they-do-from-friends (accessed on 19 February 2021).
- Jiménez-Castillo, D.; Sánchez-Fernández, R. The Role of Digital Influencers in Brand Recommendation: Examining Their Impact on Engagement, Expected Value and Purchase Intention. Int. J. Inf. Manag. 2019, 49, 366–376. [Google Scholar] [CrossRef]
- Yelp. Available online: https://www.yelp.com/ (accessed on 1 December 2020).
- Margaris, D.; Spiliotopoulos, D.; Vassilakis, C. Social Relations versus near Neighbours: Reliable Recommenders in Limited Information Social Network Collaborative Filtering for Online Advertising. In Proceedings of the 2019 IEEE/ACM International Conference on Advances in Social Networks Analysis and Mining, Vancouver, BC, Canada, 27–30 August 2019; pp. 1160–1167. [Google Scholar] [CrossRef]
- Tang, H.X.; Qian, X. Research on Recommendation Algorithm in Social Networks. Appl. Mech. Mater. 2014, 496, 1865–1868. [Google Scholar] [CrossRef]
- Mukamakuza, C.P.; Sacharidis, D.; Werthner, H. The Impact of Social Connections in Personalization. In Proceedings of the Adjunct Publication of the 27th Conference on User Modeling, Adaptation and Personalization; ACM: New York, NY, USA, 2019; pp. 337–342. [Google Scholar] [CrossRef]
- Jiang, M.; Cui, P.; Liu, R.; Yang, Q.; Wang, F.; Zhu, W.; Yang, S. Social Contextual Recommendation. In Proceedings of the 21st ACM International Conference on Information and Knowledge Management—CIKM ’12; ACM Press: New York, NY, USA, 2012; p. 45. [Google Scholar] [CrossRef]
- Berkani, L. A Semantic and Social-based Collaborative Recommendation of Friends in Social Networks. Softw. Pract. Exp. 2020, 50, 1498–1519. [Google Scholar] [CrossRef]
- Davoodi, E.; Afsharchi, M.; Kianmehr, K. A Social Network-Based Approach to Expert Recommendation System. In Hybrid Artificial Intelligent Systems; Corchado, E., Snášel, V., Abraham, A., Woźniak, M., Graña, M., Cho, S.-B., Eds.; Springer: Berlin/Heidelberg, Germany, 2012; Volume 7208, pp. 91–102. ISBN 978-3-642-28941-5. [Google Scholar] [CrossRef]
- Berkani, L.; Belkacem, S.; Ouafi, M.; Guessoum, A. Recommendation of Users in Social Networks: A Semantic and Social Based Classification Approach. Expert Syst. 2020, e12634. [Google Scholar] [CrossRef]
- Fujiwara, Y.; Nakatsuji, M.; Yamamuro, T.; Shiokawa, H.; Onizuka, M. Efficient personalized pagerank with accuracy assurance. In Proceedings of the 18th ACM SIGKDD International Conference on Knowledge Discovery and Data Mining—KDD ’12; ACM Press: New York, NY, USA, 2012; p. 15. [Google Scholar] [CrossRef]
- Gupta, P.; Goel, A.; Lin, J.; Sharma, A.; Wang, D.; Zadeh, R. WTF: The who to follow service at Twitter. In Proceedings of the 22nd International Conference on World Wide Web—WWW ’13; ACM Press: New York, NY, USA, 2013; pp. 505–514. [Google Scholar] [CrossRef]
- Lempel, R.; Moran, S. SALSA: The stochastic approach for link-structure analysis. ACM Trans. Inf. Syst. 2001, 19, 131–160. [Google Scholar] [CrossRef]
- Fujiwara, Y.; Nakatsuji, M.; Onizuka, M.; Kitsuregawa, M. Fast and exact top-k search for random walk with restart. Proc. VLDB Endow. 2012, 5, 442–453. [Google Scholar] [CrossRef]
- Shahriari, M.; Jalili, M. Ranking Nodes in Signed Social Networks. Social Netw. Anal. Min. 2014, 4. [Google Scholar] [CrossRef]
- Amato, F.; Moscato, V.; Picariello, A.; Sperli, G. Recommendation in Social Media Networks. In Proceedings of the 2017 IEEE Third International Conference on Multimedia Big Data (BigMM), Laguna Hills, CA, USA, 19–21 April 2017; pp. 213–216. [Google Scholar] [CrossRef]
- Bao, J.; Zheng, Y.; Wilkie, D.; Mokbel, M. Recommendations in Location-Based Social Networks: A Survey. GeoInformatica 2015, 19, 525–565. [Google Scholar] [CrossRef]
- Naik, P.; Desai, P.V.; Pati, S. Location Based Place Recommendation Using Social Network. In Proceedings of the 2019 IEEE 5th International Conference for Convergence in Technology (I2CT), Bombay, India, 29–31 March 2019; pp. 1–5. [Google Scholar] [CrossRef]
- Dai, Y. A Collaborative Filtering Recommendation Algorithm Based on Time Weight. Adv. Mater. Res. 2010, 159, 667–670. [Google Scholar] [CrossRef]
- About Yelp. Available online: http://www.yelp.com/about (accessed on 1 December 2020).
- Yelp Open Dataset. Available online: https://www.yelp.com/dataset (accessed on 1 December 2020).


| Attribute | Meaning | Example Data |
|---|---|---|
| type | type info (ex.user) | “type”: “user” |
| user_id | assigned id for user | “user_id”: “4duCDxDMiRJJbc2CmnziAg” |
| name | name of user | “name”: “Douglas” |
| review_count | Total number of reviews from a certain user | “review_count”: 19 |
| average_stars | average stars from a certain user | “average_stars”: 4.2999999999999998 |
| votes | votes from other users | “votes”: {“funny”: 1, “useful”: 0, “cool”: 0} |
| friends | id of user’s friend | “friends”: [“Cg4CUfihhK4mXKo1RYhVow”, “sHGpxxBcP59Tzdd696nj_A”,] |
| elite | the year when a certain user got “elite” | “elite”: [2008, 2009, 2010, 2011]} |
| yelping_since | Signed in Yelp from when | “yelping_since”: “2010-08” |
| compliments | messages from other users | “compliments”: {“funny”: 3, “cute”: 1, “plain”: 2, “writer”: 1, “note”: 1, “…} |
| fans | the number of fans for a certain user | “fans”: 3 |
| Rank | User ID | Influence | Activity | Num Elite | Num Fans | Num Friends | Num Reviews | Recent Date |
|---|---|---|---|---|---|---|---|---|
| Top 1 | w6Vv-kldGpmvSGqXvTbAdQ | 690.19616 | 220.88925 | 6 | 1172 | 459 | 5 | 22 February 2011 |
| Top 2 | 8E0DGec8LNn6oDmPHmj-mg | 633.01554 | 73.350444 | 7 | 1072 | 422 | 2 | 8 March 2011 |
| Top 3 | spJUPXI7QaIctU0FO5c42w | 564.30388 | 72.313040 | 6 | 956 | 505 | 4 | 18 February 2011 |
| Top 4 | qbfQRHLvZk5WSkKY0l_lMw | 557.45278 | 170.21839 | 4 | 948 | 306 | 7 | 14 December 2007 |
| Top 5 | rpOyqD_893cqmDAtJLbdog | 522.11761 | 161.54219 | 10 | 877 | 527 | 4 | 15 March 2010 |
| Top 6 | DrKQzBFAvxhyjLgbPSW2Qw | 400.63439 | 108.59097 | 8 | 672 | 368 | 4 | 20 January 2009 |
| Top 7 | mFOZOsPQOacWIMVSyXbEbg | 344.03795 | 187.33503 | 8 | 575 | 256 | 6 | 1 November 2012 |
| Top 8 | nrOCJCQUgXwdUIwg8QHirw | 340.25130 | 235.14995 | 6 | 572 | 271 | 7 | 26 January 2013 |
| Top 9 | LbgQK5B_5IkN77FgRJHhrg | 339.59576 | 131.90147 | 7 | 569 | 185 | 6 | 30 October 2013 |
| Top 10 | vyfsQo-estP8EfiIFMsL6g | 338.85608 | 252.19245 | 8 | 566 | 98 | 6 | 22 May 2013 |
| Low 5 | wUXSmppXrGdztyKwz5b_Ng | 0.0 | 2.83789 × 10−36 | 0 | 0 | 0 | 2 | 8 August 2009 |
| Low 4 | itUTDvrHwmxU_C0P8x9sdw | 0.0 | 4.48535 × 10−39 | 0 | 0 | 3 | 1 | 1 April 2009 |
| Low 3 | 6J4Oh-Lq2loLV5apkFJwTg | 0.0 | 4.48535 × 10−39 | 0 | 0 | 1 | 1 | 1 April 2009 |
| Low 2 | hyJ87UjROEtL-nbKSew_Ow | 0.0 | 1.05758 × 10−41 | 0 | 0 | 0 | 1 | 1 December 2008 |
| Low 1 | t5Xb5GY1QLj7Iy7vugO4bg | 0.0 | 1.50334 × 10−61 | 0 | 0 | 0 | 1 | 1 June 2006 |
| Rank | User ID | Activity | Influence | Num Elite | Num Fans | Num Friends | Num Reviews | Recent Date |
|---|---|---|---|---|---|---|---|---|
| Top 1 | kGgAARL2UmvCcTRfiscjug | 10,832.10917 | 85.14843 | 1 | 143 | 632 | 301 | 11 December 2013 |
| Top 2 | DrWLhrK8WMZf7Jb-Oqc7ww | 10,337.21580 | 7.18467 | 0 | 11 | 20 | 323 | 27 January 2014 |
| Top 3 | 0bNXP9quoJEgyVZu9ipGgQ | 7282.89702 | 74.09587 | 7 | 114 | 344 | 417 | 27 November 2013 |
| Top 4 | C6IOtaaYdLIT5fWd7ZYIuA | 4794.69461 | 36.28776 | 7 | 49 | 709 | 339 | 5 January 2014 |
| Top 5 | pEVf8GRshP9HUkSpizc9LA | 4733.53982 | 34.25725 | 5 | 49 | 46 | 287 | 1 December 2013 |
| Top 6 | q9XgOylNsSbqZqF_SO3-OQ | 4429.29002 | 36.26023 | 7 | 49 | 403 | 269 | 22 January 2014 |
| Top 7 | HOleI3jz1MLNUJ6cc1x0Pw | 4227.67528 | 22.42461 | 6 | 27 | 252 | 147 | 21 November 2013 |
| Top 8 | exefpuK6O1ctUUqTxq5XLg | 3954.32938 | 4.79183 | 0 | 7 | 13 | 158 | 24 January 2014 |
| Top 9 | wHg1YkCzdZq9WBJOTRgxHQ | 3522.54059 | 30.31668 | 7 | 39 | 168 | 212 | 8 January 2014 |
| Top 10 | kJyR4gT1pfCcNjEY9-YMoQ | 3288.75576 | 2.16633 | 0 | 2 | 14 | 168 | 21 January 2014 |
| Low 5 | vCbrHCnLgTEccWpMcgFiRQ | 5.03457 × 10−45 | 0.5 | 0 | 0 | 1 | 1 | 1 July 2008 |
| Low 4 | wqPaSfr7teGzs-w3N1CO7g | 2.38432 × 10−46 | 0.4375 | 0 | 0 | 0 | 1 | 1 May 2008 |
| Low 3 | p5FcpR2d8u58rbTCDQQ1nw | 7.95725 × 10−48 | 0.16666 | 0 | 0 | 0 | 2 | 23 February 2008 |
| Low 2 | M1JCxPUKplK8j09AIiLcfg | 6.70276 × 10−59 | 1.58316 | 0 | 1 | 1 | 1 | 1 October 2006 |
| Low 1 | t5Xb5GY1QLj7Iy7vugO4bg | 1.50334 × 10−61 | 0.0 | 0 | 0 | 0 | 1 | 1 June 2006 |
| Concept | Influence | Activity | Num Elite | Num Fans | Num Friends | Num Reviews | Recent Date |
|---|---|---|---|---|---|---|---|
| Influence | 1 | 0.141479 | 0.485973 | 0.993308 | 0.4809687 | 0.14866026 | −0.09194966 |
| Activity | 0.141479 | 1 | 0.24435 | 0.119344 | 0.35697629 | 0.70084475 | 0.14612793 |
| Concept | Influence | Activity | Num Elite | Num Fans | Num Friends | Num Reviews | Recent Date |
|---|---|---|---|---|---|---|---|
| Influence | 1 | −0.0389 | 0.3599 | 0.1643 | 0.1481 | 0.1039 | −0.2211 |
| Activity | −0.0389 | 1 | 0.0472 | 0.0132 | 0.1057 | 0.3048 | 0.1390 |
Publisher’s Note: MDPI stays neutral with regard to jurisdictional claims in published maps and institutional affiliations. |
© 2021 by the authors. Licensee MDPI, Basel, Switzerland. This article is an open access article distributed under the terms and conditions of the Creative Commons Attribution (CC BY) license (http://creativecommons.org/licenses/by/4.0/).
Share and Cite
Lee, M.; Oh, S. An Information Recommendation Technique Based on Influence and Activeness of Users in Social Networks. Appl. Sci. 2021, 11, 2530. https://doi.org/10.3390/app11062530
Lee M, Oh S. An Information Recommendation Technique Based on Influence and Activeness of Users in Social Networks. Applied Sciences. 2021; 11(6):2530. https://doi.org/10.3390/app11062530
Chicago/Turabian StyleLee, Minsoo, and Soyeon Oh. 2021. "An Information Recommendation Technique Based on Influence and Activeness of Users in Social Networks" Applied Sciences 11, no. 6: 2530. https://doi.org/10.3390/app11062530
APA StyleLee, M., & Oh, S. (2021). An Information Recommendation Technique Based on Influence and Activeness of Users in Social Networks. Applied Sciences, 11(6), 2530. https://doi.org/10.3390/app11062530