Abstract
It is essential to understand the voice characteristics in the normal aging process to accurately distinguish presbyphonia from neurological voice disorders. This study developed the best ensemble-based machine learning classifier that could distinguish hypokinetic dysarthria from presbyphonia using classification and regression tree (CART), random forest, gradient boosting algorithm (GBM), and XGBoost and compared the prediction performance of models. The subjects of this study were 76 elderly patients diagnosed with hypokinetic dysarthria and 174 patients with presbyopia. This study developed prediction models for distinguishing hypokinetic dysarthria from presbyphonia by using CART, GBM, XGBoost, and random forest and compared the accuracy, sensitivity, and specificity of the development models to identify the prediction performance of them. The results of this study showed that random forest had the best prediction performance when it was tested with the test dataset (accuracy = 0.83, sensitivity = 0.90, and specificity = 0.80, and area under the curve (AUC) = 0.85). The main predictors for detecting hypokinetic dysarthria were Cepstral peak prominence (CPP), jitter, shimmer, L/H ratio, L/H ratio_SD, CPP max (dB), CPP min (dB), and CPPF0 in the order of magnitude. Among them, CPP was the most important predictor for identifying hypokinetic dysarthria.
1. Introduction
When people get old, they experience vocal aging due to the malfunction of the respiratory system and the vocal system [1]. It is defined as presbyphonia in otorhinolaryngology [1]. Presbyphonia generally shows symptoms such as hoarse, weak, or a trembling voice due to the atrophy or loss of elasticity of the vocal cord muscles in the aging process [2]. These symptoms are similar to the major vocal symptoms of early Parkinson’s disease as known as hypokinetic dysarthria that are caused by damage to the nervous system [2]. Hypokinetic dysarthria is characterized perceptually by varying degrees of reduced loudness, breathy voice, short rushes of speech, and reduced pitch variation [1,2,3]. However, presbyphonia can be distinguished from neurological voice disorders such as dysarthria in view of the fact that presbyphonia is not a voice disorder. Therefore, it is essential to understand the voice characteristics in the normal aging process to accurately distinguish presbyphonia from neurological voice disorders.
Previous studies that analyzed the characteristics of presbyphonia over the past 20 years can be divided into studies that identified subjective voice problems through a self-administered questionnaire [3,4], and acoustic phonetic studies that recorded and analyzed the voices of subjects by gender and age [5]. In particular, the acoustic phonetic studies on presbyphonia have focused on the results of tracking the cycle boundaries of the vocal cords over time using Spectrum, a frequency-based analysis in sustained vowel phonation tasks [6,7,8].
More recent studies have widely used acoustical analyses such as Cepstral measures to objectively evaluate connected speech [9]. Cepstral measure is a terminology derived from Spectral measure: it is a second frequency Spectrum that is estimated by conducting the inverse Fourier transform after taking a log of the Spectrum G of the function G(t) in the time domain. Cepstral indices (e.g., Cepstral peak prominence (CPP) and Cepstral Spectral Index of Dysphonia (CSID)) can analyze aperiodic voice signals and periodic voice signals, unlike Spectrum indices (e.g., Jitter and Shimmer) [10]. In other words, it has the advantage of analyzing connected speech (dialogue) reflecting the speech characteristics of actual subject acoustically and sustained vowel phonation tasks for analyzing voice characteristics [11,12].
Until now, most of the acoustic studies that analyzed presbyphonia using Spectrum analysis and Cepstral analysis have evaluated the sustained phonation of single vowel [13,14,15], and only a few studies examined connected speech [16,17]. Furthermore, in terms of methodology, even the previous studies [12,16] that analyzed connected speech using Cepstral analysis just identified the differences in measurements (e.g., CPP and CSID) by age and gender based on analysis of variance (ANOVA), multivariate analysis of variance (MANOVA), generalized linear model (GLM), and t-test by collecting the voice data of subjects.
On the other hand, ensemble-based machine learning methods such as random forest and gradient boosting algorithm (GBM) have been widely used as data mining algorithms for developing disease prediction models in recent years [18,19,20]. Ensemble-based machine learning can reduce prediction errors by increasing randomness to the maximum, and it has the advantage of being able to analyze big data that is difficult to handle with traditional statistical analysis such as GLM [21]. Nevertheless, studies on hypokinetic dysarthria caused by Parkinson’s disease have mainly relied on GLM [22], and only a few studies have used ensemble-based machine learning algorithms. This study developed the best ensemble-based machine learning classifier that could distinguish hypokinetic dysarthria from presbyphonia using classification and regression tree (CART), random forest, GBM, and XGBoost and compared the prediction performance of models.
2. Materials and Methods
2.1. Subjects
This study targeted 76 elderly people aged between 65 and 80 years old (30 males and 46 females) diagnosed with hypokinetic dysarthria at rehabilitation hospitals in Seoul and Incheon and 174 healthy elderly people aged between 65 and 80 years old (93 males and 81 females) with presbyphonia residing in Seoul and Incheon. In this study, the presbyphonia was defined as a healthy control group without laryngeal disease. This study was approved by the Institutional Review Board of HN University in Korea (No. 1041223-201812-HR-26). The selection criteria for the elderly with presbyphonia were: (1) those who did not have a voice disorder in the GRBAS (grade, roughness, breathiness, asthenia, strain) scale, an auditory-perceptual assessment method, (2) those who did not have an upper respiratory infection for the last one month, (3) those who did not undergo surgery due to a neurological disease, (4) those who had five or less in the Geriatric Depression Scale Short Form Korea Version (GDSSF-K) and were determined not to have depression, (5) those who satisfied the definition of presbyphonia because they had clinical symptoms such as weakened voice, limited pitch and loudness, reduced phonation time, breathiness, hoarseness, and/or roughness according to Kendall [23].
2.2. Data Collection
Voice samples were collected in a noise-controlled laboratory. Voice was recorded using a microphone (D7 Vocal., AKG, Vienna, Austria) fixed at a 90-degree angle installed at 10 cm away from the mouth. Sustained vowels and connected speech were recorded at a sampling rate of 44.1 kHz with 16-bit quantization for each sample using the Analysis of Dysphonia in Speech and Voice (ADSV; Model 5109, Kay Pentax Medical, Montvale, NJ, USA). Sustained vowel phonation tasks were conducted by analyzing the phonation of /a/ vowel in Korean for more than three seconds. We analyzed two seconds of the interval except for 50 ms at the beginning and end of the vocal sample. The mean of three measurements computed averaging over three separate vowel recordings. Connected speech was collected by using “kaɯl [24]”, a standardized paragraph test. Cepstral measures were obtained from the first sentence of the “kaɯl [24]” paragraph using a Fourier analysis in the ADSV software. This sentence (“urinarae kaɯrɯn tsʰamɯro arɯmdap̚t̕a”) consists of 15 syllables. The intervals (pause) above 200 ms were excluded from the analysis.
2.3. Definition of Variables
The outcome variable was the prevalence of hypokinetic dysarthria. Explanatory variables were age, gender, years of education, current smoking status, current drinking status, CPP (dB), low-high Spectral ratio (L/H ratio, dB), L/H ratio_standard deviation (SD), L/H ratio max (dB), L/H ratio Min (dB), CPP fundamental frequency (CPP F0, Hz), CSID, CPP Max (dB), CPP min (dB), mean CPP F0 (Hz), and mean CPP F0 SD (Hz). The definitions of Cepstral and Spectral measures [25] are presented in Table 1.

Table 1.
The definitions of Cepstral and Spectral measures.
2.4. Development and Performance Evaluation of the Prediction Model
This study developed prediction models for distinguishing hypokinetic dysarthria from presbyphonia by using CART, GBM, XGBoost, and random forest and compared the area under the curve (AUC), accuracy, sensitivity, and specificity of the development models to identify the prediction performance of them. The collected data were randomly divided into a training dataset (70%) and a test dataset (30%). A 5-fold cross-validation (CV) was performed only on the training data, and the test dataset was used to evaluate the prediction performance. The ensemble algorithm contains randomness, and models were developed by setting the seed to 123456789. The prediction performance of models was compared using the AUC, accuracy, sensitivity, and specificity of each model. The AUC summarizes the entire location of the receiver operating characteristic (ROC) curve rather than depending on a specific operating point. The closer the AUC value is to 1, the better the predictive power of the model. Accuracy indicates the percentage (OR proportion) of the subjects successfully predicted by each model. Sensitivity is the percentage of the true positives out of all the samples, while specificity means the percentage of the true negatives. This study defined the model with the best prediction performance as a model showing the highest accuracy and AUC while sensitivity and specificity values were 0.7 or higher, and chose it as the final model to predict hypokinetic dysarthria. All analyses were performed using the package (xgboost, randomForest, gbm, rpart, and tree) in R version 3.5.1 (Foundation for Statistical Computing, Vienna, Austria). The package can be downloaded from the web (https://cran.r-project.org/web/packages/; accessed date: 1 March 2021).
2.5. Sampling for Processing Imbalanced Data
Disease data generally have an imbalance issue because the number of healthy people is larger than that of sick people. This study also had an imbalance issue because 69.6% of the subjects had presbyphonia without hypokinetic dysarthria, while only 30.4% of the subjects had hypokinetic dysarthria. This study used the synthetic minority oversampling technique (SMOTE) [26] to solve this imbalance issue. SMOTE is a method to compensate for overfitting, the disadvantage of oversampling. This method randomly selects a minor class among the classes of the response variable, and finds k nearest neighbors of the data. Then, the differences between the selected sample and k neighbors were calculated and a random value between 0 and 1 was multiplied with them. The calculated value was added to the existing samples and the training dataset. Finally, this process is repeated. Although SMOTE is similar to oversampling in the aspect that it increases the data size of a minor class, it is known that it can overcome the overfitting issue of oversampling by creating new samples by appropriately combining existing data rather than replicating the same data.
2.6. CART
CART is an algorithm that carries out multiway split using the chi-square test (when a target variable is categorical) or F-test (when a target variable is continuous). When a target variable is categorical, Pearson’s chi-squared statistic or likelihood ratio chi-square statistic is used as the separation criterion. When a target variable is ordinal, the likelihood ratio chi-square statistic is used.
2.7. Random Forest
Random forest is an ensemble technique that generates multiple decision trees using bootstrap samples and predicts by putting models together [27]. This algorithm has the advantage of increasing the diversity of decision trees because it repeats the process of randomly selecting several variables [28]. Decision trees present each node with the partition showing the most optimal results by using all variables. However, unlike decision tree, random forest randomly selects explanatory variables when presenting each node and uses the method providing the most optimal results among the selected sets of explanatory variables. Since random forest uses bootstrap samples, it has the advantage of being able to use out of bag (OOB) samples [28,29]. The importance of variables is calculated using permutation [30]. Random forest has the advantage of reducing variance, compared to the bagging method, by decreasing the correlation between trees. Moreover, it shows more accurate results than other existing algorithms and is good at finding important variables in big data because it can use thousands of independent variables without removing variables [29]. This study set the number of trees of the random forest model to 500. The concept of random forest is presented in Figure 1 [31].
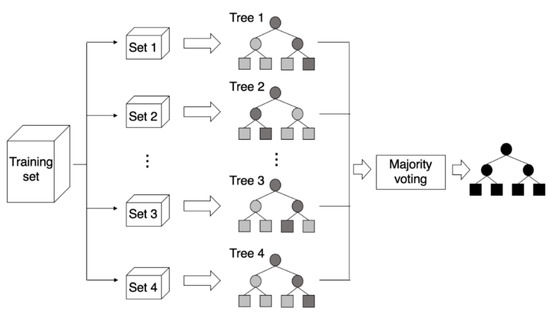
Figure 1.
The concept of random forest, source: Yim [31].
2.8. GBM
GBM is an ensemble machine learning algorithm that generates models at each step, optimizes a loss function that can randomly differentiate them, and generalizes the models. In machine learning, boosting refers to a method of creating a strong learner by combining weak learners [32]. It generates models, even if the accuracy of them is low, and the errors of the generated model are compensated by the following model. The basic principle is to generate a more accurate model through this process and increase accuracy by repeating this process. The concept of GBM is presented in Figure 2 [33] and Figure 3.
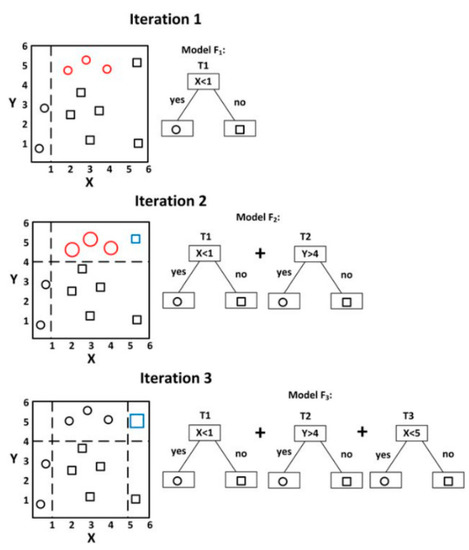
Figure 2.
Example of visualizing gradient boosting, source: Zhang et al. [33].
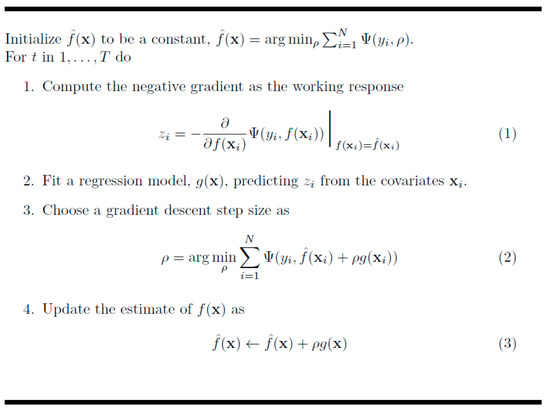
Figure 3.
Algorithm of the gradient boosting model.
2.9. XGBoost
XGBoost is a boosting algorithm that makes the next model use misclassified observations more when producing trees [34]. In other words, it is trained to further improve the performance for misclassified observations. XGBoost has the advantage in the fast calculation process because it uses parallel computing that is used by all CPU cores while learning and it is very useful because it supports various programming languages such as Python and the R program [35]. The concept of XGBoost is presented in Figure 4 [36].
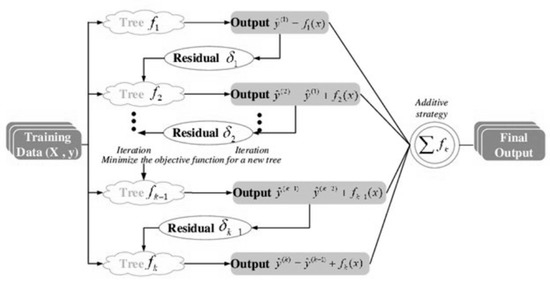
Figure 4.
The concept of XGBoost, source: Cheng et al. [36].
3. Results
3.1. Comparison of the Accuracy, Sensitivity, and Specificity of Ensemble Learning-Based Prediction Models
Table 2 shows the comparison of the accuracy, sensitivity, and specificity of the ensemble learning-based prediction model for identifying hypokinetic dysarthria. The results of this study showed that random forest had the best prediction performance when it was tested with the test dataset (accuracy = 0.83, sensitivity = 0.90, and specificity = 0.80, and AUC = 0.85).

Table 2.
The comparison of the accuracy, sensitivity, specificity, and AUC of the ensemble learning-based prediction model for identifying hypokinetic dysarthria.
3.2. Key Predictors of the Final Model
The importance of variables of the random forest-based prediction model, the final model, is presented in Figure 5. The main predictors for detecting hypokinetic dysarthria were CPP, jitter, shimmer, L/H ratio, L/H ratio_SD, CPP max (dB), CPP min (dB), and CPPF0 in the order of magnitude. Among them, CPP was the most important predictor for identifying hypokinetic dysarthria. Figure 6 shows the error graph when each prediction model was made with 500 bootstrap samples. The error of the developed random forest model was 0.16 and the prediction rate was 83.8%.
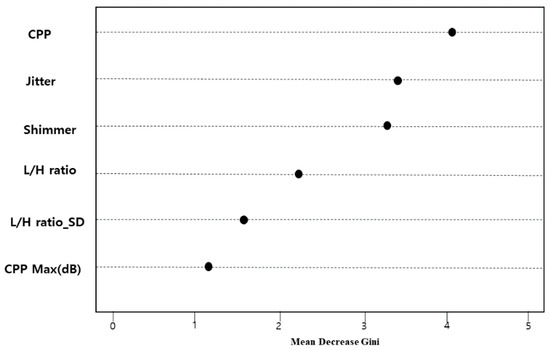
Figure 5.
Importance of variables for identifying hypokinetic dysarthria (presenting only the top six variables).
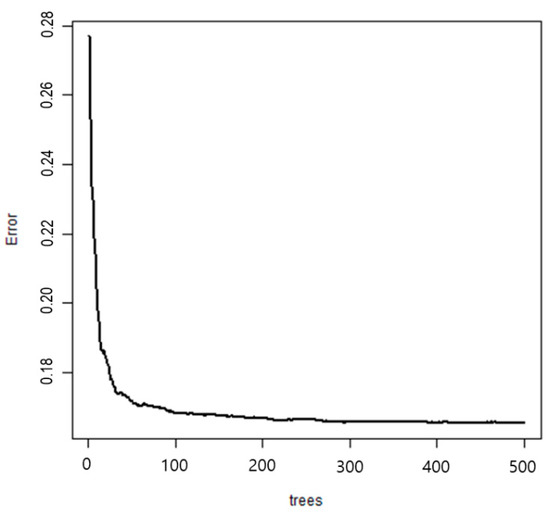
Figure 6.
Error graphs of random forest.
4. Discussion
It is important to accurately distinguish presbyphonia from neurological voice disorders because presbyphonia has similar voice characteristics to hypokinetic dysarthria caused by Parkinson’s disease. This study developed a classifier that distinguishes hypokinetic dysarthria from presbyphonia using ensemble machine learning algorithms. This study compared the prediction performance of GBM, XGBoost, random forest, and CART to find that the accuracy of random forests was the highest. It is believed that random forest showed higher accuracy than CART because the former was based on a bagging algorithm that generated various decision trees from 500 bootstrap samples [37,38]. CART has the limitation that the variance of the model is large because, although it has a small bias, the structure of the tree model changes greatly depending on the first split variable. In other words, if n data are split n−1 times, only one value is included in each area. The large tree model created in this way is generally more likely to cause an overfitting problem [39,40]. On the other hand, bagging tree is a tree model made by bootstrap samples, and it has the advantage of minimizing bias and effectively reducing the variance of the model. Since random forest effectively reduces the correlation of each tree model through an algorithm that gives randomness in the growing process of the bagging tree, it is believed to have higher prediction power than CART [39]. However, further studies are needed to explain why the accuracy of random forest is higher than that of GBM and XGBoost, other ensemble algorithms. The results of this study revealed that the sensitivity of XGBoost was higher than that of random forest while sensitivity indicated the percentage of true positives. Therefore, future studies are necessary to compare prediction performance by estimating diverse evaluation methods, such as sensitivity, specificity, and weight harmonic average, suitable for the analysis objective, rather than using one performance index such as accuracy.
Another key finding of this study was that CPP, one of the Cepstral indices, was the most important predictor for identifying hypokinetic dysarthria in the developed prediction model including sociodemographic factors, health behavior, and acoustic–phonetic indices. Although acoustic–phonetic characteristics, such as loudness, were generally reported as important characteristics for distinguishing hypokinetic dysarthria from other disorders [41,42], studies on pitch and quality showed inconsistent results [43,44]. Previous studies [41,42] that analyzed the voice of patients with Parkinson’s disease using Spectrum showed that the increase of shimmer and jitter, decreased maximum phonation time (MPT) and harmonic-to-noise ratio (HNR), and a decrease of F0 variability were important acoustic diagnostic indices of Parkinson’s disease. However, some studies reported results contradictory to Holmes et al. [41] and Jiménez-Jiménez et al. [42]. Santos et al. [43] reported that acoustic measurements (e.g., F0, shimmer, jitter, and HNR) were significantly different between the control group and the Parkinson’s patient group. Yuceturk et al. [44] compared Parkinson’s disease patients with healthy people and reported that MPT and HNR were significantly different between them, but jitter and shimmer were not significantly different between them. However, these previous studies used only Spectrum indices as an analysis method to determine sound quality, which was a limitation. This study analyzed major predictors while including both Spectrum and Cepstral indices and confirmed that CPP was the most important predictor. It is believed that it was because CCP could reflect the periodicity of the speech signal well regardless of the type or length of the speech. The Cepstrum analysis not only displays the degree of harmonics as a single peak on the Spectrum through log Fourier transformation, but also visualizes the harmonic structure of the speech signal more prominently than the Spectrum through the inverse Fourier transformation of the Spectral measurement. In particular, among Cepstral measures, CPP is an index that can check the amount of harmonics in the voice signal through the difference between the maximum Cepstral value and the regression line [45]. Speakers with prominent voice problems tend to show a small CPP value [46,47], and CPP tends to increase as quality improves or loudness increases [48]. In a number of previous studies, CPP has shown good accuracy and effectiveness in detecting dysarthria (e.g., accurately predicting the severity of dysarthria) and a high correlation with auditory-perceptual evaluation results [25,45,46].
5. Conclusions
In summary, the results of this study imply that CPP among Cepstral indices is useful for distinguishing hypokinetic dysarthria from presbyphonia in acoustic–phonetic analysis using both Cepstrum and Spectrum. It will be necessary to develop a multimodal-based prediction model including auditory-perceptual indices, biomarkers, and acoustic–phonetic indices (e.g., Cepstral and Spectral measures) to predict hypokinetic dysarthria more sensitively.
Funding
This research was supported by Basic Science Research Program through the National Research Foundation of Korea (NRF) funded by the Ministry of Education (NRF-2018R1D1A1B07041091, NRF-2019S1A5A8034211).
Institutional Review Board Statement
This study was approved by the Institutional Review Board of HN University in Korea (No. 1041223-201812-HR-26, date: 1 March 2018).
Informed Consent Statement
All subjects gave their informed consent for inclusion before they participated in the study. The study was conducted in accordance with the Declaration of Helsinki, and the protocol was approved by the Institutional Review Board of HN University in Korea (No. 1041223-201812-HR-26).
Data Availability Statement
Restrictions apply to the availability of these data. Data was obtained from HN University in Korea and are available (from the HN University/https://cn.honam.ac.kr/; accessed date: 1 March 2021) with the permission of Institutional Review Board of HN University in Korea.
Conflicts of Interest
The author declares no conflict of interest.
References
- Martins, R.H.G.; Gonçalvez, T.M.; Pessin, A.B.B.; Branco, A. Aging voice: Presbyphonia. Aging Clin. Exp. Res. 2014, 26, 1–5. [Google Scholar] [CrossRef] [PubMed]
- Costa, H.; Matias, C. Vocal impact on quality of life of elderly female subjects. Braz. J. Otorhinolaryngol. 2005, 71, 172–178. [Google Scholar] [CrossRef]
- Galluzzi, F.; Garavello, W. The aging voice: A systematic review of presbyphonia. Eur. Geriatr. Med. 2018, 9, 559–570. [Google Scholar] [CrossRef]
- Seifpanahi, S.; Jalaie, S.; Nikoo, M.R.; Sobhani-Rad, D. Translated versions of Voice Handicap Index (VHI)-30 across languages: A systematic review. Iran. J. Public Health. 2015, 44, 458–469. [Google Scholar] [PubMed]
- Crawley, B.K.; Dehom, S.; Thiel, C.; Yang, J.; Cragoe, A.; Mousselli, I.; Krishna, P.; Murry, T. Assessment of clinical and social characteristics that distinguish presbylaryngis from pathologic presbyphonia in elderly individuals. JAMA Otolaryngol. Head Neck Surg. 2018, 144, 566–571. [Google Scholar] [CrossRef]
- Morsomme, D.; Jamart, J.; Boucquey, D.; Remade, M. Presbyphonia: Voice differences between the sexes in the elderly. Comparison by maximum phonation time, phonation quotient and spectral analysis. Logop. Phoniatr. Vocol. 1997, 22, 9–14. [Google Scholar] [CrossRef]
- Mezzedimi, C.; Di Francesco, M.; Livi, W.; Spinosi, M.C.; De Felice, C. Objective evaluation of presbyphonia: Spectroacoustic study on 142 patients with Praat. J. Voice 2017, 31, 257.e25–257.e32. [Google Scholar] [CrossRef] [PubMed]
- Xue, S.A.; Fucci, D. Effects of race and sex on acoustic features of voice analysis. Percept. Mot. Ski. 2000, 91, 951–958. [Google Scholar] [CrossRef]
- Maryn, Y.; Roy, N.; De Bod, M.; Van Cauwenberge, P.; Corthals, P. Acoustic measurement of overall voice quality: A meta-analysis. J. Acoust. Soc. Am. 2009, 126, 2619–2634. [Google Scholar] [CrossRef]
- Peterson, E.A.; Roy, N.; Awan, S.N.; Merrill, R.Y.; Banks, R.; Tanner, K. Toward validation of the cepstral spectral index of dysphonia (CSID) as an objective treatment outcomes measure. J. Voice 2013, 27, 401–410. [Google Scholar] [CrossRef]
- Heman-Ackah, Y.D.; Heuer, R.J.; Michael, D.D.; Baroody, M.M.; Ostrowski, R.; Hillendrand, J.; Heuer, R.J.; Horman, M.; Sataloff, R.T. Cepstral peak prominence: A more reliable measure of dysphonia. Ann. Otol. Rhinol. Laryngol. 2003, 112, 324–333. [Google Scholar] [CrossRef] [PubMed]
- Byeon, H.; Jin, H.; Cho, S. Characteristics of hypokinetic dysarthria patients’ speech based on sustained vowel phonation and connected speech. Int. J. Serv. Sci. Technol. 2016, 9, 417–422. [Google Scholar] [CrossRef]
- Choi, S.H.; Choi, C.H. The utility of perturbation, non-linear dynamic, and cepstrum measures of dysphonia according to signal typing. J. Korean Soc. Speech Sci. 2014, 6, 63–72. [Google Scholar] [CrossRef]
- Orozco-Arroyave, J.R.; Hönig, F.; Arias-Londoño, J.D.; Vargas-Bonilla, J.F.; Nöth, E. Spectral and cepstral analyses for Parkinson's disease detection in Spanish vowels and words. Expert Syst. 2015, 32, 688–697. [Google Scholar] [CrossRef]
- Shim, H.J.; Jang, H.R.; Shin, H.B.; Ko, D.H. Spectral and cepstral analyses of esophageal speakers. J. Korean Soc. Speech Sci. 2014, 6, 47–54. [Google Scholar]
- Lowell, S.Y.; Colton, R.H.; Kelley, R.T.; Hahn, Y.C. Spectral-and cepstral-based measures during continuous speech: Capacity to distinguish dysphonia and consistency within a speaker. J. Voice 2011, 25, e223–e232. [Google Scholar] [CrossRef]
- Byeon, H.; Yu, S.; Cho, S. Characteristics of amyotrophic lateral sclerosis speakers drawn out through spectral and cepstral analysis. Information 2016, 19, 5491–5496. [Google Scholar]
- Byeon, H. Developing a random forest classifier for predicting the depression and managing the health of caregivers supporting patients with Alzheimer’s disease. Technol. Health Care. 2019, 27, 531–544. [Google Scholar] [CrossRef]
- Hamidi, O.; Poorolajal, J.; Farhadian, M.; Tapak, L. Identifying important risk factors for survival in kidney graft failure patients using random survival forests. Iran. J. Public Health 2016, 45, 27–33. [Google Scholar]
- Javadi, A.; Khamesipour, A.; Monajemi, F.; Ghazisaeedi, M. Computational modeling and analysis to predict intracellular parasite epitope characteristics using random forest technique. Iran. J. Public Health 2020, 49, 125–133. [Google Scholar] [CrossRef]
- Maroufizadeh, S.; Amini, P.; Hosseini, M.; Almasi-Hashiani, A.; Mohammadi, M.; Navid, B.; Omani-Samani, R. Determinants of cesarean section among primiparas: A comparison of classification methods. Iran. J. Public Health 2018, 47, 1913–1922. [Google Scholar] [PubMed]
- Shin, H.B.; Shim, H.J.; Jung, H.; Ko, D.H. Characteristics of voice quality on clear versus casual speech in individuals with Parkinson’s disease. Phon. Speech Sci. 2018, 10, 77–84. [Google Scholar] [CrossRef]
- Kendall, K. Presbyphonia: A review. Curr. Opin. Otolaryngol. Head Neck Surg. 2007, 15, 137–140. [Google Scholar] [CrossRef]
- Lee, S.; Kim, J. Prediction of speaking fundamental frequency using the voice and speech range profiles in normal adults. J. Korean Soc. Speech Sci. 2019, 11, 49–55. [Google Scholar]
- Lowell, S.Y.; Kelley, R.T.; Awan, S.N.; Colton, R.H.; Chan, N.H. Spectral- and cepstral-based acoustic features of dysphonic, strained voice quality. Ann. Otol. Rhinol. Laryngol. 2012, 121, 539–548. [Google Scholar] [CrossRef]
- Chawla, N.V.; Bowyer, K.W.; Hall, L.O.; Kegelmeyer, W.P. SMOTE: Synthetic minority over-sampling technique. J. Artif. Intell. Res. 2002, 16, 321–357. [Google Scholar] [CrossRef]
- Byeon, H. Developing a model for predicting the speech intelligibility of South Korean children with cochlear implantation using a random forest algorithm. Int. J. Adv. Comput. Sci. Appl. 2018, 9, 88–93. [Google Scholar] [CrossRef]
- Strobl, C.; Boulesteix, A.L.; Zeileis, A.; Hothorn, T. Bias in random forest variable importance measures: Illustrations, sources and a solution. BMC Bioinform. 2007, 8, 1–21. [Google Scholar] [CrossRef]
- Genuer, R.; Poggi, J.M.; Tuleau-Malot, C. Variable selection using random forests. Pattern. Recognit. Lett. 2010, 31, 2225–2236. [Google Scholar] [CrossRef]
- Byeon, H. Is the random forest algorithm suitable for predicting Parkinson’s disease with mild cognitive impairment out of Parkinson’s disease with normal cognition? Int. J. Environ. Res. Public Health 2020, 17, 2594. [Google Scholar] [CrossRef]
- Yim, J.Y.; Shin, H. Comparison of classifier for pain assessment based on photoplethysmogram and machine learning. Trans. Korean. Inst. Elect. Eng. 2019, 68, 1626–1630. [Google Scholar] [CrossRef]
- Friedman, J.H. Greedy function approximation: A gradient boosting machine. Ann. Stat. 2001, 29, 1189–1232. [Google Scholar] [CrossRef]
- Zhang, Z.; Mayer, G.; Dauvilliers, Y.; Plazzi, G.; Pizza, F.; Fronczek, R.; Santamaria, J.; Partinen, M.; Overeem, S.; Peraita-Adrados, R.; et al. Exploring the clinical features of narcolepsy type 1 versus narcolepsy type 2 from European narcolepsy network database with machine learning. Sci. Rep. 2018, 8, 1–11. [Google Scholar] [CrossRef]
- Mitchell, R.; Frank, E. Accelerating the XGBoost algorithm using GPU computing. PeerJ Comput. Sci. 2017, 3, e127. [Google Scholar] [CrossRef]
- Bi, Y.; Xiang, D.; Ge, Z.; Li, F.; Jia, C.; Song, J. An interpretable prediction model for identifying N7-methylguanosine sites based on XGBoost and SHAP. Mol. Nucleic Acids. 2020, 22, 362–372. [Google Scholar] [CrossRef]
- Cheng, F.; Yang, C.; Zhou, C.; Lan, L.; Zhu, H.; Li, Y. Simultaneous determination of metal ions in zinc sulfate solution using UV–Vis spectrometry and SPSE-XGBoost method. J. Sens. 2020, 20, 4936. [Google Scholar] [CrossRef] [PubMed]
- Khalilia, M.; Chakraborty, S.; Popescu, M. Predicting disease risks from highly imbalanced data using random forest. BMC Med. Inf. Decis. Mak. 2011, 11, 1–13. [Google Scholar] [CrossRef]
- Byeon, H.; Jin, H.; Cho, S. Development of Parkinson’s disease dementia prediction model based on verbal memory, visuospatial memory, and executive function. J. Med. Imaging Health Inf. 2017, 7, 1517–1521. [Google Scholar] [CrossRef]
- O’Brien, R.; Ishwaran, H. A random forests quantile classifier for class imbalanced data. Pattern Recognit. 2019, 90, 232–249. [Google Scholar] [CrossRef]
- Byeon, H. Can the random forests model improve the power to predict the intention of the elderly in a community to participate in a cognitive health promotion program? Iran. J. Public Health 2021, 50, 315–324. [Google Scholar]
- Holmes, J.; Oates, M.; Phyland, J.; Hughes, J. Voice characteristics in the progression of Parkinson's disease. J. Lang. Commun. Disord. 2000, 35, 407–418. [Google Scholar]
- Jiménez-Jiménez, F.J.; Gamboa, J.; Nieto, A.; Guerrero, J.; Orti-Pareja, M.; Molina, J.A.; García-Albea, E.; Cobeta, I. Acoustic voice analysis in untreated patients with Parkinson’s disease. Parkinsonism Relat. Disord. 1997, 3, 111–116. [Google Scholar] [CrossRef]
- Santos, M.; Reis, D.; Bassi, I.; Guzella, C.; Cardoso, F.; Reis, C.; Gama, A.C.C. Acoustic and hearing-perceptual voice analysis in individuals with idiopathic Parkinson’s disease in “on” and “off” stages. Arq. Neuropsiquiatr. 2010, 68, 706–771. [Google Scholar] [CrossRef] [PubMed][Green Version]
- Yuceturk, V.; Yılmaz, H.; Egrilmez, M.; Karaca, S. Voice analysis and videolaryngostroboscopy in patients with Parkinson’s disease. Eur. Arch. Otorhinolaryngol. 2002, 259, 290–293. [Google Scholar] [CrossRef]
- Hillenbrand, J.; Cleveland, R.A.; Erickson, R.L. Acoustic correlates of breathy vocal quality. J. Speech Lang. Hear. Res. 1994, 37, 769–778. [Google Scholar] [CrossRef]
- Hasanvand, A.; Salehi, A.; Ebrahimipour, M. A cepstral analysis of normal and pathologic voice qualities in Iranian adults: A comparative study. J. Voice 2017, 31, e17–e23. [Google Scholar] [CrossRef] [PubMed]
- Heman-Ackah, Y.D.; Michael, D.D.; Goding, G.S. The relationship between cepstral peak prominence and selected parameters of dysphonia. J. Voice 2002, 16, 20–27. [Google Scholar] [CrossRef]
- Rosenthal, L.; Lowell, Y.; Colton, H. Aerodynamic and acoustic features of vocal effort. J. Voice 2014, 28, 144–153. [Google Scholar] [CrossRef]
Publisher’s Note: MDPI stays neutral with regard to jurisdictional claims in published maps and institutional affiliations. |
© 2021 by the author. Licensee MDPI, Basel, Switzerland. This article is an open access article distributed under the terms and conditions of the Creative Commons Attribution (CC BY) license (http://creativecommons.org/licenses/by/4.0/).