Article

Vibration Isolation of a Surveillance System Equipped in a Drone with Mode Decoupling

1
Department of Safety Engineering/Big Data, Chungbuk National University, 1 Chungdae-ro, Seowon-gu, Cheongju, Chungbuk 28644, Korea
2
Department of Energy System Engineering, Chung-Ang University, 84 Heukseok-ro, Dongjak-gu, Seoul 06974, Korea
3
Department of Intelligent Energy and Industry, Chung-Ang University, 84 Heukseok-ro, Dongjak-gu, Seoul 06974, Korea
*
Author to whom correspondence should be addressed.
Appl. Sci. 2021, 11(4), 1961; https://doi.org/10.3390/app11041961
Submission received: 10 December 2020 / Revised: 16 February 2021 / Accepted: 18 February 2021 / Published: 23 February 2021
(This article belongs to the Special Issue Noise Reduction and Vibration Isolation)

Abstract

:
Vibration isolation with mode decoupling plays a crucial role in the design of an intelligent robotic system. Specifically, a coupled multi-degree-of-freedom (multi-DOF) model accurately predicts responses of system dynamics; hence, it is useful for vibration isolation and control with mode decoupling. This study presents a vibration isolation method with mode decoupling based on system identification, including a coupled multi-DOF model to design intelligent robotic systems. Moreover, the entire procedure is described, including the derivation of the governing equation of the coupled multi-DOF model, estimation of the frequency response function, and parameter estimation using least squares approximation. Furthermore, the suggested methods were applied for a mobile surveillance system suffering from resonances with mode coupling; it made the monitoring performance of the surveillance camera deteriorate. The resonance problem was mitigated by installing vibration isolators, but limited to eliminate the coupling effects of natural frequency deterioration performances of vibration isolation. More seriously, system identification with a simple decoupled model limits the prediction of this phenomenon. Hence, it is difficult to enhance the performance of vibration isolators. In contrast, the presented method can accurately predict the vibration phenomenon and plays a critical role in vibration isolation. Therefore, dynamic characteristics were predicted based on a vibration isolator using the coupled three-DOF model, and a final suggestion is presented here. The experiments demonstrated that the suggested configuration decreased vibration up to 98.3%, 94.0%, and 94.5% in the operational frequency range, i.e., 30–85 Hz, compared to the original surveillance system in the fore-after, side-by-side, and vertical directions, respectively. The analysis suggests that the present method and procedure effectively optimize the vibration isolation performances of a drone containing a surveillance system.

1. Introduction

Technological enhancements in various research fields have opened the door to the Fourth Industrial Revolution [1]. These technologies include artificial intelligence, the Internet of Things, big data analytics, augmented reality, additive manufacturing, cloud computing, smart sensors, robotics, and system integrations [2]. In particular, smart sensors, robotics, and system integration directly connect cybernetics to human life. Specifically, integrated robotic systems equipped with smart sensors and artificial intelligence can execute various challenging and repeated missions, freeing humans from executing these tasks.
Traditional research fields in mechatronics should properly collaborate to construct state-of-the-art technologies mentioned above to develop intelligent (and autonomous) robotic systems. Mechatronics is an interdisciplinary branch of engineering focusing on the engineering of electronic, electrical, and mechanical systems, including a combination of robotics, electronics, computer engineering, telecommunication, signal processing, and product engineering. This implies that mechatronics is an essential foundation in creating intelligent robotic systems for the Fourth Industrial Revolution. Vibration isolation and control with system identification plays a critical role among many mechatronics branches in conducting missions of intelligent robotic systems because excessive vibration degrades the performance of control, monitoring, and diagnosis of a robotic system of interest.
Various methods have been studied for vibration isolation and control with system identification [3]. The observer/Kalman filter identification technique was proposed for vibration control of smart structures [4]. An inverse model of a magnetorheological damper using optimal neural network and system identification was proposed [5]. A method to identify a nonlinear system [6] and proper model selection procedure was also suggested [7]. A vibration of the end-effector for industrial robots was recently identified through a linear system identification method; after that, a vibration was reduced with the linear quadratic-Gaussian controller [8]. Moreover, an active vibration isolation system was presented for vibration isolation of a surveillance system [9]. A robust vibration control systems with advanced control strategies accounting for system uncertainty have been also studied to reduce vibration occurred in unmanned aerial vehicles, i.e., drones [10,11,12]. These studies have provided useful information for the vibration control and isolation of robotic systems.
However, previous studies on vibration control of intelligent robotic systems have two limitations. First, they estimated system dynamics through experiments or used a simple decoupled model for system identification, suggesting no correlation between each degree of freedom and other coordinates. This simple approach can rapidly and easily identify a robotics system. However, the model has limited accuracy in predicting complex coupling dynamics of intelligent robotic systems. Therefore, it is difficult to ensure the high performance of vibration isolation. More importantly, the coupling effects of vibration on resonance significantly tremble sensor measurements, suggesting that a robot cannot execute the mission. Second, most studies on vibration problems in intelligent robotic systems addressed active vibration systems with novel control approaches. Active control of vibration enhances the vibration performance compared to passive vibration isolators in most cases. Moreover, this approach is effective in combating external disturbances, uncertainties, and environmental influences that act on the drone. However, this approach increases the complexity of vibration isolators and weight and power consumption of smart mobility because it needs axillary components including actuators and a controller for vibration isolation. However, the weight of smart mobility plays a critical role in executing its mission, suggesting that passive optimization of a vibration isolator should be proceeded in advance before applying active control strategies for vibration isolation. In other words, passive vibration control should be completed before addressing the active control strategy to maximize the performance of a drone. For example, a drone could not fly for more than 20–25 min with the maximum payload; however, a drone with the light-weight smart inspection system flew for approximately 35 min, thereby executed its mission successfully [13]. Note that both active and passive strategies for vibration isolation are important to ensure the performance of a surveillance system.
This study presents a method for vibration isolation of a surveillance system with mode decoupling, filling the gap in the previous studies. It also addresses system identification with the coupled multi-degree-of-freedom (DOF) model to accurately predict the effect of coupling on the degradation of a vibration isolation performance. Note that the method presented aims to optimize the location of natural frequency and decouple adjacent natural frequencies to vertical and horizontal directions without active control strategies to avoid adverse effects on the performance of the camera system transmitted from the rotors. A simple surveillance system with a rubber-type vibration isolator suffers from the coupled effects of natural frequencies in multi-DOF coordinates. It suggests that a vibration isolator should be implemented by reviewing the target system to mitigate issues owing to the coupling effect. Furthermore, a decoupled dynamic model cannot predict this complex phenomenon, systematically limiting the vibration control of the system. On the contrary, the presented coupled multi-DOF model accurately predicts the coupling effects, showing that the location of the natural frequency in the vertical-horizontal direction is not sufficiently separated from the measured results. Therefore, it adversely affects surveillance performance. The optimal design was achieved through mode decoupling by changing the configuration of several vibration isolators based on system identification with a coupled multi-DOF model. Experiments have validated that the presented configuration can effectively isolate vibrations through mode decoupling. Specifically, the novelty and contribution of this study are as follows:
-
The entire process of vibration isolation with mode decoupling is presented as a countermeasure to minimize the vibration effects on the surveillance system.
-
System identification with a coupled multi-DOF model is presented to identify a problem of mode coupling on a vibration isolator and predict vibration isolation performance for optimized configuration of vibration isolators.
-
Design optimization of a vibration isolator is executed with the coupled multi-DOF model to separate vertical and horizontal natural frequencies by 1 Hz or more.
-
The effectiveness of the presented method is validated through experiments based on vibration isolation performance (VIP).
The remainder of this paper is organized as follows. Section 2 presents the theories for system identification addressed in this study. This section includes the Equation of motion (EOM) for the decoupled and coupled systems, and Levenberg-Marquardt algorithm. Section 3 describes experimental vibration characterization including a theory for a frequency response function and procedures for modal testing. This section also includes a measurement scheme of vibration transmitted from rotors to a surveillance system. Section 4 presents results and suggestions. This section discusses initialization of a vibration problem on a mobile surveillance system and design optimization with the model-based system identification. The paper concludes with a summary and recommendations for future work in Section 5.

2. Theories for System Identification

A mathematical model of a multi-DOF system must be addressed to analyze the transmissibility of vibration from a base to a payload. A multi-DOF system is more complicated than a single-DOF system because a response in one part of a degree is coupled to the others. Therefore, a response from one part affects the others. Hence, system identification with a multi-DOF model gives sufficient information to accurately predict the vibration responses under various operational conditions. This section is comprised of two subsections. First, an EOM of a multi-DOF system, including general decoupled and coupled systems, was derived to theoretically describe the overall mechanical behavior. Second, a method to identify the system parameters, which is used in this study, is discussed.

2.1. Mathematical Model of a Multi-DOF System

The mechanical response of a multi-DOF system consists of responses in each single-DOF coordinate. This study assumes the mechanical system to be a holonomic system, to describe the behavior of vibration with a superposition principle. The EOM of a multi-DOF system can be derived using Lagrange’s method [14]. Lagrange’s equation for a viscous damped system is defined as follows:
d d t ( L q ˙ k ) L q k + R q ˙ k = 0 ,   k = 1 , 2 , , n ,
where L ,   R , and q k denote the Lagrangian, the Rayleigh’s dissipation function, and generalized coordinates, respectively. The Lagrangian of L is defined as T V , where T and V denote the kinetic and potential energy, respectively.
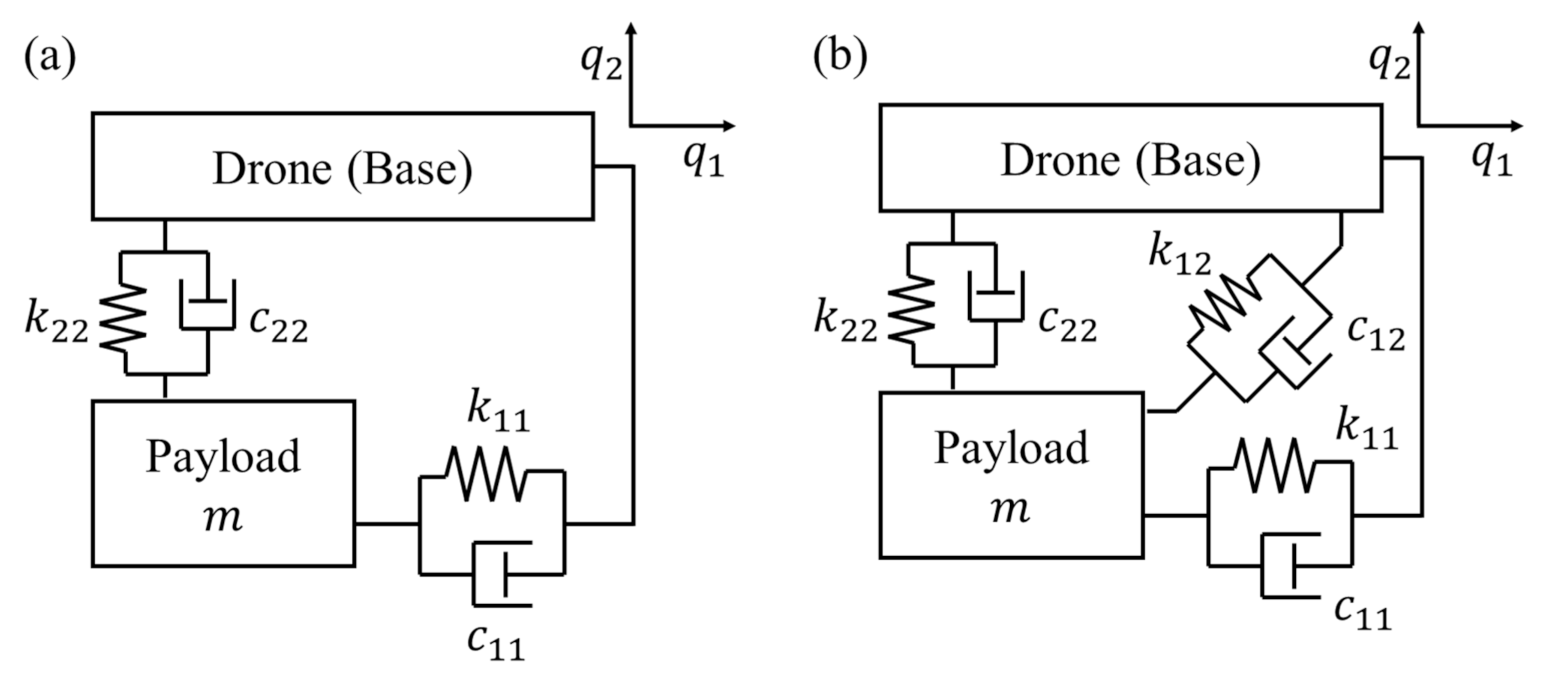
The mechanical systems can be modeled by exciting the payload with the motion of a drone (base). For the sake of brevity, a two-DOF system is used in this study to explain the coupling characteristics and its EOM instead of a multi-DOF system. A two-DOF problem can be modeled in a base-excited system, as shown in Figure 1. The kinetic energy, potential energy, and Rayleigh’s dissipation can be expressed as
T = 1 2 m q ˙ 1 2 + 1 2 m q ˙ 2 2 .
V = 1 2 k 11 ( q 1 q 1 b ) 2 + 1 2 k 12 ( q 1 q 1 b ) ( q 2 q 2 b ) + 1 2 k 21 ( q 2 q 2 b ) ( q 1 q 1 b ) + 1 2 k 22 ( q 2 q 2 b ) 2 .
R = 1 2 c 11 ( q ˙ 1 q ˙ 1 b ) 2 + 1 2 c 12 ( q ˙ 1 q ˙ 1 b ) ( q ˙ 2 q ˙ 2 b ) + 1 2 c 21 ( q ˙ 2 q ˙ 2 b ) ( q ˙ 1 q ˙ 1 b ) + 1 2 c 22 ( q ˙ 2 q ˙ 2 b ) 2 ,
where m denotes the mass of the payload, k i j is the stiffness in the i j -coordinate, c i j is the damping coefficient in i j -coordinate, q r is the r-coordinate directional motion of the payload, and q r b is the r-coordinate directional motion of a base.
Equations (2)–(4) are substituted into Equation (1) to derive the EOM as follows:
δ L δ q 1 =   k 11 ( q 1 q 1 b ) + 1 2 k 12 ( q 2 q 2 b ) + 1 2 k 21 ( q 2 q 2 b ) ,
δ L δ q 1 ˙ = m q ˙ 1 ,
d d t ( δ L δ q ˙ 1 ) = m q ¨ 1 ,
R q 1 ˙ = c 11 ( q ˙ 1 q ˙ 1 b ) + 1 2 c 12 ( q ˙ 2 q ˙ 2 b ) + 1 2 c 21 ( q ˙ 2 q ˙ 2 b ) ,
m q ¨ 1 + c 11 ( q ˙ 1 q ˙ 1 b ) + k 11 ( q 1 q 1 b ) + ( 1 2 c 12 + 1 2 c 21 ) ( q ˙ 2 q ˙ 2 b ) + ( 1 2 k 12 + 1 2 k 21 ) ( q 2 q 2 b ) = 0 .
Additionally, the EOM at a generalized coordinate, q 2 , can be derived as,
m q ¨ 2 + c 22 ( q ˙ 2 q ˙ 2 b ) + k 22 ( q 2 q 2 b ) + ( 1 2 c 12 + 1 2 c 21 ) ( q ˙ 1 q ˙ 1 b ) + ( 1 2 k 12 + 1 2 k 21 ) ( q 1 q 1 b ) = 0
The stiffness term is assumed as follows:
c 12 = c 21 , k 12 = k 21 .
Coordinates are mutually independent in a general two-DOF system (Figure 1a). Therefore, k i j = c i j = 0 , if i j . Hence, the EOM for a general two-DOF system is derived as
[ m 0 0 m ] [ q ¨ 1 q ¨ 2 ] + [ c 11 0 0 c 22 ] [ q ˙ 1 q ˙ 2 ] + [ k 11 0 0 k 22 ] [ q 1 q 2 ] = [ c 11 0 0 c 22 ] [ q ˙ 1 b q ˙ 2 b ] + [ k 11 0 0 k 22 ] [ q 1 b q 2 b ] .
It implies that each coordinate is decoupled—independent—from the other. Therefore, responses can be predicted by solving the second order ordinary differential equation for each coordinate. Coordinates are coupled—dependent—to each other in a coupled system (Figure 1b). Therefore, k i j = c i j 0 , if i j . Hence, the EOM for a coupled two-DOF system is derived as
[ m 0 0 m ] [ q ¨ 1 q ¨ 2 ] + [ c 11 c 12 c 12 c 22 ] [ q ˙ 1 q ˙ 2 ] + [ k 11 k 12 k 22 k 22 ] [ q 1 q 2 ] = [ c 11 c 12 c 12 c 22 ] [ q ˙ 1 b q ˙ 2 b ] + [ k 11 k 12 k 12 k 22 ] [ q 1 b q 2 b ] .
Hence, this problem can be solved by transforming the original coordinate into a modal coordinate using the modal matrix. One can solve the decoupled EOM for each modal coordinate; after that, the modal coordinate responses are transformed into the original coordinate again using the modal matrix [15]. This EOM can be extended to a three-DOF system as follows:
[ m 0 0 0 m 0 0 0 m ] [ q ¨ 1 q ¨ 2 q ¨ 3 ] + [ c 11 c 12 c 13 c 12 c 22 c 23 c 13 c 23 c 33 ] [ q ˙ 1 q ˙ 2 q ˙ 3 ] + [ k 11 k 12 k 13 k 12 k 22 k 23 k 13 k 23 k 33 ] [ q 1 q 2 q 3 ] = F ( t )
where F ( t ) denotes an external force. However, the assumption to solve the multi-DOF system using a modal matrix in a modal coordinate considers that parameters, including equivalent mass, damping coefficients, and stiffness coefficients, are known. It suggests that a method to identify these parameters is indispensable. The following two subsections demonstrate how to identify the system parameters in Equations (12)–(14) based on the modal testing, i.e., a frequency response function.

2.2. Levenberg-Marquardt Algorithm

The equivalent mass, stiffness, and damping in a multi-DOF model constitute the response characteristics of the system of interest. Therefore, Section 2.1 describes the EOM of a multi-DOF system. The rest of the work included executing the system identification using experimental data, which was processed using the information provided in Section 3 to estimate parameters in Equations (12)–(14). The parameter estimation problem can be reformulated as an objective function minimization problem, called the least squares approximation [16]. The objective function in the least squares approximation is expressed as follows:
E ( β ) = i n r i 2 ( β ) = i n [ y ( t i ) F ( t i ; β ) ] 2 ,  
where r i is a residual between model response, F ( t i ; β ) , and observed value, i.e., measured output, y ( t i ) ; ( t i , y i ) ,   i = 1 , n , are observation points and β = [ β 1 , , β m ] are model parameters. If the model is nonlinear in the parameters, its parameters are estimated using iterative minimization. Specifically, starting with initial parameters, β 0 , β is updated repeatedly to minimize the error function, E ( β ) .
In this study, the Levenberg-Marquardt algorithm [16,17] was selected and applied to secure convergence by mutually related coupling terms for independent axes, even though the target system is simplified to be linear. This is because the Levenberg-Marquardt algorithm is highly likely to find the cost-minimized value even though the initial value is far from the optimal value and it can be applied relatively easily regardless of a linear or nonlinear target system. Furthermore, it converges on the cost minimized value faster than other iterative methods because the gradient using the Jacobian matrix and damping factor accelerating the convergence speed and increasing the accuracy were used. The Levenberg–Marquardt method is expressed as follows:
β k + 1 = β k ( J r T J r + μ k d i a g ( J r T J r ) ) 1 J r T r ( β k ) ,   k 0 ,  
J r β = r 1 β β 1 r 1 β β m r n β β 1 r n β β m , r β = r 1 β r 2 β r n β = y 1 F x 1 , β y 2 F x 2 , β y n F x n , β
where J r ( β ) is the n × m Jacobian matrix that represents the local sensitivity of the residual function, r , to the variation in the parameter, β ; μ k is the non-negative damping factor to be adjusted at each iteration. The damping factor, μ k , is updated until the error function E ( β ) converges to a predefined threshold, and the updating process is as follows:
μ k + 1 = { μ k α , E ( β k + 1 ) < E ( β ) α μ k , E ( β k + 1 ) > E ( β ) ,  
where α is an arbitrary positive number that regulates the degree of update. Note that a trade-off between the robustness of the gradient descent and the convergence speed exists based on α ; hence, α should be larger than one. This study set the value of α to be ten based on the recommendation from [16].
Additionally, future work includes performance validation with actual field experiments and application of the present method to the nonlinear design problem, such as dynamic amplitude- and preload- dependence, which originates from the viscoelastic material type mount used in this study.

3. Experimental Vibration Characterization

This section describes experimental vibration characterization. This measurement is useful to identify system dynamic characteristics with theories described in Section 2. First, a frequency response function was derived from time signals of a base and payload to describe the transmissibility of vibration between the two. Second, modal testing and experimental procedure was presented.

3.1. Frequency Response Function

A frequency response function is useful to identify the characteristics of a multi-DOF system by analyzing the relationship between an input signal, x ( t ) , and an output signal, y ( t ) , in the frequency domain. Moreover, this response can be easily measured with modal testing, which suggests that the frequency response function must be measured to identify the vibration characteristics between a base and a payload. After that, the response at various operational conditions can be predicted to propose the enhanced vibration performance for the system of interest. Therefore, this study focuses on calculating the frequency response function from experiments. Note that simply measuring vibration during operation in the time domain cannot quantitatively compare the VIP because the amplitude of vibration depends on the magnitude of a vibration source. Hence, the frequency response function is the more elaborate metric to identify vibration characteristics from a system dynamic point of view [15]. The frequency response function H ( f ) [18] is calculated as
H ( f ) = S x y ( f ) S x x ( f ) ,  
where S x x and S x y denote the auto spectral density function of an input signal and the cross-spectral density function between the input and output signals, respectively. The auto spectral density function is calculated by multiplying the Fourier transform of input, X ( f ) , and a complex conjugate form of X ( f ) , as follows:
S x x ( f ) = X ( f ) × X * ( f ) ,  
where the Fourier transform of x ( t ) is denoted as
X ( f ) = x ( t ) e j 2 π f t d t .  
The cross-spectral density function is calculated by multiplying the Fourier transform of the input signal, X ( f ) , and output signal, Y * ( f ) , as follows:
S x y ( f ) = X ( f ) × Y * ( f ) ,  
In real-world applications, the effects of environmental noises, such as random noise, interfere with vibration measurements. Therefore, averages are considered by repeating the experiments to mitigate the effects of noises, as follows:
S ^ * * ( f ) = 1 N n = 1 N ( S * * ) n ,
where N denotes the number of averages. Hence, the auto spectral density function from Equation (20) and the cross-spectral density function from Equation (21) was averaged as S ^ x x ( f ) and S ^ x y ( f ) to calculate the frequency response function in Equation (19). Note that the system should be excited to measure the vibration signals of input, x ( t ) , and output,   y ( t ) . There exist various modal testing methods to excite systems and conduct measurements with an impact hammer and vibration exciter [19]. Modal testing using an impact hammer is widely conducted for a small system because it is easy to execute at a laboratory scale. However, it is hard to excite all frequency ranges of interest for a massive system; therefore, a vibration exciter is generally used for such a system. Furthermore, the coherence function can be calculated to validate the relationship between the input and output signals, as follows:
γ x y 2 = | S x y ( f ) | 2 S x x ( f ) × S y y ( f )   ,  
where S y y denotes the auto spectral density function of the output signal, y ( t ) , indicating the acceleration of a payload. A value of unity in the coherence function shows that the output signal is completely affected by the input signal, x ( t ) , whereas a value of zero indicates no correlation between the input and output signals.

3.2. Modal Testing

Experiments were performed to measure vibration data to characterize the transmissibility between the drone rotors and a surveillance camera system. The mobile surveillance system was comprised of a drone, gimbal, optical camera, and auxiliary system. A drone (DJI M600, Nanshan, China) was used as a crewless aerial vehicle owing to its large payload capacity, 5.5 kg, excluding its own weight. This drone has been widely used for various purposes, including the monitoring and diagnosis of enormous facilities, such as transmission facilities, and 3D mapping of environments [20]. A high-resolution camera (See3CAM_CU135, San Jose, CA, USA) was used as surveillance equipment, which acquires optical images with a resolution of 1280 by 960 pixels. An optical camera was installed underneath the drone body with a gimbal, which was self-produced using a 3D printer (Ultimaker S5, ED Utrecht, Netherlands) to minimize the payload, because the flight time of a drone is critical, and it is inversely proportional to the drone’s weight [21].
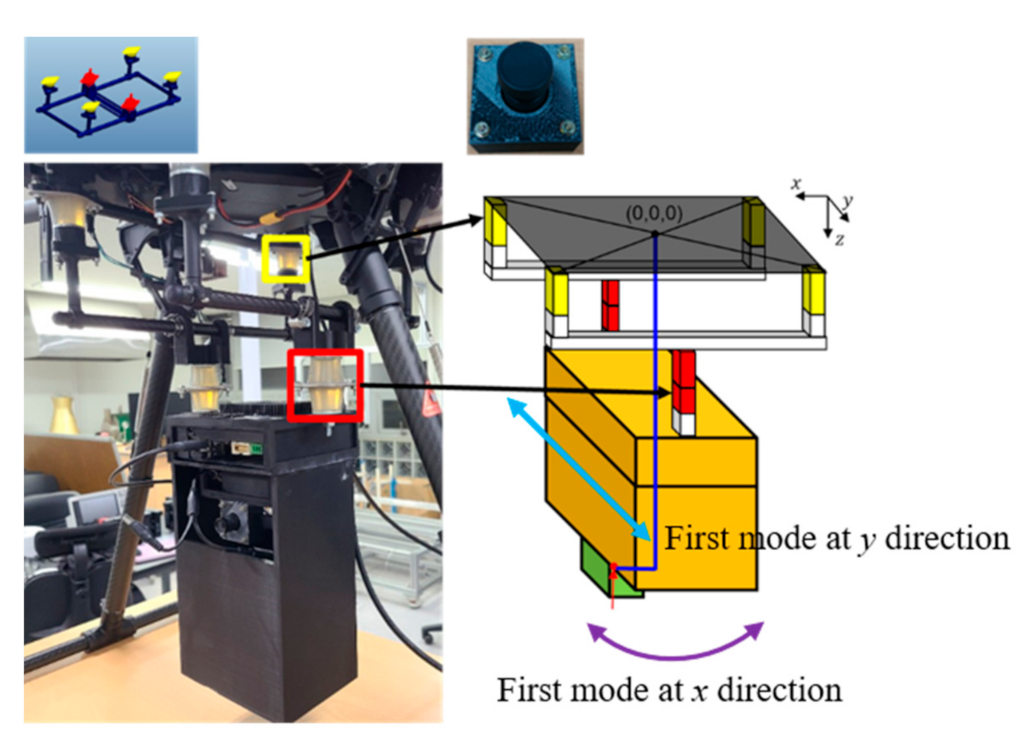
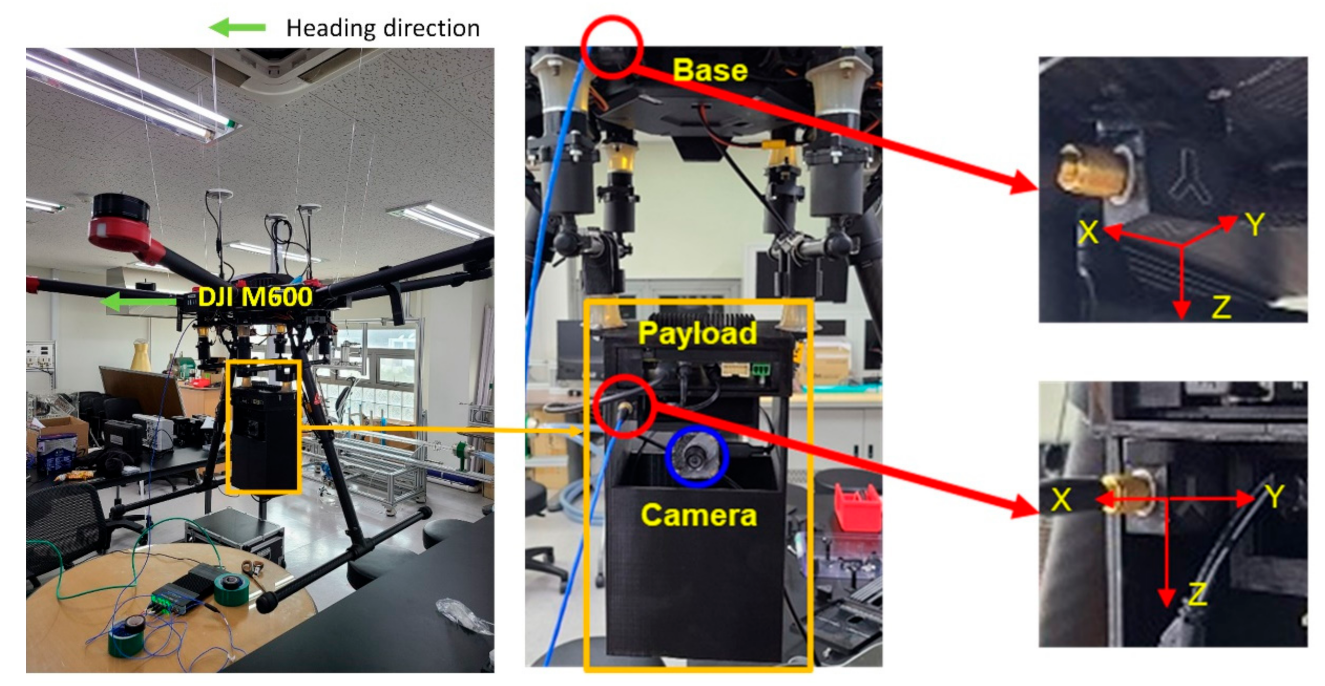
Modal testing was performed with an impact hammer to identify vibration characteristics and transmissibility of the original and proposed systems. Specifically, 2 three-axis accelerometers (PCB 356A16, Depew, NY, USA, sensitivity: 100 mV/g) were used to measure the vibrations (Figure 2). One was installed on the base, i.e., on a drone body, to measure vibration from rotors, and the second on a receiving part, i.e., on the surveillance system consisting of a camera, microprocessor, and power supply. A direction of X in the three-axis accelerometers corresponds to a drone’s front head (the direction of the green arrow in Figure 2). The direction of the front head is important from an operation perspective because an operator requires a frontal view of a drone. Note that a front view should always be secured, even if a drone is operated in an autopilot mode, because a drone is manually controlled during emergencies [21]. Hereafter, it is defined as a fore-after direction. Directions Y and Z in the three-axis accelerometers correspond to side-by-side and vertical drone coordinates, respectively. Note that both the directional vibrations—side-by-side and vertical—in a drone coordinate are important because they significantly influence the camera tremble in the horizontal and vertical directions. On the contrary, the fore-after direction only affects the distance between a camera and an object. Therefore, the side-by-side and vertical directions are of main interest in this study.
An impact hammer (PCB 086E80, USA, sensitivity: 24.0 mV/g) with a steel tip was used to exert an impulse force to the base. Impulse force in the time domain has a flat amplitude spectrum in the frequency domain; therefore, the entire frequency range was excited with the impulse force [22]. Specifically, the coherence function (Equation (24)) during the modal testing showed that coherence was above 0.8 until 160 Hz. This implies that the frequency range of 0–160 Hz has a high correlation for vibration measured between the drone body and surveillance system. The M600 drone was hung using six fishing lines as the drone’s six arms replicating the actual operational conditions. The impulse responses were measured using Pulse 3050-A-060 (B&K, Nærum, Denmark). Furthermore, the frequency response function was calculated using Equation (19) with input and output accelerations using parameter sets as follows: input acceleration in a base (the drone body), the output acceleration in a payload (the surveillance system), sampling frequency at 1024 Hz, resolution at 0.25 Hz, and the number of averages at 5.

4. Results and Suggestions

This section presents the effectiveness of the proposed method through experimental and simulation approaches. First, vibration characteristics of the original system were analyzed with experimental results. Then, a design procedure of a vibration isolator is presented with system identification. Finally, performance enhancement of a vibration isolator for the proposed configuration is presented with a quantitative analysis on experiments, which compares the VIP of the original system.

4.1. Vibration Characteristics of the Original System

Frequency response functions were calculated using measured accelerations from modal testing for elucidating the vibration transmissibility between a source and a receiver for the original mobile surveillance system. Vibrations from the drone and surveillance system were measured by exciting the drone using an impact hammer. Note that an impact force was applied to the drone at an oblique direction to excite the mobile surveillance system in all directions. The transmissibility was calculated using Equation (19) (Figure 3).
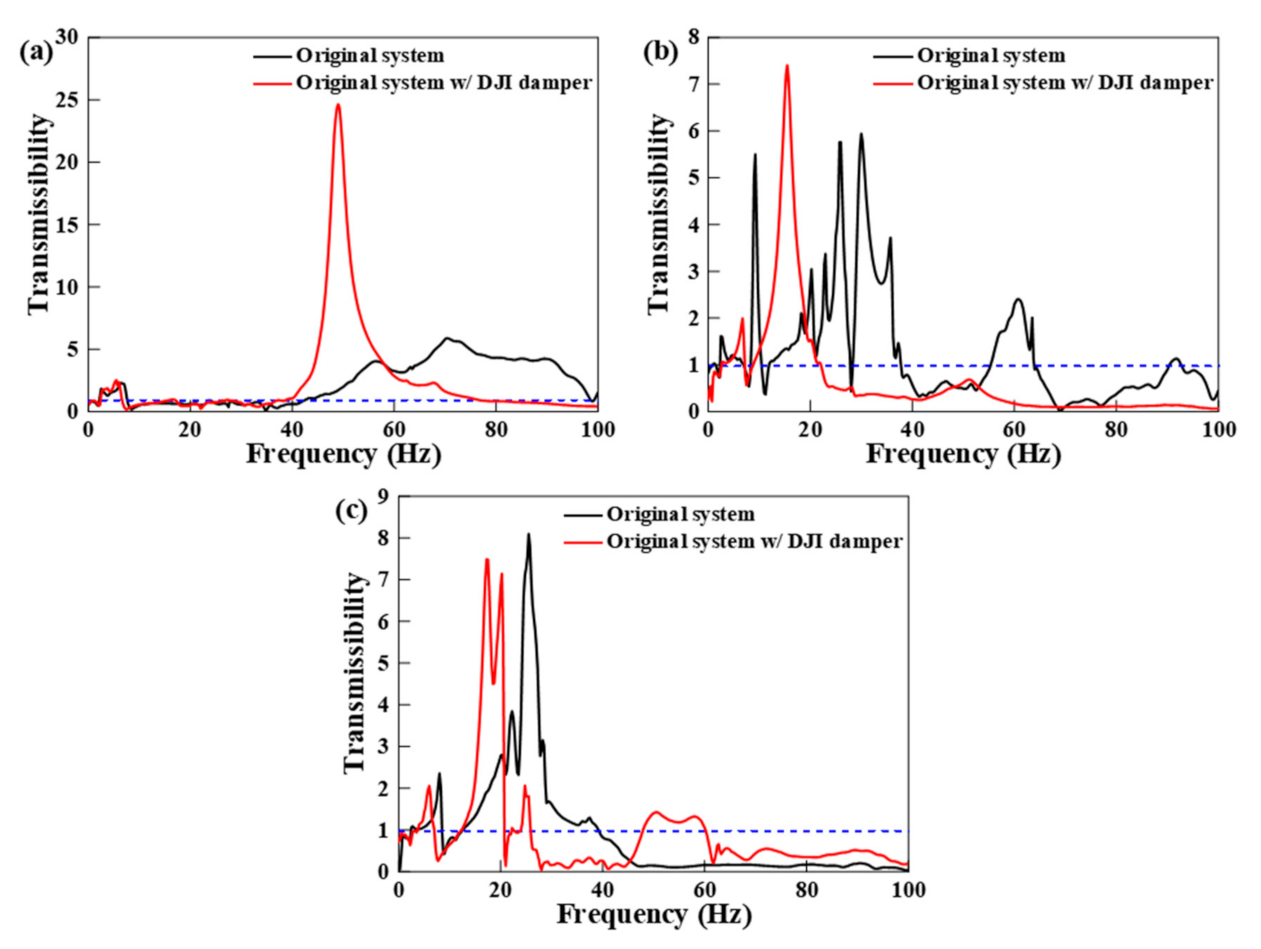
The operating frequency of the drone ranged from 30 to 85 Hz duringflight; therefore, this study aims to isolate the vibration in this range to minimize the transmission of vibrations to the camera in the corresponding frequency range. The black lines in Figure 3 denote the transmissibility for the original system; it shows that transmissibility in various operational frequencies exceeds unity in all directions. It means that vibrations originating from rotors were first amplified and then transmitted to the camera in the surveillance system. Specifically, a frequency range of 43–85 Hz was amplified in the fore-after direction, that of 10–38 Hz and 55–64 Hz was amplified in the side-by-side direction, and that of 10–40 Hz was amplified in the vertical direction. It implies that vibration in all operating frequencies was magnified, and the tremble of vibration was being measured.
More information on the location and amplitude of natural frequencies in each direction is described in Table 1. Interestingly, several natural frequencies of each direction overlapped. The frequency range of approximately 60 Hz of the fore-after and side-by-side directions overlapped; the third natural frequency of the fore-after direction was close to the fifth natural frequency of the side-by-side direction. The natural frequency close to 36 Hz of the side-by-side and vertical directions overlapped; the fourth and fifth natural frequencies of the side-by-side and vertical directions were close to each other, suggesting that vibrations of these directions were coupled to each other. It can be inferred from this observation that a coupled model should be used for system identification to ensure the accurate prediction of vibration responses. Moreover, side-by-side and vertical directions more significantly affect the blurriness of an image.
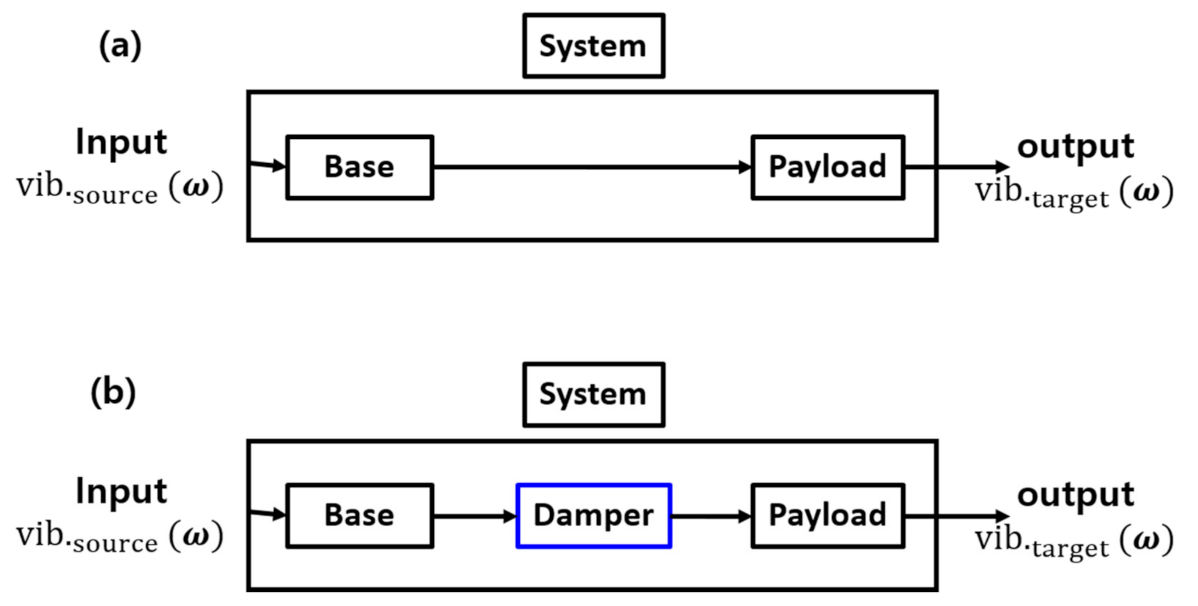
The most straightforward approach to isolate transmissibility for different operational frequencies is to install commercial vibration isolators in the gimbal (Figure 4). Vibrations from rotors ( vib . source ( ω ) in Figure 4) excite all components in a drone. The vibration is transmitted to the surveillance system through a gimbal that connects it to the drone causing vibration in the surveillance camera ( vib . target ( ω ) in Figure 4), which suggests that a gimbal plays a critical role in transmitting vibration from the drone body to the surveillance system. However, vibration from rotors is transmitted to the surveillance system in an original configuration (Figure 4a) owing to the lack of a vibration isolation system in a gimbal. Therefore, this vibration influences images recorded by a surveillance camera and deteriorates monitoring performance. Hence, a vibration isolation system is necessary for the better performance of a surveillance camera.
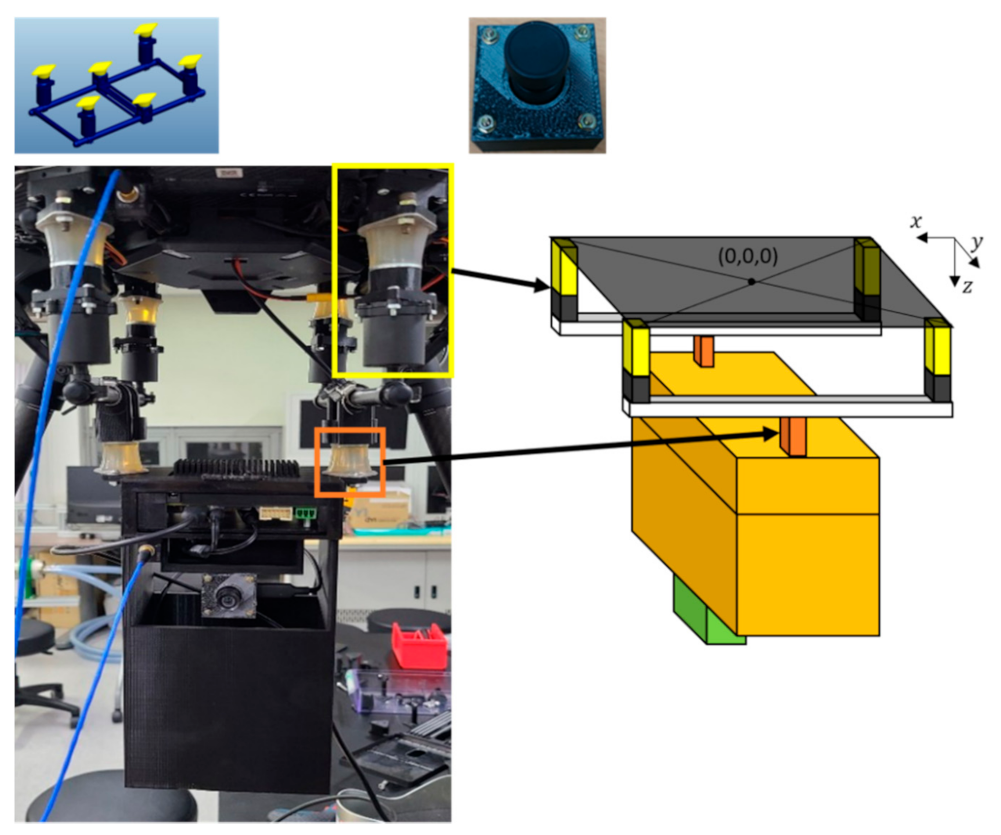
Four vibration isolators of DJI (a black isolator in a yellow box in Figure 5) were installed where the gimbal and drone body connect, and then transmissibility was measured. The red lines in Figure 3 demonstrate that this simple approach enhances the vibration isolation performance at different operational frequencies, especially in the side-by-side and vertical directions. However, significant amplification occurred at approximately 50 Hz in the fore-after direction. This resonance deteriorated the vibration isolation performance of the side-by-side and vertical directions. However, the coupling effect in the vertical direction could not be neglected because magnification was larger than one, and a broad range of operational frequencies, i.e., 50 to 60 Hz, were incorporated. This analysis suggests that the tested commercial vibration isolator is not suitable for the customized surveillance system used in this study. In conclusion, the vibration characteristics of the original system and that with the tested commercial vibration isolators suggest that the mobile surveillance system also needs a customized vibration isolation system that maximizes the performance of the surveillance system.

4.2. Design of a Vibration Isolation System Based on System Identification

The frequency response function for the original system and the tested commercial vibration isolators (Figure 3) shows that the proposed gimbal significantly amplifies the vibration from the rotors in operational frequencies. This vibration causes deterioration of the images taken by the surveillance system, meaning that a vibration isolation system attached to the gimbal should be properly designed and implemented. The method to reduce vibration transmitted to a camera included two approaches: increasing the mass of the camera and decreasing the stiffness of the isolation element. The payload is limited in drones; therefore, the weight must be as light as possible. Hence, this study proposes a design methodology that lowers stiffness.
Commercial mounts having viscoelastic material with the lowest stiffness were used to lower the stiffness and locate the natural frequency below operational frequencies (Figure 5). Specifically, eight dampers were installed between the drone body and the gimbal (a yellow box in Figure 5), and two dampers were installed between the gimbal and the surveillance system (an orange box in Figure 5). The equivalent stiffness of these white jelly dampers was 6.6   × 10 3 N/m, and that of black DJI dampers in Figure 6 was unavailable. Hereafter, this configuration is defined as an initial design of a vibration isolator. Note that two dampers in a series decrease the equivalent stiffness of a vibration isolator. Hence, this simple design configuration is effective in isolating vibration from the rotors.
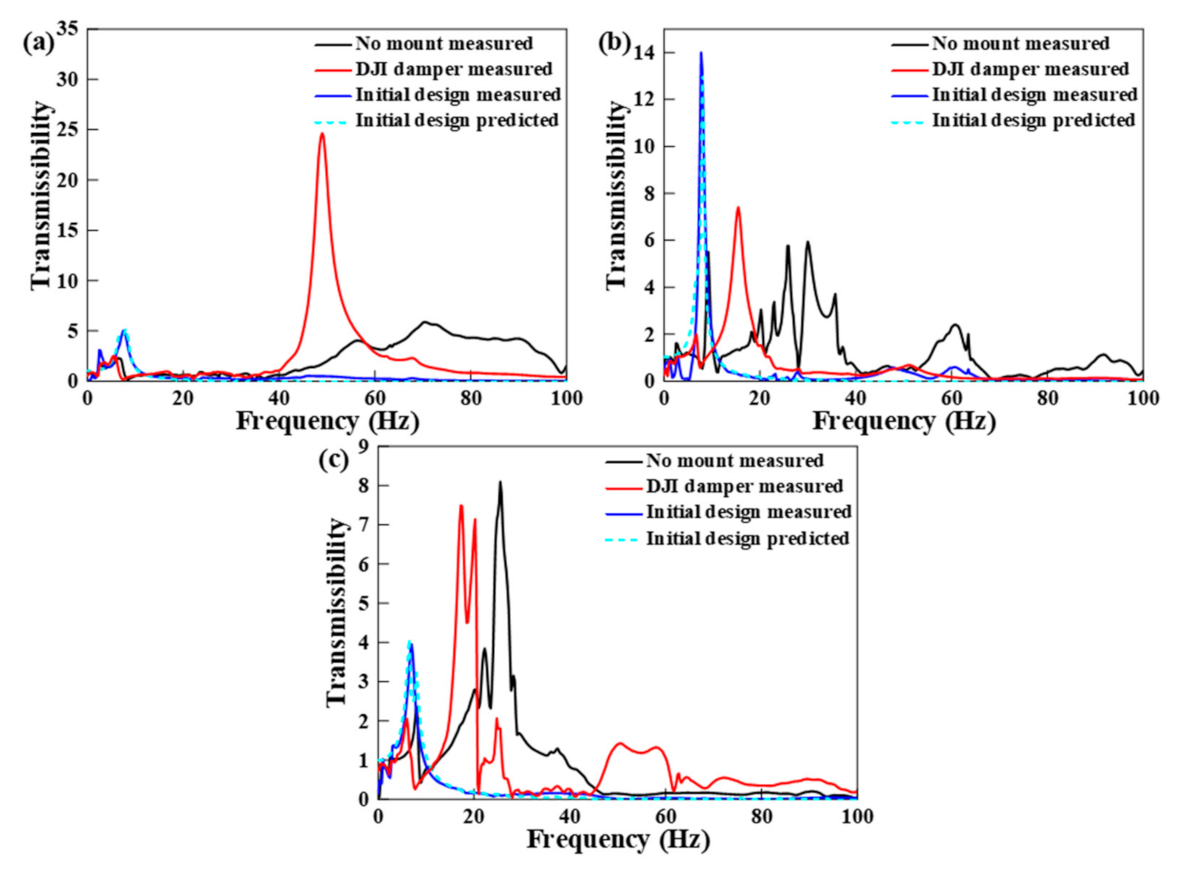
The frequency response functions for the actual drone system were measured in all directions to verify the vibration isolation performance of the proposed design (Figure 6). The same procedure described in Section 4.1 was performed in this analysis. The natural frequency in the vertical direction was 7 Hz (Figure 6c). Moreover, the overall vibration in the vertical direction was reduced from 1.5899RMS (for a gimbal without vibration isolators) and 1.5082RMS (for a gimbal with DJI vibration isolators) to 0.6080RMS in the 0–100 Hz frequency range, where RMS means the root-mean-square. The vibration was decreased by 61.76% (=1 − 0.6080RMS/1.5899RMS) and 59.69% (1 − 0.6080RMS/1.5082RMS) compared to the vibration of a gimbal without vibration isolators and that with DJI vibration isolators owing to the initial design suggestion. The effectiveness of a vibration isolation system in the operating frequencies was verified by comparing the original system with DJI vibration isolators. However, the natural frequency in the three translational directions was observed at similar locations in this configuration. Specifically, the natural frequencies were adjacent to each other at 7.5 Hz, 7.75 Hz, and 7.0 Hz in the fore-after, side-by-side, and vertical directions, respectively. Therefore, the natural frequencies could affect each other. In other words, the natural frequencies of each direction may be mutually amplified in this configuration because the excitation direction of the internally generated force occurs in the vertical direction and in an undefined random direction. These results also suggest that simply adding vibration isolators cannot be an optimal design. Therefore, it is necessary to simultaneously consider horizontal modes and a vertical mode while designing the vibration isolation system.
The response characteristics of the three-DOF system with adjacent natural frequencies for three translational directions were predicted with a coupled multi-DOF model to confirm this hypothesis. Therefore, a mathematical model of a three-DOF system accounting for coupled stiffness and damping can be derived as
m 0 0 0 m 0 0 0 m x ¨ p y ¨ p z ¨ p + c x c x y c x z c x y c y c y z c x z c y z c z x ˙ p y ˙ p z ˙ p + k x k x y k x z k x y k y k y z k x z k y z k z x p y p z p = c x c x y c x z c x y c y c y z c x z c y z c z x ˙ b y ˙ b z ˙ b + k x k x y k x z k x y k y k y z k x z k y z k z x b y b z b ,
where subscripts p and b denote payload, i.e., the surveillance system, and the base, i.e., the drone body. In Equation (25), m , c * , and k * denote the mass of the surveillance system, the equivalent damping coefficients of the vibration isolation system in the * direction, and the equivalent stiffness of the vibration isolation system in the * direction between the drone body and the surveillance system. This equation modified the coupled EOM in general coordinates (Equation (14)) by assuming that a drone body is a base excitation to design a customized vibration isolator. Note that the mass of the vibration isolation system was negligible in this configuration because it was much smaller than that of the surveillance system.
System identification was conducted using the Levenberg-Marquardt algorithm described in Section 2.2 based on this coupled three-DOF model (Equation (25)). The measured frequency response functions were used for system identification. The initial values to be applied in the Levenberg-Marquardt algorithm were determined using reference values from the brochure or measurements. The stiffness information for the commercial mount was approximately 6.6 × 10³ N/m, as mentioned in the specification sheet. The initial damping value was assumed to be 0.1, which is the general known damping ratio of a rubber [23], and the mass was measured using a precision balance. The frequency range below 100 Hz was used. Therefore, we filtered the frequency range that lies above the target range using the ideal low pass filter in the frequency domain when applying the least squares cost function. The results (blue dotted lines in Figure 6) show that estimated parameters correspond well to the experimental results because the correlation coefficients (R) for the fore-after, side-by-side, and vertical directions were 0.91, 0.91, and 0.95, respectively. Parameters estimated from measurement results are described in Table 2. The stiffness elements used for the coupled effects in each direction were assumed to be bounded between 1% and 25% of the stiffness in the main direction. This can be explained by the fact that the coupled-stiffness term observed from the experiment of the rotating machine was 1% to 25% [24,25,26].
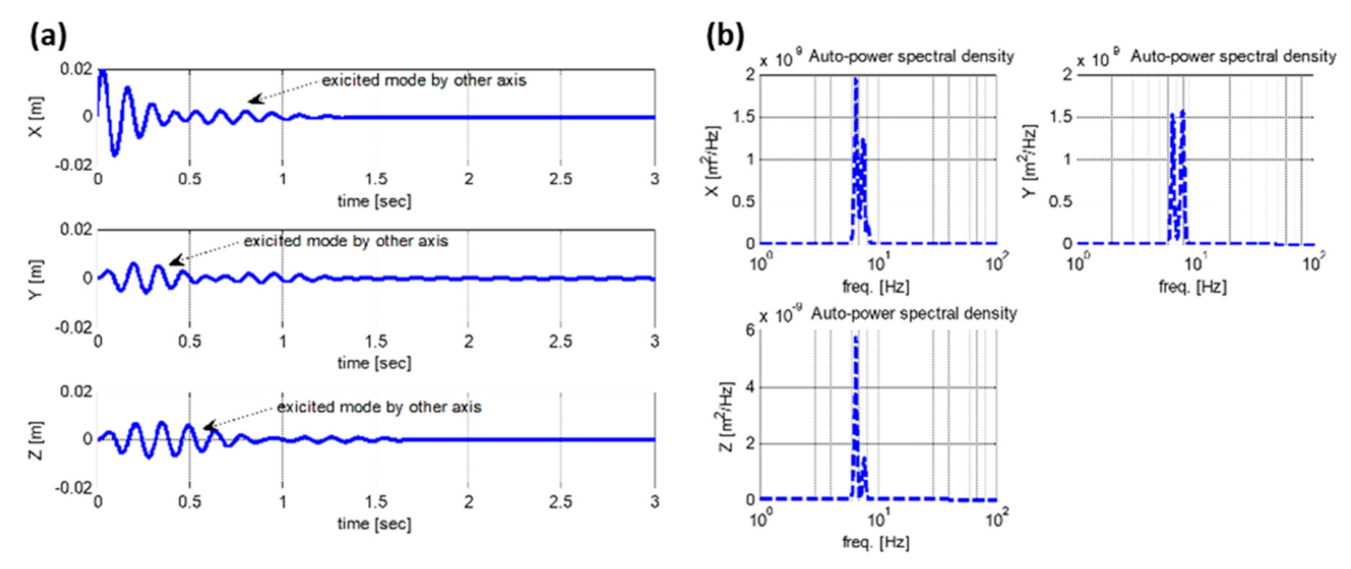
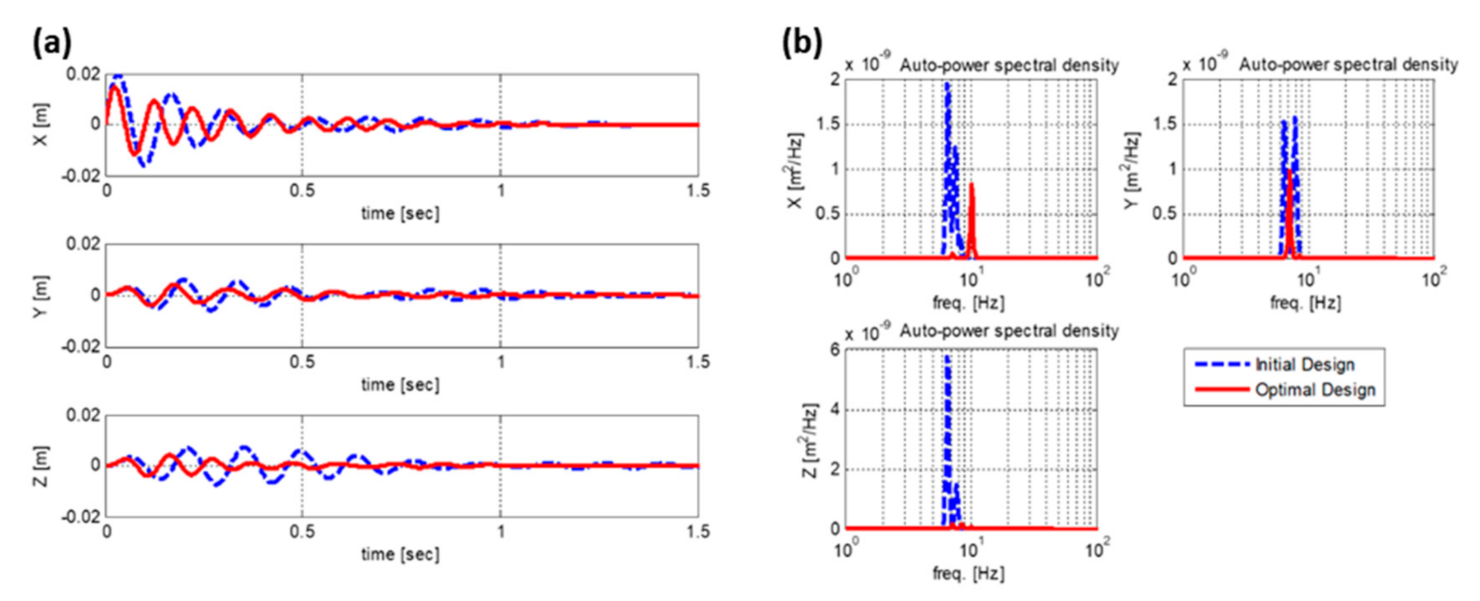
The response characteristics in the time (Figure 7a) and frequency domains (Figure 7b) with the initial velocity, V X 0 , of 1   m / s in the fore-after direction was predicted based on the proposed model with the identified parameters. The transient response of the excitation direction first decreased; however, it increased again during the first second rather than attenuating continuously (Figure 7a). This happened because of the coupling effect from the adjacent natural-frequency excitation in each direction, which caused the vibration-isolation performance to deteriorate. It can be better explained in the frequency domain (Figure 7b). There were two peaks in each coordinate, resulting from the coupled effects in each coordinate. The DJI damper has the lowest stiffness as per the composition of the actual isolation elements, as shown in Figure 6; it is the main factor in determining the natural frequency. Moreover, the symmetrical arrangement and the cylindrical shape of this damper results in the same horizontal stiffness. Therefore, it can be inferred that a similar natural frequency was observed at the fore-after and side-by-side directions, resulting in coupling effects. In other words, the geometric configuration of the initial design creates a situation in which natural frequencies in mutual directions are coupled and adversely affect the performance. Hence, the optimization process should be further improved based on model-based system identification.

4.3. Design Enhancement of Vibration Isolator for a Camera System Deployed in a Drone

The direction of the design optimization can be considered to change the location of the vibration isolators or replace the vibration isolator with various stiffnesses. This study attempts to replace vibration isolators to minimize design change and improve isolation performances. The vibration mode of each direction should be different from decoupling the first natural frequencies in the horizontal directions. However, both modes were translational in the initial design owing to the symmetric configuration of vibration isolators and the lowest stiffness of the DJI damper. Moreover, the stiffness of the vibration isolators on the gimbal side (a red box in Figure 8) should be lower than that of the drone side (a yellow box in Figure 8) to solve this problem. Therefore, the black DJI vibration isolator was removed from the drone body, and two jelly dampers were connected in a series for the surveillance system (yellow and red boxes in Figure 8). This configuration had the main stiffness element on the surveillance side, owing to the softest equivalent stiffness of two jelly dampers in a serial connection. Moreover, a mode of the first natural frequency of the fore-after direction was changed from a translational to a rotational (a purple arrow in Figure 8) because the surveillance system was hung at one point in this direction based on the proposed configuration. On the contrary, a vibration mode of the side-by-side direction was still translational (an azure arrow in Figure 8) because the surveillance system was hung at two points in this direction, implying that a different mode of each direction results in different natural frequencies of each direction. Furthermore, removing the black DJI vibration isolator increased the equivalent stiffness in the vertical direction, resulting in an increase in the natural frequency in the respective direction. In summary, the natural frequency in the side-by-side direction changed minimally owing to the same mode shape compared to an initial design. On the contrary, the first natural frequencies of the fore-after direction significantly changed because the first mode changed from a translation to a rotational mode. The first natural frequency in the vertical direction may also shift to a higher frequency than the initial design owing to an increase in the equivalent stiffness. This configuration aims to maintain constant stiffness in the side-by-side direction. However, stiffness of the fore-after and vertical directions increases, which decouples the natural frequency of all directions.
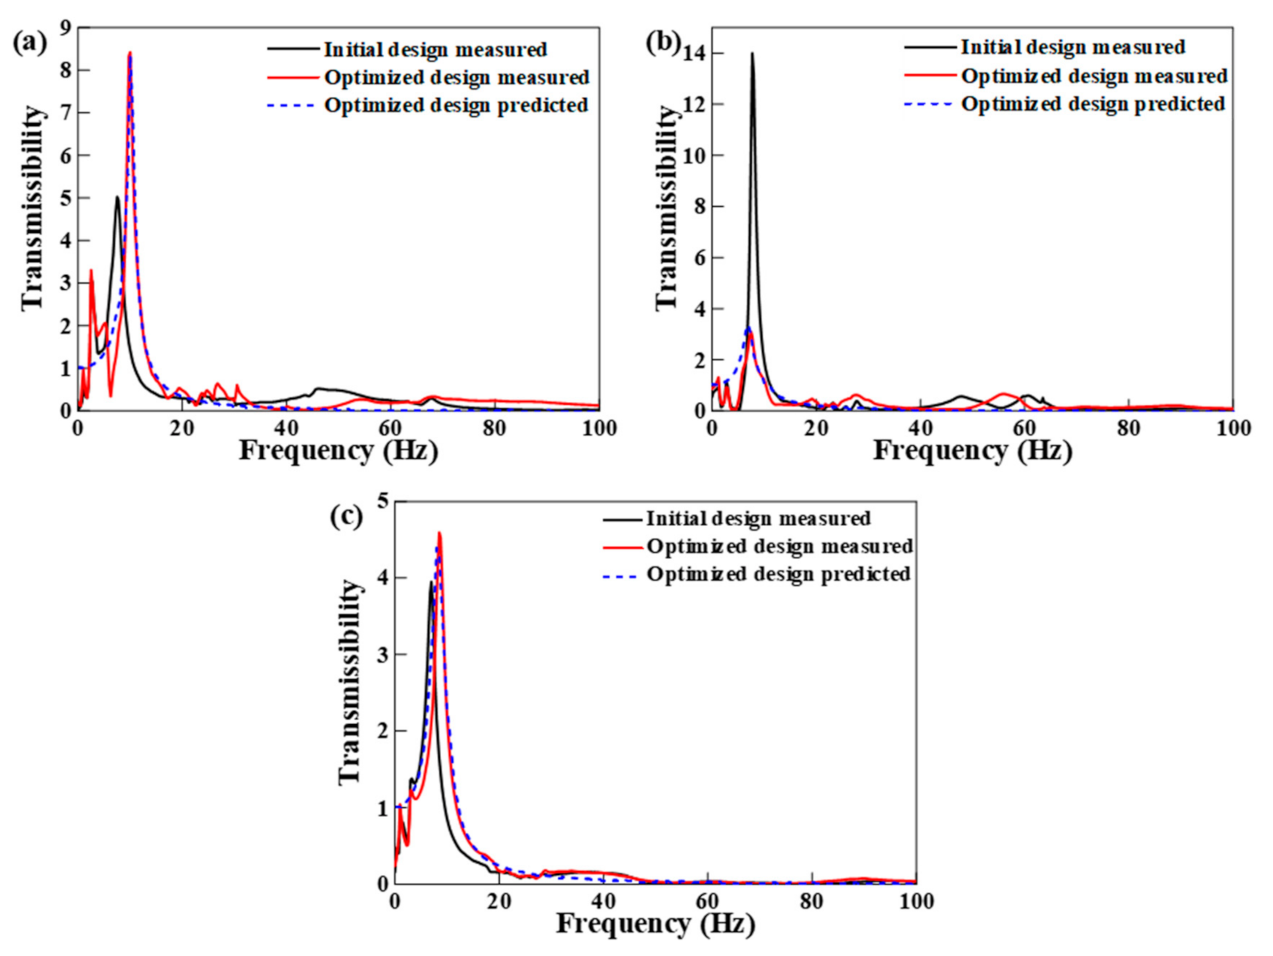
The transmissibility was measured to validate the proposed suggestion (Figure 9). The position of natural frequency ( f N ) was derived from the suggested design and not from the initial design (Table 3). The natural frequencies of the optimal design were 10, 7.5, and 8.5 Hz for each direction; this means that it was separated by more than 1 Hz for each direction and, therefore, coupling effects were reduced compared to the initial design.
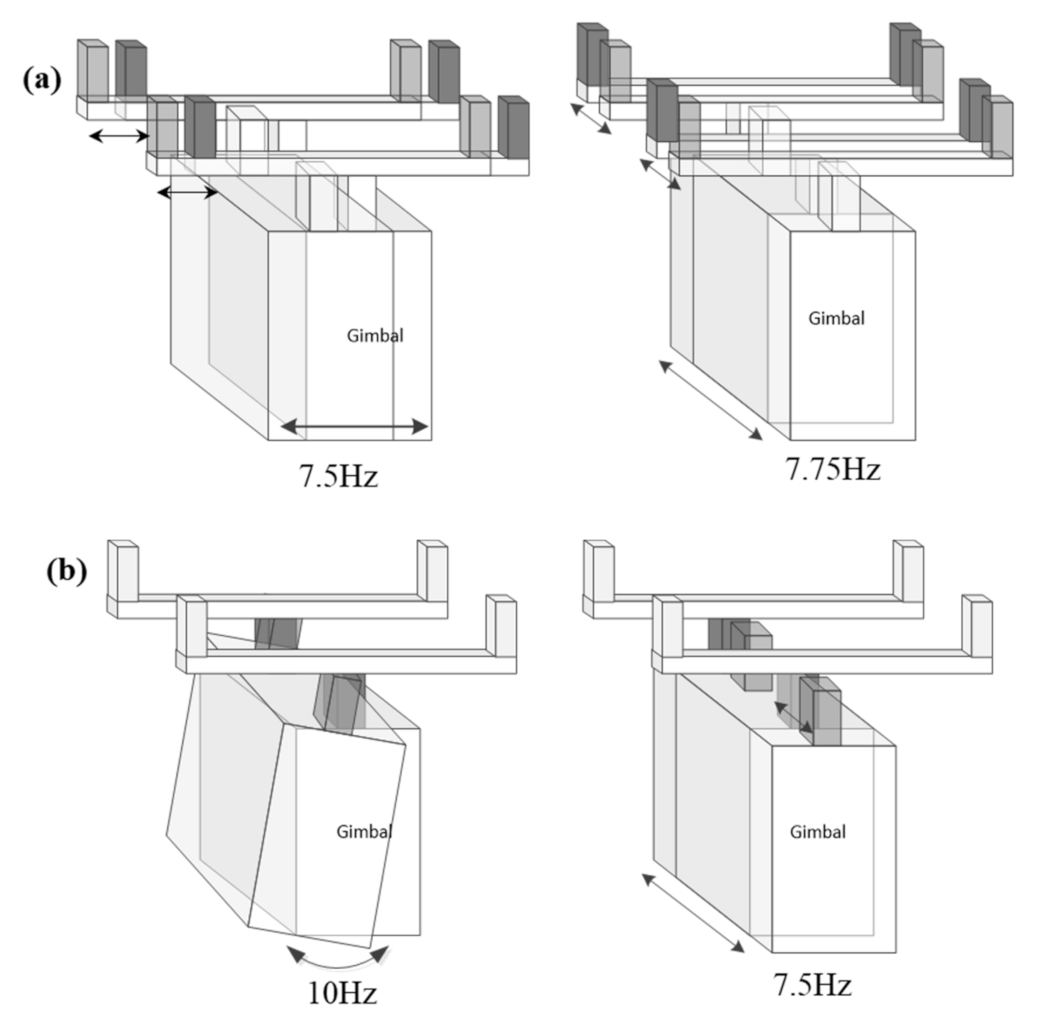
System parameters were identified using the coupled three-DOF model shown in Equation (25) to verify whether this configuration could separate the first natural frequency in each direction while taking the natural frequency position as low as possible. The predicted transmissibility in each direction is shown as blue-dotted lines in Figure 9; this corresponds well with the measurements. From the measurement and prediction, the rigid body mode shape could be estimated as shown in Figure 10. The mode shape caused by the double mount on the side close to the drone body in the initial design was modified toward to the double mount on the side close to the gimbal, and the position of the coupled modes in the horizontal directions was separated, as shown in Figure 9. In addition, in moving the mounts toward the camera gimbal as much as possible, the unwanted vibration amplification of more than 10Hz observed in the isolation frequency range of Figure 3 and Figure 6 was significantly reduced. Specifically, the R of the fore-after, side-by-side, and vertical directions were 0.95, 0.82, 0.97, respectively. Therefore, this model was used to predict responses with the initial velocity, V X 0 , of 1   m / s in the fore-after direction. All assumptions excluding the stiffness change in the natural frequency location redesign were the same; the results are shown in Figure 11. Following the design optimization purpose, the first natural frequency of the side-by-side direction was approximately the same, but it had only one peak (Figure 11). Moreover, the first natural frequency of the fore-after and vertical directions shifted to higher frequency regions compared to the side-by-side direction, suggesting that the natural frequency of each direction was decoupled. This is also shown in the responses in the time domain (Figure 11a). The responses attenuated continuously over a period in all directions, and no coupling effect was seen. It was again proven from the prediction results with the coupled model that the peak value in the time domain decreased. Moreover, the settling time also decreased in all directions for the same condition. Additionally, it can be seen that even in the frequency domain, vibration levels in the range with the highest peak or two simultaneously observed peaks decreased via mode separation.
Finally, the transmissibility of the drone was measured under the operating condition of the take-off motor without the blades. It was compared with the RMS and ratio between a payload and base in the operational frequencies in the range of 30–85 Hz (Table 4). This comparison was aimed to quantitatively examine the level of vibration reduction with the proposed design suggestion. The comparison exemplified two factors. First, introducing the vibration isolator decreased the transmissibility in all directions. Specifically, the surveillance system showed a significant amplification in the fore-after and side-by-side directions when the vibration isolator was not installed in the drone. Second, introducing a jelly damper with the proposed configuration decreased transmissibility in all directions. However, the same stiffness in all directions and symmetric configuration at the initial design resulted in coupling effects, which caused the isolation performance to deteriorate. On the contrary, the suggested design reduced coupling effects of the natural frequency for each coordinate and enhanced the vibration isolation performance. It implied that design optimization with the model-based system identification plays a crucial role in ensuring the performance of the surveillance system. This effect is clearly seen in the vibration ratio between a payload and base. The last row in Table 4 shows that VIP was 98.3%, 94.0%, and 94.6% in the operational range of frequency, i.e., 30–85 Hz, with the presented vibration isolator. However, VIP was 97.4%, 94.1%, and 86% for initial design suggestions in the fore-after, side-by-side, and vertical directions. Note that VIP is defined as a one-ratio of initial or suggested design over that of the original system. This implies that the present design of a vibration isolator shows better VIP than the initial design, suggesting that the proposed method is effective in isolating vibration from rotors.
5. Conclusions

This study presents vibration isolation through mode decoupling based on system identification with a coupled multi-DOF model. Furthermore, the entire process is presented as a countermeasure to minimize the vibration effects on the surveillance system equipped in a drone. Specifically, modal testing indicated that resonances occurred in the operational frequencies at many coordinates. Therefore, vibration isolators should be installed to improve the VIP of the drone. However, the initial design suggestion—a camera system with a rubber-type mount—suffered from a coupling effect on resonance. Specifically, the locations of natural frequencies were overlapped in all directions; this deteriorated the surveillance performance. This analysis suggests that simply adding vibration isolators without reviewing the target system may have adverse effects in some frequency ranges due to the mode coupling. The equivalent stiffness and vibrational mode of each direction were changed to separate vertical and horizontal natural frequencies by rearranging vibration isolators. Finally, the performances of vibration isolators were verified via experimental modal testing. The VIP of the fore-after, side-by-side, and vertical directions was 98.3%, 94.0%, and 94.5%, respectively, within the operational range of frequency, i.e., in 30–85 Hz, with the proposed vibration isolator compared to the original system without a vibration isolator. This corresponds to a 64.7%, 101.1%, and 37.2% decrement in vibration ratio compared to the initial design suggestion of the vibration isolation system, suggesting that the method presented is effective for an intelligent robotic system. Future work includes performance validation with actual field experiments and application of the present method to the nonlinear design problem, such as dynamic amplitude- and preload-dependence, which originates from the viscoelastic material type mount used in this study.

Author Contributions

Methodology: Y.-H.S.; Validation: D.K.; Writing—original draft: Y.-H.S.; Data Curation: S.S.; Writing—review & editing: K.-Y.O.; Visualization: J.-W.H.; Supervision: K.-Y.O.; All authors have read and agreed to the published version of the manuscript.

Funding

This work was supported by the Chung-Ang University Research Scholarship Grants in 2020 and by the Korea Electric Power Corporation (Grant number: R20XO02-5).

Institutional Review Board Statement

Not applicable.

Informed Consent Statement

Not applicable.

Data Availability Statement

Data available on request due to restrictions eg privacy or ethical.

Conflicts of Interest

The authors declare no conflict of interest.

References

  1. Schwab, K. The Fourth Industrial Revolution; Penguin Books Limited: New York, NY, USA, 2017. [Google Scholar]
  2. Petrillo, A.; Felice, F.D.; Cioffi, R.; Zomparelli, F. Fourth industrial revolution: Current practices, challenges, and opportunities. Digit. Transform. Smart Manuf. 2018, 1–20. [Google Scholar] [CrossRef] [Green Version]
  3. Reynders, E. System identification methods for (operational) modal analysis: Review and comparison. Arch. Comput. Methods Eng. 2012, 19, 51–124. [Google Scholar] [CrossRef]
  4. Dong, X.-J.; Meng, G.; Peng, J.-C. Vibration control of piezoelectric smart structures based on system identification and experimental study. J. Sound Vib. 2006, 297, 680–693. [Google Scholar] [CrossRef]
  5. Xia, P.-Q. An inverse model of MR damper using optimal neural network and system identification. J. Sound Vib. 2003, 266, 1009–1023. [Google Scholar] [CrossRef]
  6. Trujillo-Franco, L.G.; Silva-Navarro, G.; Beltran-Carbajal, F.; Campos-Mercado, E.; Abundis-Fong, H.F. On-line modal parameter identification applied to linear and nonlinear vibration absorbers. Actuators 2020, 9, 119. [Google Scholar] [CrossRef]
  7. Hong, X.; Mitchell, R.J.; Chen, S.; Harris, C.J.; Li, K.; Irwin, G.W. Model selection approaches for non-linear system identification: A review. Int. J. Syst. Sci. 2008, 39, 925–946. [Google Scholar] [CrossRef]
  8. Shan, X.; Song, H.; Zhang, C.; Wang, G.; Fan, J. Linear system identification and vibration control of end-effector for industrial robots. Appl. Sci. 2020, 10, 8537. [Google Scholar] [CrossRef]
  9. Verma, M.; Collette, C. Active vibration isolation system for drone cameras. In Proceedings of the 14th International Conference on Vibration Problems, Crete, Greece, 1–4 September 2019; Springer: Singapore, 2019; pp. 1067–1084. [Google Scholar]
  10. Brossard, J.; Bensoussan, D.; Landry, R.; Hammami, M. Robustness studies on quadrotor control. In Proceedings of the 2019 International Conference on Unmanned Aircraft Systems, Atlanta, GA, USA, 11–14 June 2019; pp. 344–352. [Google Scholar]
  11. Mystkowski, A. An application of mu-synthesis for control of a small air vehicle and simulation results. J. Vibroeng. 2012, 14, 79–86. [Google Scholar]
  12. Tunik, A.A.; Nadsadnaya, O.I. A flight control system for small unmanned aerial vehicle. Int. Appl. Mech. 2018, 54, 239–247. [Google Scholar] [CrossRef]
  13. Jeong, S.; Kim, D.; Kim, S.; Ham, J.-W.; Lee, J.-K.; Oh, K.-Y. Real-time environmental cognition and sag estimation of transmission lines using UAV equipped with 3-D lidar system. IEEE Trans. Power Deliv. 2020. [Google Scholar] [CrossRef]
  14. Kane, T.R.; Levinson, D.A. Dynamics: Theory and Applications; McGraw Hill: New York, NY, USA, 2005. [Google Scholar]
  15. Inman, D.J. Engineering Vibration, 4th ed.; Pearson: New York, NY, USA, 2014. [Google Scholar]
  16. Marquardt, D. An algorithm for least-squares estimation of nonlinear parameters. J. Soc. Ind. Appl. Math. 1963, 11, 431–441. [Google Scholar] [CrossRef]
  17. More, J. The Levenberg-Marquardt algorithm: Implementation and theory. Numer. Anal. 1978, 630, 105–116. [Google Scholar]
  18. Bendat, J.S.; Piersol, A.G. Random Data: Analysis and Measurement Procedures, 4th ed.; John Wiley & Sons, Inc: New York, NY, USA, 2010. [Google Scholar]
  19. Ewins, D.J. Modal Testing: Theory, Practice, and Application, 2nd ed.; Wiley: New York, NY, USA, 2009. [Google Scholar]
  20. Kim, S.; Kim, D.-G.; Jung, S.-H.; Ham, J.-W.; Lee, J.-K.; Oh, K.-Y. Fault diagnosis of power transmission lines using a UAV-mounted smart inspection system. IEEE Access 2020, 8, 149999–150009. [Google Scholar] [CrossRef]
  21. Park, J.-Y.; Kim, S.-T.; Lee, J.-K.; Ham, J.-W.; Oh, K.-Y. Method of operating a GIS-based autopilot drone to inspect ultrahigh voltage power lines and its field tests. J. Field Robot. 2020, 37, 345–361. [Google Scholar] [CrossRef]
  22. Shin, Y.-H.; Moon, S.-J.; Kim, Y.-J.; Oh, K.-Y. Vibration control of scanning electron microscopes with experimental approaches for performance enhancement. Sensors 2020, 20, 2277. [Google Scholar] [CrossRef] [PubMed] [Green Version]
  23. De Silva, C.W. Vibration: Fundamentals and Practice; CRC Press LLC.: Boca Raton, FL, USA, 2000. [Google Scholar]
  24. Kulhanek, C.D.; Childs, D.W. Measured static and rotordynamic coefficient results for a rocker-pivot, tilting-pad bearing with 50 and 60% offsets. J. Eng. Gasturbines Power 2012, 134, 052505. [Google Scholar] [CrossRef]
  25. Suh, J.; Palazzolo, A. Three-dimensional dynamic model of TEHD tilting-pad journal bearing—Part I: Theoretical modeling. J. Tribol. 2015, 137, 041703. [Google Scholar] [CrossRef]
  26. Synnegård, E.; Gustavsson, R.; Aidanpää, J.-O. Influence of cross-coupling stiffness in tilting pad journal bearings for vertical machines. Int. J. Mech. Sci. 2016, 111–112, 43–54. [Google Scholar]
Figure 1. A free body diagram of (a) general and (b) coupled two-degree-of-freedom system.
Applsci 11 01961 g001
Figure 2. Experimental set-up for the transmissibility measurement.
Applsci 11 01961 g002
Figure 3. Measured transmissibility with modal testing: (a) fore-after direction, (b) side-by-side direction, and (c) vertical direction.
Applsci 11 01961 g003
Figure 4. Vibration pathway of a surveillance system in a drone: (a) original pathway and (b) proposed pathway.
Applsci 11 01961 g004
Figure 5. Configuration of selected mounts for the gimbal system.
Applsci 11 01961 g005
Figure 6. Comparison of transmissibility before and after applying mount elements: (a) fore-after direction, (b) side-by-side direction, and (c) vertical direction.
Applsci 11 01961 g006
Figure 7. Simulation results of the coupled three‒DOF mathematical model in (a) the time domain and (b) in the frequency domain.
Applsci 11 01961 g007
Figure 8. Optimal design of vibration isolators.
Applsci 11 01961 g008
Figure 9. Comparison of transmissibility before and after the mount design modification in (a) fore-after, (b) side-by-side, and (c) vertical directions.
Applsci 11 01961 g009
Figure 10. Mode shape of rigid body modes for (a) initial and (b) optimal designs from measurement and prediction.
Applsci 11 01961 g010
Figure 11. Simulation results of the coupled three‒DOF mathematical model between initial and optimal designs in (a) the time domain and (b) the frequency domain.
Applsci 11 01961 g011
Table 1. Natural frequency ( f N ) and its amplitude ( M f N ) in transmissibility.
AxisXYZ
N t h   Frequency f N (Hz) M f N f N (Hz) M f N f N (Hz) M f N
1st2.51.8462.751.6091.01.02
2nd6.52.2659.255.49982.356
3rd56.254.029305.93922.253.842
4th70.255.87435.753.71625.58.094
5th85.254.24360.252.40737.51.294
Table 2. Estimated parameters for a three-degree-of-freedom (DOF) coupled model.
ItemValueItemValueItemValueItemValue
m3.4 kg
k x 7.55 × 10³ N/m c x 15.94 Ns/m k x y 0.78 × 10³ N/m c x y 1.08 Ns/m
k y 8.06 × 10³ N/m c y 5.71 Ns/m k y z 0.75 × 10³ N/m c y z 2.15 Ns/m
k z 6.96 × 10³ N/m c z 37.25 Ns/m k x z 0.73 × 10³ N/m c x z 2.66 Ns/m
Table 3. Comparison of natural frequencies of the initial and optimal designs.
System TypeFore-After DirectionSide-by-Side DirectionVertical Direction
f N (Hz) NoInitialOptimalNoInitialOptimalNoInitialOptimal
1st 2.52.52.52.752.752.751.01.01.0
2nd
(rigid body mode)
6.257.5109.257.757.58.07.08.5
3rd56.25--30.0--22.5--
4th 70.25 35.75 25.5
Table 4. Comparison of the root-mean-square (RMS), the ratio between a payload and base, and vibration isolation performance (VIP) in the frequency range of 30–85 Hz.
Original SystemInitial DesignSuggested Design
XYZXYZXYZ
RMS ( M S 2 ) Base0.0720.0780.2070.0890.0910.1870.0690.0740.215
Payload0.2300.1190.0610.0080.0080.0080.0040.0070.004
Ratio ( P a y l o a d B a s e ) 3.1901.5170.2920.0850.0900.0430.0550.0910.016
VIP---97.4%94.1%86%98.3%94.0%94.6%
Publisher’s Note: MDPI stays neutral with regard to jurisdictional claims in published maps and institutional affiliations.