
Traits versus Grades—The Incremental Predictive Power of Positive Psychological Factors over Pre-Enrollment Achievement Measures on Academic Performance


Abstract
1. Introduction
- What incremental predictive power do certain psychological factors (e.g., personality traits and positive source competencies as emotional intelligence, coping skills, psychological immunity, grit, and PERMA) have over pre-enrollment achievement measures on academic success?
- What set of psychological factors should be measured at the time of enrollment that make identifying students at risk of academic failure more efficient?
2. Materials and Methods
2.1. Participants
2.2. Measures
2.3. Methods
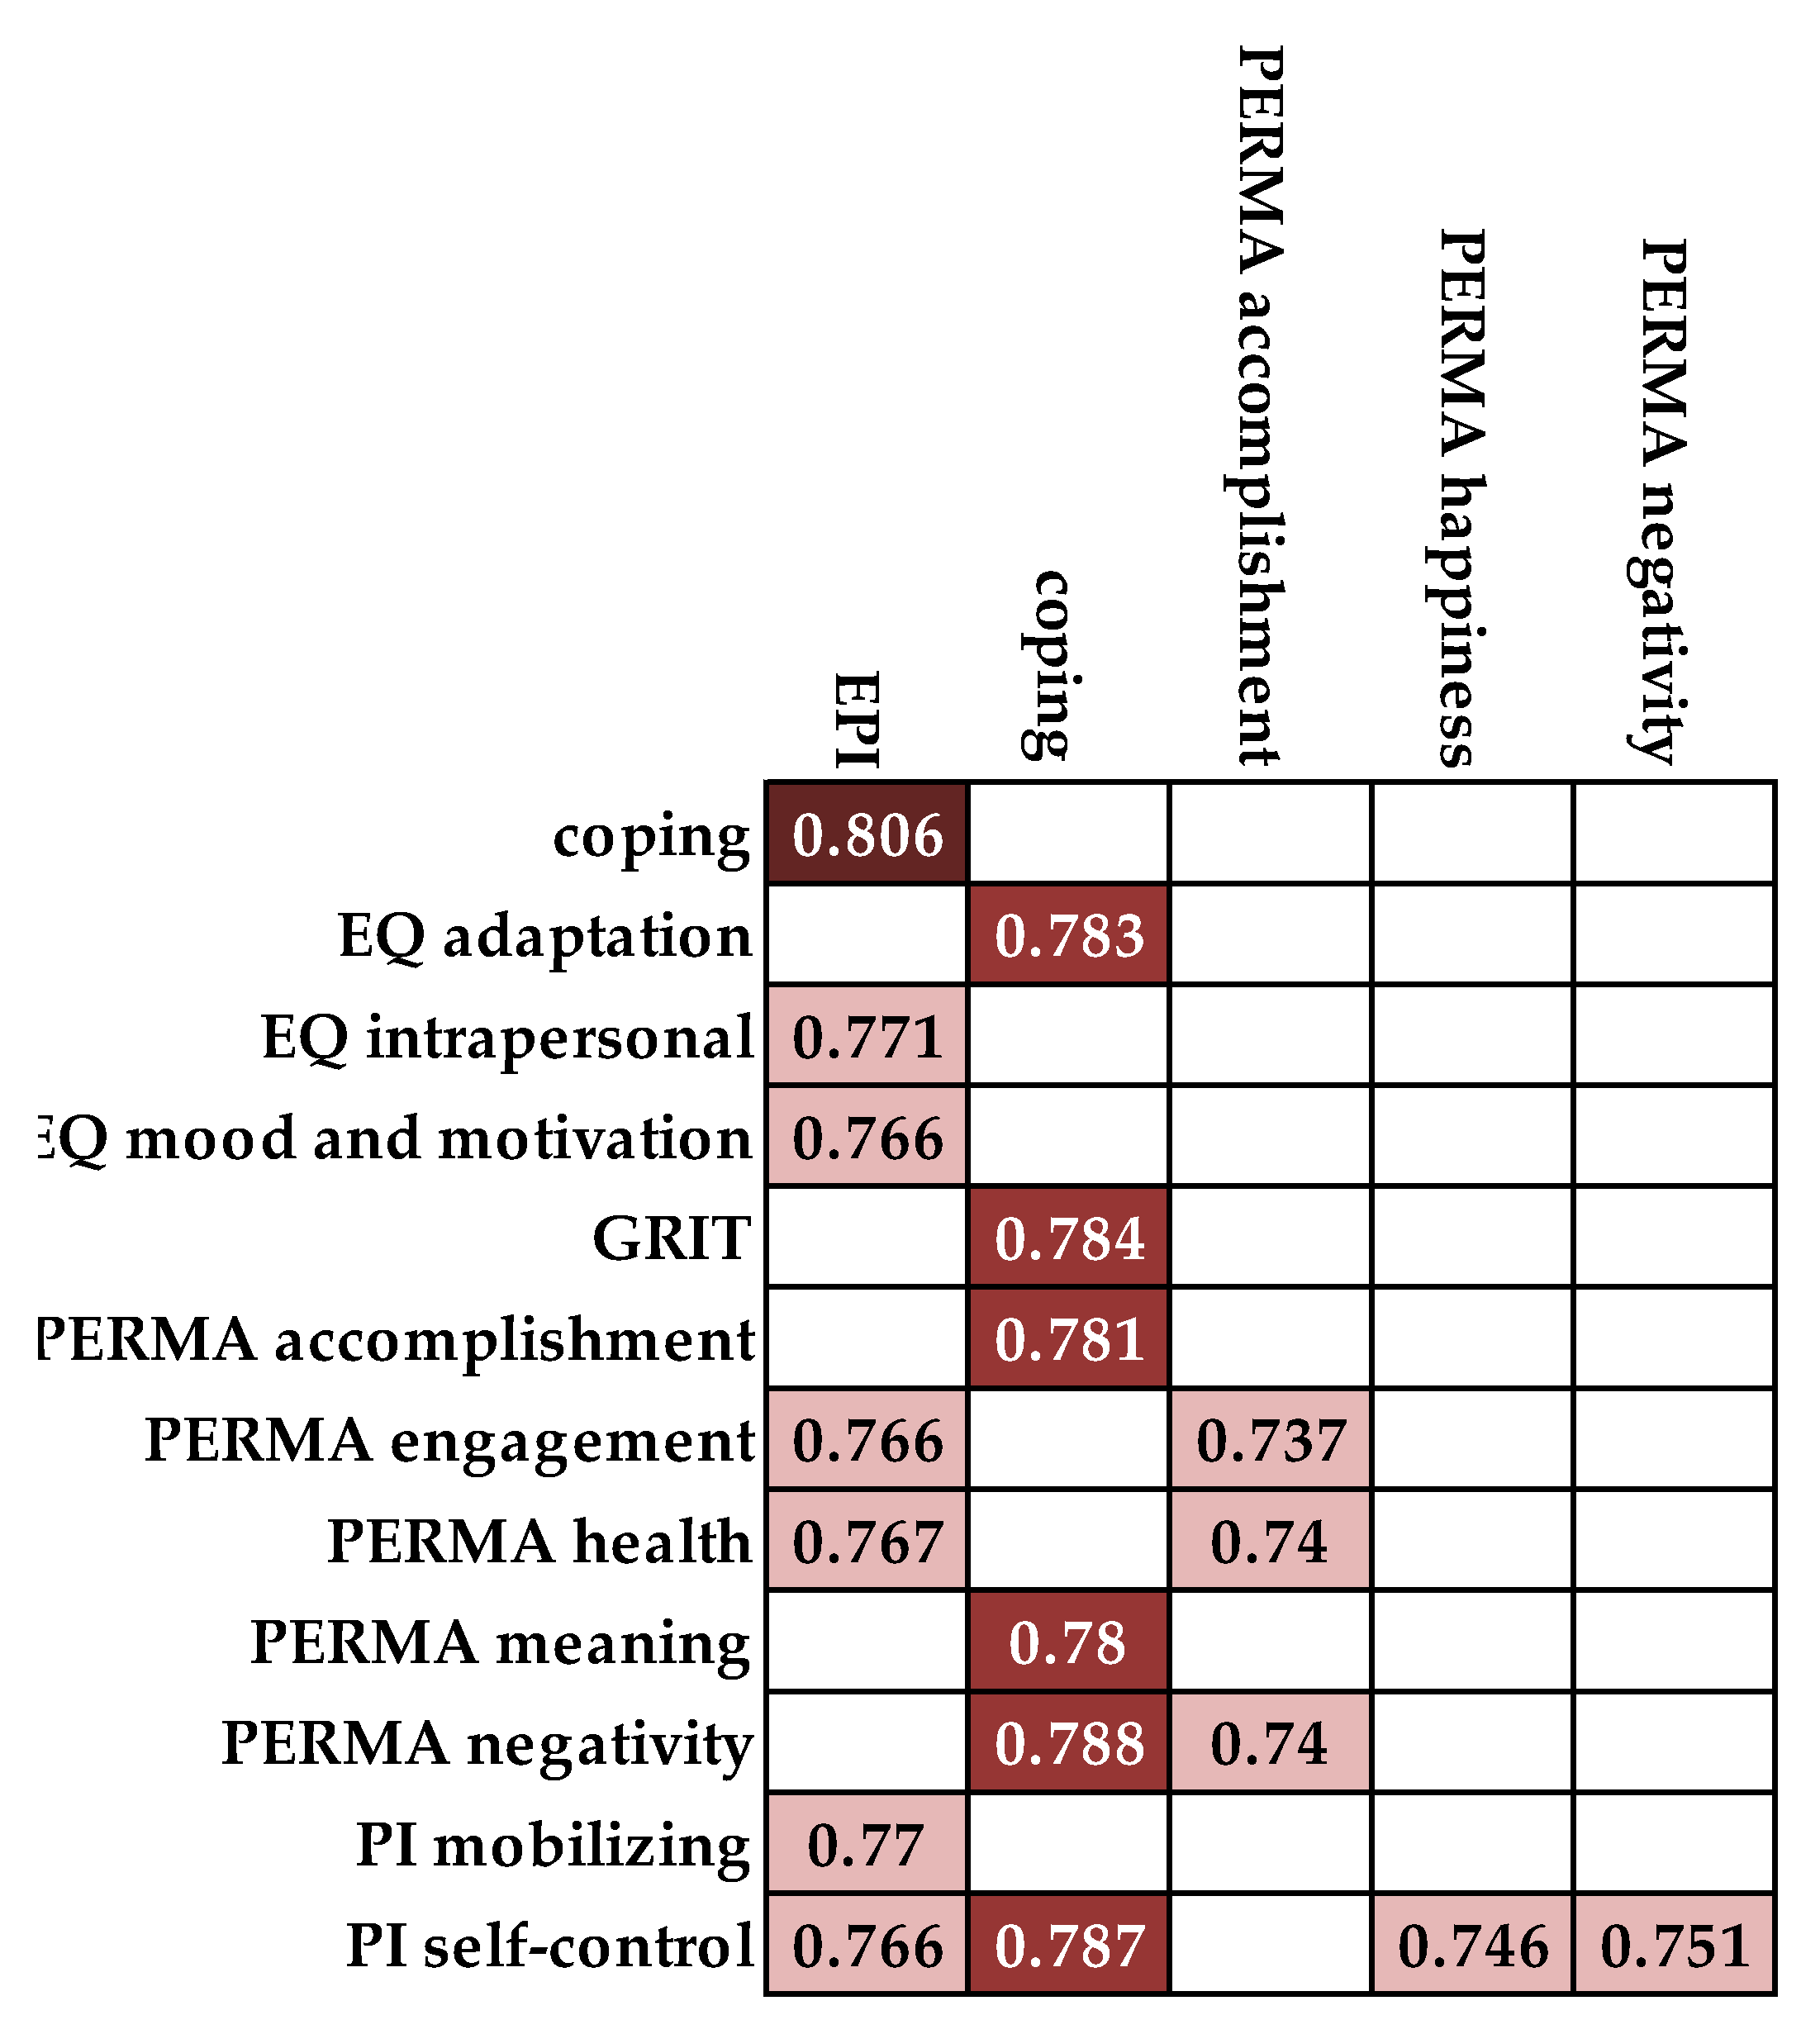
3. Results
3.1. Positive Psychological Factors
3.2. Stable Personality Factors
3.3. Incremental Predictive Power of Factor Groups
3.3.1. Incremental Predictive Power of Factor Groups: Pairs
3.3.2. Incremental Predictive Power of Factor Groups: Triplets
3.3.3. Incremental Power of Factor Groups: Quadruplets
3.3.4. Incremental Power of Factor Groups: Quintuplets and Sextuplets
3.4. Summary of the Results
4. Discussion
Limitations, Future Research Directions, and Implications
Author Contributions
Funding
Institutional Review Board Statement
Informed Consent Statement
Data Availability Statement
Acknowledgments
Conflicts of Interest
References
- Kumar, M.; Singh, A.; Handa, D. Literature Survey on Educational Dropout Prediction. Int. J. Educ. Manag. Eng. 2017, 7, 8–19. [Google Scholar] [CrossRef]
- Alyahyan, E.; Düştegör, D. Predicting academic success in higher education: Literature review and best practices. Int. J. Educ. Technol. High. Educ. 2020, 17, 1–21. [Google Scholar] [CrossRef]
- Rastrollo-Guerrero, J.L.; Gómez-Pulido, J.A.; Durán-Domínguez, A. Analyzing and Predicting Students’ Performance by Means of Machine Learning: A Review. Appl. Sci. 2020, 10, 1042. [Google Scholar] [CrossRef]
- Von Hippel, P.T.; Hofflinger, A. The data revolution comes to higher education: Identifying students at risk of dropout in Chile. J. High. Educ. Policy Manag. 2020, 1–22. [Google Scholar] [CrossRef]
- Ranjeeth, S.; Latchoumi, T.; Paul, P.V. A Survey on Predictive Models of Learning Analytics. Proc. Comput. Sci. 2020, 167, 37–46. [Google Scholar] [CrossRef]
- Nagy, M.; Molontay, R. Predicting Dropout in Higher Education Based on Secondary School Performance. In Proceedings of the 2018 IEEE 22nd International Conference on Intelligent Engineering Systems (INES), Las Palmas de Gran Canaria, Spain, 21–23 June 2018; pp. 389–394. [Google Scholar]
- Schneider, M.; Preckel, F. Variables associated with achievement in higher education: A systematic review of meta-analyses. Psychol. Bull. 2017, 143, 565–600. [Google Scholar] [CrossRef] [PubMed]
- Zhou, K. Non-cognitive skills: Potential candidates for global measurement. Eur. J. Educ. 2017, 52, 487–497. [Google Scholar] [CrossRef]
- Khan, Z.N. Cognitive and Non-Cognitive Characteristics as Determinants of Success in Professional Courses at Undergraduate Stage. J. Soc. Sci. 2009, 5, 212–215. [Google Scholar] [CrossRef][Green Version]
- Chamorro-Premuzic, T.; Furnham, A. Personality and Intellectual Competence. In Personality and Intellectual Competence; Routledge: New York, NY, USA, 2014. [Google Scholar]
- O’Connor, M.C.; Paunonen, S.V. Big Five personality predictors of post-secondary academic performance. Pers. Individ. Differ. 2007, 43, 971–990. [Google Scholar] [CrossRef]
- Poropat, A.E. A meta-analysis of the five-factor model of personality and academic performance. Psychol. Bull. 2009, 135, 322–338. [Google Scholar] [CrossRef] [PubMed]
- Richardson, M.; Abraham, C.; Bond, R. Psychological correlates of university students’ academic performance: A systematic review and meta-analysis. Psychol. Bull. 2012, 138, 353–387. [Google Scholar] [CrossRef] [PubMed]
- Ninrutsirikun, U.; Imai, H.; Watanapa, B.; Arpnikanondt, C. Principal Component Clustered Factors for Determining Study Performance in Computer Programming Class. Wirel. Pers. Commun. 2020, 12, 1–20. [Google Scholar] [CrossRef]
- Busato, V.V.; Prins, F.J.; Elshout, J.J.; Hamaker, C. Intellectual ability, learning style, personality, achievement motivation and academic success of psychology students in higher education. Pers. Individ. Differ. 2000, 29, 1057–1068. [Google Scholar] [CrossRef]
- Rothstein, M.G.; Paunonen, S.V.; Rush, J.C.; King, G.A. Personality and cognitive ability predictors of performance in graduate business school. J. Educ. Psychol. 1994, 86, 516–530. [Google Scholar] [CrossRef]
- Dur, K. Study of impact of personality traits on academic performance of management students. J. Organ. Hum. Behav. 2018, 7, 43–56. [Google Scholar]
- Potgieter, I.; Coetzee, M. Employability attributes and personality preferences of postgraduate business management students. SA J. Ind. Psychol. 2013, 39, 10. [Google Scholar] [CrossRef]
- Eysenck, H.J.; Eysenck, M.W. Personality and Individual Differences; Springer International Publishing: New York, NY, USA, 1985. [Google Scholar]
- Chamorro-Premuzic, T.; Furnham, A. Personality predicts academic performance: Evidence from two longitudinal university samples. J. Res. Pers. 2003, 37, 319–338. [Google Scholar] [CrossRef]
- Ridgell, S.D.; Lounsbury, J.W. Predicting academic success: General intelligence, ’Big Five’ personality traits, and work drive. Coll. Stud. J. 2004, 38, 607–619. [Google Scholar]
- Eysenck, H. Dimensions of personality: 16, 5 or 3?—Criteria for a taxonomic paradigm. Pers. Individ. Differ. 1991, 12, 773–790. [Google Scholar] [CrossRef]
- Eysenck, H. Four ways five factors are not basic. Pers. Individ. Differ. 1992, 13, 667–673. [Google Scholar] [CrossRef]
- Kappe, R.; Van Der Flier, H. Predicting academic success in higher education: What’s more important than being smart? Eur. J. Psychol. Educ. 2012, 27, 605–619. [Google Scholar] [CrossRef]
- Sarbin, T.R.; McClelland, D.C.; Atkinson, J.W.; Clark, R.A.; Lowell, E.L. The Achievement Motive. Am. J. Psychol. 1955, 68, 686. [Google Scholar] [CrossRef]
- Schunk, D.H.; Pintrich, P.R.; Meece, J.L. Motivation in Education: Theory, Research, and Applications, 3rd ed.; Pearson/Merrill Prentice Hall: Upper Saddle River, NJ, USA, 2008. [Google Scholar]
- Bar-On, R. Emotional Intelligence: An Integral Part of Positive Psychology. S. Afr. J. Psychol. 2010, 40, 54–62. [Google Scholar] [CrossRef]
- Ahmed, Z.; Asim, M.; Pellitteri, J. Emotional intelligence predicts academic achievement in Pakistani management students. Int. J. Manag. Educ. 2019, 17, 286–293. [Google Scholar] [CrossRef]
- Billings, C.E.; Downey, L.A.; Lomas, J.E.; Lloyd, J.; Stough, C. Emotional Intelligence and scholastic achievement in pre-adolescent children. Pers. Individ. Differ. 2014, 65, 14–18. [Google Scholar] [CrossRef]
- Reyes, M.R.; Brackett, M.A.; Rivers, S.E.; White, M.; Salovey, P. Classroom emotional climate, student engagement, and academic achievement. J. Educ. Psychol. 2012, 104, 700–712. [Google Scholar] [CrossRef]
- Costa, A.C.; Faria, L. The impact of Emotional Intelligence on academic achievement: A longitudinal study in Portuguese secondary school. Learn. Individ. Differ. 2015, 37, 38–47. [Google Scholar] [CrossRef]
- Parker, J.D.; Summerfeldt, L.J.; Hogan, M.J.; Majeski, S.A. Emotional intelligence and academic success: Examining the transition from high school to university. Pers. Individ. Differ. 2004, 36, 163–172. [Google Scholar] [CrossRef]
- Labby, S.; Lunenburg, F.C.; Slate, J.R. Emotional Intelligence and Academic Success: A Conceptual Analysis for Educational Leaders. Int. J. Educ. Leadersh. Prep. 2012, 7, 1–11. Available online: http://files.eric.ed.gov/fulltext/EJ971568.pdf (accessed on 2 November 2019).
- Sharon, D.; Greenberg, K. Does the level of emotional intelligence affect the degree of success in nursing studies? Nurse Educ. Today 2018, 64, 21–26. [Google Scholar] [CrossRef]
- Saklofske, D.H.; Austin, E.J.; Mastoras, S.M.; Beaton, L.; Osborne, S.E. Relationships of personality, affect, emotional intelligence and coping with student stress and academic success: Different patterns of association for stress and success. Learn. Individ. Differ. 2012, 22, 251–257. [Google Scholar] [CrossRef]
- Mac Cann, C.; Lipnevich, A.A.; Burrus, J.; Roberts, R.D. The best years of our lives? Coping with stress predicts school grades, life satisfaction, and feelings about high school. Learn. Individ. Differ. 2012, 22, 235–241. [Google Scholar] [CrossRef]
- Duckworth, A.L.; Peterson, C.; Matthews, M.D.; Kelly, D.R. Grit: Perseverance and passion for long-term goals. J. Pers. Soc. Psychol. 2007, 92, 1087–1101. [Google Scholar] [CrossRef]
- Rimfeld, K.; Kovas, Y.; Dale, P.S.; Plomin, R. True grit and genetics: Predicting academic achievement from personality. J. Pers. Soc. Psychol. 2016, 111, 780–789. [Google Scholar] [CrossRef] [PubMed]
- Duckworth, A.L.; Gross, J.J. Self-Control and Grit. Curr. Dir. Psychol. Sci. 2014, 23, 319–325. [Google Scholar] [CrossRef] [PubMed]
- Oláh, A. Health protective and health-promoting resources in personality: A framework for the measurement of the psychological immune system. In Positive Psychology Meeting, Quality of Life Research Center; Claremont Graduate University: Claremont, CA, USA, 2000. [Google Scholar]
- Seligman, M.E.P. Flourish: A Visionary New Understanding of Happiness and Well-Being; Free Press: New York, NY, USA, 2011. [Google Scholar]
- Butler, J.; Kern, M.L. The PERMA-Profiler: A brief multidimensional measure of flourishing. Int. J. Wellbeing 2016, 6, 1–48. [Google Scholar] [CrossRef]
- Lyubomirsky, S.; King, L.; Diener, E. The Benefits of Frequent Positive Affect: Does Happiness Lead to Success? Psychol. Bull. 2005, 131, 803–855. [Google Scholar] [CrossRef] [PubMed]
- Kern, M.L.; Waters, L.E.; Adler, A.; White, M.A. A multidimensional approach to measuring well-being in students: Application of the PERMA framework. J. Posit. Psychol. 2015, 10, 262–271. [Google Scholar] [CrossRef]
- Dewitz, S.J.; Woolsey, M.L.; Walsh, W.B. College Student Retention: An Exploration of the Relationship Between Self-Efficacy Beliefs and Purpose in Life Among College Students. J. Coll. Stud. Dev. 2009, 50, 19–34. [Google Scholar] [CrossRef]
- Trigwell, K.; Ellis, R.A.; Han, F. Relations between students’ approaches to learning, experienced emotions and outcomes of learning. Stud. High. Educ. 2012, 37, 811–824. [Google Scholar] [CrossRef]
- Tansey, T.N.; Smedema, S.; Umucu, E.; Iwanaga, K.; Wu, J.-R.; Cardoso, E.D.S.; Strauser, D. Assessing College Life Adjustment of Students with Disabilities: Application of the PERMA Framework. Rehabil. Couns. Bull. 2017, 61, 131–142. [Google Scholar] [CrossRef]
- Bergold, S.; Steinmayr, R. Personality and Intelligence Interact in the Prediction of Academic Achievement. J. Intell. 2018, 6, 27. [Google Scholar] [CrossRef]
- Eysenck, H.J.; Eysenck, S.B.G. Manual of the Eysenck Personality Inventory; University of London Press: London, UK, 1964. [Google Scholar]
- Eysenck, H.J.; Eysenck, S.B.G. Manual of the Eysenck Personality Questionnaire (Junior and Adult); Hodder & Stoughton: London, UK, 1975. [Google Scholar]
- Eysenck, H.J.; Eysenck, S.B.G. Manual of the Eysenck Personality Scales; Hodder & Stoughton: London, UK, 1991. [Google Scholar]
- Miles, J.; Hempel, S. The Eysenck Personality Scales: The Eysenck Personality Questionnaire-Revised (EPQ-R) and the Eysenck Personality Profiler (EPP). In Comprehensive Handbook of Psychological Assessment: Personality Assessment; Hilsenroth, M.J., Segal, D.L., Eds.; Jon Wiley & Sons: Hoboken, NJ, USA, 2003; Volume 2, pp. 99–107. [Google Scholar]
- Bar-On, R. The Emotional Quotient Inventory (EQ-i): A Test of Emotional Intelligence; Multi-Health Systems, Inc.: Toronto, ON, Canada, 1997. [Google Scholar]
- Bar-On, R. The Emotional Quotient Inventory (EQ-i): Technical Manual; Multi-Health Systems, Inc.: Toronto, ON, Canada, 1997. [Google Scholar]
- Bar-On, R. The Bar-On Emotional Quotient Inventory (EQ-i): Rationale, description and psychometric properties. In Measuring Emotional Intelligence: Common Ground and Controversy; Geher, G., Ed.; Hauppauge, Nova Science: New York, NY, USA, 2004. [Google Scholar]
- Bar-On, R. The Bar-On model of emotional-social intelligence (ESI). Psicothema 2006, 18, 13–25. [Google Scholar]
- Duckworth, A.L.; Quinn, P.D. Development and Validation of the Short Grit Scale (Grit–S). J. Pers. Assess. 2009, 91, 166–174. [Google Scholar] [CrossRef] [PubMed]
- Oláh, A. Érzelmek, Megküzdés és Optimális Élmény; Trefort Kiadó: Budapest, Hungary, 2005. [Google Scholar]
- Oláh, A. Coping strategies among adolescents: A cross-cultural study. J. Adolesc. 1995, 18, 491–512. [Google Scholar] [CrossRef]
- Oláh, A. Positive Traits: Flow and Psychological Immunity. In Proceedings of the First International Positive Psychology Summit, Washington, DC, USA, 3–6 October 2002. [Google Scholar]
- Oláh, A. Psychological immunity: A new concept in coping with stress. Appl. Psychol. Hung. 2004, 56, 149–189. [Google Scholar]
- Nagy, M.; Molontay, R. Comprehensive analysis of the predictive validity of the university entrance score in Hungary. Assess. Evaluation High. Educ. 2021, 1–19. [Google Scholar] [CrossRef]
- Friedman, J.; Hastie, T.; Tibshirani, R. The Elements of Statistical Learning; Springer Series in Statistics: New York, NY, USA, 2001. [Google Scholar]
- Vivo, J.-M.; Franco, M. How does one assess the accuracy of academic success predictors? ROC analysis applied to university entrance factors. Int. J. Math. Educ. Sci. Technol. 2008, 39, 325–340. [Google Scholar] [CrossRef]
- Hanley, J.A.; McNeil, B.J. The meaning and use of the area under a receiver operating characteristic (ROC) curve. Radiology 1982, 143, 29–36. [Google Scholar] [CrossRef]
- Hand, D.J. Measuring classifier performance: A coherent alternative to the area under the ROC curve. Mach. Learn. 2009, 77, 103–123. [Google Scholar] [CrossRef]
- MacCann, C.; Fogarty, G.J.; Zeidner, M.; Roberts, R.D. Coping mediates the relationship between emotional intelligence (EI) and academic achievement. Contemp. Educ. Psychol. 2011, 36, 60–70. [Google Scholar] [CrossRef]
- Bonneville-Roussy, A.; Evans, P.; Verner-Filion, J.; Vallerand, R.J.; Bouffard, T. Motivation and coping with the stress of assessment: Gender differences in outcomes for university students. Contemp. Educ. Psychol. 2017, 48, 28–42. [Google Scholar] [CrossRef]
- Crego, A.; Carrillo-Diaz, M.; Armfield, J.M.; Romero, M. Stress and Academic Performance in Dental Students: The Role of Coping Strategies and Examination-Related Self-Efficacy. J. Dent. Educ. 2016, 80, 165–172. [Google Scholar] [CrossRef]
- Gallego, J.; Aguilar-Parra, J.M.; Cangas, A.J.; Rosado, A.; Langer, Á.I. Effect of Mind/Body Interventions on Levels of Anxiety, Stress and Depression Among Future Primary School Teacher: A Controlled Study. Rev. Psicodidáctica 2015, 21, 87–101. [Google Scholar] [CrossRef]
- Morosanu, L.; Handley, K.; O’Donovan, B. Seeking support: Researching first-year students’ experiences of coping with academic life. High. Educ. Res. Dev. 2010, 29, 665–678. [Google Scholar] [CrossRef]
- Kassymova, K.; Kosherbayeva, N.; Sangilbayev, S.; Schachl, H. Stress management techniques for students. In Proceedings of the International Conference on the Theory and Practice of Personality Formation in Modern Society (ICTPPFMS 2018), Yurga, Russia, 20–22 September 2018. [Google Scholar]
- Bowering, E.R.; Mills, J.; Merritt, A. Learning How to Learn: A Student Success Course for at Risk Students. Can. J. Scholarsh. Teach. Learn. 2017, 8, 1–16. [Google Scholar] [CrossRef][Green Version]


| Factor Group | Factor | Min | Max | Mean | Std | Skewness | Kurtosis | Cronbach’s Alpha |
|---|---|---|---|---|---|---|---|---|
| Eysenck Personality Inventory | extraversion and introversion | 0.0 | 32.0 | 19.2 | 8.1 | −0.3 | −0.8 | 0.581 |
| emotional stability | 4.0 | 38.0 | 24.2 | 8.1 | −0.2 | −0.8 | ||
| rigidity | 2.0 | 30.0 | 19.0 | 5.4 | −0.4 | −0.1 | ||
| honesty | 0.0 | 14.0 | 5.1 | 2.9 | 0.4 | −0.3 | ||
| Grit | Grit point | 1.9 | 4.8 | 3.3 | 0.5 | 0.0 | −0.2 | 0.734 |
| Coping | problem focus | 25.0 | 100.0 | 72.3 | 12.4 | −0.4 | 0.7 | 0.907 |
| support-seeking | 25.0 | 100.0 | 71.1 | 17.4 | −0.6 | 0.0 | ||
| impulse control | 25.0 | 100.0 | 66.7 | 9.2 | −0.7 | 3.2 | ||
| attention diversion | 25.0 | 100.0 | 64.7 | 10.8 | −0.4 | 1.2 | ||
| emotion focus | 25.0 | 100.0 | 61.8 | 11.1 | −0.2 | 0.8 | ||
| acting out | 25.0 | 125.0 | 74.6 | 22.0 | 0.0 | −0.9 | ||
| self-punishment | 25.0 | 100.0 | 63.1 | 16.8 | 0.1 | −0.4 | ||
| acquiescence | 25.0 | 100.0 | 59.9 | 15.4 | 0.1 | −0.1 | ||
| Psychological Immune System (PI) monitoring | positive thinking | 5.0 | 20.0 | 15.0 | 3.3 | −0.6 | 0.1 | 0.904 |
| sense of control | 6.0 | 20.0 | 14.1 | 2.4 | −0.3 | 0.0 | ||
| feeling of growth | 5.0 | 20.0 | 15.0 | 3.5 | −0.6 | −0.1 | ||
| challenge seeking | 5.0 | 20.0 | 14.3 | 3.3 | −0.3 | −0.2 | ||
| goal orientation | 7.0 | 20.0 | 14.6 | 2.9 | −0.1 | −0.4 | ||
| coherence | 7.0 | 20.0 | 15.0 | 3.2 | −0.1 | −0.8 | ||
| social source monitoring | 5.0 | 20.0 | 15.1 | 3.2 | −0.3 | −0.5 | ||
| PI mobilizing | self-efficiency | 8.0 | 20.0 | 14.8 | 2.9 | −0.1 | −0.6 | 0.907 |
| creativity | 6.0 | 20.0 | 14.5 | 3.2 | −0.3 | −0.4 | ||
| social source founding skills | 5.0 | 20.0 | 13.7 | 3.1 | −0.2 | −0.1 | ||
| mobilizing skills | 5.0 | 20.0 | 15.0 | 3.2 | −0.3 | −0.5 | ||
| learned optimism | 6.0 | 20.0 | 15.1 | 3.4 | −0.4 | −0.6 | ||
| PI self-control | impulse control | 5.0 | 20.0 | 13.3 | 2.9 | 0.0 | −0.1 | 0.882 |
| irritability-control | 5.0 | 20.0 | 12.2 | 3.5 | 0.2 | −0.5 | ||
| emotion control | 5.0 | 19.0 | 11.9 | 3.5 | 0.0 | −0.8 | ||
| mindfulness-synchronization skill | 5.0 | 20.0 | 12.2 | 3.4 | −0.1 | −0.7 | ||
| Emotional intelligence Quotient (EQ) intrapersonal | assertiveness | 33.3 | 96.7 | 67.5 | 12.8 | −0.2 | −0.3 | 0.939 |
| self-awareness | 19.0 | 100.0 | 67.2 | 17.0 | −0.3 | −0.3 | ||
| self-regard | 18.5 | 100.0 | 65.5 | 19.3 | −0.3 | −0.6 | ||
| independence | 18.8 | 87.5 | 56.7 | 12.8 | −0.4 | −0.1 | ||
| self-actualization | 38.1 | 100.0 | 78.3 | 14.9 | −0.4 | −0.7 | ||
| EQ interpersonal | empathy | 33.3 | 100.0 | 73.9 | 14.3 | −0.5 | −0.1 | 0.906 |
| social responsibility | 37.0 | 100.0 | 76.7 | 12.2 | −0.5 | −0.2 | ||
| interpersonal relationship | 36.7 | 100.0 | 75.0 | 13.1 | −0.3 | −0.5 | ||
| EQ adaptation | reality testing | 20.0 | 90.0 | 63.2 | 11.4 | −0.3 | 0.2 | 0.858 |
| flexibility | 22.9 | 92.5 | 62.8 | 13.4 | −0.3 | −0.3 | ||
| problem-solving | 37.5 | 100.0 | 73.2 | 13.0 | −0.3 | 0.0 | ||
| EQ stressmanagement | stress tolerance | 29.6 | 91.1 | 63.0 | 9.0 | −0.2 | 0.2 | 0.817 |
| impulse control | 24.1 | 100.0 | 64.1 | 16.9 | −0.1 | −0.5 | ||
| EQ moodand motivation | optimism | 27.1 | 100.0 | 72.1 | 15.0 | −0.5 | 0.1 | 0.915 |
| happiness | 48.1 | 100.0 | 79.2 | 13.8 | −0.5 | −0.7 | ||
| PERMA | positivity (P) | 3.0 | 30.0 | 21.3 | 4.9 | −0.7 | 0.4 | 0.824 |
| engagement (E) | 11.0 | 30.0 | 22.1 | 3.7 | −0.5 | 0.1 | 0.385 | |
| relationship (R) | 5.0 | 30.0 | 23.2 | 4.9 | −0.8 | 0.3 | 0.809 | |
| meaning (M) | 6.0 | 30.0 | 22.8 | 4.3 | −0.8 | 0.9 | 0.803 | |
| accomplishment (A) | 8.0 | 30.0 | 22.6 | 4.0 | −0.9 | 1.1 | 0.718 | |
| health | 4.0 | 30.0 | 21.1 | 5.6 | −0.6 | 0.0 | 0.881 | |
| negativity | 7.0 | 25.0 | 17.0 | 3.5 | 0.1 | −0.6 | 0.766 | |
| happiness | 1.0 | 10.0 | 7.5 | 1.7 | −0.7 | 0.4 | - | |
| loneliness | 1.0 | 10.0 | 4.9 | 2.5 | 0.2 | −1.1 | - | |
| High school | university entrance score | 331.0 | 491.0 | 402.8 | 34.1 | −0.2 | −0.8 | - |
| Groups | Factors | AUC (with UES) |
|---|---|---|
| Coping skills and psychological immunity | coping | 0.778 * |
| PI self-control part | 0.745 | |
| PI monitoring part | 0.704 | |
| PI mobilizing part | 0.728 | |
| Emotional intelligence | EQ intrapersonal part | 0.735 |
| EQ interpersonal part | 0.728 | |
| EQ stress-management | 0.722 | |
| EQ adaptation part | 0.722 | |
| EQ mood and motivation | 0.715 | |
| Positive psychological factors | Grit | 0.740 |
| PERMAnegativity | 0.738 | |
| PERMA health | 0.737 | |
| PERMA accomplishment | 0.734 | |
| PERMA happiness | 0.733 | |
| PERMA meaning | 0.732 | |
| PERMA positivity | 0.731 | |
| PERMA loneliness | 0.731 | |
| PERMA engagement | 0.729 | |
| PERMA relationship | 0.729 | |
| Stable psychological factors | EPI | 0.764 |
| Factor | Number of Pairs | Number of Triplets | Number of Quadruplets | Number of Quintuplets | Number of Sextuplets | Ratio in All * |
|---|---|---|---|---|---|---|
| PERMA negativity | 3/1 | 11/4 | 12/7 | 21/13 | 0 | 54.5%/61.0% |
| coping | 7/7 | 11/11 | 7/7 | 12/12 | 0 | 43.2%/92.7% |
| PI self-control | 4/1 | 6/2 | 7/3 | 20/11 | 0 | 43.2%/41.5% |
| EPI | 7/1 | 8/3 | 6/3 | 10/4 | 0 | 36.4%/26.8% |
| PERMA health | 2/0 | 3/2 | 7/2 | 10/7 | 0 | 26.1%/26.8% |
| EQ intrapersonal | 1/0 | 4/0 | 7/1 | 8/2 | 0 | 22.7%/7.3% |
| PERMA accomplishment | 4/1 | 3/2 | 5/1 | 7/1 | 0 | 21.6%/12.2% |
| PERMA engagement | 2/0 | 2/0 | 3/0 | 6/0 | 0 | 14.8%/0.0% |
| EQ adaptation | 1/1 | 4/4 | 2/2 | 4/4 | 0 | 12.5%/26.8% |
| PERMA happiness | 1/0 | 0/0 | 1/1 | 7/4 | 0 | 10.2%/12.2% |
| PERMA loneliness | 0/0 | 2/0 | 1/0 | 6/4 | 0 | 10.2%/9.8% |
| PERMA meaning | 1/1 | 1/1 | 3/1 | 4/2 | 0 | 10.2%/12.2% |
| Grit | 1/1 | 4/3 | 2/2 | 1/1 | 0 | 10.2%/17.1% |
| PERMA positivity | 0/0 | 1/1 | 3/1 | 3/2 | 0 | 8.0%/9.8% |
| EQ interpersonal | 0/0 | 0/0 | 2/1 | 3/2 | 0 | 5.7%/7.3% |
| PERMA relationship | 0/0 | 0/0 | 2/0 | 2/1 | 0 | 4.5%/2.4% |
| EQ mood and motivation | 1/0 | 2/0 | 1/0 | 0/0 | 0 | 4.5%/0.0% |
| EQ stress-management | 0/0 | 1/0 | 1/0 | 1/0 | 0 | 3.4%/0.0% |
| PI mobilizing | 1/0 | 0/0 | 0/0 | 0/0 | 0 | 1.1%/0.0% |
| PI monitor | 0/0 | 0/0 | 0/0 | 0/0 | 0 | 0.0%/0.0% |
| Groups | AUC (with UES) |
|---|---|
| coping, EPI, PERMA health | 0.810 |
| coping, EPI, PERMA negativity | 0.809 |
| coping, EPI, PERMA positivity | 0.806 |
| coping, PERMA meaning, PERMA negativity | 0.790 |
| coping, grit, PI self-control | 0.789 |
| Factor Groups | AUC (with UES) | p Value |
|---|---|---|
| only university entrance score (UES) | 0.737 | - |
| UES + coping | 0.778 | 0.0986 |
| UES + coping, EPI | 0.806 | 0.0104 |
| UES + coping, EPI, PERMA health | 0.810 | 0.0073 |
| UES + coping, EPI, PERMA positivity, PERMA negativity | 0.810 | 0.0075 |
| UES + coping, EPI, PERMA meaning, PERMA health, PERMA negativity | 0.812 | 0.0070 |
| Model | List of Instruments | Number of Items | Completion Time (in Minutes, Approximately) |
|---|---|---|---|
| one-factor model | coping | 80 | 20 |
| two-factor model | coping, EPI | 80 + 58 | 35 |
| three-factor model | coping, EPI, PERMA health | 80 + 58 + 3 | 40 |
| four-factor model | coping, EPI, PERMA positivity and negativity | 80 + 58 + 3 + 3 | 45 |
| five-factor model | coping, EPI, PERMA meaning, health and negativity | 80 + 58 + 3 + 3 + 3 | 50 |
| Original positive psychological assessment battery | emotional intelligence, coping, psychological immunity, grit, PERMA and EPI | 121 + 80 + 80 + 8 + 23 + 58 | 100–120 |
Publisher’s Note: MDPI stays neutral with regard to jurisdictional claims in published maps and institutional affiliations. |
© 2021 by the authors. Licensee MDPI, Basel, Switzerland. This article is an open access article distributed under the terms and conditions of the Creative Commons Attribution (CC BY) license (http://creativecommons.org/licenses/by/4.0/).
Share and Cite
Séllei, B.; Stumphauser, N.; Molontay, R. Traits versus Grades—The Incremental Predictive Power of Positive Psychological Factors over Pre-Enrollment Achievement Measures on Academic Performance. Appl. Sci. 2021, 11, 1744. https://doi.org/10.3390/app11041744
Séllei B, Stumphauser N, Molontay R. Traits versus Grades—The Incremental Predictive Power of Positive Psychological Factors over Pre-Enrollment Achievement Measures on Academic Performance. Applied Sciences. 2021; 11(4):1744. https://doi.org/10.3390/app11041744
Chicago/Turabian StyleSéllei, Beatrix, Nóra Stumphauser, and Roland Molontay. 2021. "Traits versus Grades—The Incremental Predictive Power of Positive Psychological Factors over Pre-Enrollment Achievement Measures on Academic Performance" Applied Sciences 11, no. 4: 1744. https://doi.org/10.3390/app11041744
APA StyleSéllei, B., Stumphauser, N., & Molontay, R. (2021). Traits versus Grades—The Incremental Predictive Power of Positive Psychological Factors over Pre-Enrollment Achievement Measures on Academic Performance. Applied Sciences, 11(4), 1744. https://doi.org/10.3390/app11041744