1. Introduction
In recent years, both researchers and practitioners have been applying learning analytics to support curriculum understanding and improvement [
1,
2]. Worldwide participation in higher education has grown around the world [
3]. However, the number of graduates in undergraduate programs remains low, and pressure is being placed on universities in many countries to increase the number of graduates in order to meet the needs of society [
4]. The main focus on dropout research has been on early dropout [
5]. However, the problem of late dropout has been gaining importance in higher education [
6].
Different methods have been used to understand and predict the dropout phenomenon. Qualitative techniques include surveys and in-depth interviews [
7,
8], whereas quantitative techniques include a broad range of statistical and data mining methods, such as neural networks [
9], multinomial logistic regression [
10,
11], genetic algorithms [
2], and event history analysis [
6,
12]. The application of longitudinal analysis techniques [
12] has also shown that the risk of dropout changes over time and that dropout does not generally occur as a spontaneous event, but rather as a consequence of a particular process [
13]. Although event history analysis can help to understand the relationship between each variable and an outcome across time, sequences of events that include cycles, called swirling patterns [
11], are not sufficiently well described by this kind of models.
Learning analytics (LA) is a growing research area, whose purpose is the measurement, collection, analysis, and reporting of data about students and their learning processes [
14]. Recent research shows the importance of a more holistic approach to improve the efficiency and effectiveness of learning programs, focusing the analysis to the program level [
15]. Curricular analytics (CA) has emerged as a sub-field of LA, aiming to use evidence to drive curriculum decision-making and program improvement [
1,
16]. CA uses data both at course-level and program-level, to analyze the interactions between students and the curriculum along time [
1]. This understanding can help to identify points in the program structure where interventions are more relevant to improve student progression [
15].
In this work, we are interested in understanding the educational trajectories of students, using CA techniques. In particular, this study defines an educational trajectory as a process, i.e., a set of events that occur in a certain order during the permanence of the students in a given program.
In this study, we focus on analyzing late dropout using Process Mining [
17], which aims to extract knowledge from event logs obtained from information systems, in order to discover process models, verify conformance, and suggest improvements [
17]. The main difference between Process Mining and other data-centric techniques is the starting point of the analysis. Process Mining is process-centric, whereas statistical and data mining methods are data-centric [
18]. The advantage of the process-centric approach lies in that it supports a more holistic comprehension about the process (in this case, the educational trajectory), using graphical and analytical tools [
17]. These kinds of models facilitate visual cognition and make understanding of sequences of events more efficient [
19]. In this work, Process Mining allows us to study the dynamic behavior of educational trajectories so as to understand which educational trajectory patterns lead to late dropout and which ones do not. Process Mining has been applied in multiple domains, with particular success achieved in fields in which processes are insufficiently structured, as is the case in education [
20], although applications of Process Mining at the curricular level have been less frequent [
21].
This paper is structured as follows.
Section 2 introduces the literature on dropout and two related theoretical frameworks.
Section 3 presents the research question.
Section 4 presents the materials and methods.
Section 5 summarizes the main results.
Section 6 discusses the results obtained and answer the RQ. Finally, implications for managers and policymakers are given in
Section 7.
2. Literature Review
In higher education research, student retention has been one of the most widely studied topics [
22]. Historically, research on dropout has focused on freshmen and sophomore students [
5,
23], since the highest rates of dropout correspond to these groups. However, the existence of more rigorous courses after freshman year, may present a barrier to completion for many students, who accumulate credits slowly and finally drop out [
6]. Currently, post-freshman year dropout accounts for over 40% of all university dropouts [
6].
High-failure rate courses are common in undergraduate programs and have been linked to dropout and late graduation [
8,
24,
25]. There are numerous studies, the majority of which are qualitative, which link unsatisfactory results in freshman high-failure rate courses to dropout [
4]. However, the existence of high-failure rate courses beyond the freshman year explains why the variability of student advancement in their program normally increases over subsequent years [
6].
Despite the phenomenon of dropout being a growing concern among governments and policymakers [
6,
26], there is no universally recognized definition about this concept [
27]. The Center for Higher Education Policy Studies [
26] defines dropout rate as the number of students who withdraw from a program of studies, in relation to those who began that program as part of a particular cohort. The aforementioned center, however, claims that this definition is problematic because it ignores students who pull out temporarily (stopout), as well as those who change program or institution (transfer). In this study, dropout students will be considered those who, after a certain date, fail to enroll for subsequent courses within the same program, without having yet completed that program. We will focus on late program dropout, i.e., program dropout that occurs after two or more years of program study.
Program dropout is a major issue globally, because a portion of students who do not complete a program with a degree, could leave higher education and never graduate from another program or institution [
28]. In Chile, the average dropout rate per program for the cohort that entered the university in 2007, reached 57% in the seventh year, and early dropout was 32.6% [
29]. Therefore, late program dropout accounted near 25%.
The different methods provided by Process Mining can be helpful for CA techniques to explore data obtained from educational environments, as long as theoretical frameworks, which are valid for the research community, can support the models of analysis obtained [
30]. We consider two frameworks. The Student Motivation and Persistence model [
31] states that motivation and persistence depend on four aspects: The goals that lead the student to stay in a given program, self-efficacy, sense of belonging, and perceived worth of the curriculum. Self-efficacy is defined as a person’s belief in their ability to succeed in a specific situation [
32]. Sense of belonging describes when the students come to see themselves as members of a community who value their participation [
31].
On the other hand, the Investment model [
33] explains commitment and the decision to persist in a relationship (in this case, to continue in the study program) based on satisfaction, quality of alternatives, and investment size. Satisfaction and investment have a positive effect on commitment, while the attractiveness of any other alternative has the opposite effect [
34]. This method has been used in the past to explain the dropout phenomenon in higher education at the freshman level [
35].
3. Research Question
Failure in high-failure rate courses could affect the students’ perception of self-efficacy, their sense of belonging (because of the disconnection with their peer group), and their perception of the curriculum (or their fit to it). Those aspects, in the long run, could decrease their motivation, change their perception of the investment already made, make them consider other alternatives, and finally, have a negative impact on their decision to persist in the program.
In this research, we study the group of high-failure rate courses the student must retake. A retake course is a mandatory course in which the student did not earn a passing grade, and therefore must retake it. Having a group of high-failure rate courses the student must retake means a burden for the student that makes graduation harder. Therefore, our research question is:
(RQ) For late dropout students, how can the educational trajectories that consider the group of high-failure rate courses the student must retake be described?
This research was carried out in a medium-sized Chilean university that embraces both education and research. Although the Chilean context might have its own distinctive characteristics, we believe this analysis is of interest to a wider international audience. Understanding the educational trajectories that include a stopout [
36] and lead to late dropout [
37,
38], as well as the differences across educational fields [
39] are shared concerns in higher education research.
By addressing this research question with a curricular analytics approach, through Process Mining, and discussing the obtained results using well-known theoretical frameworks, we can enable the understanding of educational trajectories of late dropout students from a longitudinal perspective, generating new knowledge about the dynamic behavior of students.
4. Methods
We used the Process Mining PM
2 methodology [
40], which includes the stages of data extraction, event log generation, model discovery and model analysis. Data used correspond to anonymized enrollment and course-grade records. An event log was generated by converting the data according to the proposed analysis model, in order to answer the research question. After that, model discovery and model analysis were performed using bupaR, an integrated collection of packages that creates a framework for the reproducible analysis of processes in R [
41]. R is a free software environment for statistical computing and graphics [
42].
In this case study, the process models obtained provide graphic representations of the educational trajectories of the students (hereinafter called educational trajectory models); nodes represent events (milestones) relevant to their educational trajectories, while arrows represent transitions between events. Nodes are labeled considering either the absolute frequency of occurrence of each event, the number of students or the percentage of students that reached each event. Arrows are labeled considering either the absolute frequency of transitions between two events or the percentage of students that had a transition between each pair of events.
Models were analyzed by combining the use of filtering in bupaR with an evaluation of the statistical significance of the results, by means of the application of a proportions test [
42].
4.1. Sample and Data Extraction
Data used in the case study include 6 cohorts of undergraduate students (between 2004 and 2009), who entered a medium-sized Chilean university, which encompasses both education and research in a variety of educational fields. In total, 12,840 students were enrolled in one of the 49 undergraduate programs in those years. The nominal duration of these undergraduate programs is between 4 and 7 years (median: 5 years). The observation period stretches from the beginning of 2004 to the end of 2018. This time window was chosen because by the end of 2018 more than 95% of the students of these 6 cohorts had already reached a final state (either dropout or graduation).
The data extraction stage included the application of filters and a categorization of final state events regarding the data extracted from the academic records. Three group of students were filtered out: 603 students (4.70%) had not reached any final state on March 2019, 631 students (4.91%) stopped out immediately after initial enrollment, and 637 students (4.96%) chose to switch to a new curriculum while staying in the same program. Therefore, educational trajectories of 10,969 students were considered, corresponding to 85.43% of the global enrollment. Four final state events were defined;
Table 1 shows their definition and the number of students who reached each final state. The number of undergraduate programs and students for each ISCED (International Standard Classification of Education) field is shown in
Table 2.
To achieve a greater representation of students, high-failure rate courses were selected from among those with a minimum of 30 students enrolled, considering the entire period of analysis. These represented 43.31% of all possible courses. Courses with a failure rate higher than the average plus one standard deviation were considered as high-failure rate courses. In the period under review (30 semesters), 3343 courses had at least 30 students enrolled, and 628 of them were considered as high-failure rate courses (18.79%).
4.2. Event Log Generation
To answer the research question, an event log was built, integrating events from the academic background of students. Every event in the event log is characterized by the attributes described in
Table 3.
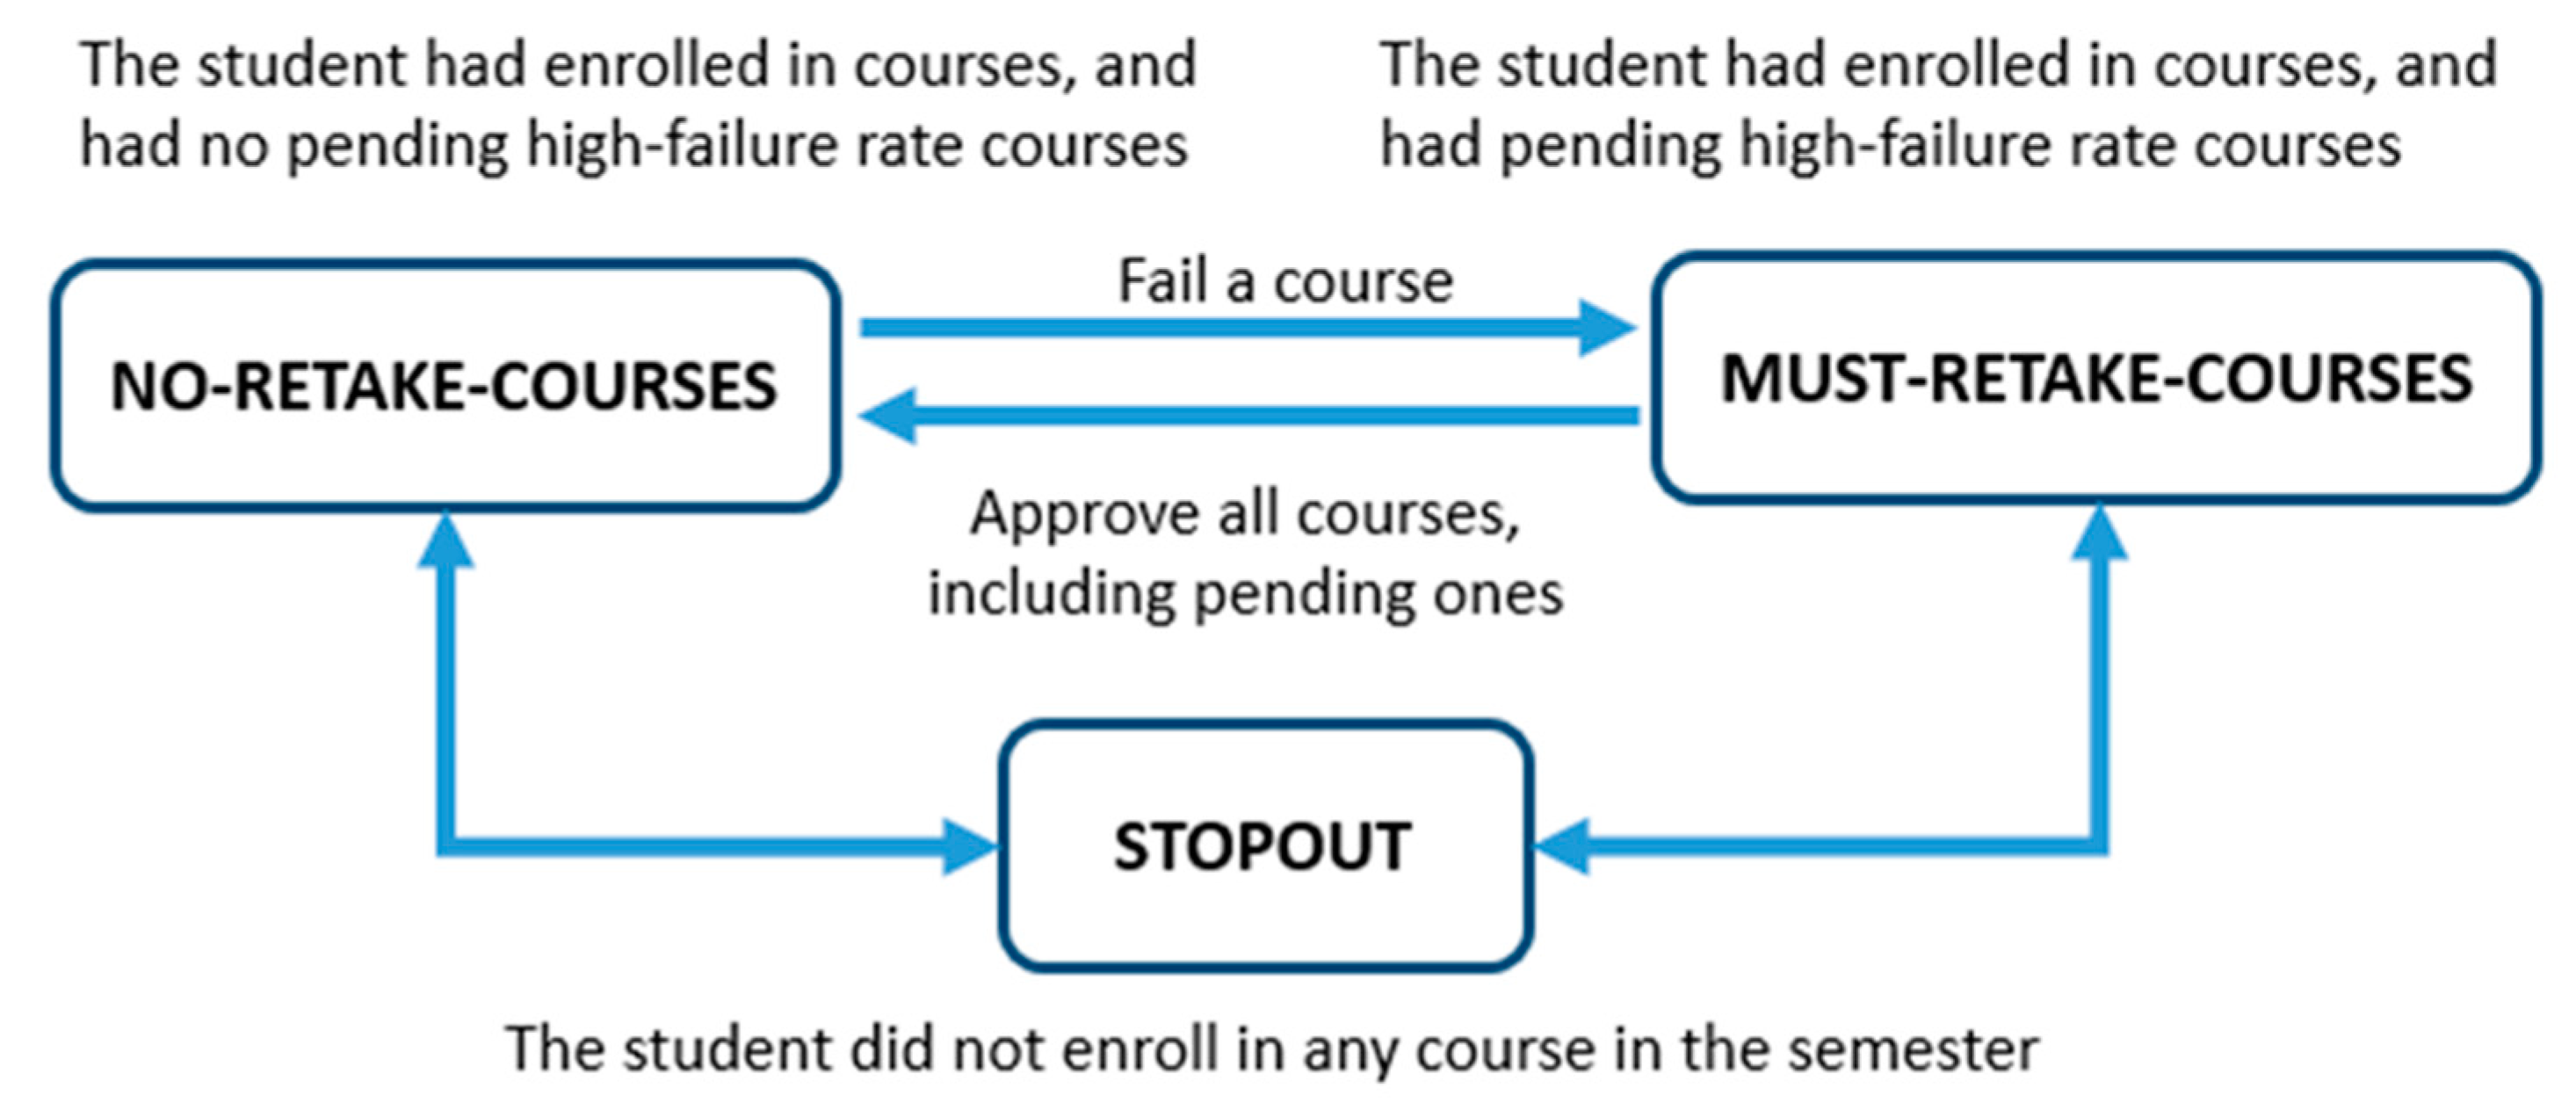
To describe the educational trajectories in the group of high-failure rate courses associated with late dropout, an event log was built and analyzed, which we will call ETEL (Educational Trajectory Event Log). To build ETEL, for each student enrolled in a program, a verification is undertaken at the beginning of each semester, as to whether the student has enrolled in courses that semester and whether the student must retake some high-failure rate course (because the student failed it in some previous semester). We had no information on whether students who did not enroll in any course in a particular semester had decided to drop out or stop out. Therefore, stopout events were added to the event log for those semesters in which the students did not enroll in any course but enrolled in courses in any subsequent semester. Otherwise, they were considered students who dropped out of their programs. The feasible result events and transitions are shown in a state diagram in
Figure 1.
4.3. Model Discovery
ETEL was loaded in bupaR, and models grouping educational trajectories by each final state event were created. bupaR uses Directly-Follows Graphs (DFG) [
43] to build process models. A DFG is a graph with nodes that represent events and directed edges that correspond to directly-follows relationships [
43]. These relationships are identified based on the temporal precedence between events that belong to the same case (i.e., to the same educational trajectory). Different measurements can be used to decorate nodes and events, using them to define the degree of darkness of the color of the nodes and the thickness of the edges. In the RETAKE-STOPOUT model, only measures representing frequency were used for both nodes and events, although bupaR also provides time and custom measures.
4.4. Model Analysis
We created models with the ETEL log considering different perspectives, focusing on identifying similarities and differences between the trajectories that ended in LATE-DROPOUT, with respect to those that ended in the other final states. Educational trajectories that led to LATE-DROPOUT were also filtered according to those that included or not certain transitions, such as MUST-RETAKE-COURSES > STOPOUT versus NO-RETAKE-COURSES > STOPOUT; and MUST-RETAKE-COURSES > LATE DROPOUT versus NO-RETAKE-COURSES > LATE DROPOUT.
Table 4 describes the different analyses performed, including a description of the different educational trajectory models created: Selection of node types, selection of transition types, and filters applied. In the
Supplementary Materials section is available the bupaR code used to conduct the analyses.
4.5. Limitations
This study has three main limitations, which should be taken into account when drawing conclusions based on our findings. First, our results relate to a specific case study, undertaken at a medium-sized Chilean university. Educational trajectories correspond to specific curricula and policies, both institutional and national, in force during the period under review. In particular, the flexibility for students to re-enroll in a different institution or academic program is very low in Chile, with little chance of recognizing partially completed studies [
29]. For that reason, transfer students were not identified in the RETAKE-STOPOUT model. Furthermore, although it might be useful to distinguish between expelled and voluntary dropout, this criterion was not considered in the RETAKE-STOPOUT model, because the institutional rules that define expelled dropout changed several times in the considered time window.
Second, analysis has been limited to data extracted from the curriculum dimension and, in particular, the final grades obtained on a semester-by-semester basis in high-failure rate courses. Partial grades with their timestamps were not available for the entire time window and therefore a more detailed analysis was not possible.
Third, the conclusions drawn from Process Mining depend to a large extent on the accuracy and completeness of the information used [
44]. In this case, no information was available on the precise moment when students dropped out of a program or a specific course, and it was assumed in all cases that they stayed for the full semester of each course in which they had enrolled. Moreover, the analysis did not include withdrawn courses, but only those in which the student obtained a grade at the end of the semester.
5. Results
In this section, we present the main results of the stages of discovery and analysis of the PM2 methodology. Findings are enumerated to ease their discussion later.
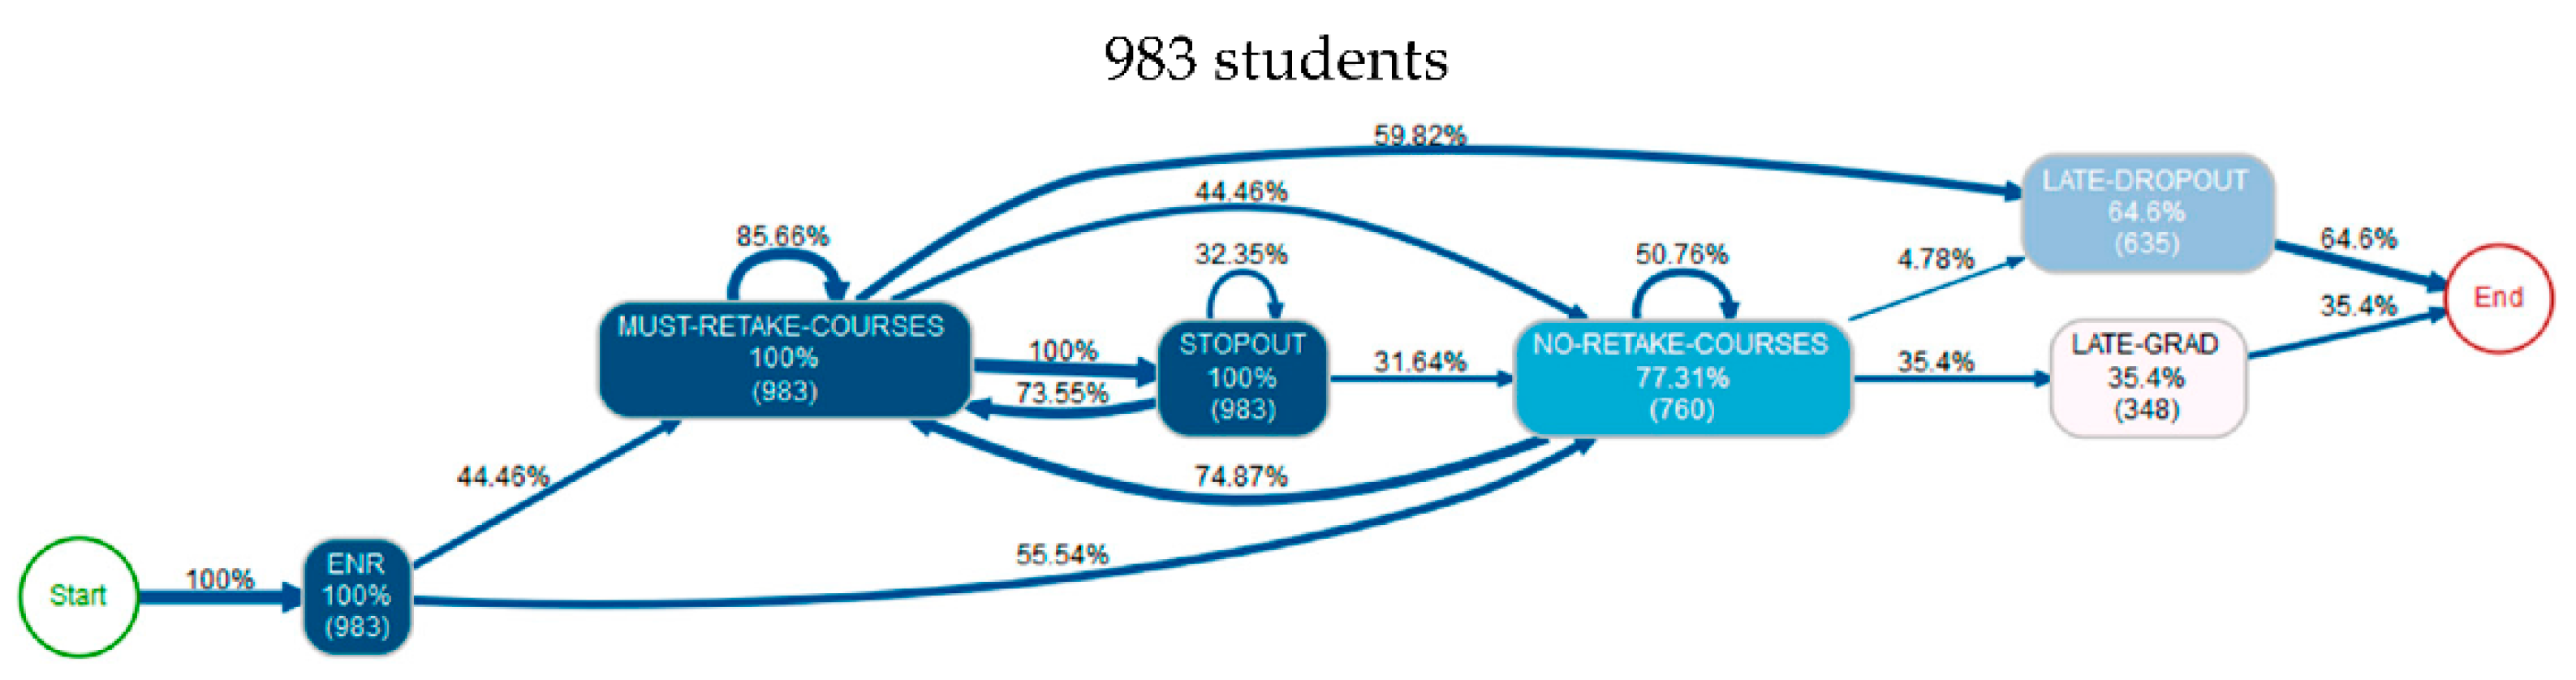
(F1) Among students who took a stopout while having high-failure rate courses they must retake, late dropout is more frequent than late graduation.
Figure 2 shows that 64.60% of students who took a stopout with high-failure rate courses they must retake ended in LATE-DROPOUT, compared to only 35.40% who ended in LATE-GRAD. Moreover, educational trajectories that include MUST-RETAKE-COURSES > STOPOUT transitions are mostly unsatisfactory. This can be seen in that they include a high proportion of transitions MUST-RETAKE-COURSES > MUST-RETAKE-COURSES (84.66%), STOPOUT > MUST-RETAKE-COURSES (73.55%), and MUST-RETAKE-COURSES > LATE-DROPOUT (59.82%).
Figure 2.
Educational trajectories in high-failure rate courses, according to the RETAKE-STOPOUT model, including only students who had at least one MUST-RETAKE-COURSES > STOPOUT transition, did not have NO-RETAKE-COURSES > STOPOUT transitions, and ended in LATE-DROPOUT or LATE-GRAD. The darker color of the nodes represents a higher percentage of students who went through a state. The thickness of the arrows represents the percentage of students who had transitions between both states. All values are percentages in relation to the total number of students included in the model.
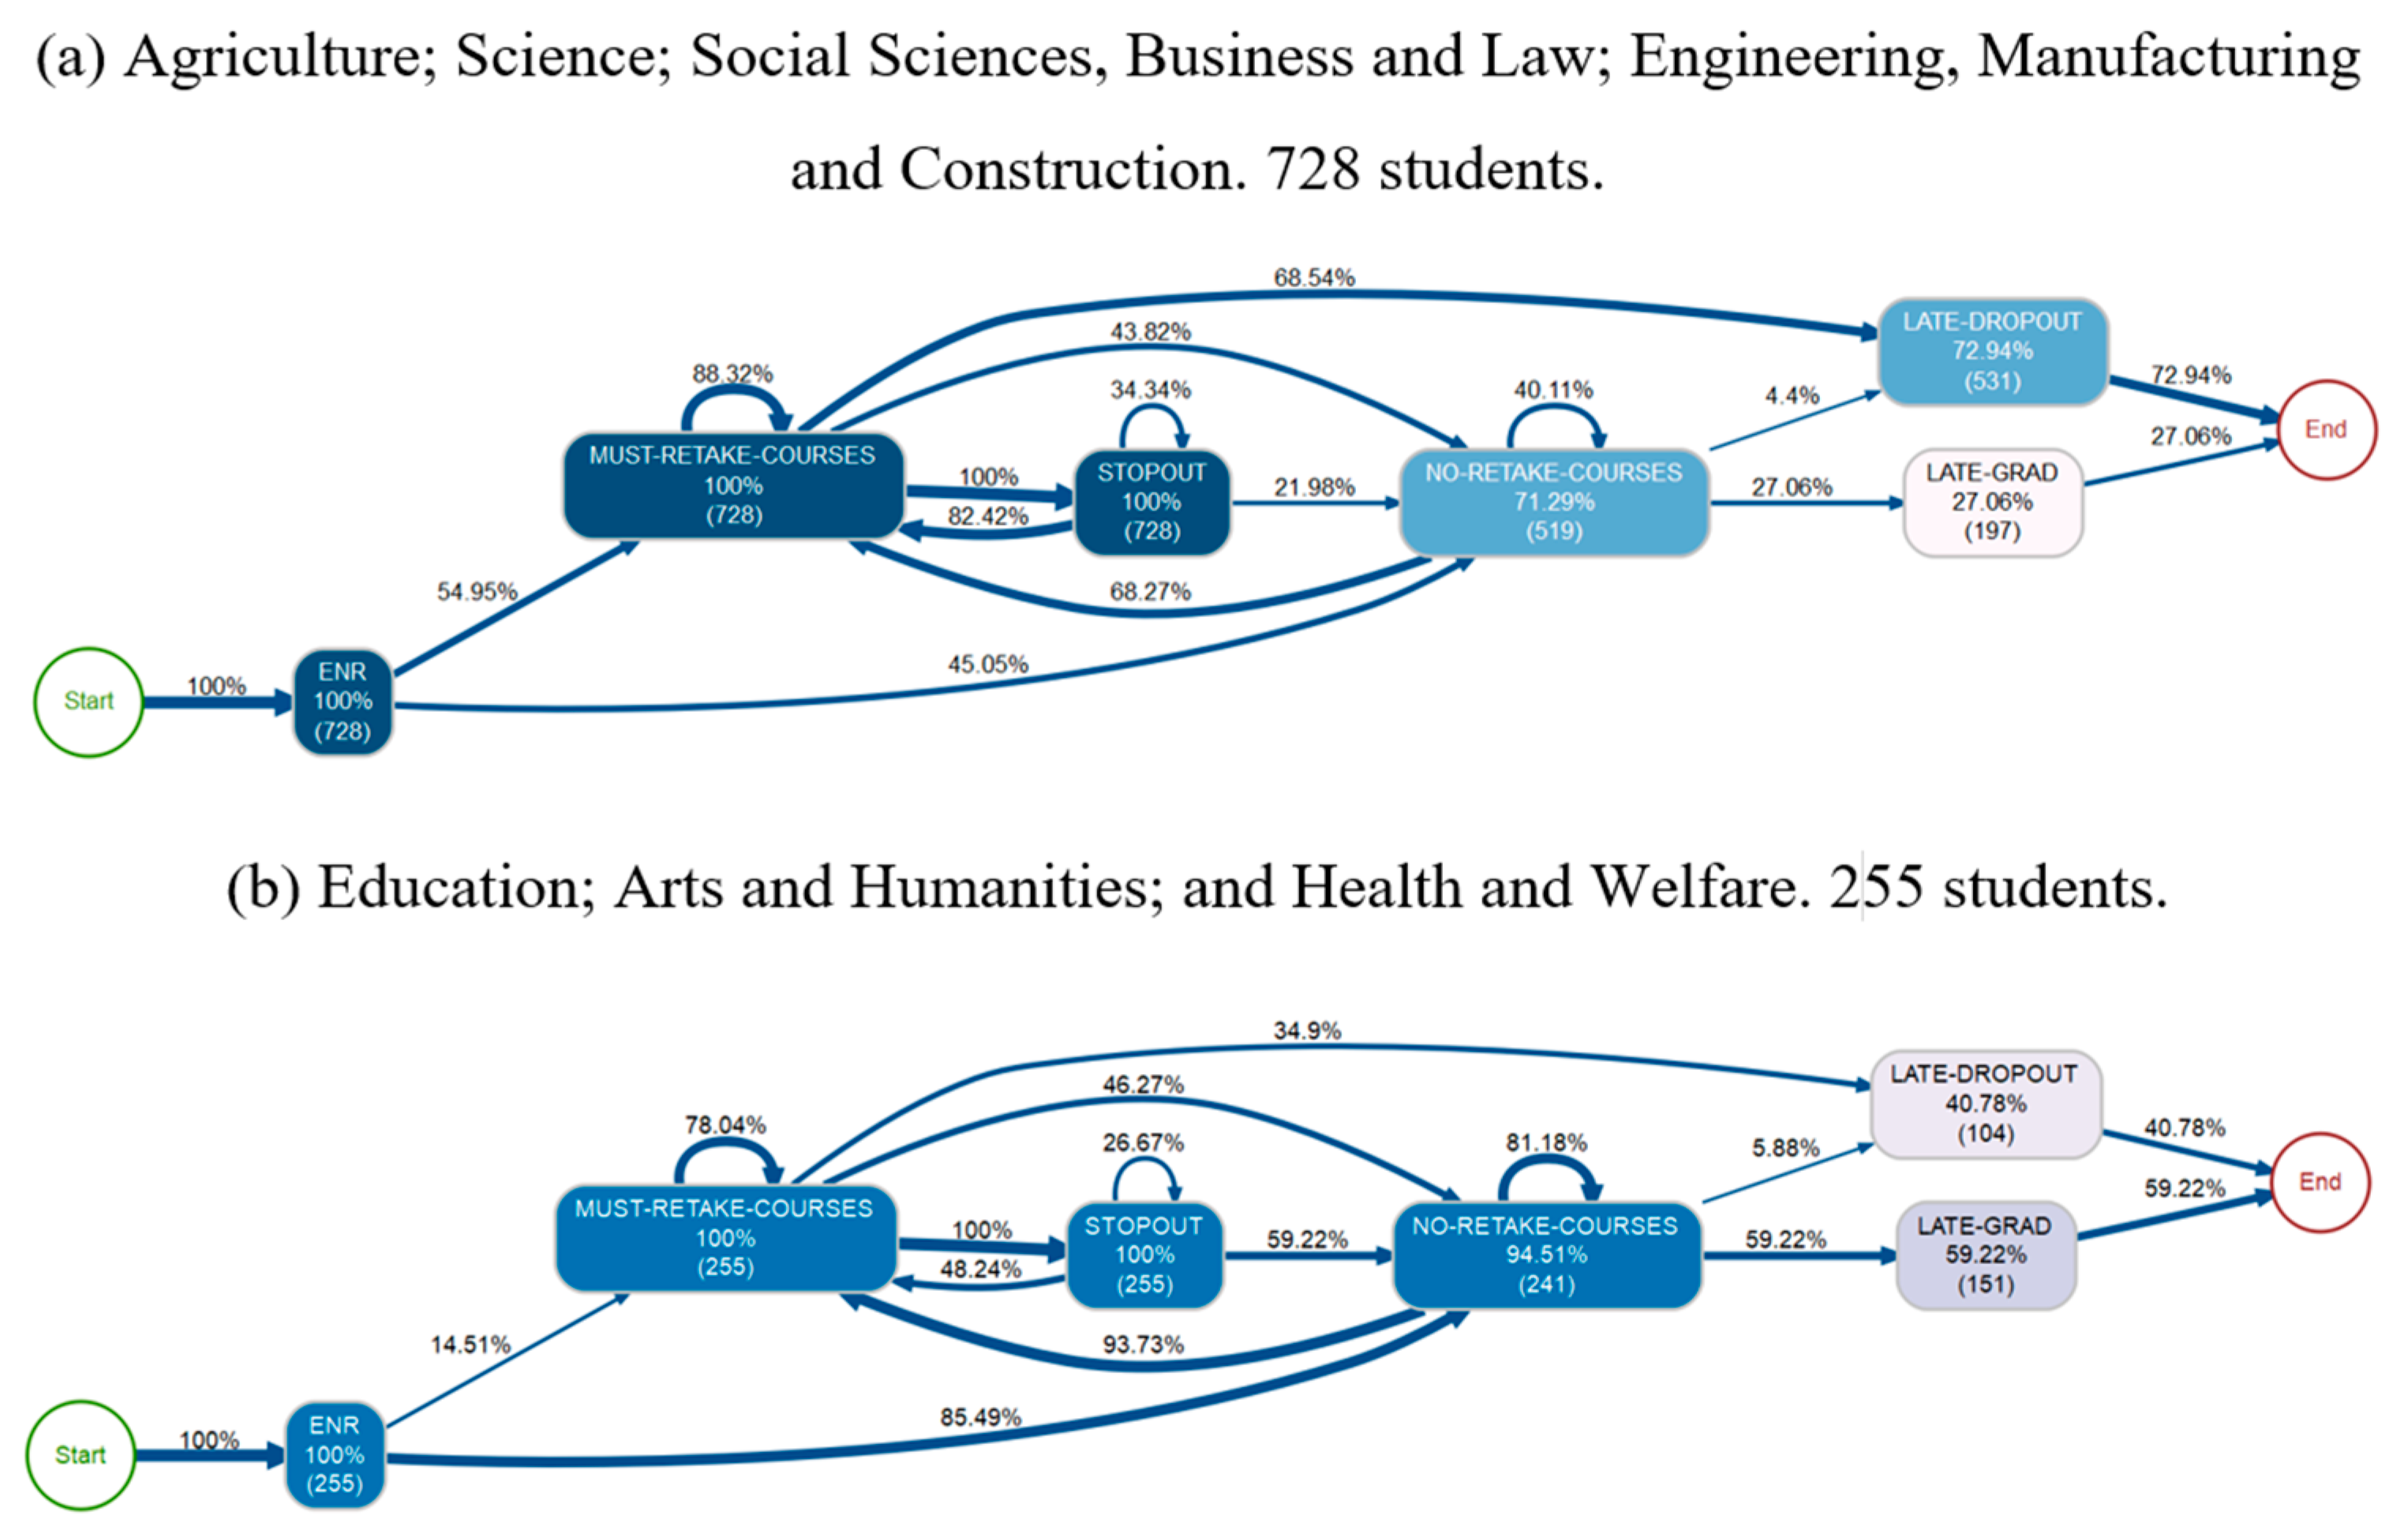
(F2) Differences were found among ISCED fields for the educational trajectories of students who took a stopout while having high-failure rate courses they must retake.
Figure 3a shows educational trajectories that are clearly unsatisfactory. It groups the following ISCED fields: Agriculture; Science; Social Sciences, Business and Law; and Engineering, Manufacturing, and Construction. Furthermore, 54.95% of students had ENR > MUST-RETAKE-COURSES transitions; 88.32% had consecutive semesters with MUST-RETAKE COURSES; 82.42% had STOPOUT > MUST-RETAKE-COURSES transitions; and 72.94% ended in LATE-DROPOUT.
On the other hand,
Figure 3b shows more satisfactory educational trajectories. It groups the following ISCED fields: Education; Arts and Humanities; and Health and Welfare. Overall, 85.49% of students had ENR > NO-RETAKE-COURSES transitions, 81.18% had consecutive semesters with NO-RETAKE-COURSES, and 59.22% ended in LATE-GRAD.
Figure 3.
(a,b) Educational trajectories in high-failure rate courses, according to the RETAKE-STOPOUT model, including only students who had at least one MUST-RETAKE-COURSES > STOPOUT transition, did not have NO-RETAKE-COURSES > STOPOUT transitions, and ended in LATE-DROPOUT or LATE-GRAD. The darker color of the nodes represents a higher percentage of students who went through a state. The thickness of the arrows represents the percentage of students who had transitions between both states. All values are percentages in relation to the total number of students included in the model.
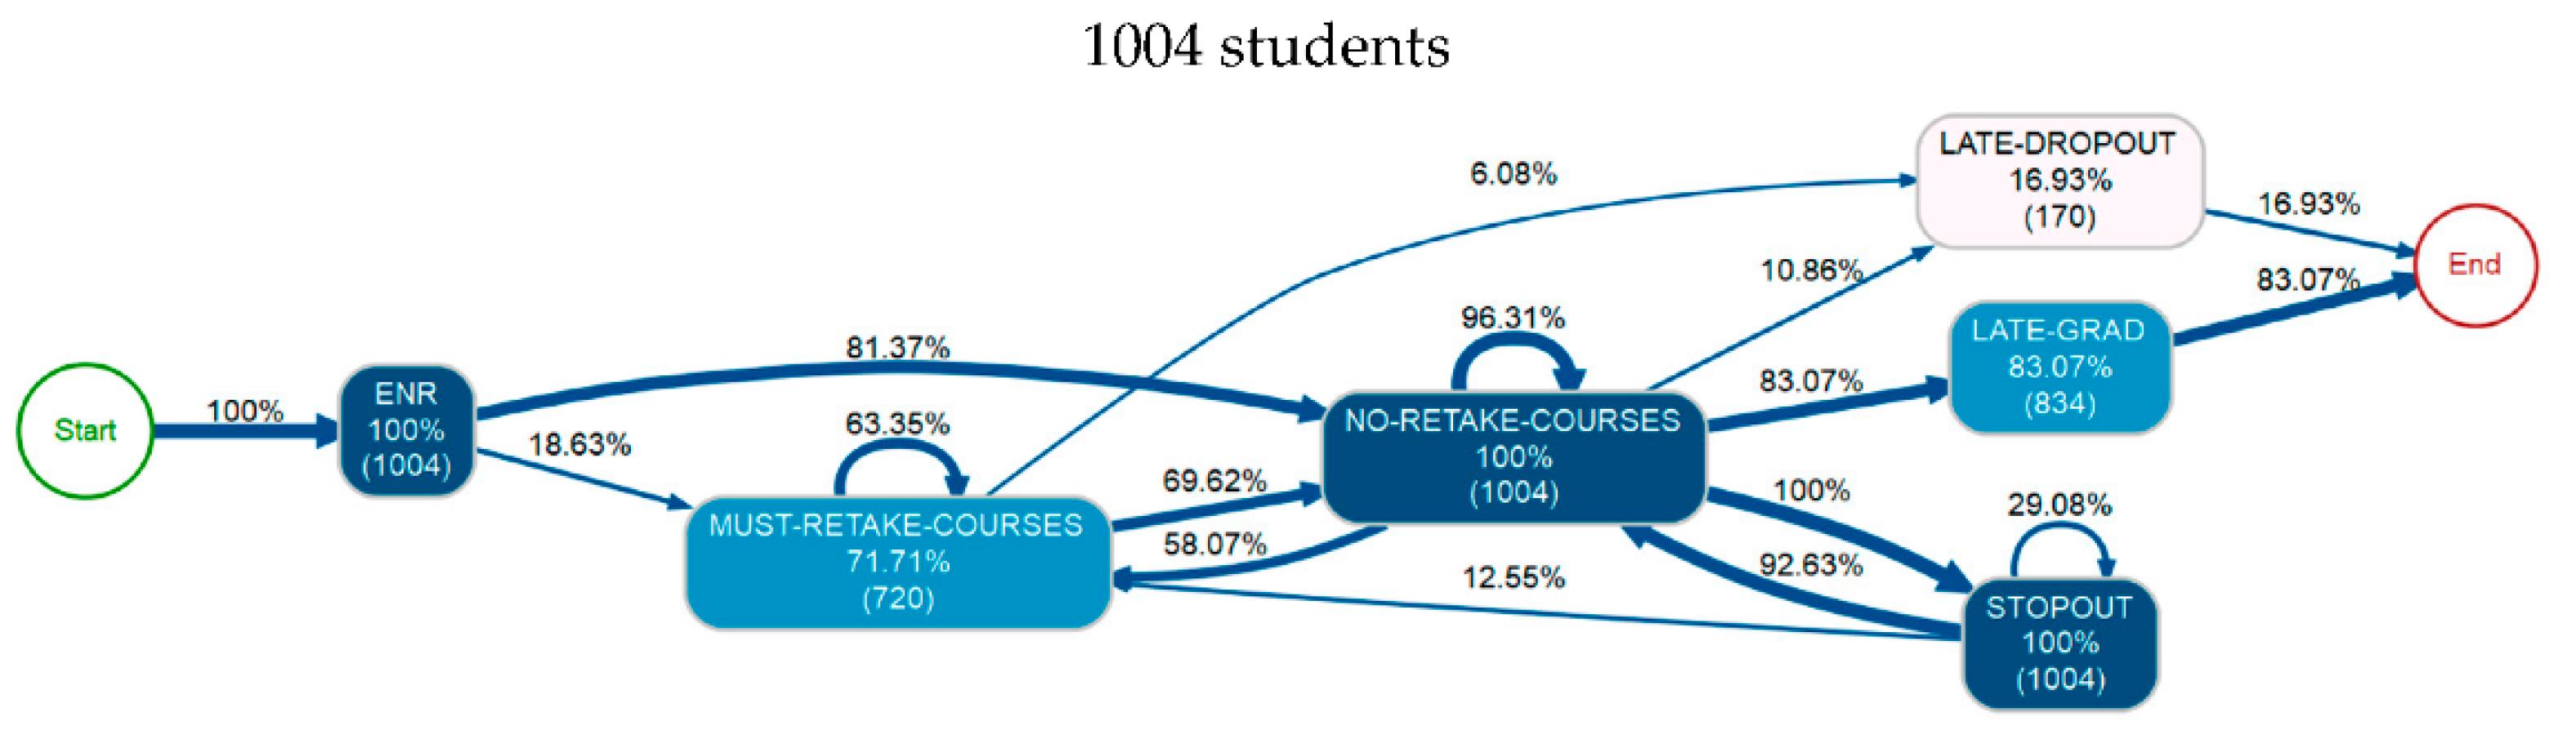
(F3) Among students who took a stopout without having high-failure rate courses they must retake, late graduation is more frequent than late dropout.
Figure 4 shows that 83.07% of students who took a stopout without high-failure rate courses they must retake, ended in LATE-GRAD, compared to only 16.93% who ended in LATE-DROPOUT. Moreover, educational trajectories that include NO-RETAKE-COURSES > STOPOUT transitions are mostly satisfactory. This can be seen in that they include a high proportion of transitions ENR > NO-RETAKE-COURSES (81.37%), NO-RETAKE-COURSES > NO-RETAKE-COURSES (96.31%), STOPOUT > NO-RETAKE-COURSES (92.63%). Moreover, they have also a very little proportion of transitions MUST-RETAKE-COURSES > LATE-DROPOUT (6.08%). Contrary to what was presented in (F4), no significant differences were found for educational trajectories grouped by ISCED field.
Figure 4.
Educational trajectories in high-failure rate courses, according to the RETAKE-STOPOUT model, including only students who had at least one NO-RETAKE-COURSES > STOPOUT transition, did not have MUST-RETAKE-COURSES > STOPOUT transitions, and ended in LATE-DROPOUT or LATE-GRAD. The darker color of the nodes represents a higher percentage of students who went through a state. The thickness of the arrows represents the percentage of students who had transitions between both states. All values are percentages in relation to the total number of students included in each model.
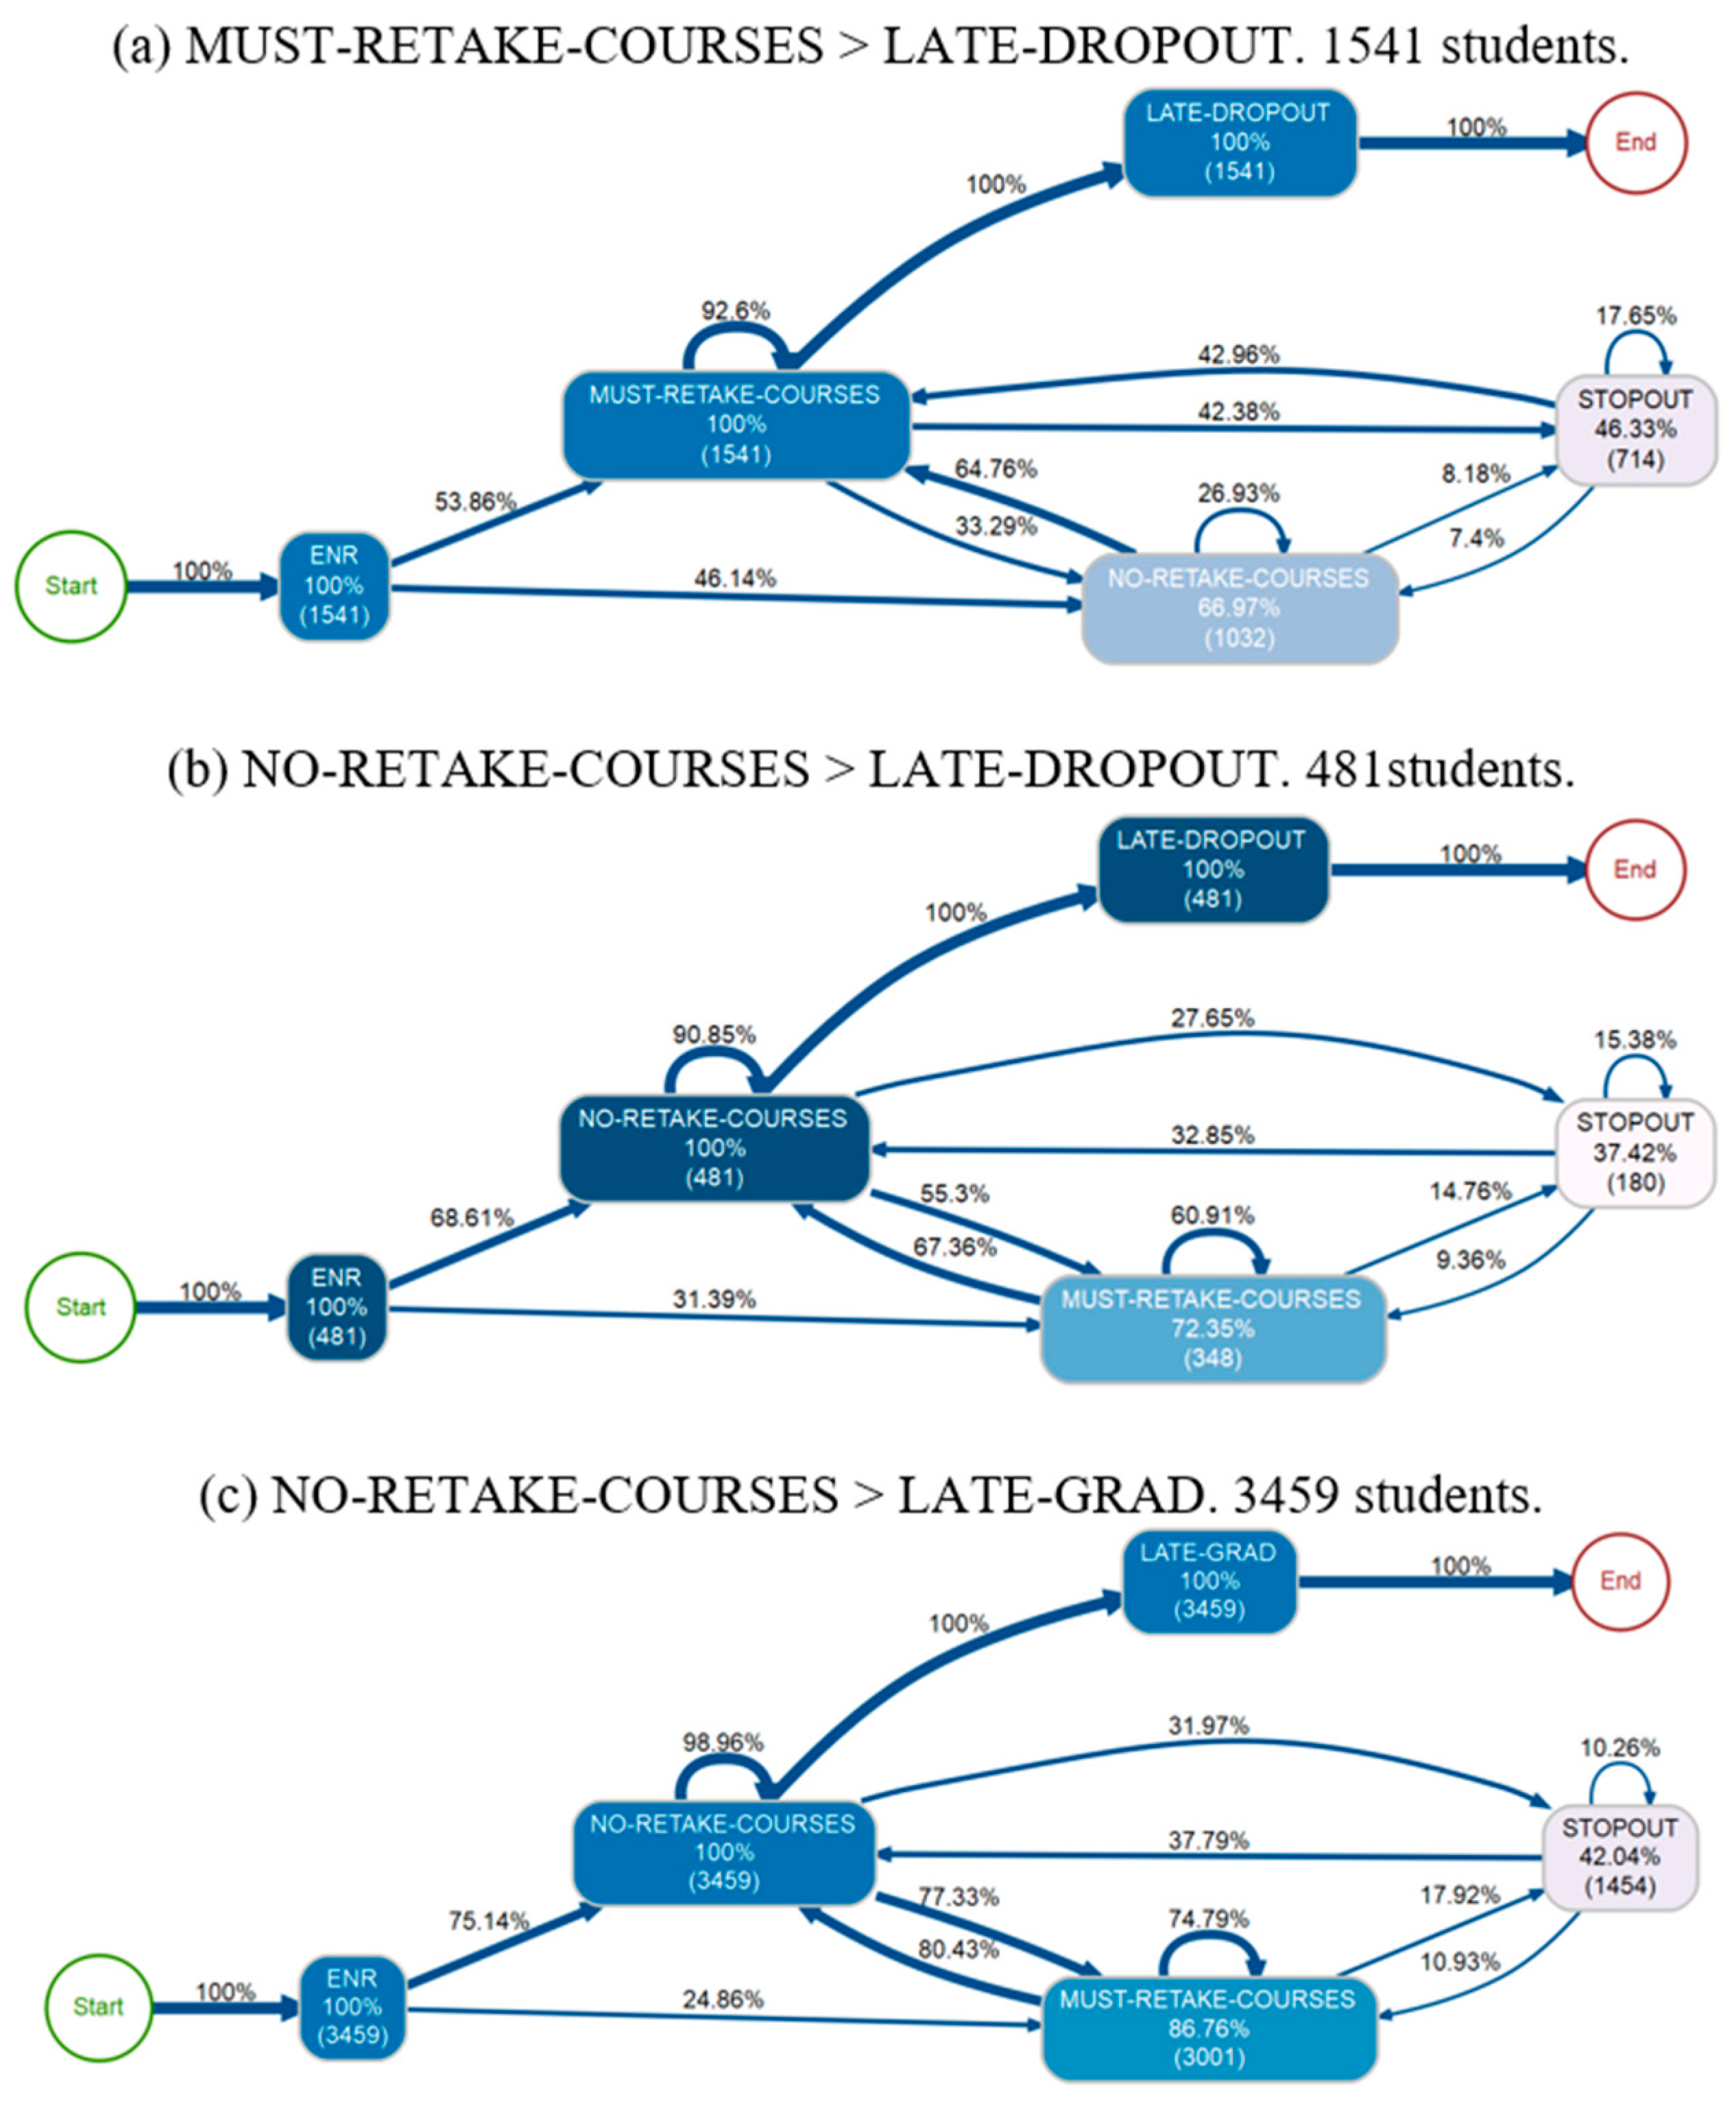
(F4) It is possible to distinguish two groups of educational trajectories among those students who dropped out late, according to the last result event before dropout. Students who ended in late dropout with high-failure rate courses they must retake had educational trajectories that were on average shorter and less satisfactory than students who ended in late dropout without high-failure rate courses they must retake.
Figure 5a shows that 76.21% of the students who ended in late dropout (1541 over 2022), dropped out having high-failure rate courses they must retake. They had an average program permanence period of 8.97 semesters. In addition, 66.97% of them had semesters with NO-RETAKE-COURSES, but only 26.93% had consecutive semesters with NO-RETAKE-COURSES. Moreover, 92.6% of the students had consecutive semesters with MUST-RETAKE-COURSES, only 8.18% of the students had transitions NO-RETAKE-COURSES > STOPOUT, and only 7.4% of the students had transitions STOPOUT > NO-RETAKE-COURSES. All these characteristics describe unsatisfactory educational trajectories.
The other group,
Figure 5b, which represents 23.79% of the students who ended in late dropout (481 over 2022), dropped out without high-failure rate courses they must retake. They had an average program permanence of 10.8 semesters; 90.85% of them had at least two consecutive semesters with NO-RETAKE-COURSES, only 14.76% had transitions MUST-RETAKE-COURSES > STOPOUT, and only 9.36% had transitions STOPOUT > MUST-RETAKE-COURSES. All these characteristics describe more satisfactory educational trajectories.
Figure 5.
Educational trajectories in high-failure rate courses, according to the RETAKE-STOPOUT model. (a) Shows only students who had MUST-RETAKE-COURSES > LATE-DROPOUT transitions. (b) Shows only students who had NO-RETAKE-COURSES > LATE-DROPOUT transitions. (c) Shows only students who had NO-RETAKE-COURSES > LATE-GRAD transitions. The darker color of the nodes represents a higher percentage of students who went through a state. The thickness of the arrows represents the percentage of students who had transitions between both states. All values are percentages in relation to the total number of students included in each model.
(F5) Students who ended in late dropout without high-failure rate courses they must retake had educational trajectories with similar characteristics to those of students who graduated late.
Comparing
Figure 5b, which shows the educational trajectories with NO-RETAKE-COURSES > LATE-DROPOUT transitions, and
Figure 5c, which shows the educational trajectories that ended in LATE-GRAD, several similarities can be identified. First, the proportion of students who have ENR > MUST-RETAKE-COURSES transitions are close. Second, the frequency of educational trajectories that included a STOPOUT was similar between both groups, as well as the frequency of NO-RETAKE-COURSES > STOPOUT, STOPOUT > NO-RETAKE-COURSES, MUST-RETAKE-COURSES > STOPOUT and STOPOUT > MUST-RETAKE-COURSES transitions.
However, there are two main differences between these two groups of educational trajectories: The frequency of trajectories with MUST-RETAKE-COURSES and the frequency of consecutive MUST-RETAKE-COURSES are higher in those that ended in LATE-GRAD.
6. Discussion
The use of Process Mining techniques to model educational trajectories based on academic records allowed us to analyze them with a comprehensive process-oriented approach. Classic data mining techniques, such as classification, clustering, and regression, are not process-oriented, so they only make it possible to discover local patterns [
21]. Process Mining discovery algorithms, combined with statistical techniques, provide visual representations that allow an easy-to-understand analysis, which have helped us to comprehend the process that led undergraduate students to drop out after two or more years of study.
We proposed a novel curricular analytics approach to modeling the educational trajectories in high-failure rate courses, called RETAKE-STOPOUT model. It allows understanding the educational trajectories of late dropout students from a longitudinal perspective and generates new knowledge about the dynamic behavior of students. We have also showed the relevance of contrasting the obtained results using theoretical models of the educational domain [
31,
33]. We believe that this approach is relevant for an international audience, because it helps to understand the complex nature of enrollment patterns [
36] from a longitudinal perspective, and this knowledge can lead to improvements in the curriculum and follow-up mechanisms used to increase student retention. Researchers and practitioners could use this approach to analyze educational trajectories in different contexts. Following, we discuss the findings of this research in light of previous literature.
First, we have found differences in the educational trajectories in high-failure rate courses among students who took a stopout while having or not courses they must retake. F1, F2, and F3 are relevant because the relationship between high-failure rate courses that students must retake and stopout has not been previously investigated, and we believe that these findings might not be specific just to this case study, but more general. Moreover, although the factors that explain dropout have been widely covered by the literature, there have been less research to understand the return of students to the university after a stopout [
36]. However, several previous studies could help to explain the observed behavior in this work. Donhardt [
45] showed that a higher proportion of failed courses and the existence of stopouts had a negative impact on graduation, but this study was not specific with regard to high failure rate courses, and the sequence of events was not analyzed. Schulte [
46] mentioned that stopout related to academic reasons is more often linked to dropout, because stopout could be used as a strategy to avoid or postpone failure by those students who eventually end in late dropout. Students who return from a stopout with high-failure rate courses they must retake have distanced themselves from their peer group, affecting both their sense of belonging and their self-efficacy beliefs [
31]. However, F2 shows that there are differences among ISCED fields. For Donhardt [
45], stopping out has a deleterious effect on graduation. Our results support that assertion for programs belonging to the ISCED fields of Agriculture and Engineering, Manufacturing, and Construction (F2). Nevertheless, the opposite was observed for the ISCED field of Health and Welfare. These results are consistent with Danaher [
39], who relate dropout behavior with the culture of different ISCED fields at universities.
Second, we have found differences in the educational trajectories in high-failure rate courses among students who ended in late dropout while having or not having courses they must retake. We believe that this finding is of general interest, beyond this case study, and the approach used in this article could be replicated in other universities and countries. Both groups of students who ended in late dropout can be associated with the two categories of students who leave STEM-related study programs that were identified by Seymour and Hewitt [
47]: Those who feel they should leave due to a loss of academic self-confidence, and those who are disappointed with the curriculum. Recently, both groups have also been found also in other ISCED fields [
48,
49]. Another possible explanation for a student dropping out of a study program without high-failure rate courses they must retake could be a lack of funding. We believe that scholarships and loans coverage in the Chilean university system is sufficiently broad [
50], and it does not represent the main cause.
According to Tinto’s model [
31], a change in goals and a low perceived worth of the curriculum should better explain the decision to drop out. Moreover, the students’ perceived usefulness of the curriculum has been linked to persistence [
51]. We have identified specific characteristics of the educational trajectories of this group of students that make them more similar to those who graduated late. For example, the high frequency of consecutive semesters without high-failure rate courses they must retake, and the low frequency of high-failure rate courses they must retake before and after a stopout. Regarding the Investment model [
33], we can hypothesize that although the satisfaction level of these students could decrease over time, at the same time, the size of their investment increases. Because the investment size has a positive influence on the decision to stay, those students who have been enrolled in an academic program for a long time usually postpone the decision to drop out for several semesters. Hence, Hovdhaugen [
52] links the level of student effort with the probability of transfer or dropout. Moreover, there is an interconnection between external and internal factors that lead to late dropout, making it difficult to isolate these factors [
53]. Therefore, this group of educational trajectories should be studied in more detail, considering the behavior in courses of lower failure rate and also surveying the satisfaction level and the alternatives that are being considered over time, according to the Investment model [
33].


