1. Introduction
Gas leaks and emissions are challenges for various industries like petrochemical and oil and gas industries resulting in financial losses and possibly human injuries. Therefore, in recent years, significant efforts are dedicated to developing reliable gas leak detection techniques. Moreover, some studies are devoted to introducing techniques for detecting the origin of possible leaks for launching corrective measures.
Gas leaks can be very dangerous to health and the environment. In confined spaces like buildings, even a small leak in pipelines can gradually build up to be an extremely lethal or even explosive amount of gas which can endanger staff. The release of some gases such as natural gas, propane, and isobutane into the atmosphere is harmful due to their effect on global warming or ozone depletion. Another area would be fugitive emissions which is the emission of gases from industrial equipment due to leaks or other sources of gas release which can lead to an increase in air pollution [
1]. The analysis of gas emission can be very beneficial in many industries such as chemical manufacturing or oil and gas. The early detection of many hazardous gases, for instance, Volatile Organic Compounds (VOCs) or Methane can increase the functional safety of the system and prevent any health risk for the personnel. Unfortunately, there have been many incidents during previous years that show the importance of providing reliable gas leak detection techniques as preventive measures. For instance, in July 2014, the occurrence of methane gas leak at Bhilai plant of Steel Authority Of India, caused the loss of six human lives [
2]. The significance and consequences of gas leaks for the environment and human life motivated industries and governments to conduct regulated inspections as preventive measures to avoid such incidents.
Gas leaks can cause financial losses for the companies and the end-users. For example, in the case of natural gas, possible gas leaks can cost companies and end-users significantly. The increase in the number of natural-gas consumers causes the rapid expansion and construction of gas pipelines and distribution centers [
3]. Based on the report of the European Gas Pipeline Incident Data Group, the length of the gas transportation pipelines has grown more than 21% in the 1970–2016 period and the total length of natural gas distribution has almost reached 2,200,000 km in Europe [
4]. The length and expansion rate in pipelines also increase the possibility of leaks and failures, making the necessity of regular and reliable inspection more significant and critical to avoid financial losses and dangerous incidents. These losses are not limited to companies and distribution systems; the possible leakages in buildings and industrial sites can cost end-users. Google Earth and Environmental Defense Fund collaborated by equipping Google Street View mapping cars with required sensors to map the methane gas leaks in various urban areas like Boston, Indianapolis, and New York City’s Staten Island. The map shows methane seeping from thousands of aging pipes in the cities. Although the leaks were all low-level, end-users pay for the leaked gas [
5].
To prevent gas leaks, many organizations and companies devoted a significant amount of efforts and investments to provide reliable and efficient gas leak detection techniques. Additionally, several surveys and studies were conducted on the gas leak related incidents by various organizations. One study stated that during the 1996–2006 period, eighty pipeline rupture incidents were reported in the Gulf of Mexico and Pacific areas. The report demonstrates that the probability of occurring an incident in this specific area is 0.43 incident per year [
6,
7]. Another report focused on the risks of pipeline transportation states that around 1326 gas leaks were reported in Alberta, Canada between 2001 and 2005 [
8]. All the reviewed surveys emphasize the consequences and prevalence of gas leak detection methods demonstrating the importance of finding reliable techniques as an essential preventive measure. In order to decrease the risks and potential product loss, industries rely on accurate and reliable reports and analyses prepared by experts for detecting the issues and maintain the systems. Therefore, providing the tools and automation processes can assist inspectors in providing more reports with less human error in a more satisfying time frame. Additionally, since the corrective measures require more extensive information about the leakage such as origin, severity, and size, recent studies also are focused on providing comprehensive approaches to detect and characterize gas leaks.
One of the fundamental requirements for an effective corrective measure is the identification and quantification of the leaks like the level of gas concentration and approximation of the source’s location. Therefore, the proximity of equipment or inspectors to the possible leaks increases the reliability of the analysis. Conventional inspection approaches for gas leak detection requires direct contact of inspectors with the environment. Due to the hazardous nature of these gases, an inspection of these sites can put the personnel at considerable health risk. In addition, likely access constraints imposed by the conditions like height or temperature of an operating facility can make the inspection very challenging or even impossible. The challenges and requirements motivated companies to use flexible and mobile units to carry on the inspections. Ground-vehicles equipped with gas analysis technologies can certainly increase the reliability and safety of such inspections. However, in many scenarios, it is very hard or impossible for them to reach the emission source because of the height or complex structure of the component. Using unmanned aerial vehicles for the inspections can decrease the risk as well as the cost and time of the operation. The maneuver capabilities provided by drones can assist inspectors with better access to the facilities and reduce the inspection time, which can motivate the companies to perform them more regularly. Moreover, this approach minimizes the number of required staff on-site, which can also lead to cost- and time-saving and an increase in operational safety. Therefore, introducing drone-enabled techniques for the detection and characterization of gas leaks is very essential and is the main motivation behind this study.
In this paper, we introduce an approach to enhance the visibility of possible gas leaks in recorded image streams using image flow analysis. Moreover, we investigate the possibility of locating the origin of possible gas leaks based on gas concentration. One of the issues in the analysis of drone-recorded image streams is the rigid motion of UAVs during hovering, which can diminish the usability of the recorded image streams. In this paper, we investigate the use of video stabilization methods for minimizing the effect of such motions.
The organization of this paper is as follows, The literature review and a survey about the current methods of gas leak detection are presented in
Section 2. The video stabilization and gas leak detection techniques are described in
Section 3.2 and
Section 3.3 respectively. Moreover, the experiments and results are presented in
Section 4 and
Section 5. Finally, the conclusion of this work is presented in
Section 6.
2. Literature Review
Gas leak detection techniques can be classified into various categories based on the level of human involvement and employed technologies. The level of human involvement is one of the factors that would be important especially for the detection of possible hazardous gas leaks. The gas leak detection techniques can be classified into three main categories based on the level of human intervention, (a) automatic detection, (b) semiautomatic detection, and (c) manual detection. The automatic detection methods mostly include installed sensors and monitoring systems that can detect the leaks completely automated. Semiautomatic detection approaches require certain human inputs or assistance to perform the task and manual detection techniques involving the sensors that need to be directed by operators [
6].
Gas leak detection techniques can also be categorized based on the employed technology. Some studies classify the detection approaches into optical and nonoptical due to the wide range of optical methods used for leak finding purposes [
9,
10]. Moreover, they can be considered based on their detection approaches and grouped into direct and indirect approaches. The direct approach involves the use of systems and sensors like a thermal camera to find the possible gas emanations while in the indirect approach, the leaks are detected by measuring the variation in some of the parameters such as flow rate or pressure in the targeted system like pipeline [
11]. One of the most used ways to categorize the gas leak detection methods is based on their technical nature [
6,
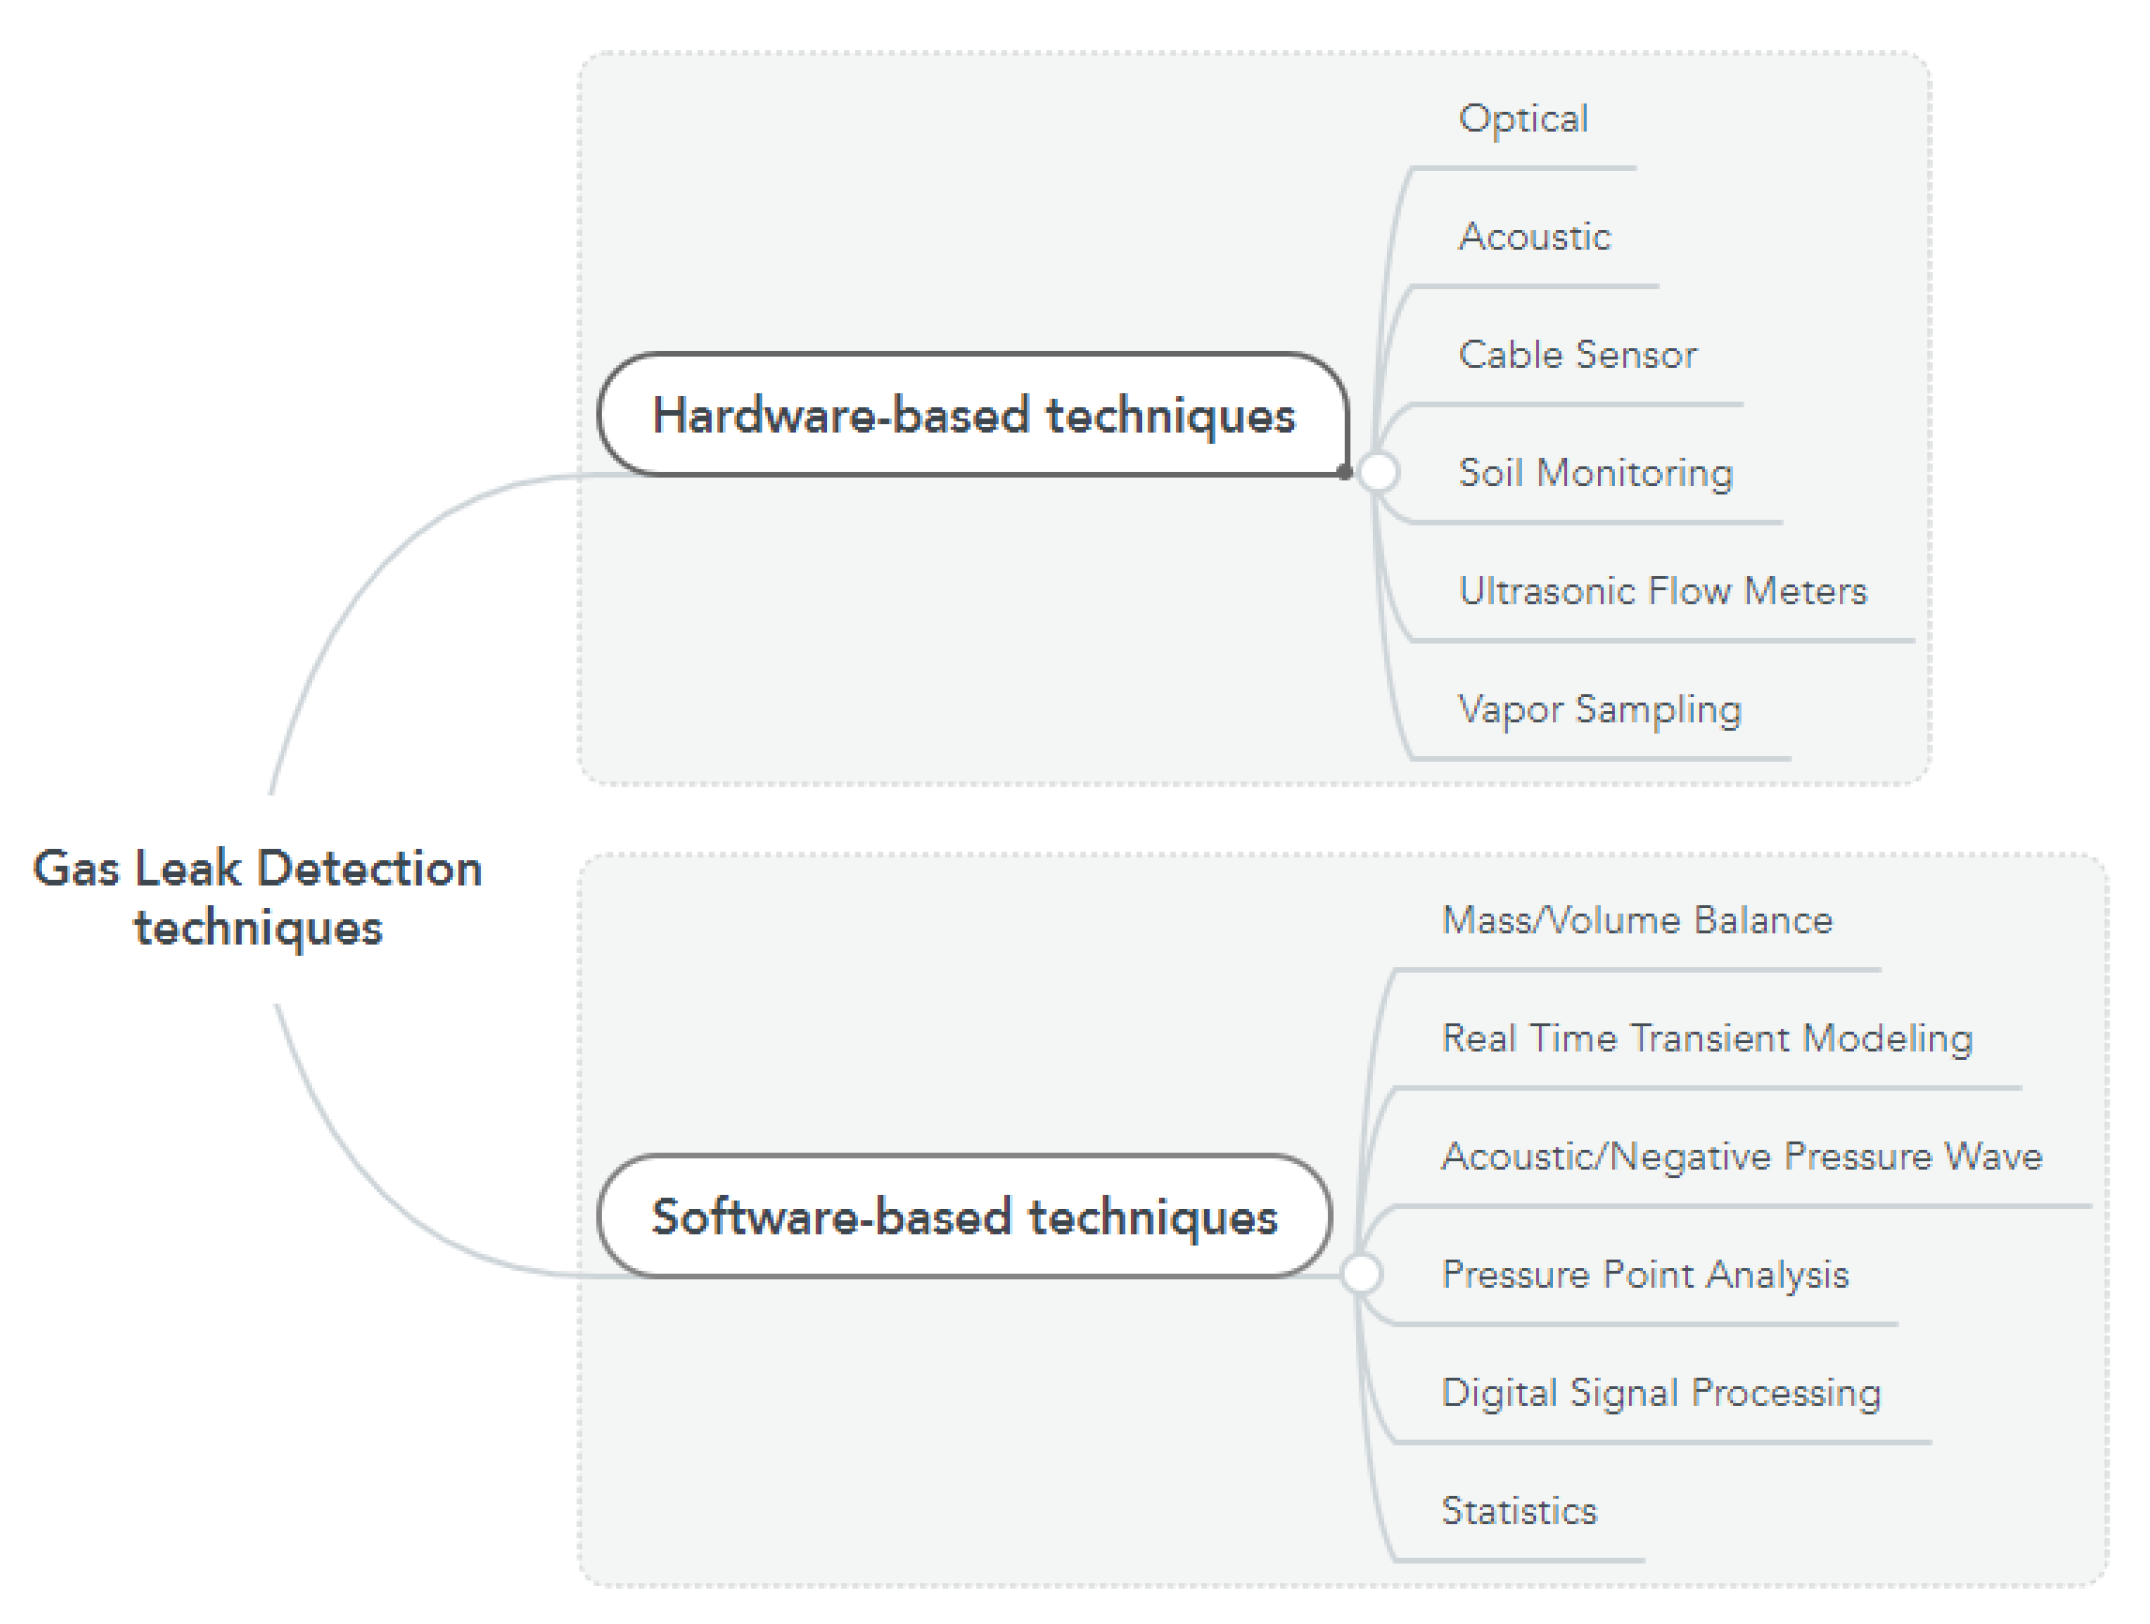
12], (a) hardware-based techniques, and (b) software-based techniques. Hardware-based techniques basically use a sensing system to detect possible gas emanation. These methods can further be classified based on the type of sensors that they employ for detection. On the other hand, software-based techniques continuously monitor and analysis the parameters of a system like a pipeline to detect possible signs of gas leaks. The categories and the subcategories are demonstrated in
Figure 1.
Acoustic methods determine the existence of gas leaks based on the fact that escaping gas generates an acoustic signal as it flows through a crack in the pipe. The inspection can be carried out with handheld detection devices used by operators moving alongside the pipeline [
13]. Moreover, continuous monitoring is possible using installed sensors on the pipeline’s outerior with fixed distance [
14]. Cable sensors are another type of sensor for gas leak detection. The cables are made of specific materials reacting when in contact with a certain medium. The changes in parameters can be monitored and utilized for leak detection purposes. Cable sensors are fast in responding and more sensitive than many other approaches. However, the cost of implementation is high and the difficulty of retrofitting the sensors to the existing pipelines are the main disadvantages of cable sensors. Additionally, cable sensors are not able to provide leak size estimation. Soil monitoring is another type of gas leak detection involving the use of tracer compounds on pipelines [
15]. In this method, high sensitivity and low false alarm rates are the advantages and the high cost of applying this method is the main disadvantage.
Optical methods for the purpose of leak detection can be categorized into passive and active techniques. In active methods, the targeted area is excited by an external radiation source. On the other hand, passive methods do not require excitation source [
16]. The optical methods have many advantages including portability, contactless detection, and locating the origin of the leakage. In many scenarios, the optical sensor is installed on an aircraft or ground vehicle for detecting a long pipeline. One of the passive methods for gas leak detection is to employ a thermal imaging system. Thermal imaging systems visualize the temperature difference between leaked gas and the surrounding environment to detect leaks. However, one of the disadvantages of using thermal imagers is that the detection cannot be done if leaked gas has the same temperature as the surrounding environment [
17].
In recent years, many studies focused on the use of drones and mobile robots for gas leak detection applications. Daugela et al. (2020) used a microcontroller-based gas sensor array together with an imaging system installed on a drone for the sole purpose of localizing
emission hotspots [
18]. Some studies employed measuring instruments for gas leak detection installed on an aerial platform as a candidate solution for gas leak detection. Frish (2020) presented an aerial near-infrared laser sensor platform creating quantitative plume images by scanning laser beans for locating and visualizing methane gas emissions [
19]. The study demonstrates that the introduced active laser-based QGI technology is more sensitive, quantitative, and independent of ambient conditions than passive thermal infrared optical gas imaging systems. Another study utilized a modified version of an open-path tunable laser diode absorption spectrometer installed on a fix-wing drone for locating the methane gas emissions in upstream natural gas networks [
20]. In addition, in the study conducted by BAM Federal Institute of Materials Research and Testing in collaboration with AirRobot, a micro-UAV platform which is capable of measuring hazardous gas concentrations and locating the sources were presented that uses five gas detectors embedded in an aerial platform [
21].
One of the popular approaches for drone-enabled gas leak detection is the use of optical imagers like thermal imaging systems for aerial platforms. Shi et al (2020) introduced a real-time automated technique for hydrocarbon gas leak detection. They used Faster R-CNN neural network integrated with optical gas imaging technology [
22]. Due to the real-time capability of the algorithm, it can be possible to embed the technique in an aerial platform for instant detection and reporting. Druart et al. (2020) addressed the visualization of methane gas leak detection by using an LWIR Cryogenic multispectral infrared camera installed on a Hexarotor drone [
23]. One study investigates a comparison study between a few approaches for gas leak detection to provide a more comprehensive analysis of available methods [
24]. They employed different gas sensors and a thermal camera installed on a Quadrotor for the experiment. The integrated system provides a gas distribution map of the investigated area. Kroll et al. (2009) proposed an automated system for detection of pressured air and gas leaks [
17]. The system takes advantage of infrared thermography embedded in a mobile robotic platform to conduct automated routine inspections of facilities.
3. Methodology
As discussed in
Section 1, gas leaks in industrial sites can cause financial loss and human injuries, thus many companies invest in finding solutions assisting inspectors to more accurately locate and assess the possible gas leaks. These approaches involve enhancing the visualization of gas emanations and automating the detection and characterization of gas leaks. The optical methods especially thermal imaging systems are one of the most common approaches since the minimum setup is required and an inspector can carry the equipment while moving alongside the pipeline. However, the hazardous nature of leaked gases and the length of pipelines motivated companies to find alternative ways to conduct the inspections. The use of aerial platforms like a drone is one of the most convenient and effective ways to conduct such inspections. A drone can move alongside a specimen and obtain the required data in a shorter amount of time compared to a conventional approach. In addition, drones can minimize the risk of any human injuries as there is no need for close-contact.
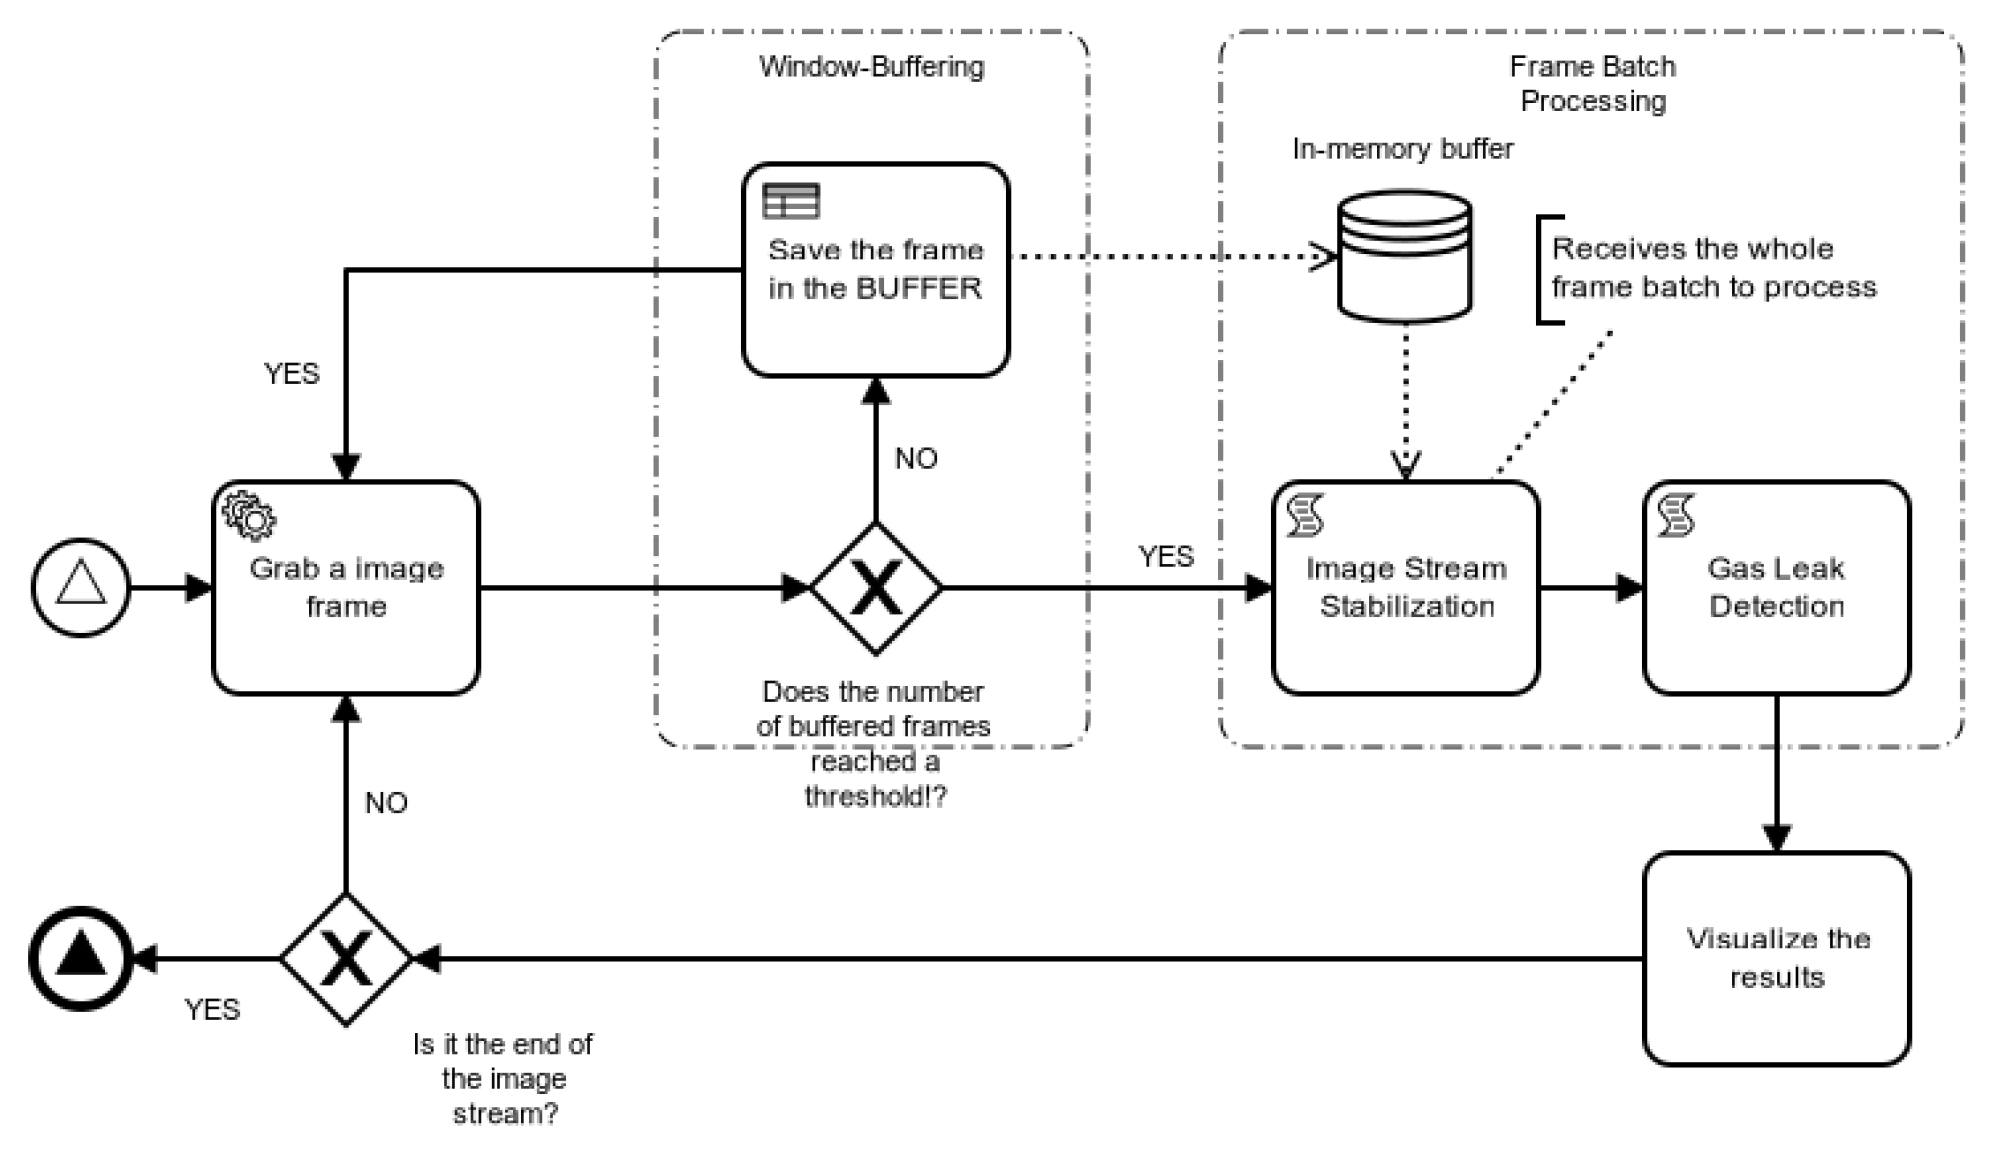
In this study, a process pipeline is proposed involving three main steps as shown in
Figure 2: (a) a fixed-size frame buffering, (b) a stabilization technique to remove unwanted motions of hovering drone, and (c) an approach for detection and visually-enhance gas emanations using optical flow analysis of thermal image streams. The system collects frames and keeps them in a buffer. When the buffer reaches a predefined size, the frames are batched and passed to the stabilization technique minimizing the effect of the drone’s motions on the gas leak detection algorithm. Finally, the proposed algorithm is employed to process the frames and to provide expected results: (a) probabilistic map, (b) hotspot, and (c) the area with the highest flow intensity.
3.1. Frame Buffering for Batch Processing
The introduced gas leak detection algorithm processes all the frames in an image stream to provide the expected results, which means it cannot be used as a real-time process deployed in an aerial platform. As shown in
Figure 2, to address this issue, a frame buffering technique is employed to provide real-time continuous detection and visually-enhancement of gas emanations. In this approach, a fixed-size buffer is defined that collects all the acquired thermal image frames and passes them as a frame batch to the remaining steps when its size reaches a predefined threshold. In this way, the system is expected to provide continuous results. In addition to real-time capabilities, this approach makes the proposed algorithm more dynamic and more resistant to large drone’s movements as it brings the focus more on recent frames. In Algorithm 1, the proposed steps to process the online thermal image stream for gas leak detection and visually-enhancement of gas emanation are explained.
| Algorithm 1: The proposed steps for drone-enabled gas leak detection and visually-enhancement of gas emanation. |
 |
3.2. Image Stream Stabilization
Despite the benefits introduced by using aerial platforms for inspection of industrial sites, some challenges may need to be addressed to open the door for employing drones in various applications. One of the open areas that certainly can take great benefit of using drones, is where constant monitoring and data acquisition of an area using a thermal camera for a period of time, is required. Normally, it is expected that both the camera and the specimen maintain their position to accurately analyze the temporal changes in thermal behavior. This presumption can be problematic in a drone-based inspection as the drone may experience slight movements while hovering which can disturb the post-analysis. Therefore, using a stabilization method to remove undesired motions, is a necessary step in these applications.
Generally, image stream stabilization methods can be categorized into spatial and frequency domain techniques. Spatial-domain techniques use intensity patterns or features to match images and define the proper transformation model. On the other hand, frequency-domain methods determine the transformation parameters while operating in the transform domain. Spatial-domain methods normally have higher accuracy and are able to detect large transformations, but they need more computation resources. Moreover, they mostly require a certain amount of feature points to be able to minimize the estimation error. On the other hand, frequency-domain approaches define the transformation model including rotation, translation, and scale by their counterparts in the frequency domain. They are different from other methods because they look for the optimal match based on the information available in the frequency domain [
25]. Phase correlation is a frequency-domain based method for image registration. Unlike spatial-domain methods, phase correlation is resilient to noise and other defects. In addition, they have lower time-complexity which makes them suitable for real-time applications using embedded systems with limited resources. One of the problems with image alignment based on correlation is that they cannot accurately define the transformation model when there is a large rotation or scale factor [
26].
In this study, the main objective of using a stabilization method is to minimize the effect of the drone’s unexpected motions while hovering because the presented gas leak detection method is sensitive to motions and changes in the environment. Here, a comparative analysis is conducted between four candidate methods: (a) a feature-based method with moving averaging filter for smoothing (AVS) [
27], (b) a stabilization method with robust L1 optimal camera path (L1-OP) [
28], (c) an approach based on phase correlation (PC-RF), and (d) an optimization-based stabilization method (OPC) [
29]. The stabilization step involves the following steps: (a) perform the stabilization on the buffered frames and (c) crop out black borders resulted from the stabilization method.
The phase correlation approach is a two-steps stabilization method. In this method, the first frame is considered as a reference frame, then the phase correlation method is employed to generate the preliminary transformation matrix for prealignment of the reference and current frames. Phase correlation is a frequency-domain technique providing an estimation of the rigid transformation model between two images based on Fourier shift property [
30]. Then, an intensity-based image registration technique explained in [
31,
32] is used to minimize the registration error. The method is an iterative optimization-based technique that uses the two frames as a similarity metric to optimize the transformation matrix initially generated by the phase correlation method. Finally, the transformation matrices are combined to align each frame to the previous frames based on the reference frame using Equation (
1), where
is the absolute transformation based on the reference frame and
is the transformation matrix of frame
n.
3.3. Gas Leak Detection
In this section, the proposed method for visually-enhance gas emanation and gas leak detection is explained in detail. As described in Algorithm 2, firstly, a set of preprocessing steps is applied on the image frames to improve the result of optical flow analysis using an adaptive histogram-based adjustment technique. For this method, the first frame is considered as the reference to adjust the histogram of the remaining frames. Next, all pixels with illumination differences lower than a predefined threshold (
) are omitted. The threshold (
) determines the algorithm’s flexibility on temporal illumination changes and it is set manually based on the environmental conditions such as the existing noises in the image, the level of motions, and illumination variations. Additionally, adaptive thresholding [
33] is used to binarize the frames and remove the outliers. For binarization of the frames, a parameter (
) is used to determine the sensitivity of the thresholding process. For the experiments, it is set by comparing the results of using different values.
| Algorithm 2: Gas emanation visually-enhancement and Gas leak detection algorithm. |
 |
In the next step, Farneback optical flow [
34] is used to create the motion map representing the orientation and magnitude of local changes. Then, the magnitude map is processed to filter out the motions with magnitudes smaller than a defined threshold (
).
determines the algorithm’s sensitivity for lower motions and its value is determined based on the magnitude and volume of expected gas emanations. Later, the series of magnitude maps are combined to form a probabilistic map
determining the probability of the occurrences of local motions as shown in Equation (
2), where
is the magnitude map of
kth frame. In this way, the effect of noises and small changes is minimized. Additionally, the probabilistic map is processed to remove sudden and inconsistent local motions based on a defined threshold (
). The elements of the probability map demonstrate the occurrence rate of local motions. Thus, the higher threshold value causes the algorithm to lean on the more repetitive local motions with higher occurrence rates and magnitudes. Therefore, its value can be determined based on the pattern of gas emanation, the severity of the expected leak, and the weather situation. Finally, the hotspot area which contains the highest probability values and the area with the highest flow intensity are determined based on the probabilistic map.
5. Results and Discussions
The presented system in this paper involves two main steps: (a) stabilization and (b) gas leak detection. In this section, the acquired data from the experiments explained in
Section 4 are used to evaluate the two main steps and the general performance of the system. In the following, a comparative analysis of candidate methods is provided in
Section 5.1. In addition, the proposed gas leak detection method is evaluated in
Section 5.2. It is worth mentioning that all the analyses were carried on a Ubuntu 18.04 Linux operating on a workstation with Intel Core i7-9750H CPU, 16GB RAM, and Nvidia Quadro T1000 Graphic card.
5.1. Comparative Analysis between Stabilization Methods
In this section, a comparative analysis between the candidate methods based on collected data from Experiment C explained in
Section 4.3 is conducted to demonstrate their performance in the defined scenarios. The comparative study involves visual tests and quality assessment. The visual test is the visual examination of the results providing required insight into the behavior of the candidate methods. For quality assessment, few metrics are defined to evaluate the methods from different aspects.
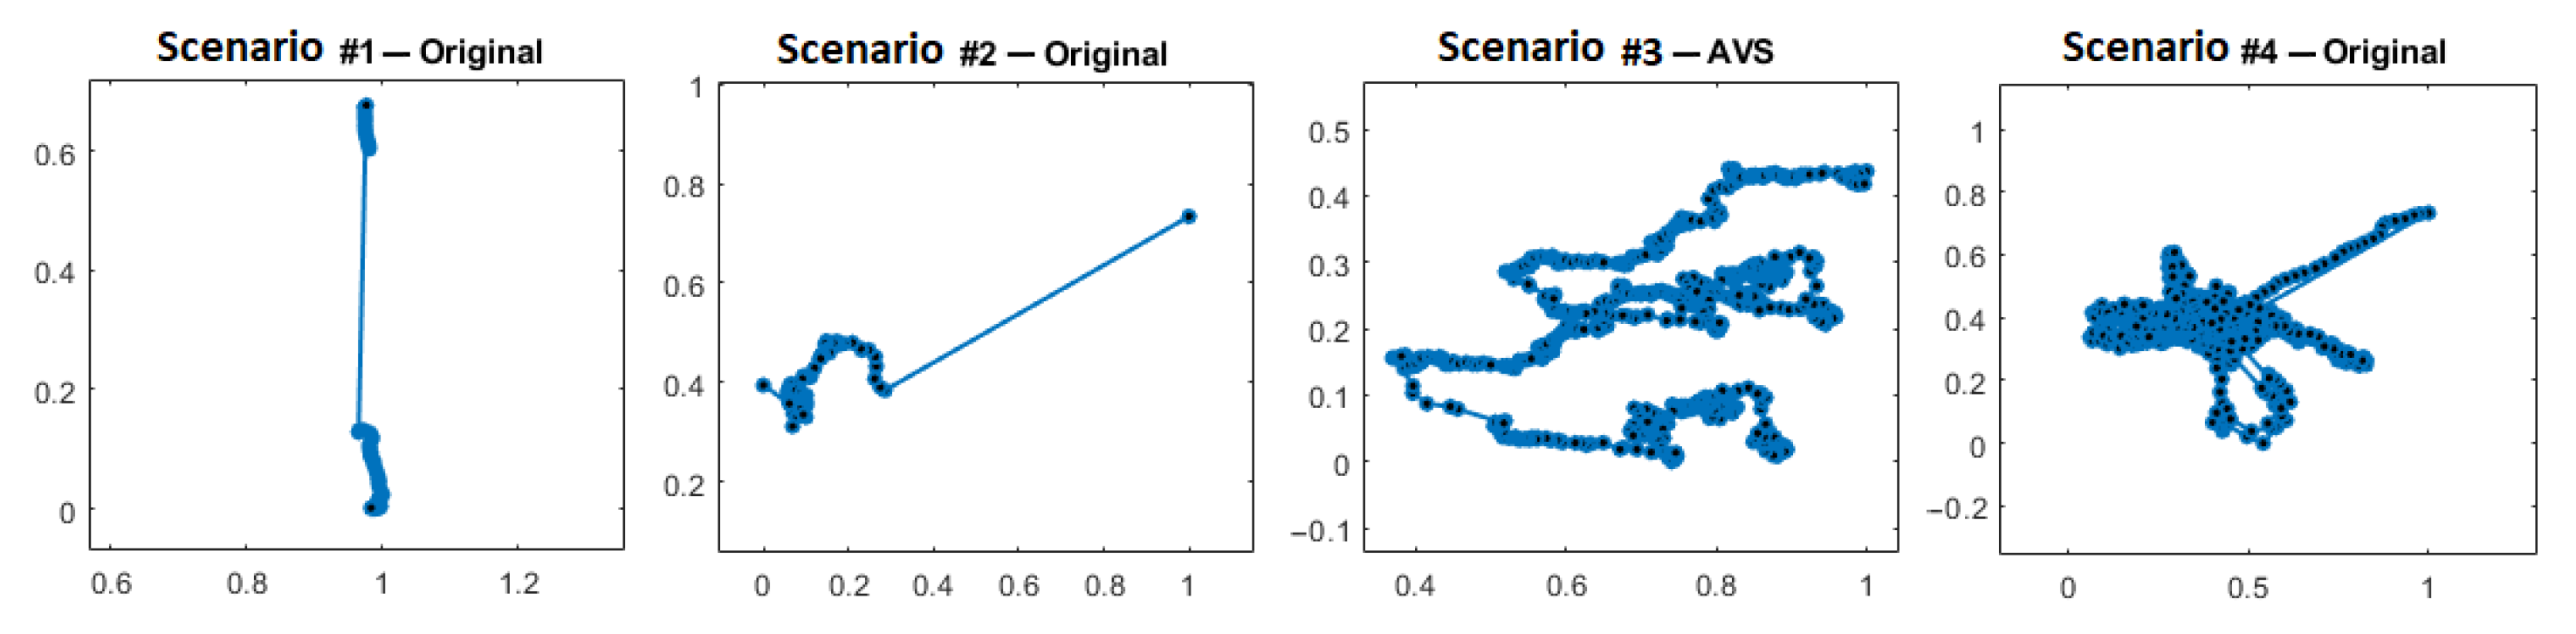
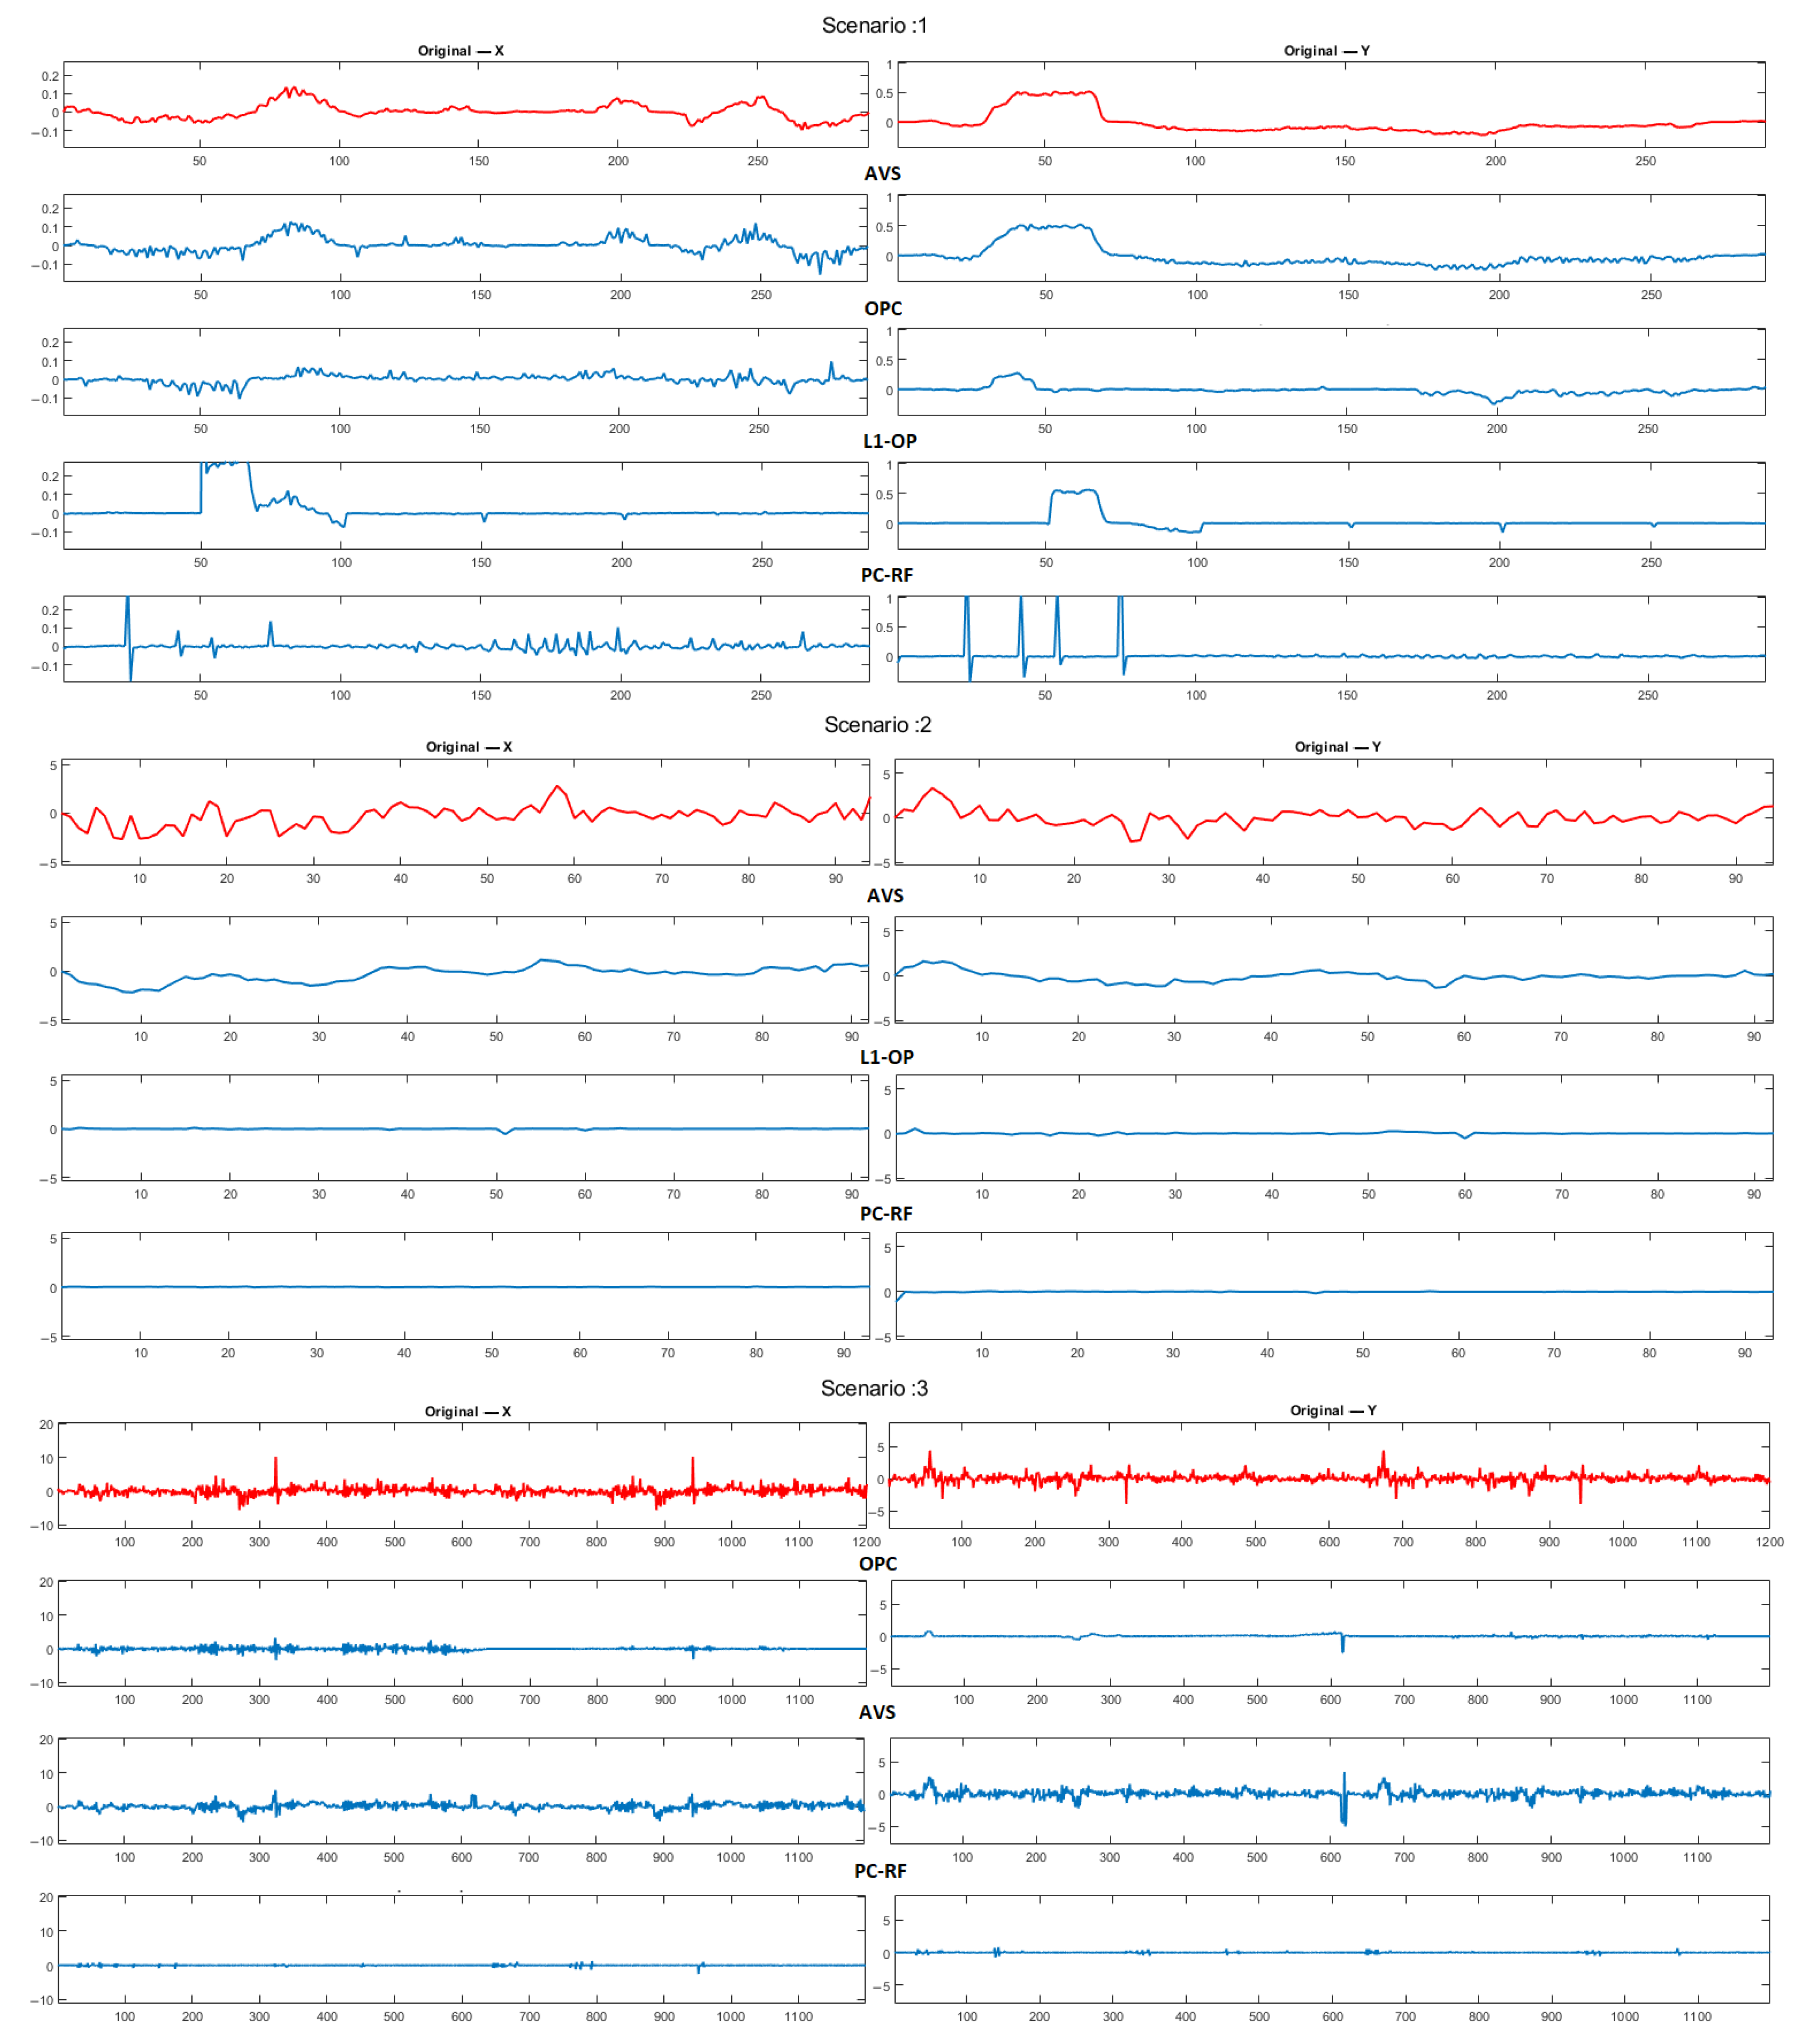
For the visual test, the x- and y-axis global trajectory is calculated; the global trajectory demonstrates the approximate camera motions before and after stabilization based on the reference frame (the first frame of the frame batch). The reference frame is considered since the main objective of stabilization here is to minimize the camera motions to be able to analyze the flow motions of gas emanation.
Figure 7 demonstrates the video trajectory in the x and y-axis for the first, second, and third scenarios.
In the first scenario, AVS mostly smoothened the camera motion but failed to minimize them; on the other hand, OPC, L1-OP, and PC-RF were mostly able to reduce the effect of camera motions. In addition, L1-OP showed a significant ability to remove small camera motions while not being effective enough for larger motions. PC-RF demonstrated the ability to minimize the motions significantly; however, the inaccurate frame registration in few cases especially during sudden movements needs further consideration. In the second scenario, OPC was not able to provide stable and significant results, but AVS, L1-OP, and PC-RF were able to effectively perform the stabilization. For this case, L1-OP and PC-RF presented significant results and minimized the camera motions which shows their ability to stabilize thermal footages. The third scenario involves a larger amount of shaking in the footage, as well as moving objects in the scene. In this scenario, PC-RF and OPC demonstrated a significant ability to remove the motions, but L1-OP was not able to provide referable results.
Quality Assessment
In this study, few metrics are defined to describe the performance of the stabilization methods from different aspects: (a) Processing Time (PT), (b) Interframe Transformation Fidelity (ITF), (c) Interframe Similarity Index (ISI), and (d) Average Speed (AvSpeed). The analysis produced by these metrics can provide insight into the algorithms’ behavior based on the scope of this study’s objectives.
The processing time is one of the metrics considered in this paper. The required time for processing one frame can be an essential factor in a real-time process flow. Here, the processing time for stabilizing a frame is measured to analyze the real-time capability of the candidate methods. The results of this analysis are shown in
Figure 8. Based on the results, PC-RF has the highest processing time while the processing time of AVS, L1-OP, and OPC is suitable for real-time applications.
In addition to processing time, other metrics are defined to assess the performance of the methods. The most common metric for evaluating the performance of video stabilization techniques is Interframe Transformation Fidelity (ITF) [
36,
37] which is based on Peak Signal to Noise Ratio (PSNR) measurement. In this study, PSNR calculates the degree of deviation from the reference frame considered as optimal output by using Mean Squared Error (MSE). The higher PSNR value represents higher system performance. ITF and PSNR are shown respectively in Equations (
3) and (
4), where
N and
M are height and width of the image frames,
is the number of frames. Since the similarity of frames with the reference frame can be assumed to be high in the lack of sudden and large camera motions, in addition to the similarity factor, ITF can evaluate the resulted distortion in the stabilization process. It is worth mentioning that ITF value of a series of repetitive image frames would be infinity.
Interframe Similarity Index (ISI) is another metric used in this study which is simply the average of Structural Similarity Index (SSIM). SSIM can be defined as the structural similarity index between the reference frame and another frame in the footage, which is explained in Equation (
5). ISI shows the perceptual similarity of frames and the reference frame.
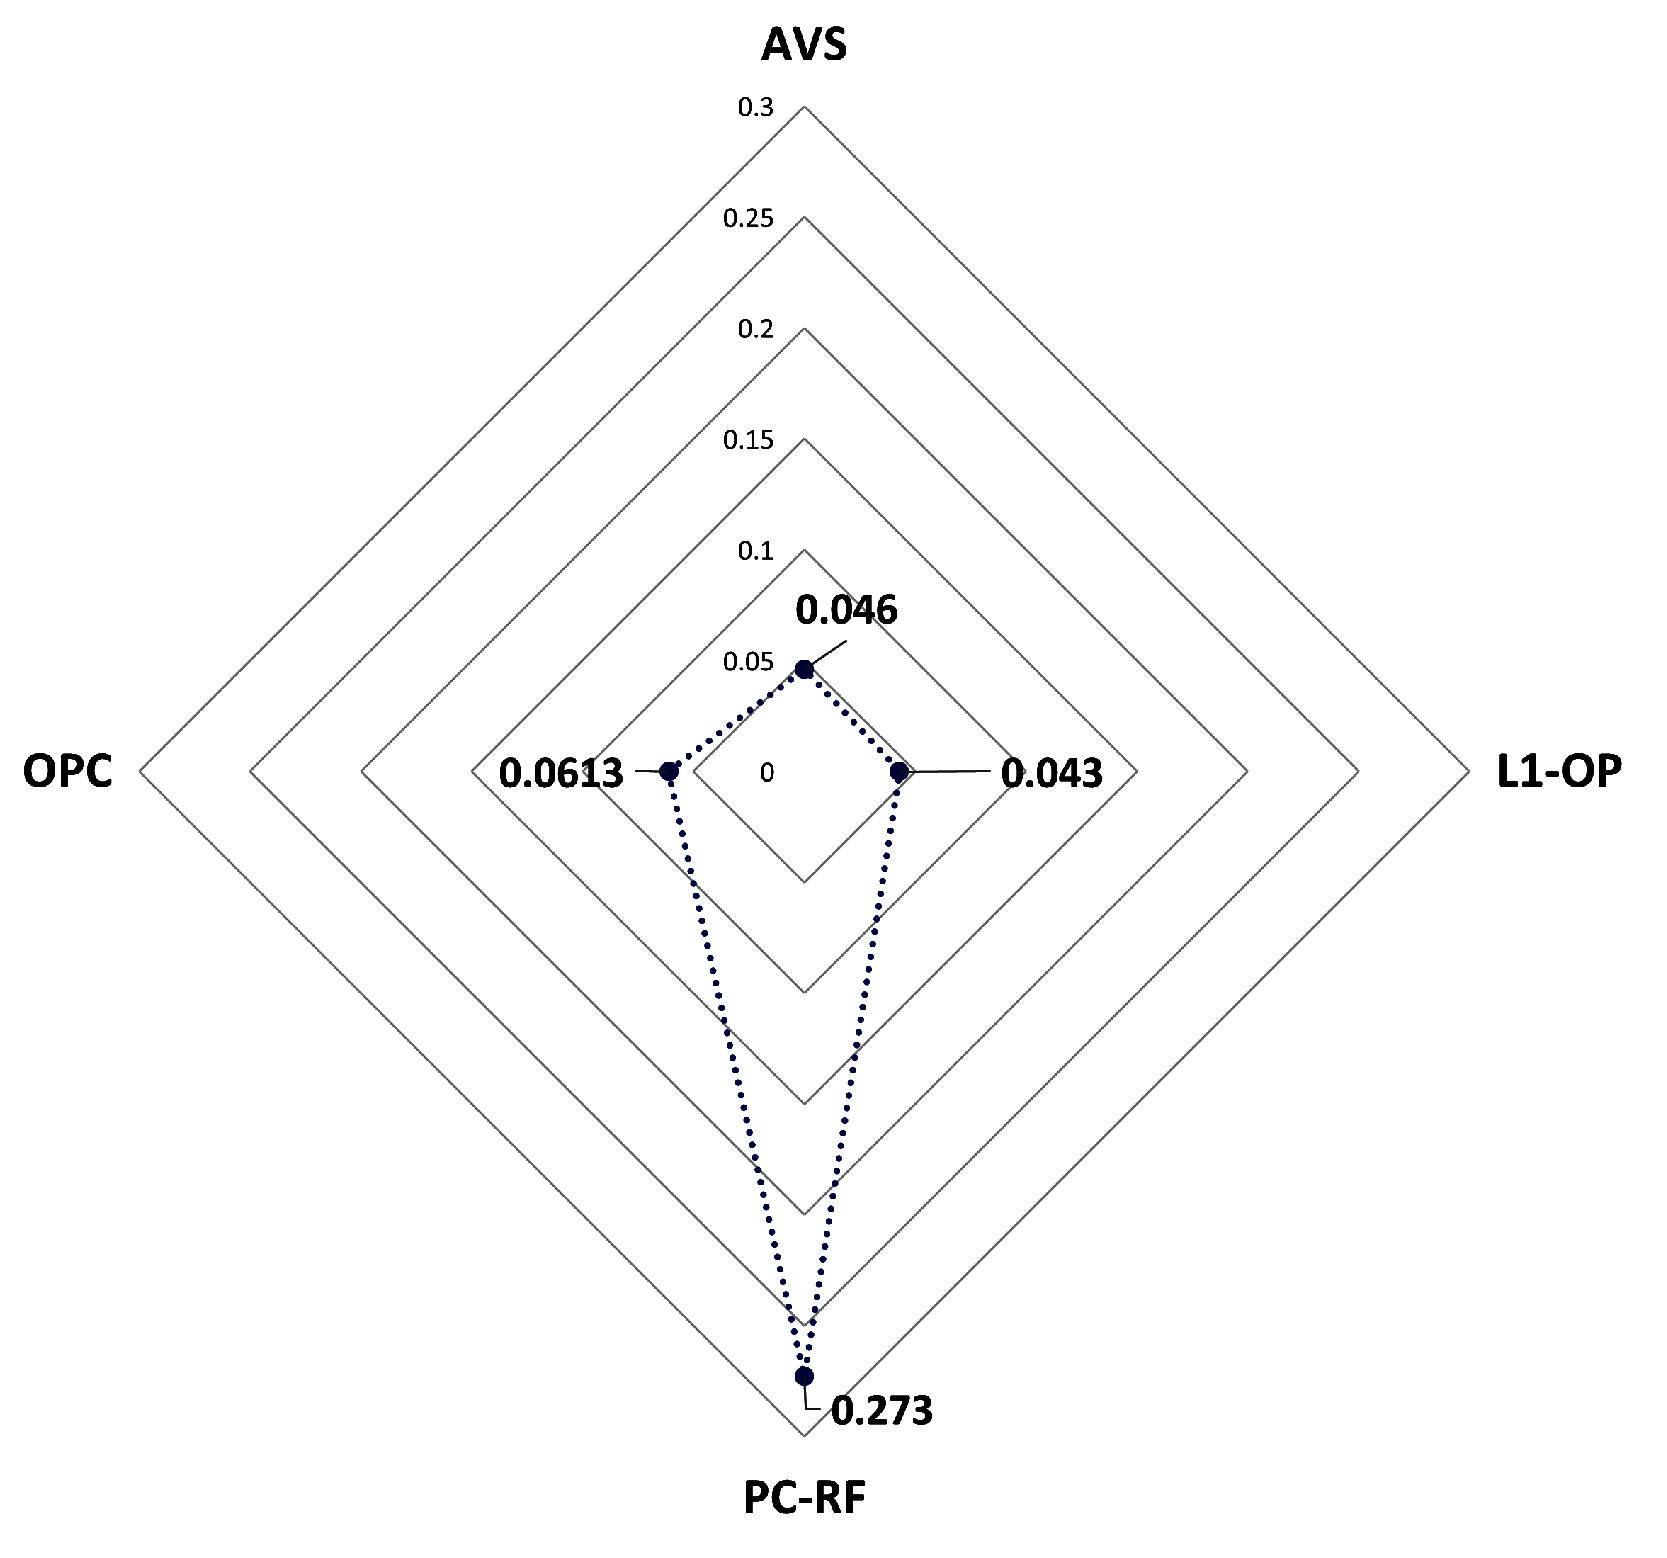
Local motions are another area to investigate in the stabilization methods. The smoothness of camera motions is another metric named as AvSpeed [
37], which is considered in this study, since large motions or sudden movements can create flows with high magnitude disturbing the optical flow analysis required in the gas leak detection algorithm. To measure this metric, the average speed of selected feature points are calculated using Equation (
6), where
is the number of feature points, and
is the coordinate of ith feature point. The low AvSpeed value shows more perceptual similarity in the consecutive frames.
In
Table 5, the metrics for all the candidate methods are calculated for all the scenarios. For the first scenario, PC-RF showed the more reliable results; however, because of the few frames with inaccurate registration as shown in
Figure 7, the AvSpeed was higher than the other methods. For the second scenario containing thermal image stream with low camera motions, L1-OP and PC-RF both showed significant results. As in the first scenario, in the third scenario, despite the existence of constant but smooth camera shaking and moving objects in the background, PC-RF demonstrated much better results compared to other methods. Finally, in the fourth scenario containing shaking motions causing motion blurriness in some of the frames, OPC showed outstanding results compared to others; however, PC-RF presented better perceptual similarity.
5.2. Evaluation of Gas Leak Detection
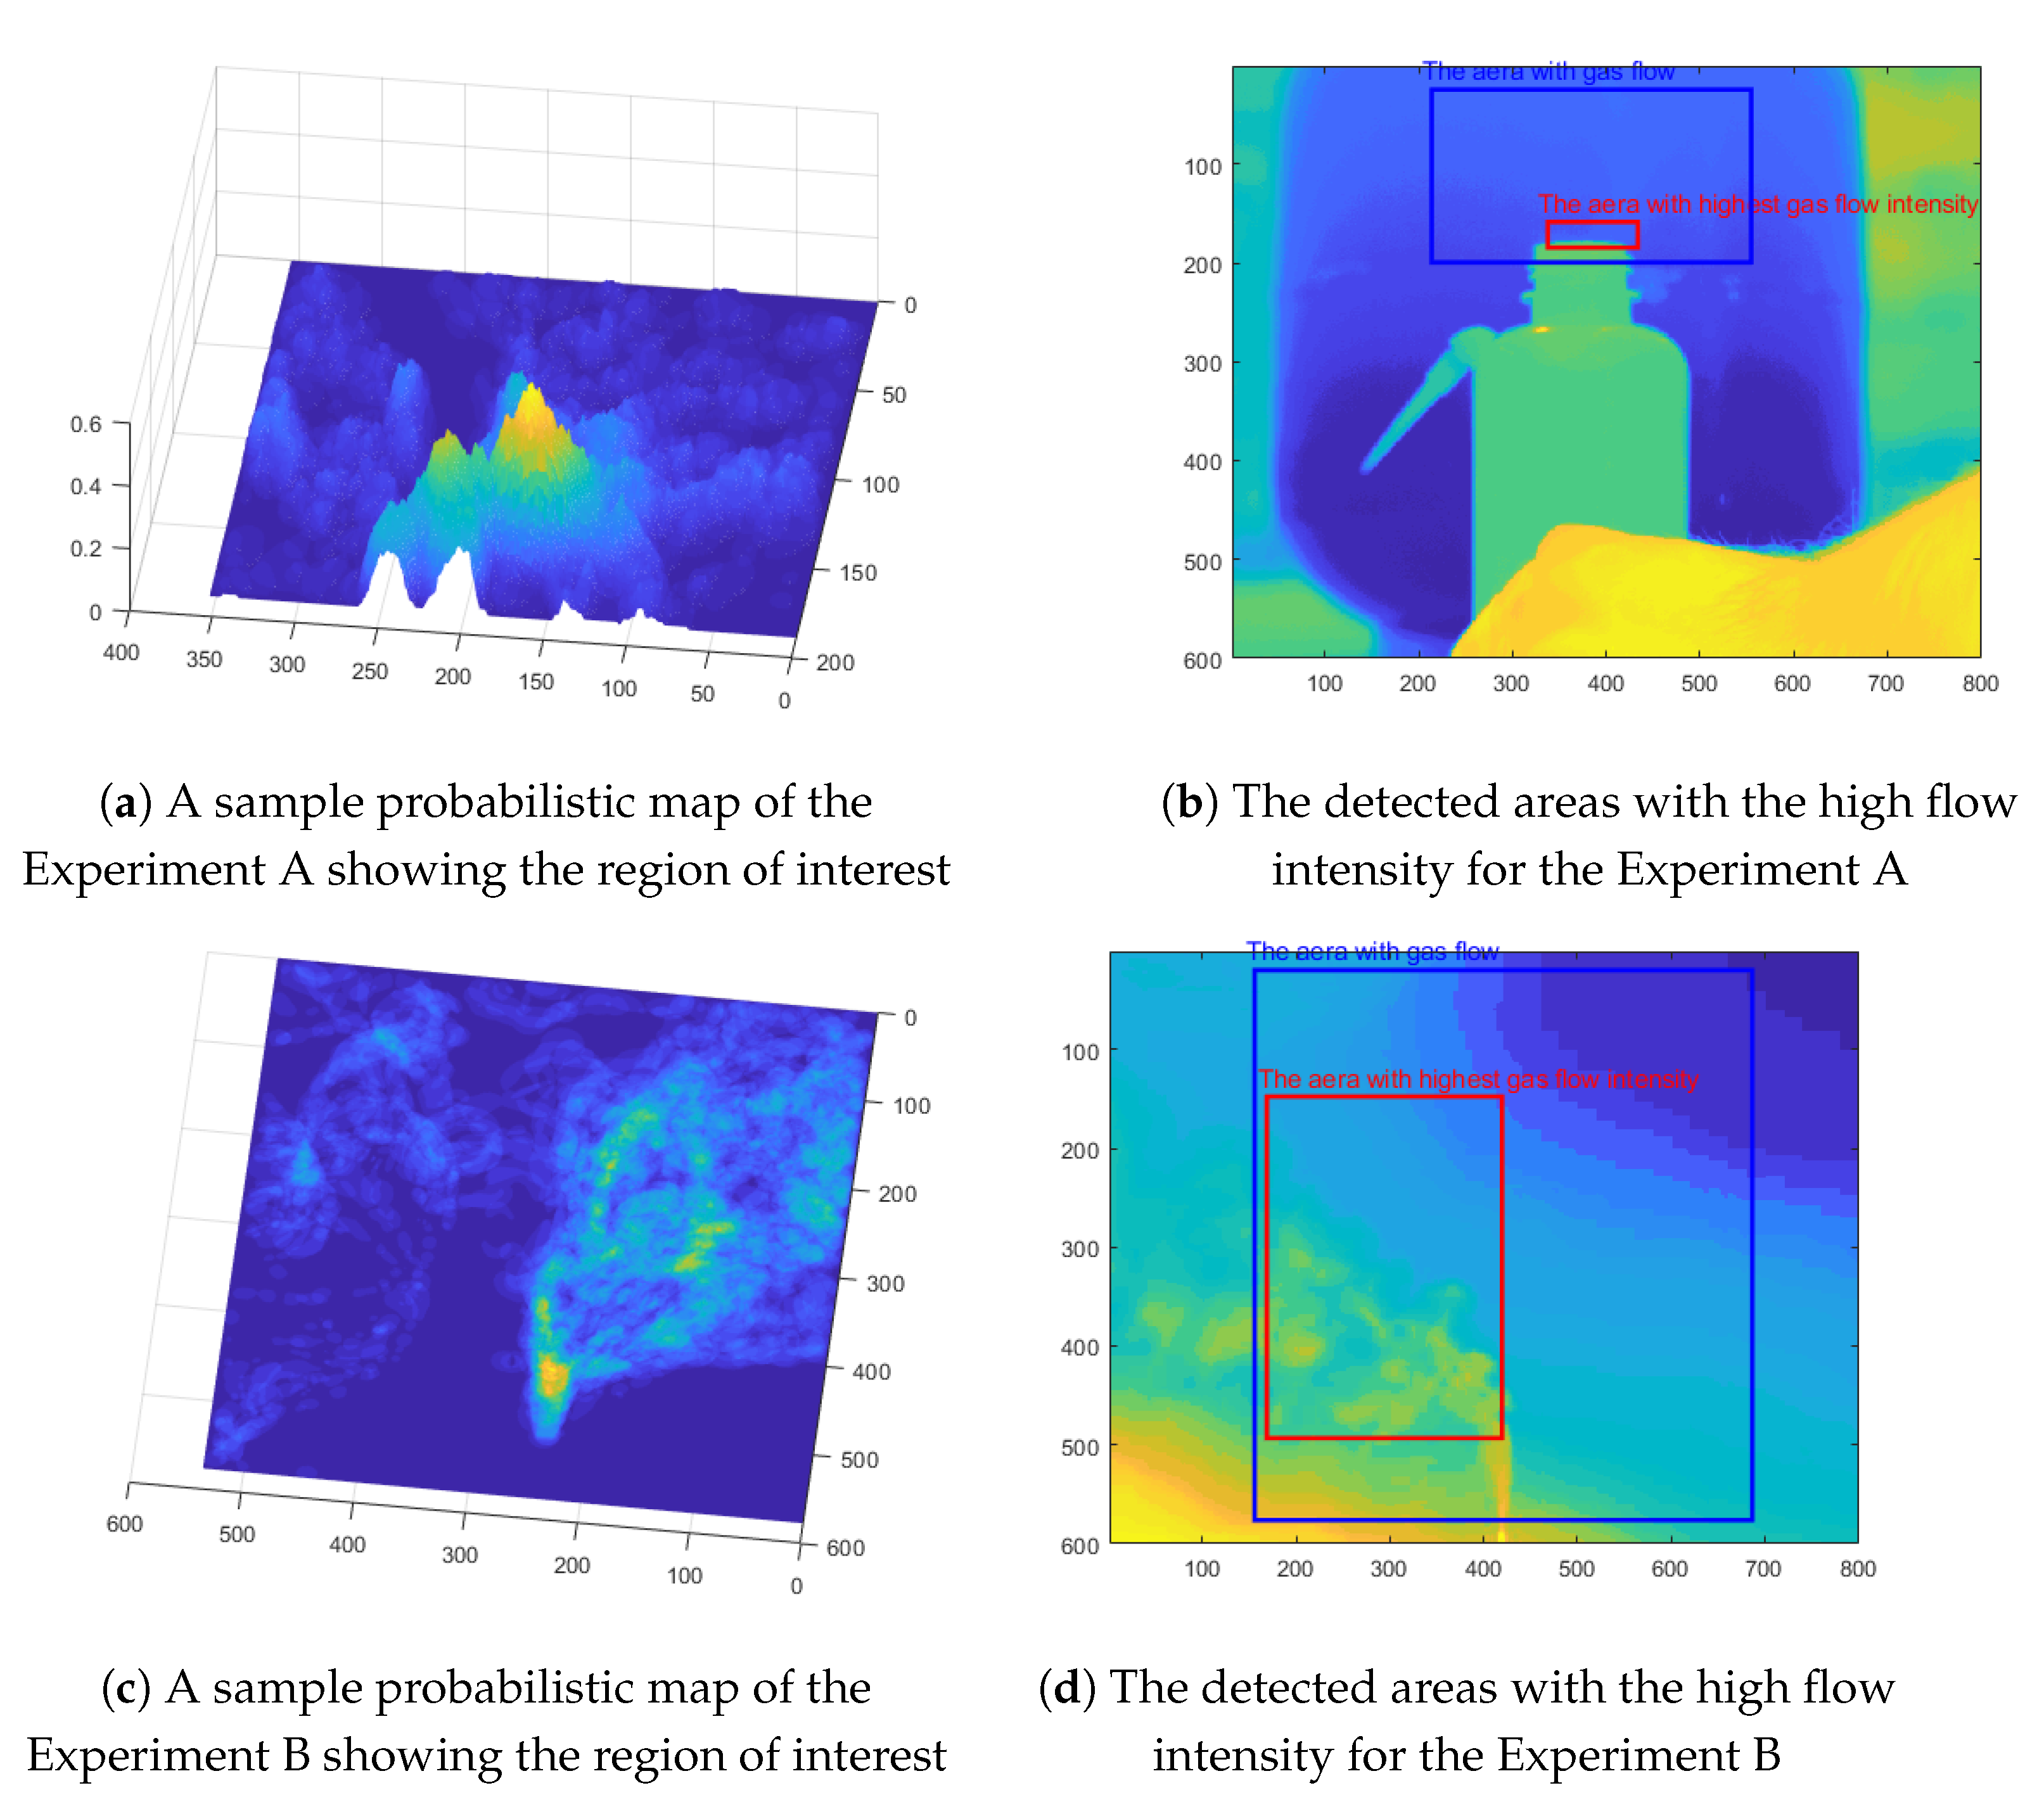
In this section, the algorithm for the gas leak detection and visually-enhancement of gas emanation is evaluated using three sets of experiments that investigate the performance of the algorithm and the whole system. First, the effectiveness and performance of the algorithm are assessed by using the collected data from Experiment A explained in
Section 4.1 which is conducted in an isolated environment. The isolated environment provides an opportunity to evaluate the algorithm without the effect of other environmental parameters. The results of this experiment are shown in
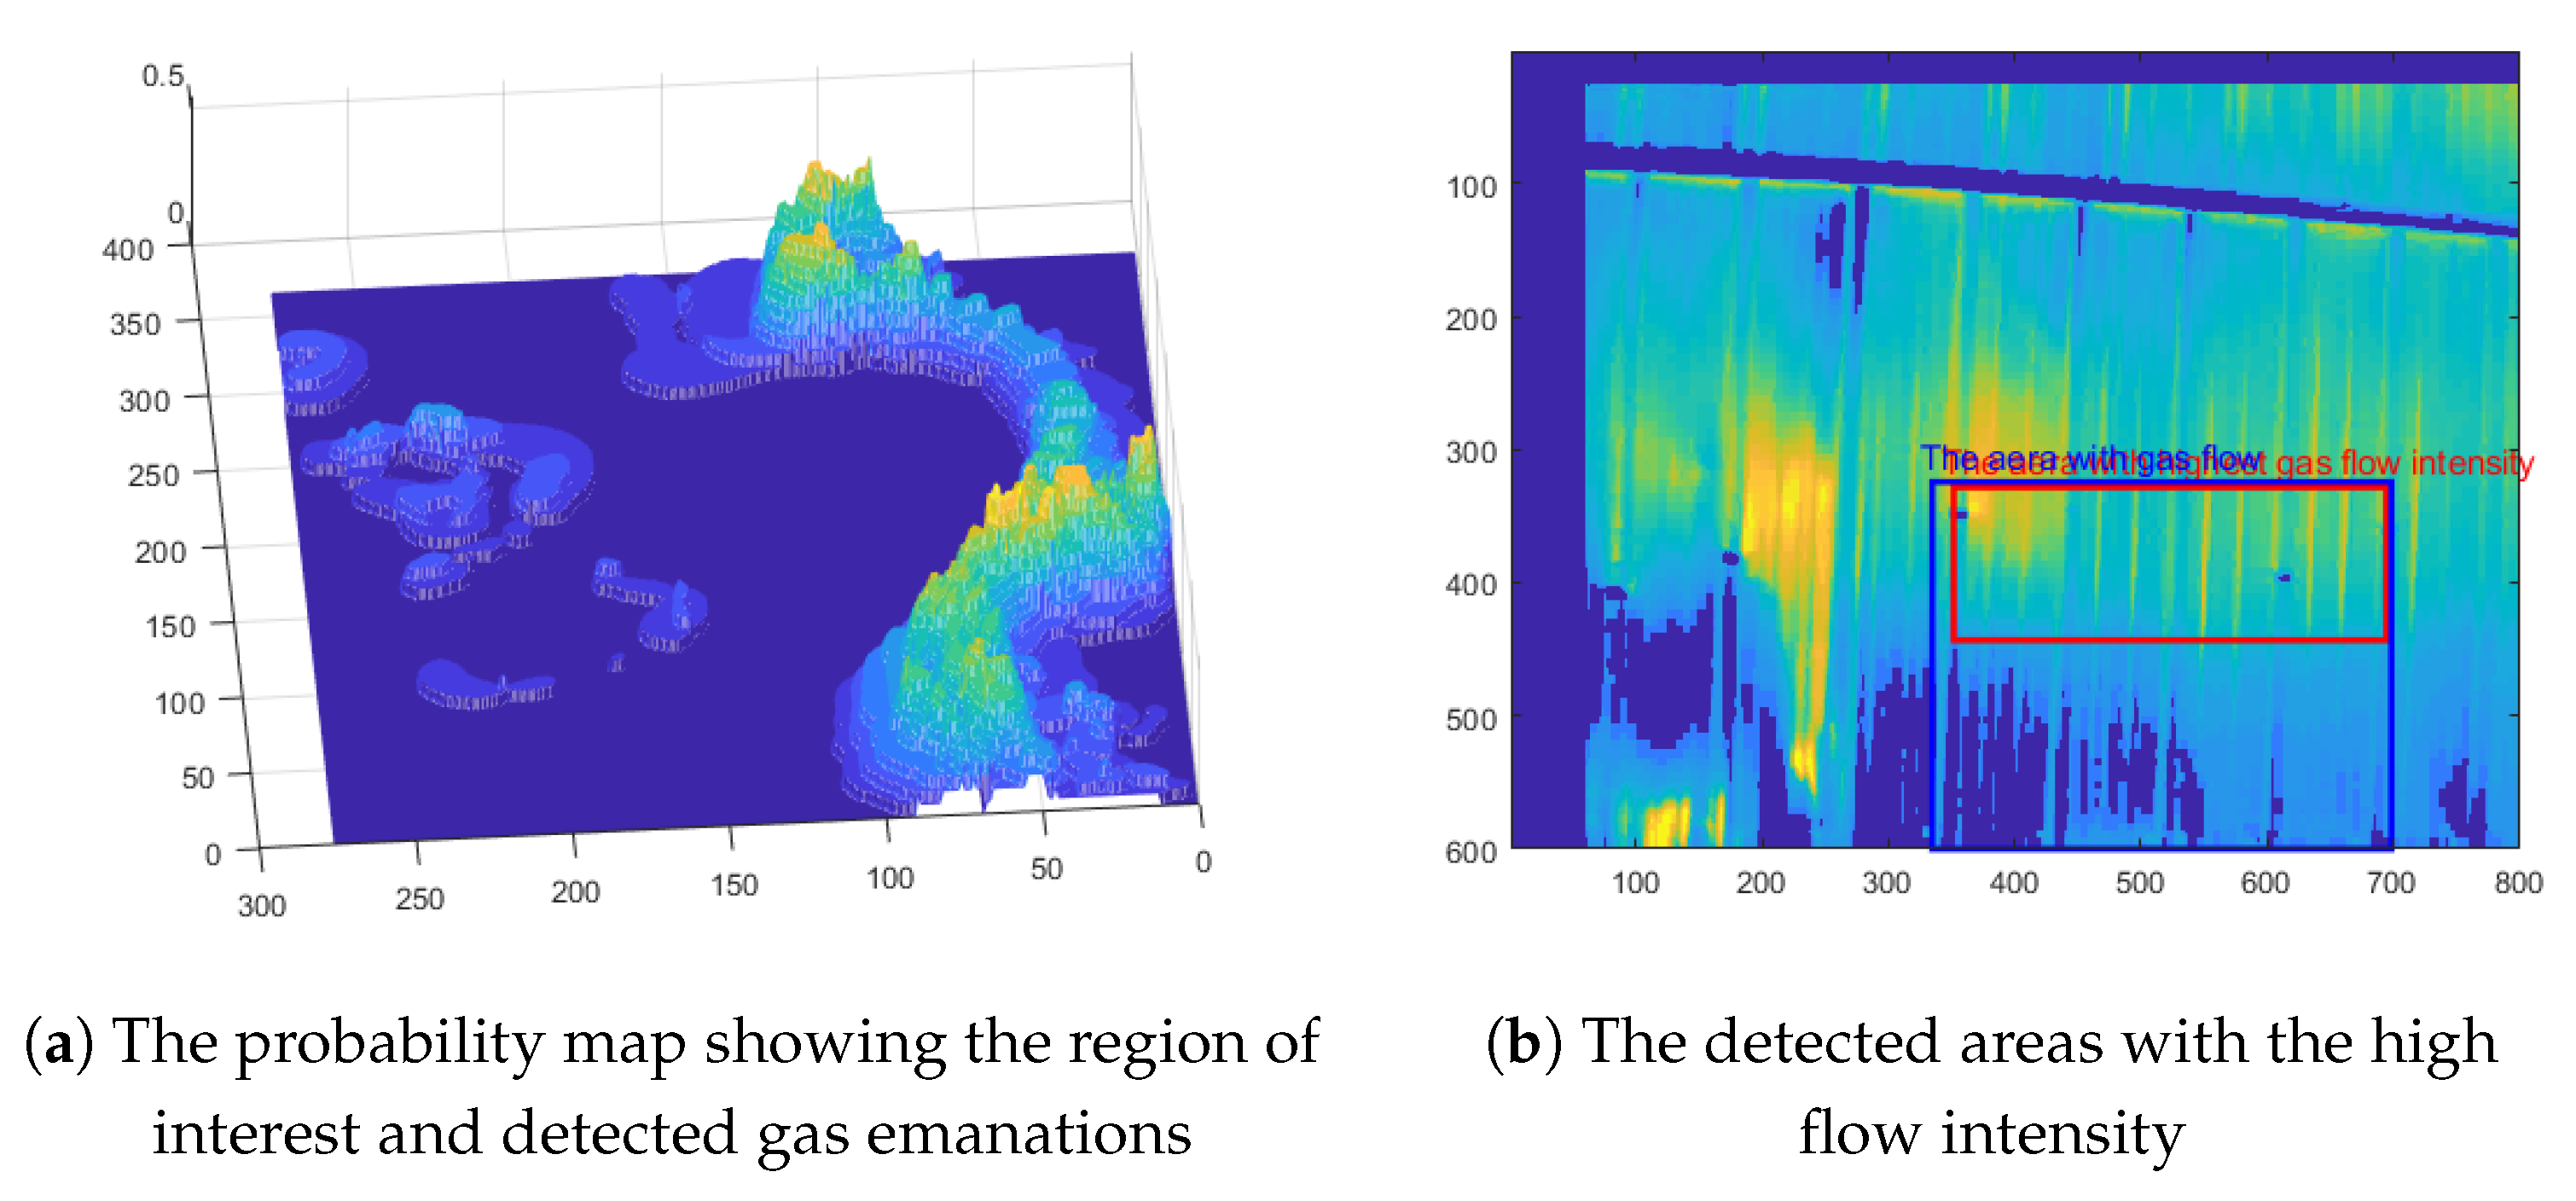
Figure 9. As shown in this figure, the algorithm successfully provided the flow map and detected the area with high flow intensity. Moreover, Experiment B explained in
Section 4.2, was employed to investigate the algorithm’s performance in real scenarios.
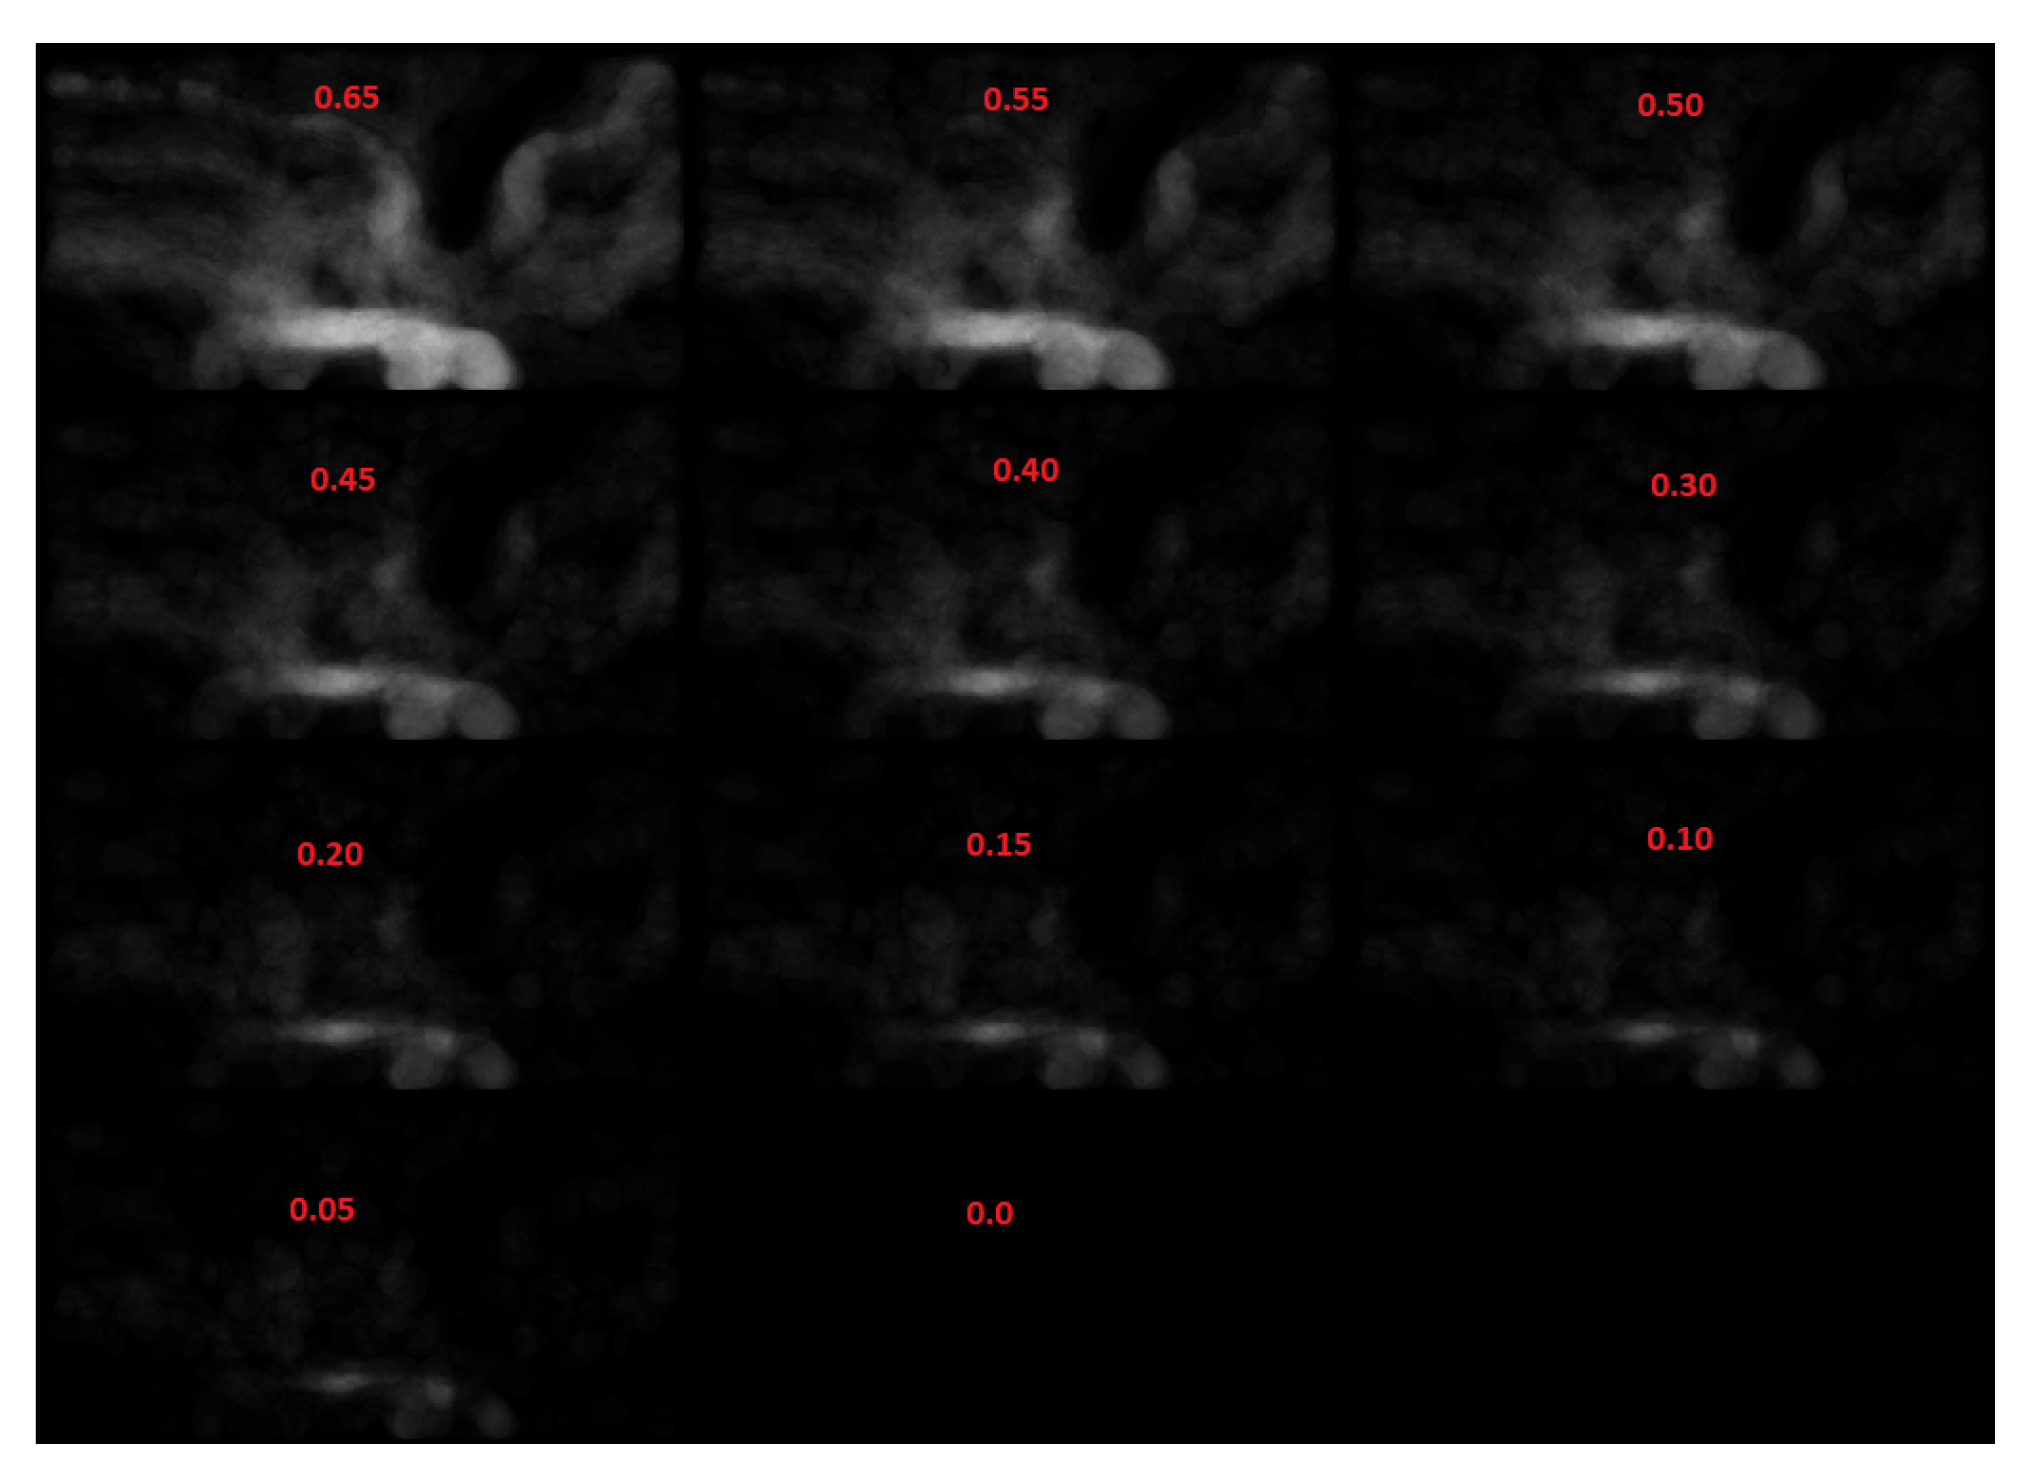
Figure 9 represents a sample result that shows the algorithm successfully extracted the gas flow and detected the area with the high gas intensity. Additionally, one of the algorithm’s parameters affecting the results remarkably is the adopted threshold for filtering the probabilistic map. In
Figure 10, the results with respect to different values are demonstrated.
5.3. Evaluation of Drone-Based Gas Leak Detection
In this section, the whole system is evaluated using the collected data from Experiment C Scenario 2, which is explained in
Section 4.3. As explained before, the system has two main steps including stabilization and gas leak detection. For this section, PC-RF is employed for the stabilization combined with the proposed gas leak detection to investigate the system performance while deployed on a drone. In
Figure 11, the results of the system are presented and they show that the system was able to visualize the gas emanations and determine the area with high gas flow intensity.
6. Conclusions
In recent years, the interest in the employment of thermal imaging systems for gas leak detection and visually-enhancement of gas emanation has been raised significantly. However, most of these studies focused more on the visually-enhancement of the gas emanations and also they are not equipped to be used in an aerial platform. In this study, a drone-enabled gas leak detection technique is proposed involving two steps: (a) a video stabilization method and (b) a gas leak detection method based on the optical flow analysis. In order to find the most suitable video stabilization technique for the defined application, a comparative analysis is conducted to investigate the candidate methods from different aspects. Finally, the proposed method and the whole system are evaluated using three experiments: (a) an experiment in an isolated environment, (b) an experiment in a real environment, and (c) an experiment using a drone. The results of applying the proposed algorithm on the data collected in Experiments A and B showed that the method successfully enhanced the visualization and detected the gas flow and the area with the highest flow intensity. Moreover, the algorithm demonstrated a notable result while processing the footage collected by a drone. In addition, the comparative analysis of candidate stabilization techniques provided detailed insight into their abilities for the targeted application.
For future work, we will work on using deep learning methods to detect and visualize the gas flow. Moreover, we will conduct more experiments using drones for Methane gas emission and gas leak detection in the oil and gas industry. In addition, we will investigate the use of the stabilization method based on deep learning techniques to improve the performance of the stabilization. Finally, we will work on developing a method to locate the origin of the gas leak more effectively.


