Abstract
This paper proposes the design process of optimized building Computational Fluid Dynamics (CFD) model based on Building Information Modelling (BIM). The proposed method consists of five-step processes: BIM data extraction, geometry simplification, grid optimization, attribute data matching, and finally, exporting a CFD case folder for OpenFOAM. Validation is performed to evaluate the improvement of the grid model and the accuracy of the simulation result. Validation is conducted for four indoor ventilation models. The number of grids increased or decreased, according to the optimization method, but did not change significantly. On the other hand, the maximum non-orthogonality improved by up to 20.78%, according to the optimization function. This proves that it is sufficiently effective in improving the grid quality. The accuracy of the proposed method is evaluated by relative error rate with the ANSYS simulation result. The error rates for flow and temperature are evaluated. The relative error rate is less than 5% under all conditions. Therefore, the accuracy of the proposed method is verified.
1. Introduction
Computational fluid dynamics (CFD) is a fast and economic analysis method to analyze complex fluid flows through numerical analysis [1]. Computational Fluid Dynamics (CFD) enables various simulations related to the fluid flows of complex building shapes. Therefore, CFD is emerging as an effective tool for evaluating ventilation, energy performance, design, and stability in the field of architecture [2,3]. CFD enables the analysis of various shapes and environmental conditions through numerical analysis, so it is more productive than traditional analysis methods [4]. Meanwhile, appropriate CFD models need to be designed by considering flow characteristics and environmental conditions to obtain reliable results [5]. CFD model design, a pre-processing process for CFD analysis, includes designing the geometry model, designing the grid model, and setting the boundary conditions. Each process is a significant factor in determining the accuracy of CFD simulation results. Moreover, pre-processing is the most time- consuming process for flow simulation [6]. Therefore, it is necessary to design the appropriate CFD model.
Recently, Building Information Modeling (BIM) has emerged as a key modeling technology in the field of architecture, due to the diversification and vitalization of technologies [7]. BIM contains geometric and attributes information about buildings, which provide the physical and functional characteristics of buildings [8]. The data in BIM models can be used in various fields. BIM is used to manage the design, manufacture, and construction processes and to control the quality of construction [9,10,11,12]. The building information in BIM is also applied to research related to disaster and fire analysis [13,14,15]. In particular, it can be used in the field of simulation that requires 3D building model design [16,17,18]. The data embedded in BIM models can be used for designing models or setting the environmental conditions of simulations, such as Building Energy Simulation (BES) or CFD [19]. BIM contains the information required for building energy performance analysis. Therefore, using the BIM model can save considerable time and effort in model design, and reduce data inconsistencies and human errors [20]. Due to these advantages, various studies coupled BES with BIM. In existing studies, data conversion has been performed on both geometry and attribute data. On the other hand, most CFD research only use BIM the models for sharing geometry data. In addition to geometric data, BIM also contains attribute data that can be used for setting boundary conditions, enabling efficient model design [21]. Therefore, it is necessary to integrate attribute data in addition to geometry data.
CFD divides the space to be analyzed into a finite number of grids to predict the flow of fluids, so grid design is important for accurate analysis results [22]. Therefore, a high-quality grid model design is necessary. To this end, an optimization process for geometry and grid models should be conducted. There are difficulties in creating grids for complex shapes, which often lead to low grid quality. Hence, it is necessary to improve grid quality through geometry simplification [23]. However, geometry simplification takes a considerable amount of time because it entails much manual work [6]. Grid optimization also requires considerable trial and error to improve grid quality, and therefore, is a time-consuming process. In addition, geometry and grid optimization usually rely on user experience and judgment because there are no standardized methods or procedures. Meanwhile, BIM models contain detailed geometric characteristics of all objects. If it is applied to CFD models without optimization, it may be impossible to generate a grid, or a poor grid may be derived, resulting in a decrease in analysis accuracy. Therefore, optimization of geometry and grid models should also be considered to integrate BIM and CFD.
This study proposes a method of automatically designing an optimized CFD model based on a BIM model to integrate BIM and CFD. Section 2 analyzes previous studies related to BIM and CFD integration and the limitations of these studies. Section 3 describes the detailed process of the proposed method. Section 4 describes the validation method. Validation was conducted for four indoor ventilation models. Section 5 describes the validation results for grid quality improvement and accuracy evaluation. Section 6 describes the main findings and suggestions for further research.
2. Literature Review
Conventional CFD analysis tools did not support BIM model files as input format, therefore integrating BIM and CFD was impossible. To address this issue, various studies utilize the BIM model by converting geometry data into OBJ and SAT formats, which can be input in CFD tools [24,25,26,27]. However, this requires a process for converting BIM models into a separate format and leads to limitations, such as the omission of many attribute data included in BIM models [28]. In addition to integrating geometry data, many recent studies focused on integrating the attribute data in BIM into CFD models. Lee et al. [29] used BIM files in gbXML format for CFD analysis. Gan et al. [19] applied BIM models to design BES and CFD models, and used these to analyze the energy performance of buildings. It used BIM models to extract the geometry, material type, and the computation domain of the target to design CFD models. Xu et al. [28] designed an FDS (Fire Dynamics Simulator) model by using the geometric and attribute data in BIM models. The geometry model was designed by using PyroSim, an FDS preprocessing program, and the attribute data was entered into the FDS model by developing a module for integrating material data.
As described above, many studies have been conducted to couple the attribute data in BIM models to CFD, but the optimization of CFD models still depends on manual work. In previous studies, the user had to modify the geometry of the BIM model by using separate software for CFD analysis, which takes a considerable amount of time. Automatic CFD model design using BIM and the optimization process must be carried out at the same time to couple BIM for CFD. In this regard, Porter et al. [7] developed a technology to simplify the geometry of BIM models through algorithms to convert them into geometry models suitable for CFD models. They used the minimum feature size to simplify the geometry by hiding objects smaller than this feature size or by merging them with large objects. However, the shapes could only be simplified into boxes. Therefore, volume errors increased in the case of simplifying circular or cylinder-shaped objects, and resulted in analysis results different from the actual results. In addition, it did not cover the integration of attribute data and grid optimization. As described above, previous studies on the integration of BIM and CFD only focused on individual processes, such as integrating geometric data, integrating attribute data, or geometry simplification. Research on developing complete BIM-CFD integration technologies considering all of these processes has not been carried out yet.
3. Design Method of Optimized CFD Model Using BIM
Figure 1 shows the process of the method to build an optimized CFD model from a BIM model.
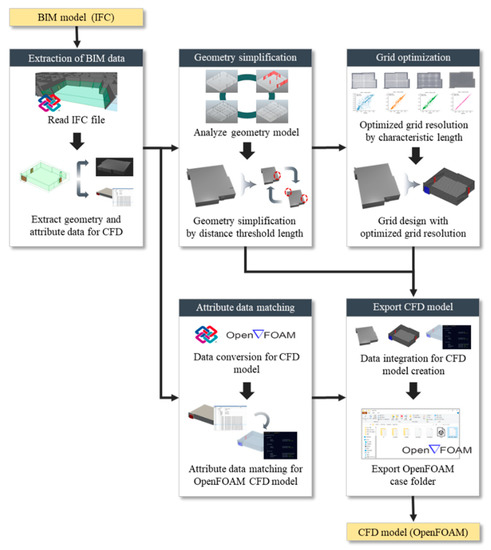
Figure 1.
Design process of optimized Computational Fluid Dynamics (CFD) model using Building Information Modelling (BIM). IFC, Industry Foundation Classes.
The proposed method consists of a five-step process: (1) BIM data extraction, (2) Geometry simplification, (3) Grid optimization, (4) Attribute data matching, and (5) CFD model extraction. For versatility, the research was conducted using IFC (Industry Foundation Classes), the standard format for information exchange in BIM, and OpenFOAM, an open-source CFD analysis tool. The geometry and attribute information of the subject of analysis were extracted by analyzing the IFC file. This data was utilized to design the CFD geometry model, design the grid model, and set the boundary conditions. Model optimization, which is significant for accurate CFD simulation, was performed simultaneously with model design. Finally, an OpenFOAM case containing the optimized CFD model was exported based on the input IFC file.
3.1. Extraction of BIM Data for CFD Model
IFC stores geometry and attribute data, such as the coordinates, shapes, and materials of each element of a building, in an object called entity. Therefore, entity analysis and data extraction are required in IFC to convert the data required to design a CFD model. To do this, the IfcOpenShell library was used to analyze the IFC data structure. The IFC data used for the design of CFD models is classified into geometric data about the location and size of the structures constituting the building, and attribute data about the physical properties of the structural materials. The geometry (volume, area, location, and layout) of the CFD model was designed using the IFC geometric data. The attribute data was used to enter the material information and thermal transmittance of the wall. To extract geometry data, data related to the spatial structure (IfcSpace), structure (IfcWall, IfcSlab), and openings (IfcDoor, IfcWindow) was analyzed. The attribute data was extracted from IfcMaterial entities, which contain information about the composition of each structure.
The geometric data was extracted from the IFC file by a three-step process. First, data about the space and connected walls was extracted, then information about the walls and openings in the target space was extracted and converted into 3D CAD format. Finally, the data was converted into a format of OpenFOAM to complete the extraction of geometric data. IfcConverter was designed to extract geometry information, and a function to analyze the relationship between the space and walls was developed to extract information about the walls in the target space. In addition, openings (doors, windows) near the IFC entity in the target space were determined, and the data related to these openings was extracted. IfcOpenShell was used to convert the extracted wall and opening data into CAD data.
In terms of attribute data, the name, thickness, and thermal conductivity of the materials were extracted by searching the material layer from attribute objects, such as IfcWall. The 3D CAD data was converted to input the extracted information into OpenFOAM. Wavefront.obj format data can store individual components of the model separately, making it suitable for CFD input format where conditions must be set for each boundary. Therefore, ObjConverter class was designed to convert CAD data into the OBJ format. The individual surfaces of the model were first extracted into STL format, and then a second extraction was performed in OBJ format, which combines all of the individual surfaces.
3.2. Geometry Simplification to Optimize CFD Model
The original geometry extracted from the IFC file may contain complex shapes that reduce the efficiency of CFD analysis. Excessively detailed surfaces adversely affect the grid design of CFD models, degrade the grid quality, and increase the time and error rate of numerical computation. Therefore, a geometry simplification process is required. In this regard, Park et al. [30] investigated a method to simplify the shape of buildings by applying a surface simplification algorithm and analyzed the grid improvement effect by geometry simplification.
This study employed the above-mentioned method to implement a geometry simplification function. This process is conducted as follows. Among the surfaces of the target geometry, insignificant faces that are small in area and similar to other faces are omitted, and a simplified geometry through the remaining faces is reconstructed. To achieve this reconstruction, the area, angle, and midpoint distance between the faces are calculated. Then, all of the surfaces of the model into faces to be omitted and faces to be preserved are classified. The degree of geometry simplification is adjusted by setting the distance threshold according to the characteristic length of the subject of analysis. The degree of geometry simplification increases as the distance threshold value increases as shown in Figure 2. Geometry simplification is performed at the same time as geometric information extraction, and the simplified geometry OBJ file is exported as the output.
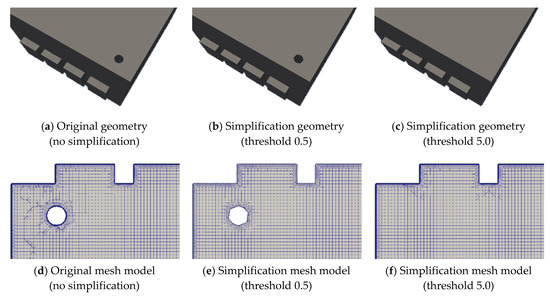
Figure 2.
Example of geometry simplification function.
3.3. Grid Optimization to Optimize CFD Model
The optimal grid design is required to ensure the accuracy and economic feasibility of CFD analysis. Grid quality and the number of grids should be considered for optimal grid design. The optimal grid conditions are determined through grid independence tests. Grid independence test is conducted in most CFD studies, however there are no standardized methods or procedures for these tests [31]. In this respect, Lee et al. [1] proffered and validated an improved grid independence test method by applying the grid resolution used in fire simulations.
This study developed this method into an algorithm to implement a grid optimization function for the subject of analysis. The grid optimization process is as follows. The characteristic length of the building to be analyzed is calculated using the extracted IFC geometric information. Then, an appropriate grid resolution is selected for the calculated characteristic length. The minimum grid size is calculated about the appropriate grid resolution and is then entered into the OpenFOAM grid creation script. cfMesh was used as a tool to design hexahedral grids, and the simplified geometry model described in Section 3.2 was used as the target to create the grids.
3.4. Attribute Data Matching
To generate the attribute data of the CFD model, the material layer was analyzed by tracking the reference relationships of IFC objects from attribute objects, such as IfcWall. Tuple data types consisting of the material name and thickness were extracted from the material layer and matched to the CFD model. Thermal properties were also extracted from the information in the IfcMaterial entity and entered into the CFD model. However, thermal properties, such as thermal transmittance, are not mandatory, unlike the material names that must be entered in the IfcMaterial entity. Therefore, information, such as the thermal transmittance required for environmental assessment, may be omitted.
The material database was built to input thermal characteristic values into the CFD model. The material name entered in IFC was searched in the building material database. The thermal transmittance of the most similar material was specified as the thermal characteristic value of that material. The material matching algorithm between two sets of data was implemented based on the similarity between strings through the Levenshtein distance. The Levenshtein distance is the minimum number of single-character edits required to change two strings into the same data. The Levenshtein distance between a and b is calculated, as shown in Equation (1). In here, is 1 when and 0 when x
where, is Levenshtein distance between the -th letter of and the -th letter of .
The similarity was evaluated by the score that standardizes the Levenshtein distance to the length of the target word. The material with the highest score was determined as the same material as the material in the IFC file. The Levenshtein distance can also vary even in the same material depending on the difference of delimiters, such as spaces in the name string, and the order of the words. Taking this into account, the Token Set ratio function, which evaluates the similarity of individual constituent words, was also used to evaluate similarity. Based on the results of assessing the similarity, the thermal transmittance of the material considered to be the same was returned. The thermal characteristic type of the boundary surface is set by wallHeatTransfer, therefore thermal diffusivity is required as a thermal characteristic value. The thermal transmittance returned by the database was entered after converting it into thermal diffusivity, as shown in Equation (2) below. The specific heat capacity and density of the material required for conversion were used values included in the material database.
where, is thermal diffusivity (m2/s), is thermal conductivity (W/(m·K)), is density (kg/m3), and is specific heat capacity (J/(kg·K)).
Finally, the thermal diffusivity, material name, and thickness data extracted from IFC were entered as attribute data in the OpenFOAM CFD model.
3.5. Export CFD Model for OpenFOAM Analysis
The results of BIM data extraction, geometry simplification, grid optimization, and attribute data matching were integrated to output the OpenFOAM CFD model. OpenFOAM stores data about CFD models in case folders. A case folder consists, as follow: (1) 0 folder that contain data on the boundary conditions of the CFD model, (2) constant folder storing data about the grid and geometry, gravity, turbulence characteristics, and thermal characteristics, (3) system folder that contains data about the discretization method and operation conditions. As shown in Table 1, an OpenFOAM case was created by outputting the simplified geometry model, optimized grid model, boundary type, material name, and material thermal transmittance to the corresponding locations. The simplified geometry file was output as an OBJ file in the case folder and referred to in meshDict, the grid creation setting. The bndry file, which defines the type of surfaces that compose the subject of analysis, was output in the case folder, and referred to when setting the boundary conditions. The name and thermal diffusivity of each material layer was output in the T-file inside the case folder.

Table 1.
The output of the extracted data, then converted from IFC.
Meanwhile, OpenFOAM does not perform operations if there is not sufficient setting for simulations in the case folder. Therefore, among the information required for simulation, there is some information not included in IFC. The boundary condition information not included in IFC is defined, as shown in Table 2. The constant and system folder settings were also defined and output to the case folder. The buoyantSimpleFoam was designated as the default condition by considering thermal analysis and turbulence analysis. Gravitational acceleration was set in the -z axis direction, and the K-epsilon model was applied to configure the turbulenceProperties for the turbulence model. The air state was set to an ideal gas.
Table 2.
Setup of additional boundary conditions for CFD simulation.
OpenFOAM simulation was enabled by using the output case, and if necessary, the user could directly modify the boundary conditions. Conditions other than the data interlocked in IFC could be changed according to the purpose of analysis, enabling simulations in various environments for the optimized CFD geometry and grid models.
4. Validation through Comparison with Commercial CFD Tool
This study validated the proposed method by comparing it with commercial CFD tools to evaluate the analysis accuracy. Validation was conducted by comparing the analysis results using commercial CFD SW with the results using the proposed method for the same target and operation conditions.
4.1. Target Model
The BIM libraries used in the study by Park et al. [30] for validation. The corresponding libraries are: Medical Clinic, Office Building models from [32], and OTC Conference Center [33]. Figure 3 shows the four target facilities selected from these libraries for validation.
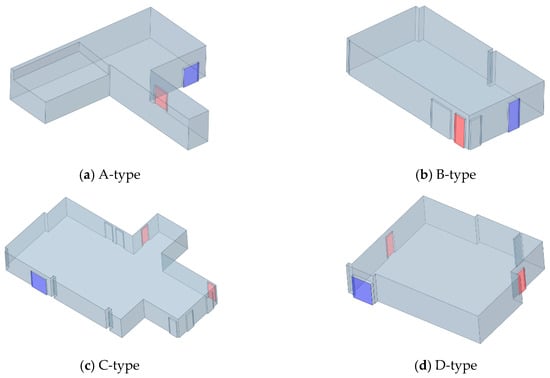
Figure 3.
Target geometry model for validation.
All four facilities contain elements, such as fine protrusions, pillars, and gaps that hinder grid creation and degrade grid quality. In Figure 3, the blue side is the inlet of the target facility, and the red side is the outlet. Types A and B have one inlet and one outlet, and types C and D have one inlet and two outlets. Table 3 shows the details of the target model.
Table 3.
Geometric information of target model.
4.2. CFD Simulation Condition for Validation
Validation was conducted by comparing the analysis results using a commercial CFD SW with the CFD analysis results using the proposed method. A solution from ANSYS was used as the commercial CFD SW, and the CFD analysis using the proposed method utilized OpenFOAM. For each of the four targets, the modeling and simulation results using ANSYS were compared with the results of simulating the CFD model created using the method described in this study through OpenFOAM. For the simulation using ANSYS, only the geometry model was extracted and entered as an OBJ file from the BIM model to be analyzed, similar to conventional methods. The input OBJ file was used to design the CFD model and perform the simulation. Hexahedral grids were created with the same grid size for both conditions. The size of the grid was set as the optimal resolution by the characteristic length proffered in a study by Lee et al. [1]. The optimal grid resolution was 24 because the characteristic length of all four targets was 0.7 or higher. A grid size corresponding to grid resolution 24 was calculated and applied to create the grid model for each target.
The simulation results were compared by evaluating the temperature and flow velocity inside the building. The operation settings for validation were the same for both conditions. Steady-state simulations were performed for incompressible gas, and thermal analysis was performed to evaluate the temperature. The buoyantSimpleFoam was employed to simulate, which is an OpenFOAM solver capable of thermal analysis. The Standard - model was employed as the turbulence model for both conditions. The boundary conditions were set as Inlet, Outlet, and Wall for the inlets, outlets, and other walls of each target facility, respectively. The turbulence kinetic energy () and turbulence dissipation rate () were calculated using inflow wind velocity and turbulence intensity, and the same values were applied for both conditions. The boundary condition of validation model is described in Table 4.
Table 4.
The boundary condition of validation model.
4.3. Validation Method
The developed method was validated by analyzing the effects on the grid model and the accuracy of simulation results according to the optimization. First, the effect of the optimization was analyzed by comparing the number of grids and the grid quality of each target CFD model. The total number of grids and grid quality of the optimized CFD model through the proposed method were compared with the CFD model with the original shape applied for the same target. Skewness and non-orthogonality was used for the grid quality parameters, which are commonly used in CFD studies [34]. Figure 4 shows how to estimate skewness and non-orthogonality. Skewness is an index to assess the numerical diffusion error in the process of finite volume discretization. As shown in Equation (3), It is calculated as the ratio of the vector , which connects the center points (, ) of two adjacent cells, and , which is the distance between center point () at which two cells intersect and vector .
where, is skewness.
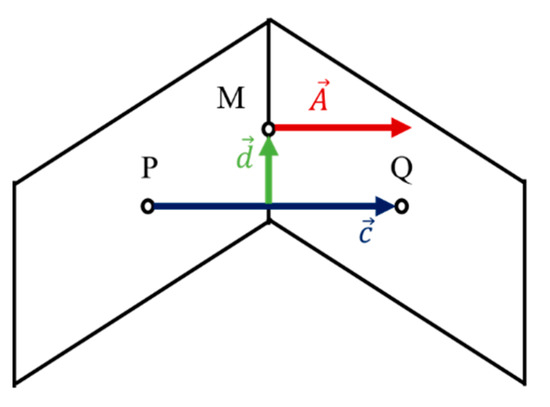
Figure 4.
Estimation of skewness and non-orthogonality.
Non-orthogonality is defined as the angle between vector (), which connects the center points of two cells, and normal vector (), at the center point M of the intersection of two cells. Non-orthogonality is calculated, as shown in Equation (4).
where, is non-orthogonality.
Low mesh quality can affect the convergence and error of the entire CFD model, therefore skewness and non-orthogonality were evaluated based on the maximum value. The recommended grid quality in OpenFOAM is as follows: Maximum non-orthogonality (70° or less), maximum skewness (4.0 or less) [35].
The accuracy of the simulation results was evaluated by analyzing the relative error rate with the ANSYS simulation results. As shown in Equation (5), the difference between the CFD model created with the proposed method with OpenFOAM and the ANSYS analysis results was evaluated.
where, is percent error, is the value of ANSYS simulation, and is the value of the proposed method. An overview of abbreviations and parameters can be found in Appendix A.
The relative error rates were calculated for the average temperature and flow velocity for each target. The validation was conducted by evaluating the error rate for the total volume and the error rate for each section height (0.5 m, 1.0 m, 1.5 m, 2.0 m). In the case of ANSYS simulation, an analysis was performed with the CFD model for the original shape of the target building.
5. Validation Results
5.1. Analysis of Grid Model Improvement Effect According to Optimization
Figure 5 shows changes in the geometry of the CFD model optimized by using the proposed method. The left is the original shape of the building, and the right is the shape of the CFD model after applying the optimization process. The geometry optimization level was adjusted by the distance threshold. According to a study by Park et al. [36], simplified models with a distance threshold above 10 showed significant differences from the original model, resulting in significant differences in the simulation results. Therefore, geometry optimization was conducted by applying a distance threshold of less than 5. For the A and D types, the distance threshold is 0.5, and 5.0 for B and C.
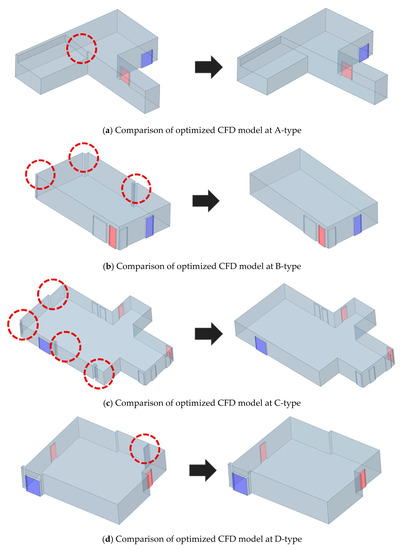
Figure 5.
Geometry models according to optimization function.
Table 5 shows the total number of grids and the improvement of grid quality by optimization. In the case of A-type, the total number of grids decreased as a result of omitting the shape. On the other hand, the number of grids slightly increased in types B and C as the volume increased to fill the gaps. There was no significant change in the number of grids in D-type. Maximum non-orthogonality showed improvement according to optimization. In the case of A-type, the maximum non-orthogonality improved by 20.78% according to optimization. The maximum non-orthogonality improved by 6.52% in C-type and by 1.78% in D-type. However, there was no significant improvement effect of skewness. The maximum aspect ratio of the grid improved by 15.32% in D-type. In the case of type B, there was little effect of improving the grid by optimization. The improvement effect of B-type was insignificant because the original geometry model had relatively few obstacles, and as there were no difficulties in creating the grid. Although the number of grids increased or decreased depending on the geometry optimization method, the fluctuation was not large. The maximum non-orthogonality clearly improved according to optimization.
Table 5.
Grid model improvement according to optimization.
5.2. Validation Result of CFD Analysis Accuracy
Table 6 and Table 7 show the error rate of the flow velocity and temperature compared with ANSYS simulation. Table 6 shows the average velocity error at each height and the volume average velocity error rate. In the case of A-type, the average velocity error rate at each height was less than 2%. The overall volume average error rate was 0.02%, showing almost no error. The qualitative results also showed almost no difference in flow velocity distribution, as shown in Figure 6. B-type also showed no flow velocity error with the ANSYS simulation results. In the case of C-type, the volume average velocity error rate was 0.42%, but the average velocity error rate at each height was relatively high (around 3%). Unlike A, B, and C types, D-type showed a relatively high-volume average velocity error rate of 3.89%. The average velocity error rate at each height reached a maximum of 4.5%, which was relatively high compared to other conditions. This is because the gap in the original geometry was omitted during the optimization process and affected the flow, as shown in Figure 7. In the original model, as shown in Figure 7a, the flow blocked by the gap escapes through the outlet at a relatively fast velocity. On the other hand, the fluid flows along the wall before escaping through the outlet in the optimization model, as shown in Figure 7b. The velocity error rate was relatively high, due to this difference. Although the error rate was higher than 4% under some of the conditions, the average velocity error rate was less than 5% under all of the conditions, which validates the accuracy of the proposed method.
Table 6.
Validation result for average velocity.
Table 7.
Validation result for average temperature.
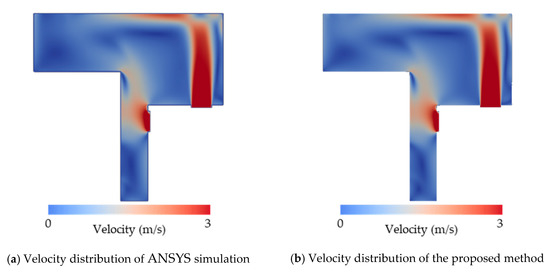
Figure 6.
Difference in velocity distribution at A-type according to optimization.
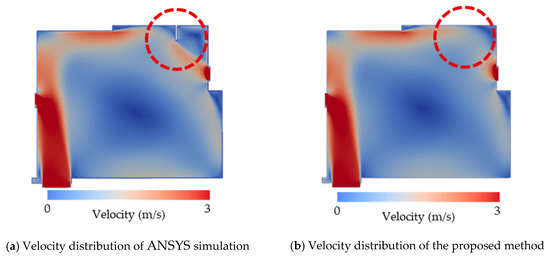
Figure 7.
Difference in velocity distribution at D-type according to optimization.
Table 7 shows the average temperature error at each height and the volume average temperature error rate. The volume average temperature error rate was less than 3% for all four types. In the case of C-type, the average temperature error at each height was less than 1%, showing almost no difference. Figure 8 shows the qualitative results for temperature distributions and velocity vectors. As shown in Figure 8a, the original geometry showed higher temperatures in the red area, due to gaps. However, there was no significant difference in the quantitative figures. In the case of B-type, the average temperature error rate at height 0.5 m was relatively high (4.01%). This is because the gap omitted during the optimization process affected the temperature, as shown in Figure 9. As shown in Figure 9c, the air flowing along the wall is blocked by the gap, which changes the direction of airflow. This creates congestion on the left side of the gap, which results in a relatively high temperature. On the other hand, the airflow circulates without being blocked by the gap in the optimization model, as shown in Figure 9d, resulting in a relatively low temperature distribution, as shown in Figure 9b. In the case types A and D, the average temperature error at each height was less than or approximately 3%. Similar to the validation of flow velocity, the error rates were higher than 4% in some of the conditions. However, the average temperature error rate was less than 5% under all of the conditions. Therefore, the proposed method produced reliable CFD simulation results because both the error rates for velocity and temperature were less than 5%. Meanwhile, as shown in Figure 7 and Figure 8, the flow velocity and temperature distributions were slightly different from the original model in some areas, due to optimization. The difference between the results of the original model was less than 5%, therefore it does not have a significant impact on the overall analysis results. However, the accuracy of analysis may be degraded if accurate results are needed for the areas or points where the geometry is optimized. The current algorithm performs optimization collectively according to the distance threshold entered by the user. A function for selecting areas will be added in the future so that the optimization will not be performed on areas specified by the user.
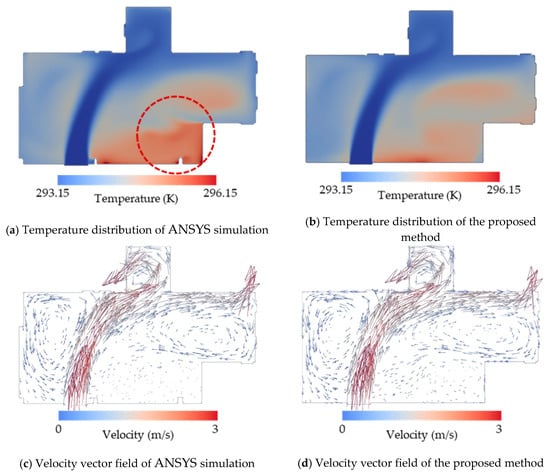
Figure 8.
Difference in temperature distribution and vector filed at C-type according to optimization.
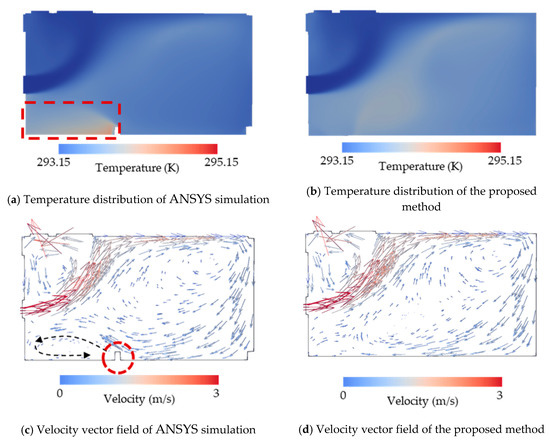
Figure 9.
Difference in temperature distribution and vector filed at B-type according to optimization.
In addition to validating accuracy, the time required to design an optimal CFD model was measured to evaluate the optimization function. The time required to generate an optimized CFD model from the BIM model file was measured to calculate how much time can save. Table 8 shows the results of estimating the time savings. According to the results, the proposed method saved about 72.9% of the working time, compared to the conventional method. Therefore, it is possible to design an optimal CFD model with less time than the conventional method. This will increase the efficiency of CFD analysis.
Table 8.
Evaluation of reduction in working time for optimal CFD model design.
6. Conclusions
This study analyzed a method for automatically designing an optimized CFD model based on the BIM model and validated the accuracy. This enables the integration of BIM and CFD and improves the efficiency of CFD analysis in the construction field by reducing the time required to design optimal CFD models. The proposed method consists of a five-step process: BIM data extraction, geometry simplification, grid optimization, attribute data matching, and CFD model extraction. An IFC file was used as the input target BIM model to design a CFD model for OpenFOAM. The geometry and attribute data extracted from the IFC file were used to design the CFD model. For geometry simplification, the degree of simplification was adjusted by using the distance threshold. For grid optimization, the optimal grid size for the analysis target was applied by using the optimal grid resolution for each characteristic length employed in a previous study. Based on the optimal grid size, grid optimization was performed by creating a hexahedral grid system. In the case of attribute data, the wall material name and thermal transmittance stored in the IFC were matched with the CFD model. Finally, it is output in the form of OpenFOAM analysis case.
Validation was conducted on four building models to evaluate the proposed method. Validation was conducted by comparing the simulation results for the temperature and flow velocity inside the target facilities. The improvement of the grid model was analyzed according to the optimization. The total number of grids changed according to omitting or adding volume in the optimization process. The number of grids decreased when objects were omitted to improve complex shapes, while the number of grids increased when objects were added to improve the geometry. In terms of grid quality indicators, there was no significant change in maximum skewness after optimization. However, the maximum non-orthogonality improved by 20.78% after optimization, thereby demonstrating the effect of optimization.
To evaluate the accuracy, validation was conducted by comparison with ANSYS simulation. The modeling and simulation results using ANSYS were compared with the simulation results using OpenFOAM by applying the proposed method for the same target and operation conditions. A steady-state analysis of the temperature and flow velocity inside the building was performed for validation. The cross-sectional average, by height and the volume average, was calculated for each analysis target to evaluate the relative error rate to the ANSYS results. As a result, the relative error rates for temperature and flow velocity were less than 5% in all of the analysis cases. Therefore, the proposed method could automatically generate an optimized CFD model by using a BIM model and also produce analysis accuracy similar to conventional CFD tools.
Meanwhile, there were cases where the flow velocity and temperature distributions in some areas were different from the original model, due to shapes omitted through optimization. Even in such cases, the average error rate was less than 5% and did not have a significant effect on the overall analysis results. However, the accuracy of the analysis results may be compromised in these cases if accurate analysis results are needed for the areas around the omitted shape. Therefore, additional studies will be performed to improve the algorithm so that the optimization process is not applied to areas specified by the user. Meanwhile, the validation process only involves evaluating the flow velocity and temperature inside the facility of the indoor ventilation model. Therefore, additional studies will be performed in the future to validate various building CFD applications, such as natural ventilation, mechanical ventilation, and wind path analysis. Validation will also be conducted on parameters other than flow velocity and temperature.
Author Contributions
Conceptualization, M.L. and C.K.; Methodology, M.L., C.K. and G.P.; Software, M.L.; Validation, M.L., C.K. and G.P.; Formal analysis, M.L.; Investigation, G.P., M.L.; Writing—Original draft preparation, M.L.; Writing—Review and editing, C.K.; Supervision, C.K.; Project administration, H.J.; Funding acquisition, H.J. All authors have read and agreed to the published version of the manuscript.
Funding
This work is supported by the Korea Agency for Infrastructure Technology Advancement (KAIA) grant funded by the Ministry of Land, Infrastructure and Transport (Grant 20CTAP-C152000-02). This work has supported by the National Research Foundation of Korea (NRF) grant funded by the Korea government (MSIT) (No. 2020R1C1C1011268).
Institutional Review Board Statement
Not applicable.
Informed Consent Statement
Not applicable.
Data Availability Statement
The data used to support the findings of this study are available from the corresponding author upon request.
Conflicts of Interest
The authors declare no conflict of interest. The funders had no role in the design of the study; in the collection, analyses, or interpretation of data; in the writing of the manuscript, or in the decision to publish the results.
Appendix A
Table A1.
Nomenclature.
Table A1.
Nomenclature.
| Abbreviations | |||
| CFD | Computational Fluid Dynamics | FDS | Fire Dynamics Simulator |
| BIM | Building Information Modeling | IFC | Industry Foundation Classes |
| BES | Building Energy Simulation | ||
| Parameters | |||
| Levenshtein distance between the -th letter of and the -th letter of . | |||
| Thermal diffusivity | |||
| Thermal conductivity | |||
| Density | |||
| Specific heat capacity | |||
| Turbulence kinetic energy | |||
| Turbulence dissipation rate | |||
| Skewness | |||
| Vector which connects the center points of two adjacent cells | |||
| Distance between center point of intersect and vector . | |||
| Non-orthogonality | |||
| Normal vector, at the center point of the intersection of two cells. | |||
| Percent error | |||
| Value of ANSYS simulation | |||
| Value of the proposed method | |||
References
- Lee, M.; Park, G.; Park, C.; Kim, C. Improvement of Grid Independence Test for Computational Fluid Dynamics Model of Building Based on Grid Resolution. Available online: https://www.hindawi.com/journals/ace/2020/8827936/ (accessed on 20 January 2021).
- Kato, S. Review of Airflow and Transport Analysis in Building Using CFD and Network Model. Jpn. Archit. Rev. 2018, 1, 299–309. [Google Scholar] [CrossRef]
- Zhang, S.; Ding, A.; Zou, X.; Feng, B.; Qiu, X.; Wang, S.; Zhang, S.; Qian, Y.; Yao, H.; Wei, Y. Simulation Analysis of a Ventilation System in a Smart Broiler Chamber Based on Computational Fluid Dynamics. Atmosphere 2019, 10, 315. [Google Scholar] [CrossRef]
- Wang, H.; Zhai, Z. Analyzing Grid Independency and Numerical Viscosity of Computational Fluid Dynamics for Indoor Environment Applications. Build. Environ. 2012, 52, 107–118. [Google Scholar] [CrossRef]
- Kim, T.; Kim, B.S.; Kim, K. Smoke Movement and Evacuation Time in the Arcade of a Traditional Market Using Numerical Simulation. J. Asian Archit. Build. Eng. 2007, 6, 403–410. [Google Scholar] [CrossRef]
- Ali, Z.; Tyacke, J.; Watson, R.; Tucker, P.G.; Shahpar, S. Efficient Preprocessing of Complex Geometries for CFD Simulations. Int. J. Comput. Fluid Dyn. 2019, 33, 98–114. [Google Scholar] [CrossRef]
- Porter, S.; Tan, T.; Wang, X.; Pareek, V. LODOS - Going from BIM to CFD via CAD and Model Abstraction. Autom. Constr. 2018, 94, 85–92. [Google Scholar] [CrossRef]
- Eastman, C.M.; Eastman, C.; Teicholz, P.; Sacks, R.; Liston, K. BIM Handbook: A Guide to Building Information Modeling for Owners, Managers, Designers, Engineers and Contractors; John Wiley & Sons: Hoboken, NJ, USA, 2011; ISBN 978-0-470-54137-1. [Google Scholar]
- Chen, S.; Wu, J.; Shi, J. A BIM Platform for the Manufacture of Prefabricated Steel Structure. Appl. Sci. 2020, 10, 8038. [Google Scholar] [CrossRef]
- Choi, J.; Lee, S.; Kim, I. Development of Quality Control Requirements for Improving the Quality of Architectural Design Based on BIM. Appl. Sci. 2020, 10, 7074. [Google Scholar] [CrossRef]
- De Gaetani, C.I.; Mert, M.; Migliaccio, F. Interoperability Analyses of BIM Platforms for Construction Management. Appl. Sci. 2020, 10, 4437. [Google Scholar] [CrossRef]
- Park, S.I.; Park, J.; Kim, B.-G.; Lee, S.-H. Improving Applicability for Information Model of an IFC-Based Steel Bridge in the Design Phase Using Functional Meanings of Bridge Components. Appl. Sci. 2018, 8, 2531. [Google Scholar] [CrossRef]
- Wang, S.-H.; Wang, W.-C.; Wang, K.-C.; Shih, S.-Y. Applying Building Information Modeling to Support Fire Safety Management. Autom. Constr. 2015, 59, 158–167. [Google Scholar] [CrossRef]
- Chen, Y.-J.; Lai, Y.-S.; Lin, Y.-H. BIM-Based Augmented Reality Inspection and Maintenance of Fire Safety Equipment. Autom. Constr. 2020, 110, 103041. [Google Scholar] [CrossRef]
- Sun, Q.; Zhou, X.; Hou, D. A Simplified CityGML-Based 3D Indoor Space Model for Indoor Applications. Appl. Sci. 2020, 10, 7218. [Google Scholar] [CrossRef]
- Kim, S.; Woo, J. Analysis of the Differences in Energy Simulation Results between Building Information Modeling (BIM)-Based Simulation Method and the Detailed Simulation Method. In Proceedings of the 2011 Winter Simulation Conference (WSC), Phoenix, AZ, USA, 11–14 December 2011; pp. 3545–3556. [Google Scholar]
- Kota, S.; Haberl, J.S.; Clayton, M.J.; Yan, W. Building Information Modeling (BIM)-Based Daylighting Simulation and Analysis. Energy Build. 2014, 81, 391–403. [Google Scholar] [CrossRef]
- Porter, S.; Tan, T.; Tan, T.; West, G. Breaking into BIM: Performing Static and Dynamic Security Analysis with the Aid of BIM. Autom. Constr. 2014, 40, 84–95. [Google Scholar] [CrossRef][Green Version]
- Gan, V.J.L.; Deng, M.; Tan, Y.; Chen, W.; Cheng, J.C.P. BIM-Based Framework to Analyze the Effect of Natural Ventilation on Thermal Comfort and Energy Performance in Buildings. Energy Procedia 2019, 158, 3319–3324. [Google Scholar] [CrossRef]
- Rahmani Asl, M.Z. Towards BIM-Based Parametric Building Energy Performance Optimization. In Proceedings of the 33rd Annual Conference of the Association for Computer Aided Design in Architecture (ACADIA), Cambridge, UK, 24–26 October 2013; pp. 101–108. [Google Scholar]
- Fukuda, T.; Yokoi, K.; Yabuki, N.; Motamedi, A. An Indoor Thermal Environment Design System for Renovation Using Augmented Reality. J. Comput. Des. Eng. 2019, 6, 179–188. [Google Scholar] [CrossRef]
- Zhang, R.; Zhang, Y.; Lam, K.P.; Archer, D.H. A Prototype Mesh Generation Tool for CFD Simulations in Architecture Domain. Build. Environ. 2010, 45, 2253–2262. [Google Scholar] [CrossRef]
- Ricci, A.; Kalkman, I.; Blocken, B.; Burlando, M.; Freda, A.; Repetto, M.P. Local-Scale Forcing Effects on Wind Flows in an Urban Environment: Impact of Geometrical Simplifications. J. Wind Eng. Ind. Aerodyn. 2017, 170, 238–255. [Google Scholar] [CrossRef]
- Kwok, H.H.L.; Cheng, J.C.P.; Li, A.T.Y.; Tong, J.C.K.; Lau, A.K.H. Multi-Zone Indoor CFD under Limited Information: An Approach Coupling Solar Analysis and BIM for Improved Accuracy. J. Clean. Prod. 2020, 244, 118912. [Google Scholar] [CrossRef]
- Utkucu, D.; Sözer, H. Interoperability and Data Exchange within BIM Platform to Evaluate Building Energy Performance and Indoor Comfort. Autom. Constr. 2020, 116, 103225. [Google Scholar] [CrossRef]
- Ismail, A.; Srewil, Y.; Scherer, R. Semantic Enrichment and Multimodel Data Exchange Approach for CFD Analysis of Bridges. In Proceedings of the EG-ICE 2016 Workshop European Group for Intelligent Computing in Engineering, Krakow, Poland, 29 June–1 July 2016. [Google Scholar]
- Spearpoint, M.J.; Dimyadi, J.A.W. Sharing Fire Engineering Simulation Data Using the IFC Building Information Model. In Proceedings of the International Congress on Modelling and Simulation, Christchurch, New Zealand, 10–13 December 2007. [Google Scholar]
- Xu, Z.; Zhang, Z.; Lu, X.; Zeng, X.; Guan, H. Post-Earthquake Fire Simulation Considering Overall Seismic Damage of Sprinkler Systems Based on BIM and FEMA P-58. Autom. Constr. 2018, 90, 9–22. [Google Scholar] [CrossRef]
- Lee, S.; Song, D. Prediction and Evaluation Method of Wind Environment in the Early Design Stage Using BIM-Based CFD Simulation. IOP Conf. Ser.: Mater. Sci. Eng. 2010, 10, 012035. [Google Scholar] [CrossRef]
- Park, G.; Kim, C.; Lee, M.; Choi, C. Building Geometry Simplification for Improving Mesh Quality of Numerical Analysis Model. Appl. Sci. 2020, 10, 5425. [Google Scholar] [CrossRef]
- Stern, F.; Wilson, R.; Shao, J. Quantitative V&V of CFD Simulations and Certification of CFD Codes. Int. J. Numer. Methods Fluids 2006, 50, 1335–1355. [Google Scholar] [CrossRef]
- East, W.E. Common Building Information Model Files and Tools. Available online: http://www.nibs.org (accessed on 29 January 2021).
- Dimyadi, J.; Henderson, S.; Dimalen, D. Open IFC Model Repository. Available online: http://openifcmodel.cs.auckland.ac.nz (accessed on 29 January 2021).
- Fabritius, B.; Tabor, G. Improving the Quality of Finite Volume Meshes through Genetic Optimisation. Eng. Comput. 2016, 32, 425–440. [Google Scholar] [CrossRef]
- Greenshields, C. OpenFOAM User Guide: CFD Direct, Architects of OpenFOAM. Available online: https://cfd.direct/openfoam/user-guide/ (accessed on 21 December 2020).
- Park, G.-Y.; Kim, C.-M.; Choi, C.-H.; Park, C.-Y. Development of 3D Building Simplification Method for Computational Fluid Dynamics Analysis. Available online: https://www.dbpia.co.kr/Journal/articleDetail?nodeId=NODE09227692 (accessed on 20 January 2021).
Publisher’s Note: MDPI stays neutral with regard to jurisdictional claims in published maps and institutional affiliations. |
© 2021 by the authors. Licensee MDPI, Basel, Switzerland. This article is an open access article distributed under the terms and conditions of the Creative Commons Attribution (CC BY) license (http://creativecommons.org/licenses/by/4.0/).