Article

A Parametric Study of Wind Pressure Distribution on Façades Using Computational Fluid Dynamics

by
Christopher McGuill
and
Jennifer Keenahan
*
School of Civil Engineering, University College Dublin, Belfield, D04 V1W8 Dublin 4, Ireland
*
Author to whom correspondence should be addressed.
Appl. Sci. 2020, 10(23), 8627; https://doi.org/10.3390/app10238627
Submission received: 23 October 2020 / Revised: 23 November 2020 / Accepted: 27 November 2020 / Published: 2 December 2020
(This article belongs to the Special Issue Applications of Computational Fluid Dynamics to the Built Environment)

Abstract

:

Featured Application

Efficient design of façade elements for wind loading.

Abstract

This paper uses Computational Fluid Dynamics (CFD) to determine wind pressures on façades for the purpose of efficient design of these elements. An outstand fin arrangement was modeled where local brackets are used to protrude the fins from the building. A parametric study, for both changes in the length of the bracket and the fin, was derived from CFD simulations with 1-in-50-year storm conditions adopted throughout. Further simulations are performed for revised wind directions that ensure all fins are equally exposed to oncoming winds. In total, 15 models are created to act as a representative sample of the total number of possible configurations. Peak values for pressure are used to calculate forces and moments on the fins. These wind loading results were then used to interpolate the values for the remaining façade geometries. From interpreting the trends that are apparent in the relationship of fin size and bracket length to efficient loading, a set of design criteria is established. The optimal façade design is defined, based on placing equal importance onto minimizing the force along the fin’s length and the moment acting at the fin-bracket connection. The performance of some façade elements is shown to worsen the effects of the wind, relative to other designs, with the potential for very negative consequences. Wind direction is shown to have a significant effect on loading, with the magnitude of wind pressures reduced considerably for the worst affected fin, if the sheltering effect is absent between the fins.

1. Introduction

A critical element to the design of any façade, is its ability to withstand pressures resulting from the wind. Both building geometry and façade detailing can affect the wind pressure coefficients used in design calculations [1]. In some cases, the use of Eurocodes for determining wind loading is overly conservative and thus wasteful in terms of both materials and cost [2]. In other situations, it has resulted in elements being under-designed. This tends to be the result of the simplified model approach used in the Eurocode, where walls are divided into a limited number of zones for calculating pressures, and thus fails to sufficiently account for variation within zonal regions. For example, at corner regions of roofs, peak pressures can be significantly under-designed in Eurocode with a deficit of 80% [2].
Computational Fluid Dynamics (CFD) is a branch of fluid mechanics that utilizes the computational power of modern computers to model fluid flow. The essence of the method is to numerically solve partial differential equations that govern the conservation of mass, momentum and energy of fluids. It was first proposed as a theoretical field of research in the 1920 s, and its chief purpose was in forecasting meteorology. This methodology has remained in use for weather forecasting up to the present day, highlighting the suitability of CFD for wind engineering problems [3]. In 2013, there was a significant advancement in the calculation of wind pressures due to façade geometry, with a detailed CFD modeling approach [4]. A 3D steady RANS CFD was used to calculate the mean wind pressures modeled for a mid-rise building both with and without balconies. These dimensions and scale used in the modeling replicated that which was used in previous wind tunnel tests for the purposes of validation. It was found that balconies create a more complex flow and there were significant variations in wind pressures on the windward building façade.
In recent times, an extensive resource of best practice guidance has become established for the use of CFD in computational wind engineering. These were first established by Casey and Wintergerste [5] for general use in industrial CFD applications. Franke and Baklanov [6] present substantive work on how to approach microscale obstacle-accommodating meteorological models. This study highlights concerns over providing an adequate extent for the computational domain as well recommended boundary conditions, specifically relating the effects of wind on buildings in the urban built environment. The following year, Tominaga et al. [7] performed a similar study for the context of the pedestrian environment around buildings that used high-quality wind-tunnel measurements to develop a best practice approach.
Results obtained from CFD modeling are often regarded as insufficient without further validation [8] through full-scale field measurements or wind tunnel testing. However, the availability of validation data is limited as wind-tunnel data in existing literature tends to suit more generic problems [3].
To date, studies that have investigated wind pressure distributions on façades have largely been based on simple façade and building geometries. There has been limited guidance available for more complex designs that are typical in the building industry. There has also been little scope for analyzing features, such as façade details, as computational demands were already significant for the models involved [9,10]. Furthermore, there has been limited research into the effects of oblique flow which is much more complex than for wind acting in the normal/perpendicular direction [4]. The benefits, therefore, of a parametric study using of CFD modeling for efficient design of façade elements become apparent.
This paper analyzes the relationship between wind loading and façade geometry, for buildings using CFD for the purpose of efficient design of these elements. This work has the following main points of novelty: (1) The influence of detailed façade geometries on wind pressures on façades represents a useful contribution to industry, as simple building profiles have been the subject of the most research to date; (2) The effect of changes in wind pressures on façades with wind direction, is also identified as a contribution to existing knowledge; (3) The results of CFD wind modeling can provide an additional resource to be used alongside the established Eurocode, producing a set of design criteria for similar types of façade arrangement; (4) The use of Large Eddy Simulation (LES) to determine peak structural wind loads and peak cladding pressures, identified as representing one of the most significant remaining challenges in computational wind engineering [11].
Section 2 provides a description of the CFD model used in this work, followed by a mesh sensitivity and assessment of model convergence in Section 3. Results of the simulations are presented in Section 4 and these are discussed and interpreted in Section 5. A set of conclusions are then made in Section 6.

2. Description of the CFD Model

The façade examined in this work is a Repeated Outstand fin Façade (Figure 1). Each fin is connected to the building via local brackets that are separated over the vertical height of the fin. The structure is considered low-rise (less than 10 m in vertical height), isolated with respect to other developments and at an altitude equivalent to sea level. In a façade configuration with repeated outstand fins, the fins will experience different wind effects. For a given wind condition, some fins will be exposed and others will be sheltered. The following sub-sections describe the details of the CFD model used to capture the variation across each fin.

2.1. Geometry

A reduced section of geometry (Figure 1) was used for this investigation, which was sufficient to represent the interaction of wind and façades that are made up off a greater number of these components. A parametric study is undertaken with respect to the length of the bracket (0 mm ≤ g ≤ 400 mm) and length of the fin (400 mm ≤ d ≤ 800 mm), at increments of 80 mm. The direction of the wind is normal to the side of the fin’s length, ‘d’.
For a given wind direction, the first fin occupies the position closest to oncoming wind. The middle fin experiences the effect of wind with no part on the outside of the façade arrangement. The third fin experiences wind pressures due to recirculated air from having passed the initial obstacles. Brackets connecting the fins to the building are excluded from the analysis due to their small size and relatively small influence on results. The length dimension of the building was chosen to be equal to the center-to-center distance of the outer fins at 1.6 m. The 0.8 m depth of the building was chosen to minimize the overall dimensions of the computational domain. This depth represents the lowest value for maintaining scale to the façade (the maximum fin length is 800 mm).

2.2. Computational Domain

Details of the computational domain used in simulations are given in Figure 2. For a 2D analysis, Best Practice Guidance suggests that the extent of the computational domain should be based on the depth (D) of the building in plan-view to ensure that the interaction of boundaries with the structure is minimized [12]. The chosen upstream and downstream model dimensions are based on the recommended minimum values of 5D and 10D, respectively [7,13]. Furthermore, the distance from the top and bottom boundaries and the outside of the structure should not be less than 6D [12], and so the height of the domain was chosen to equal 13D. In terms of blockage ratio—the combined length of the building’s width and the fin’s depth ‘d’, as a proportion of the height of the domain—the assigned problem has a maximum of 7.7% (where the façade configuration has the fin connected directly to the building, ‘g’ = 0 mm), which satisfies the acceptable upper limit of less than 10% [6].

2.3. Boundary Conditions

The inlet condition was assigned a velocity of 24.9 m/s in the horizontal direction, which corresponds to a 1-in-50-year worst case wind speed (the basis for critical loading of structures in Dublin as per the Eurocode). Wind is stochastic and to generate this behavior in the inflow, the Spectral Synthesizer method was used [6]. This method necessitates setting parameters for turbulence intensity (chosen as 11.2%) and turbulence length scale (chosen as 1 m), values for which were chosen using guidance from [14]. Initial application of steady RANS was used by the Spectral Synthesizer to capture inflow turbulence through the instantaneous velocity field command. This took place before activating the LES turbulence model. The outlet was defined as a pressure-outlet. Operating conditions were at atmospheric pressure (101,325 Pa) and therefore had constant static pressure conditions [6]. Symmetry conditions were used for the top and bottom boundaries, as suggested by [6]. These boundaries act with slip wall conditions, unable to support shear stresses, and therefore they impart no change in velocity to fluid moving alongside. Finally, the edges of the building and façade were assigned no-slip conditions, meaning they could support a shear stress but cause adjacent viscous air to become stationary to a point when in contact with it.

2.4. Turbulence Model

A number of studies have shown that in industrial flow applications, the LES approach addresses the most critical characteristics of the fluid flow by directly solving a significant portion of the turbulence spectrum [15,16]. Fluid particles are considered to bunch in groups or clusters exhibiting random fluctuations in velocities that may be described as haphazard or random, with the particles transported by predominately turbulent diffusion. These clusters exhibit a rotational structure, with the larger eddies interacting with and extracting energy from the mean flow [17]. Their anisotropic behavior is dictated by the geometry of the problem domain, the boundary conditions and body forces [18]. In tandem with this resolution, the effect of somewhat isotropic small-scale eddies was adequately accounted for in sub-grid scale (SGS) modeling [19]. Notably this method is considered by the industry to have reached a point of accepted maturity, with significant promise on current operational demands [4].
The accuracy of a LES model is dependent on the modeling of SGS stresses, and therefore, the SGS model was chosen with the aim of accurate transfer of energy between unresolved and resolved turbulent scales [19]. In this work, a Hybrid RANS-LES strategy was used to account for near wall fine resolution demand at wall surfaces. RANS equations are solved in the inner logarithmic layer, while the filtered Reynolds-averaged equations are solved away from the wall across the computational domain by LES [20]. This sub-grid scale model is termed Wall-modeled LES (WMLES).
The WMLES sub-grid scale model was selected due to its suitability for resolving turbulent industrial flows. This approach differs from the usual case of wall resolved LES by employing the RANS method at physical wall boundaries. Therefore, a coarser mesh is sufficient at these locations than would otherwise be the case. As a result, a larger time step was utilized. The basis of spatial discretization in LES was carried out through the Momentum Bounded Central Differencing upwind scheme while making use of Green-Gauss Cell Based gradients and derivatives. An upwind scheme calculates quantities that are updated based on the cell upstream in the normal direction of the velocity. Node based schemes are more suited to skewed and unstructured meshes, while also being more computationally demanding. Therefore, through the application of orthogonal, structured meshes, the cell-based approach is more efficient without loss of accuracy. For pressure, a second order resolution was specified instead of a first order resolution as in Ansys Fluent because a higher-order scheme may result in greater accuracy. The maximum numerical error tolerance was set to be equal to 1 × 10⁻⁴, as recommended by [6]. As the model encounters no issues satisfying this limit, over all time steps, the more accurate solution for pressure in the second order is justified. Finally, temporal discretization was calculated through the Bounded Second Order Implicit transient formulation.

2.5. Mesh

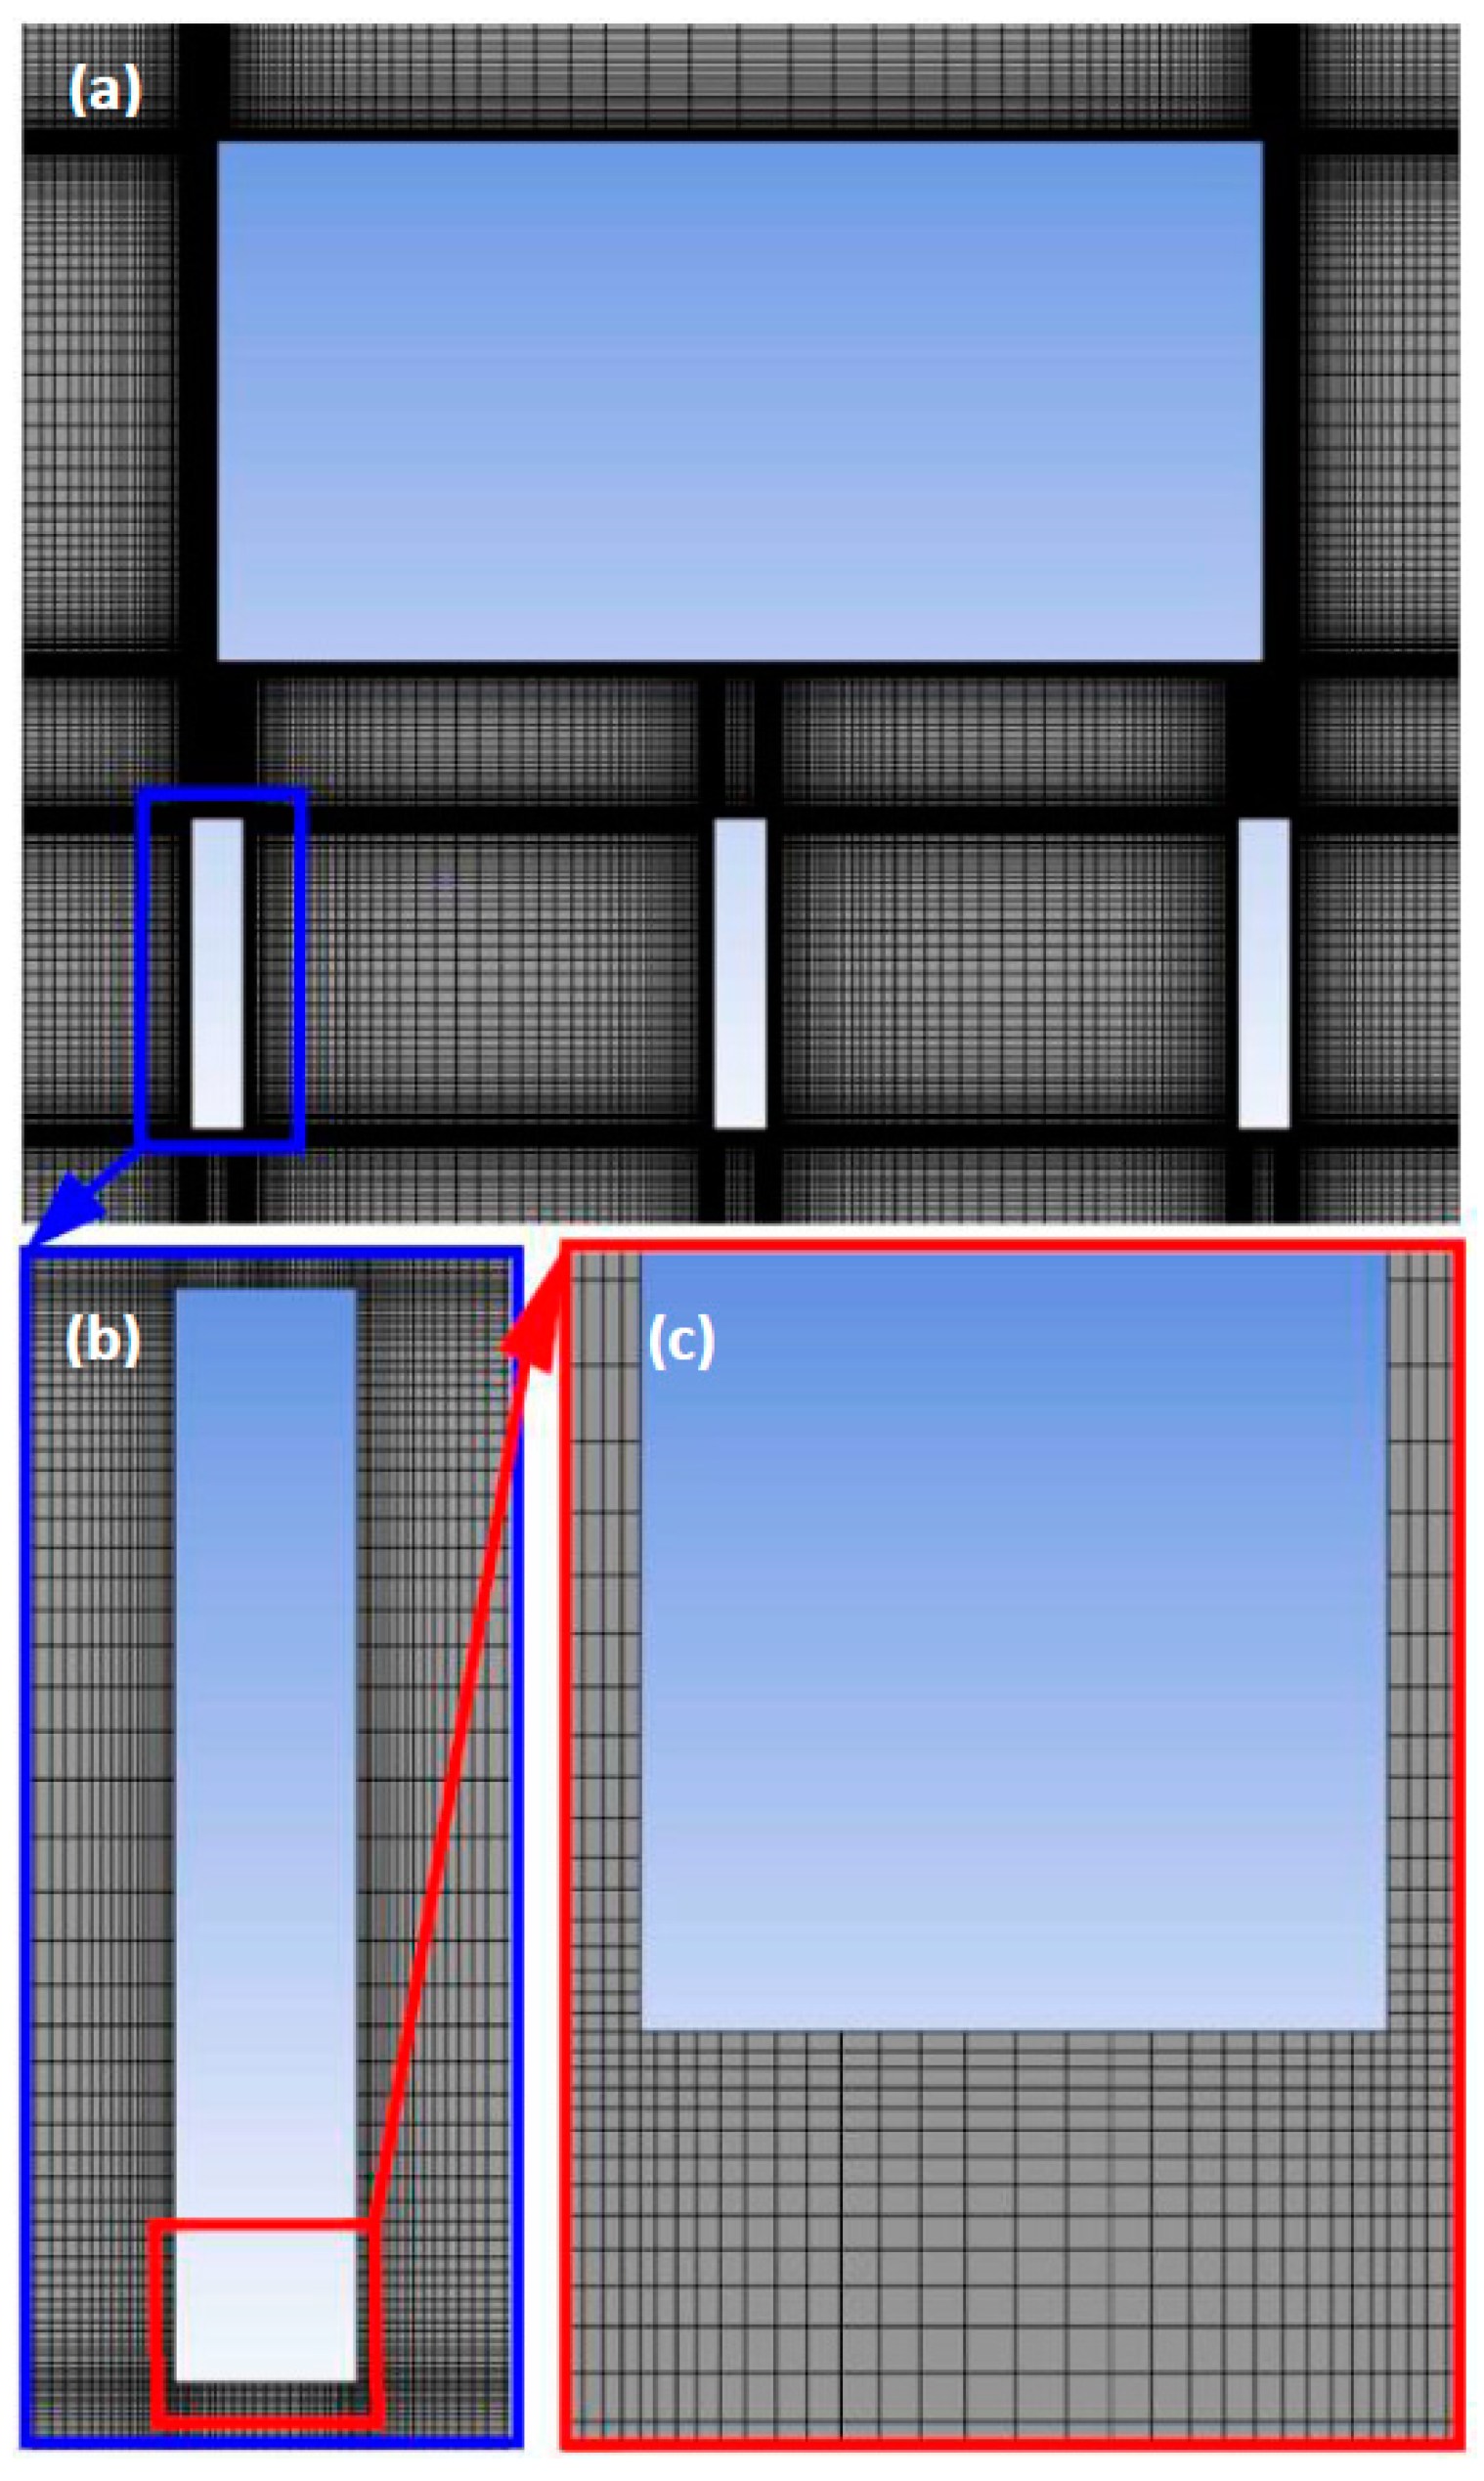
Mesh resolution must be sufficiently refined to account for the energy spectrum of longitudinal velocity with respect to the integral scale of turbulence, for a building model of simple geometry, through LES [21]. This is defined as 3 times the building width based on the recycle region in the generated inflow. The size of cells required at the building surface should be less than width/100 or a reduction in scale equal of 300 times the cell size [21]. A structured mesh (Figure 3) with a growth rate of 1.1 was used [12] to meet the demand of modeling near wall behavior by placing the smallest dimensioned cells in contact with the walls, and then applying a linearly increasing growth rate on each cell that extends further out. This factor represents an improvement on the value of 1.3 recommended in general for wind engineering [9,10]. Together the growth rate, orthogonality and aspect ratio determine the mesh quality, which contributes to solution accuracy. The mesh was orthogonal throughout. Maximum aspect ratios are within, or below, the order of 1 × 10³ and 1 × 10⁴ for all models due to the constraints associated with spatial discretization [22].

3. Model Convergence

3.1. Mesh Sensitivuty Study

A mesh sensitivity study using a bracket length ‘g’ = 240 mm and a fin length ‘d’ = 480 mm was performed. The wind’s direction was set at 0° to the horizontal, with the result that while a sheltering effect occurred for two of the fins, the leading fin had full wind exposure. The sensitivity study focused on this leading fin, as it is the critical fin to establish solution convergence. Three meshes were analyzed differing by their minimum cell size, with the cell size of Mesh 1 set at 2 mm, the cell size of Mesh 2 set at 1 mm and the cell size of Mesh 3 set at 0.5 mm. The simulation was performed for six residence times, equal to approximately 6 s (based on a mean wind velocity of 24.9 m/s and a domain length of 24.48 m). The first three residence times allowed the solution to reach a statistically stable condition. Representative data was collected in the subsequent three residence times. In all cases, readings were taken every 0.04 s. The selected numerical solver is the Semi-Implicit Method for Pressure-Linked Equations (SIMPLE) algorithm.
The non-dimensional wall distance, Y-plus (Y+), is an important measure of mesh quality at wall features within the computational domain. For values less than 5, modeling takes account of turbulence dampening at the viscous sub-layer [12]. However, with the application of WMLES, turbulence was resolved directly at wall regions where Y+ < 300 [23,24]. The minimum cell sizes of 2 mm, 1 mm and 0.5 mm do not cause Y+ to exceed 300, with peak values of 290.1, 157.2 and 78.8, respectively (Table 1). This means for these respective cell sizes involving the sub-grid scale, the WMLES model was within operating limits for each mesh.
The Courant Number, Co, is a measure of mesh instability that affects solution convergence and therefore affects model accuracy. Choosing the time step for a particular mesh is based on meeting the tolerance sought for the Courant Number parameter. In the case of implicit transient formulations, it is required to be less than 20–40 for sensitive regions [24], which in this problem represents areas nearest the fins. Table 1 displays maximum Courant Numbers of 38.1 (2 mm cell size), 38.4 (1 mm cell size) and 33.4 (0.5 mm cell size), and indicates that values do not exceed the upper limit of Co = 40. These results were produced for time-steps 8 × 10⁻⁴ s, 4 × 10⁻⁴ s and 2 × 10⁻⁴ s, with respect to the 2 mm, 1 mm and 0.5 mm cases. There appeared to be little variation in Co between the meshes, as the ratio of time-step to cell size remained the same in each case. For completeness, the number of cells, ratio and refinement factors for each of the three mesh sizes are given in Table 2.

3.2. Convergence of Peak Pressures

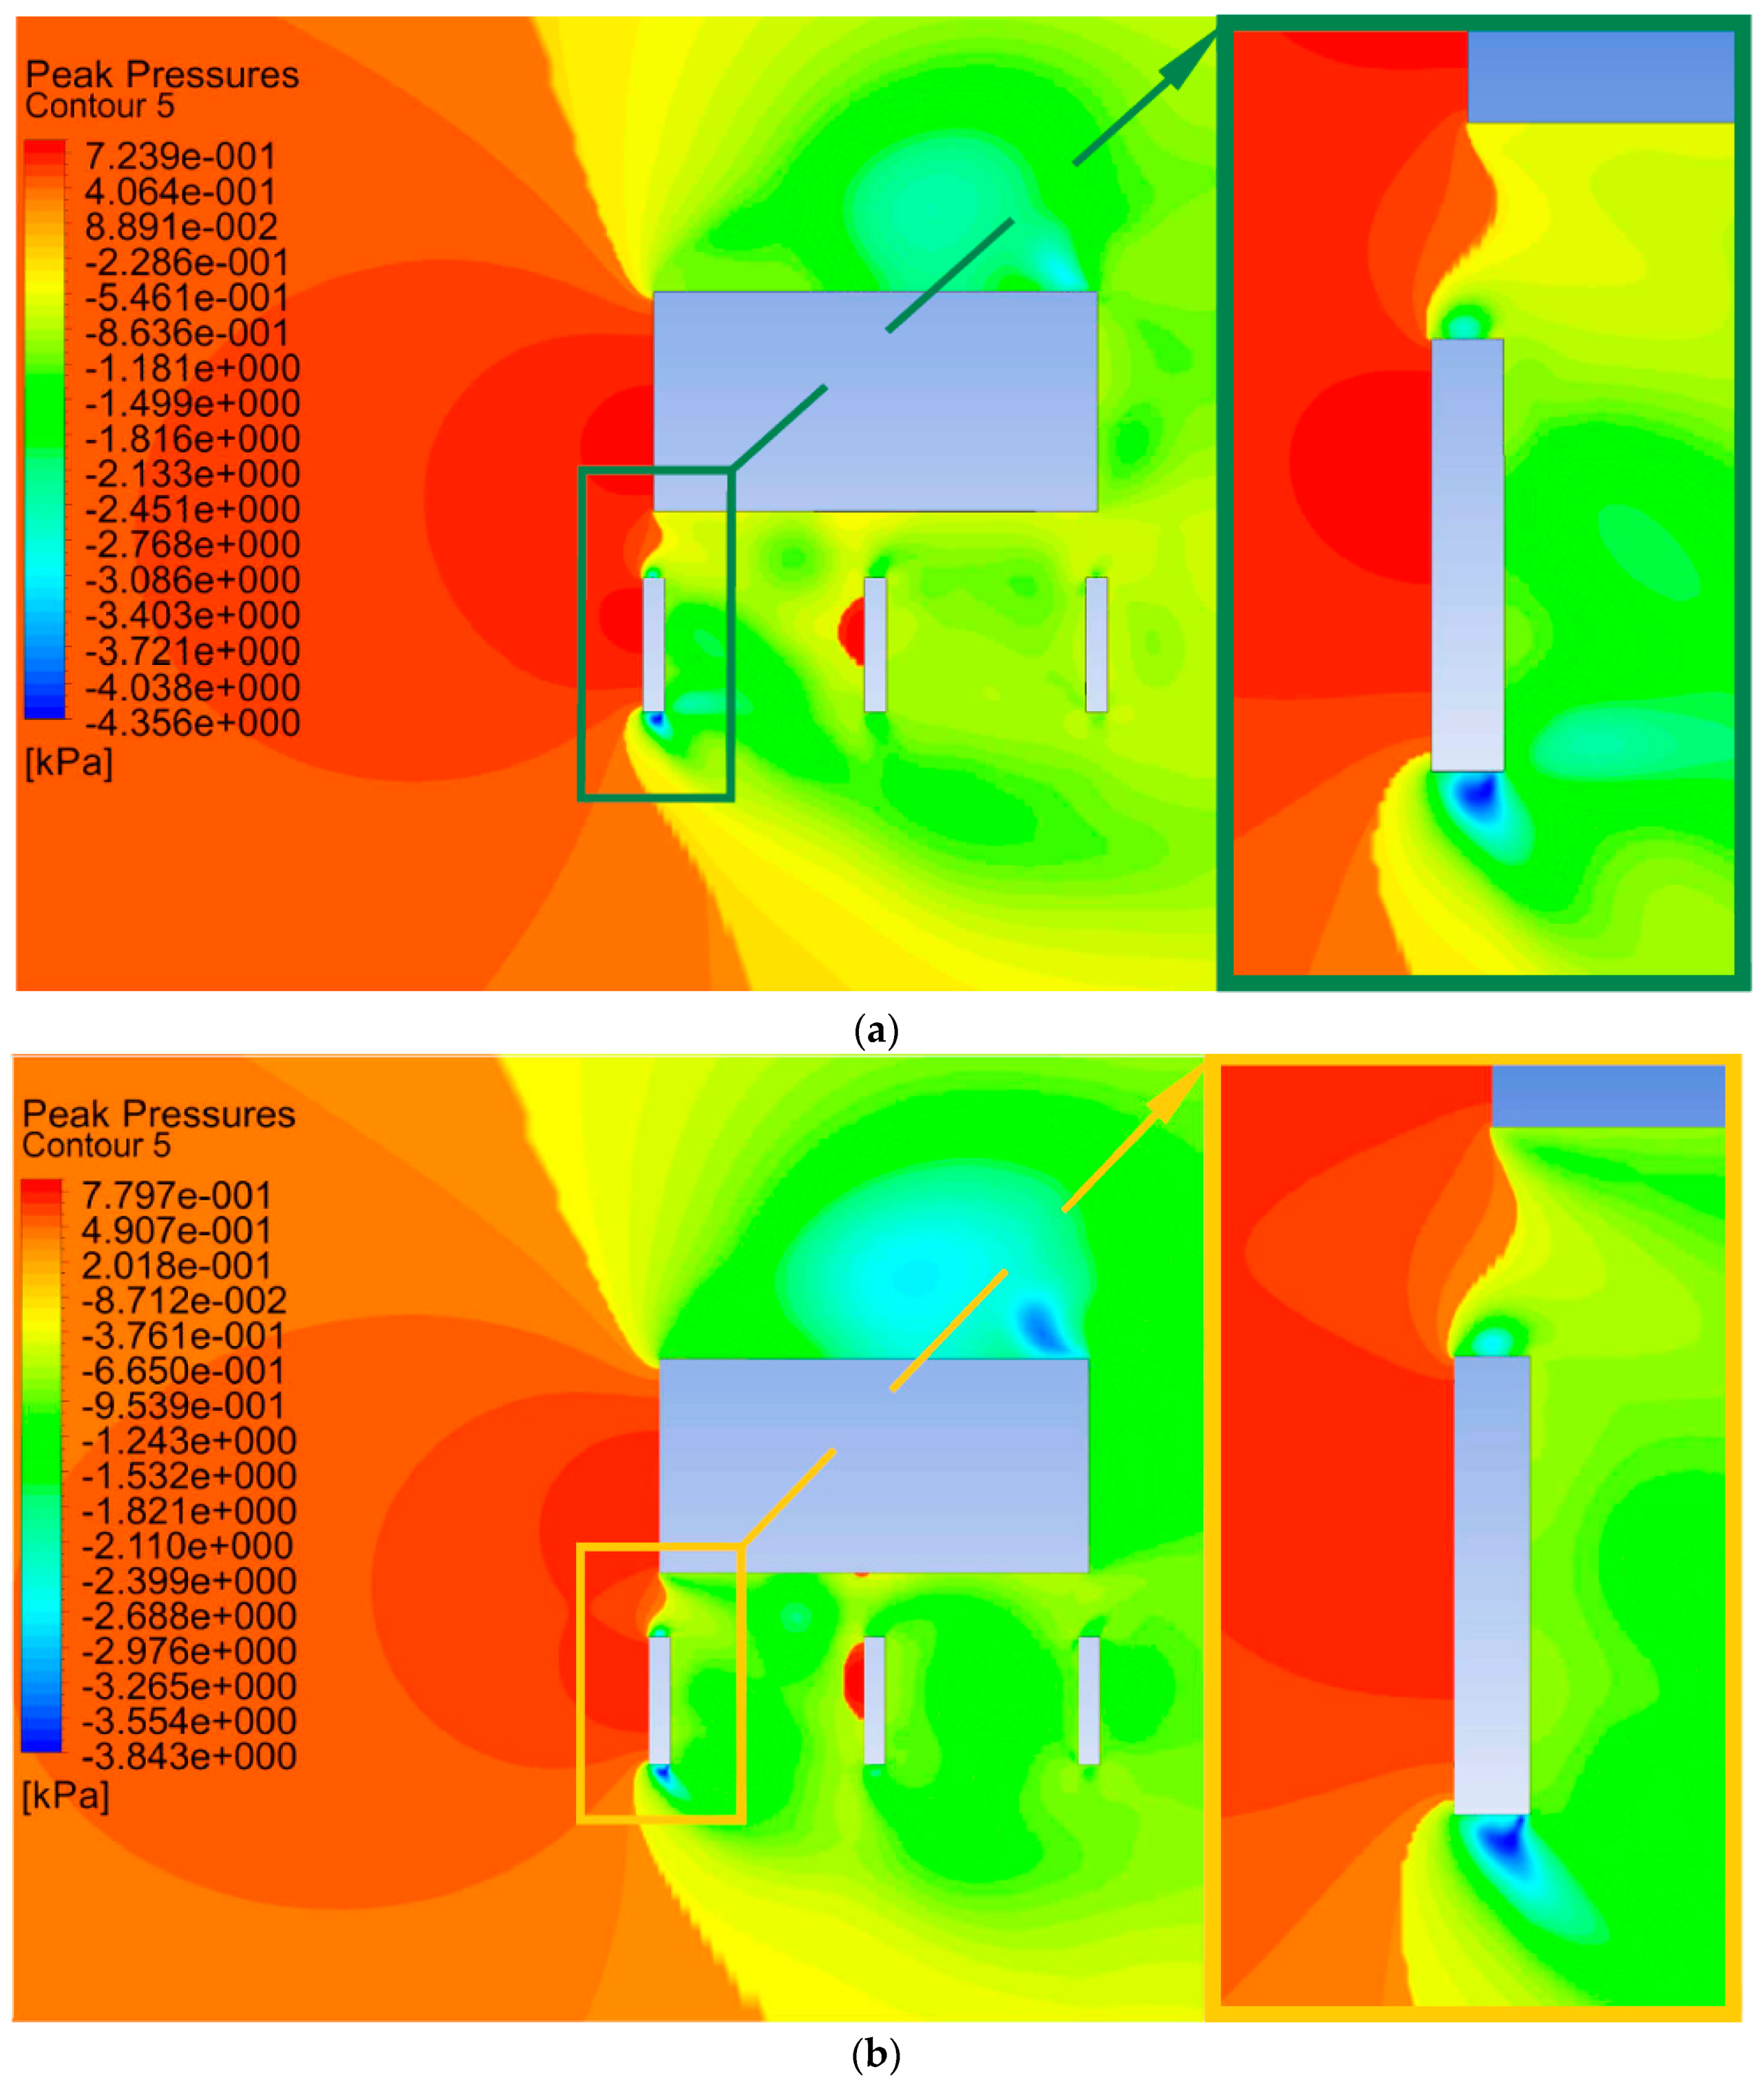
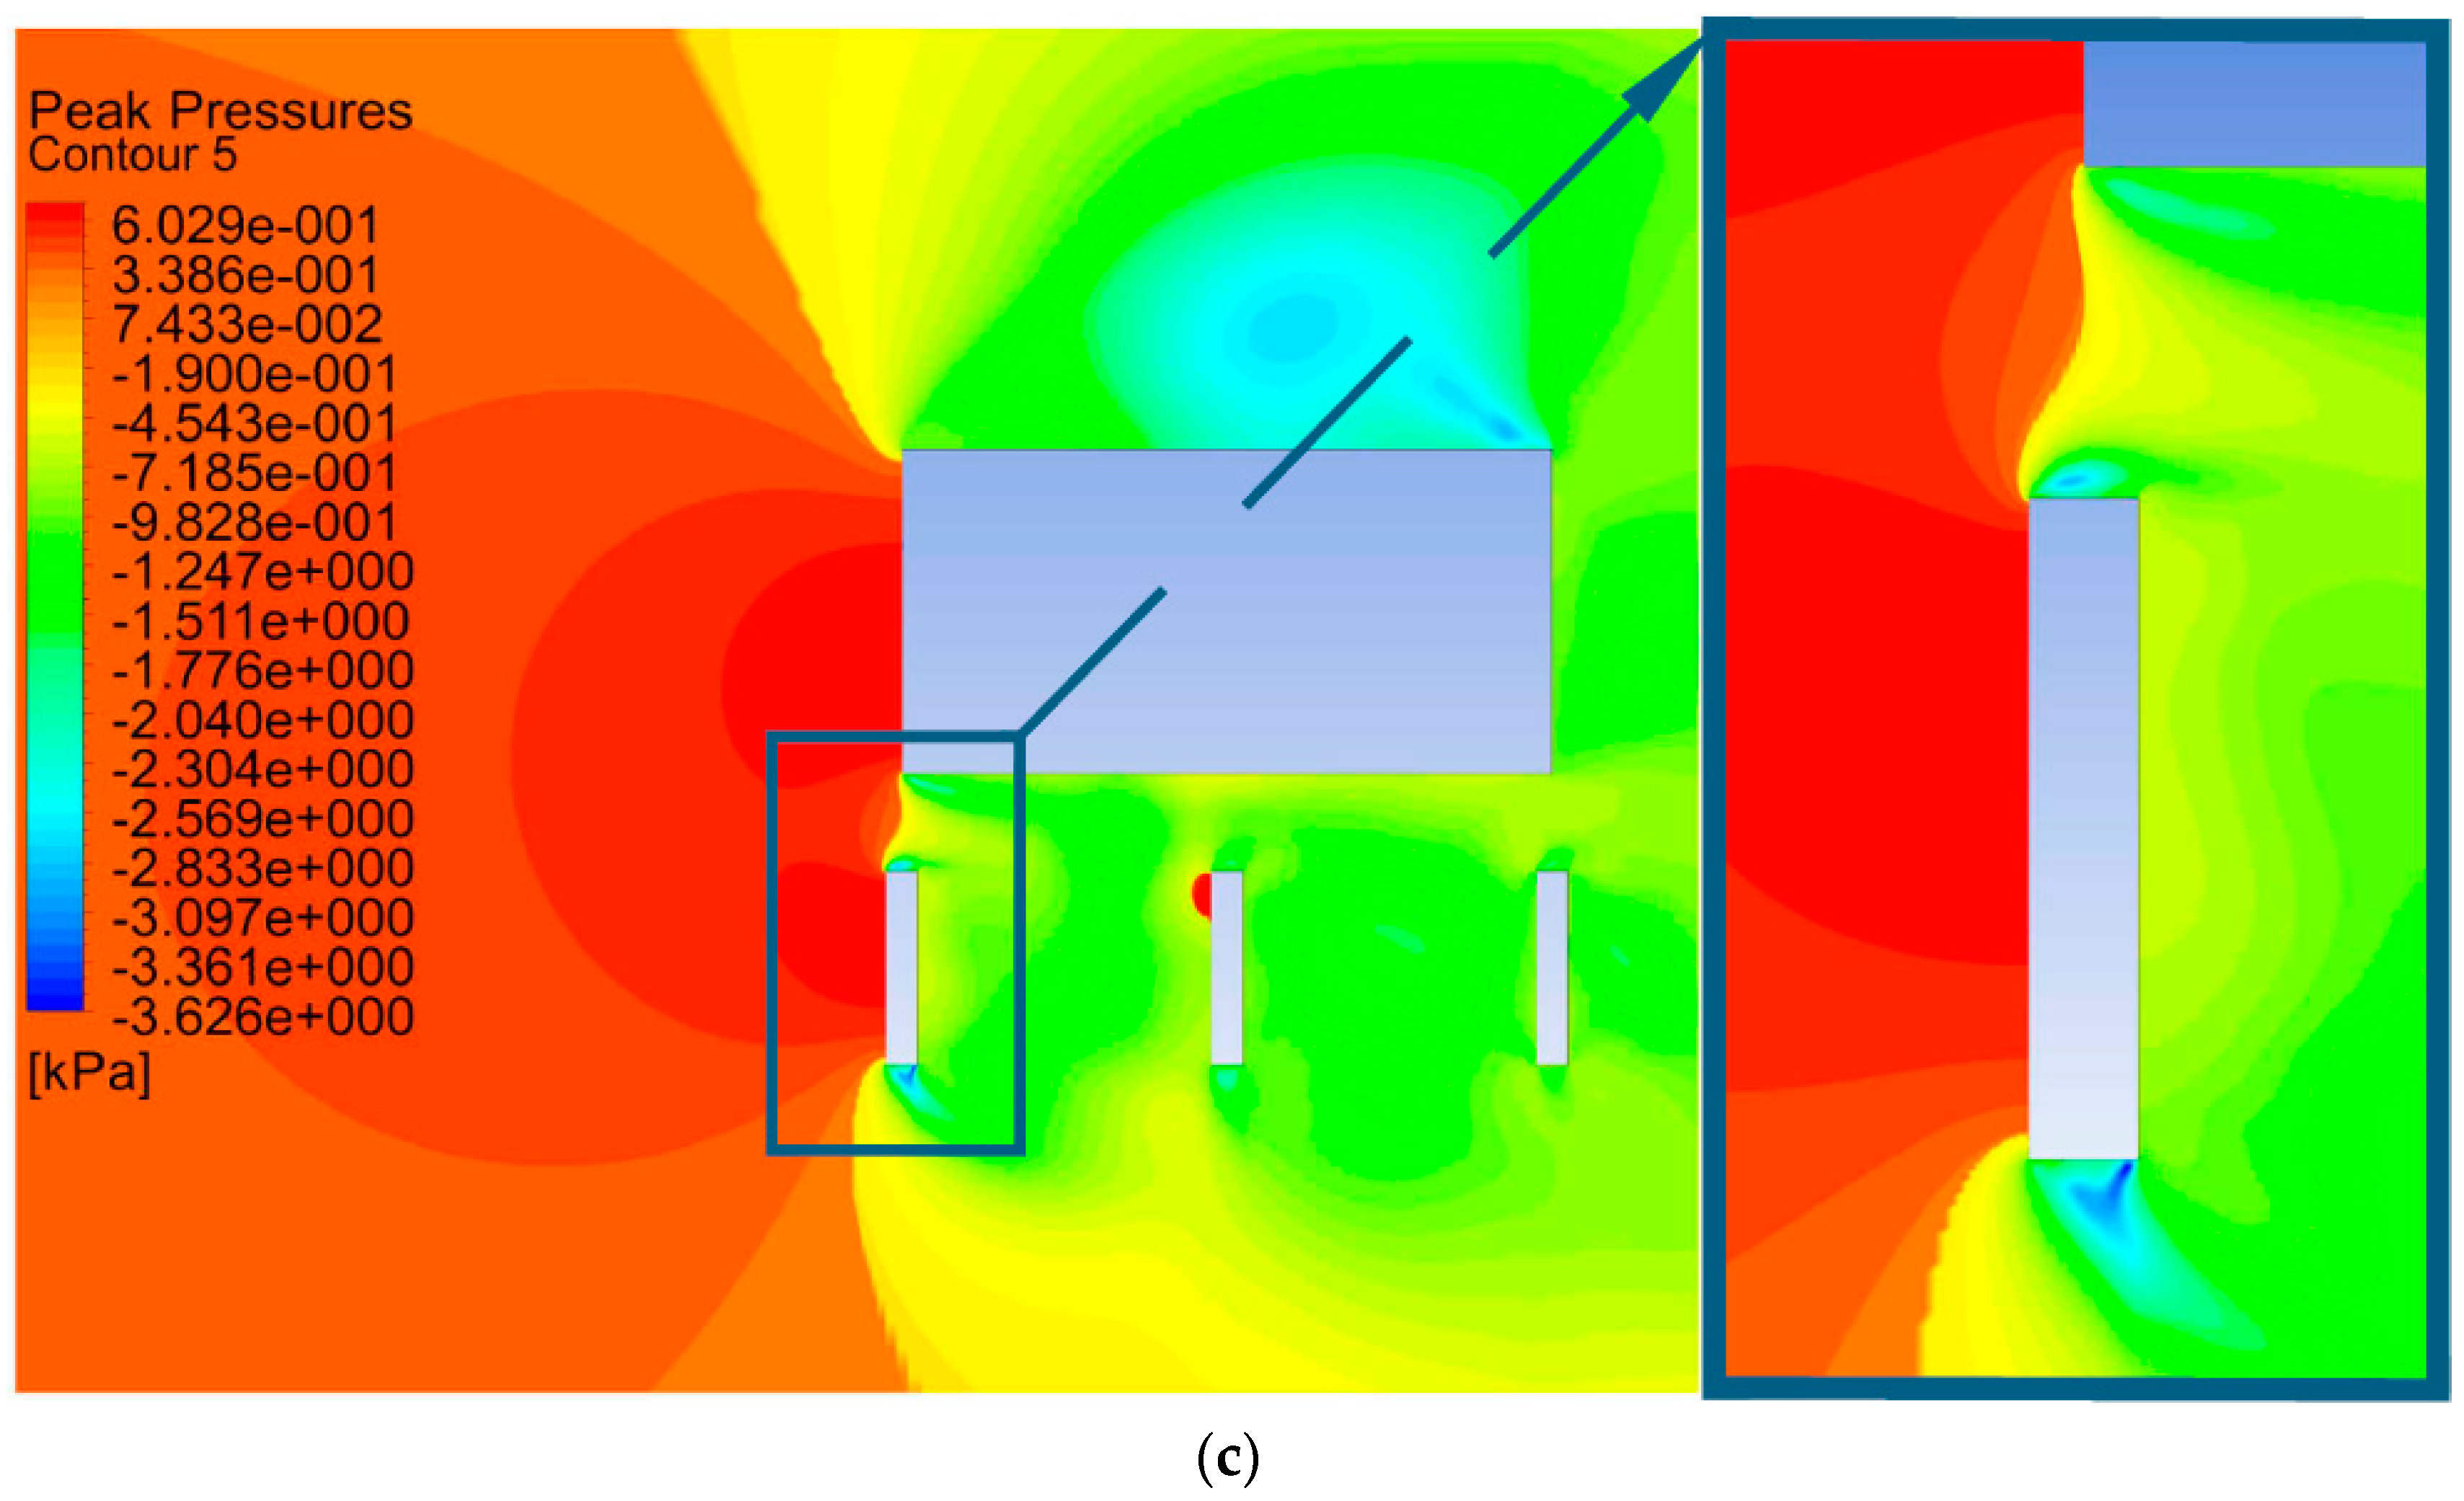
Of primary interest are the maximum pressures that occur in the event of one-in-50-year wind conditions. To be consistent with Limit State Design practices used in the Eurocode, peak wind pressures were calculated using Equation (1) and are presented in Figure 4:
95% Pwind ≤ [Pav + 1.64 Prms]
where Pwind represent the wind pressures, Pav is the time averaged pressure and Prms is the root mean square error of pressures. Figure 4 illustrates that peak pressures acting on the critical fin only vary slightly due to changes in mesh size. The root mean square error statistic acts as the sample standard deviation of the pressure in each of the simulations and was calculated as:
S a m p l e   S D = R M S E = n = n t 0 n T ( p ¯ p t ) n t 2 k N / m 2 .
This was done with respect to several samples at a set frequency which is termed ‘ n t ’. The duration of data sampled begins at initial time ‘t0’ and a final time of ‘T’. The quantitative differences between each mesh were then examined to prove convergence with respect to the critical fin.
A key measure for determining convergence is the relative error indicator:
e 12 = | y 1 y 2 y 1 |
where y1 and y2 are the quantity of interest for Mesh 1 and Mesh 2, respectively. In general, for a solution to converge, a value between meshes must have the relation:
e 12 e 23 = | y 2 y 3 y 2 |
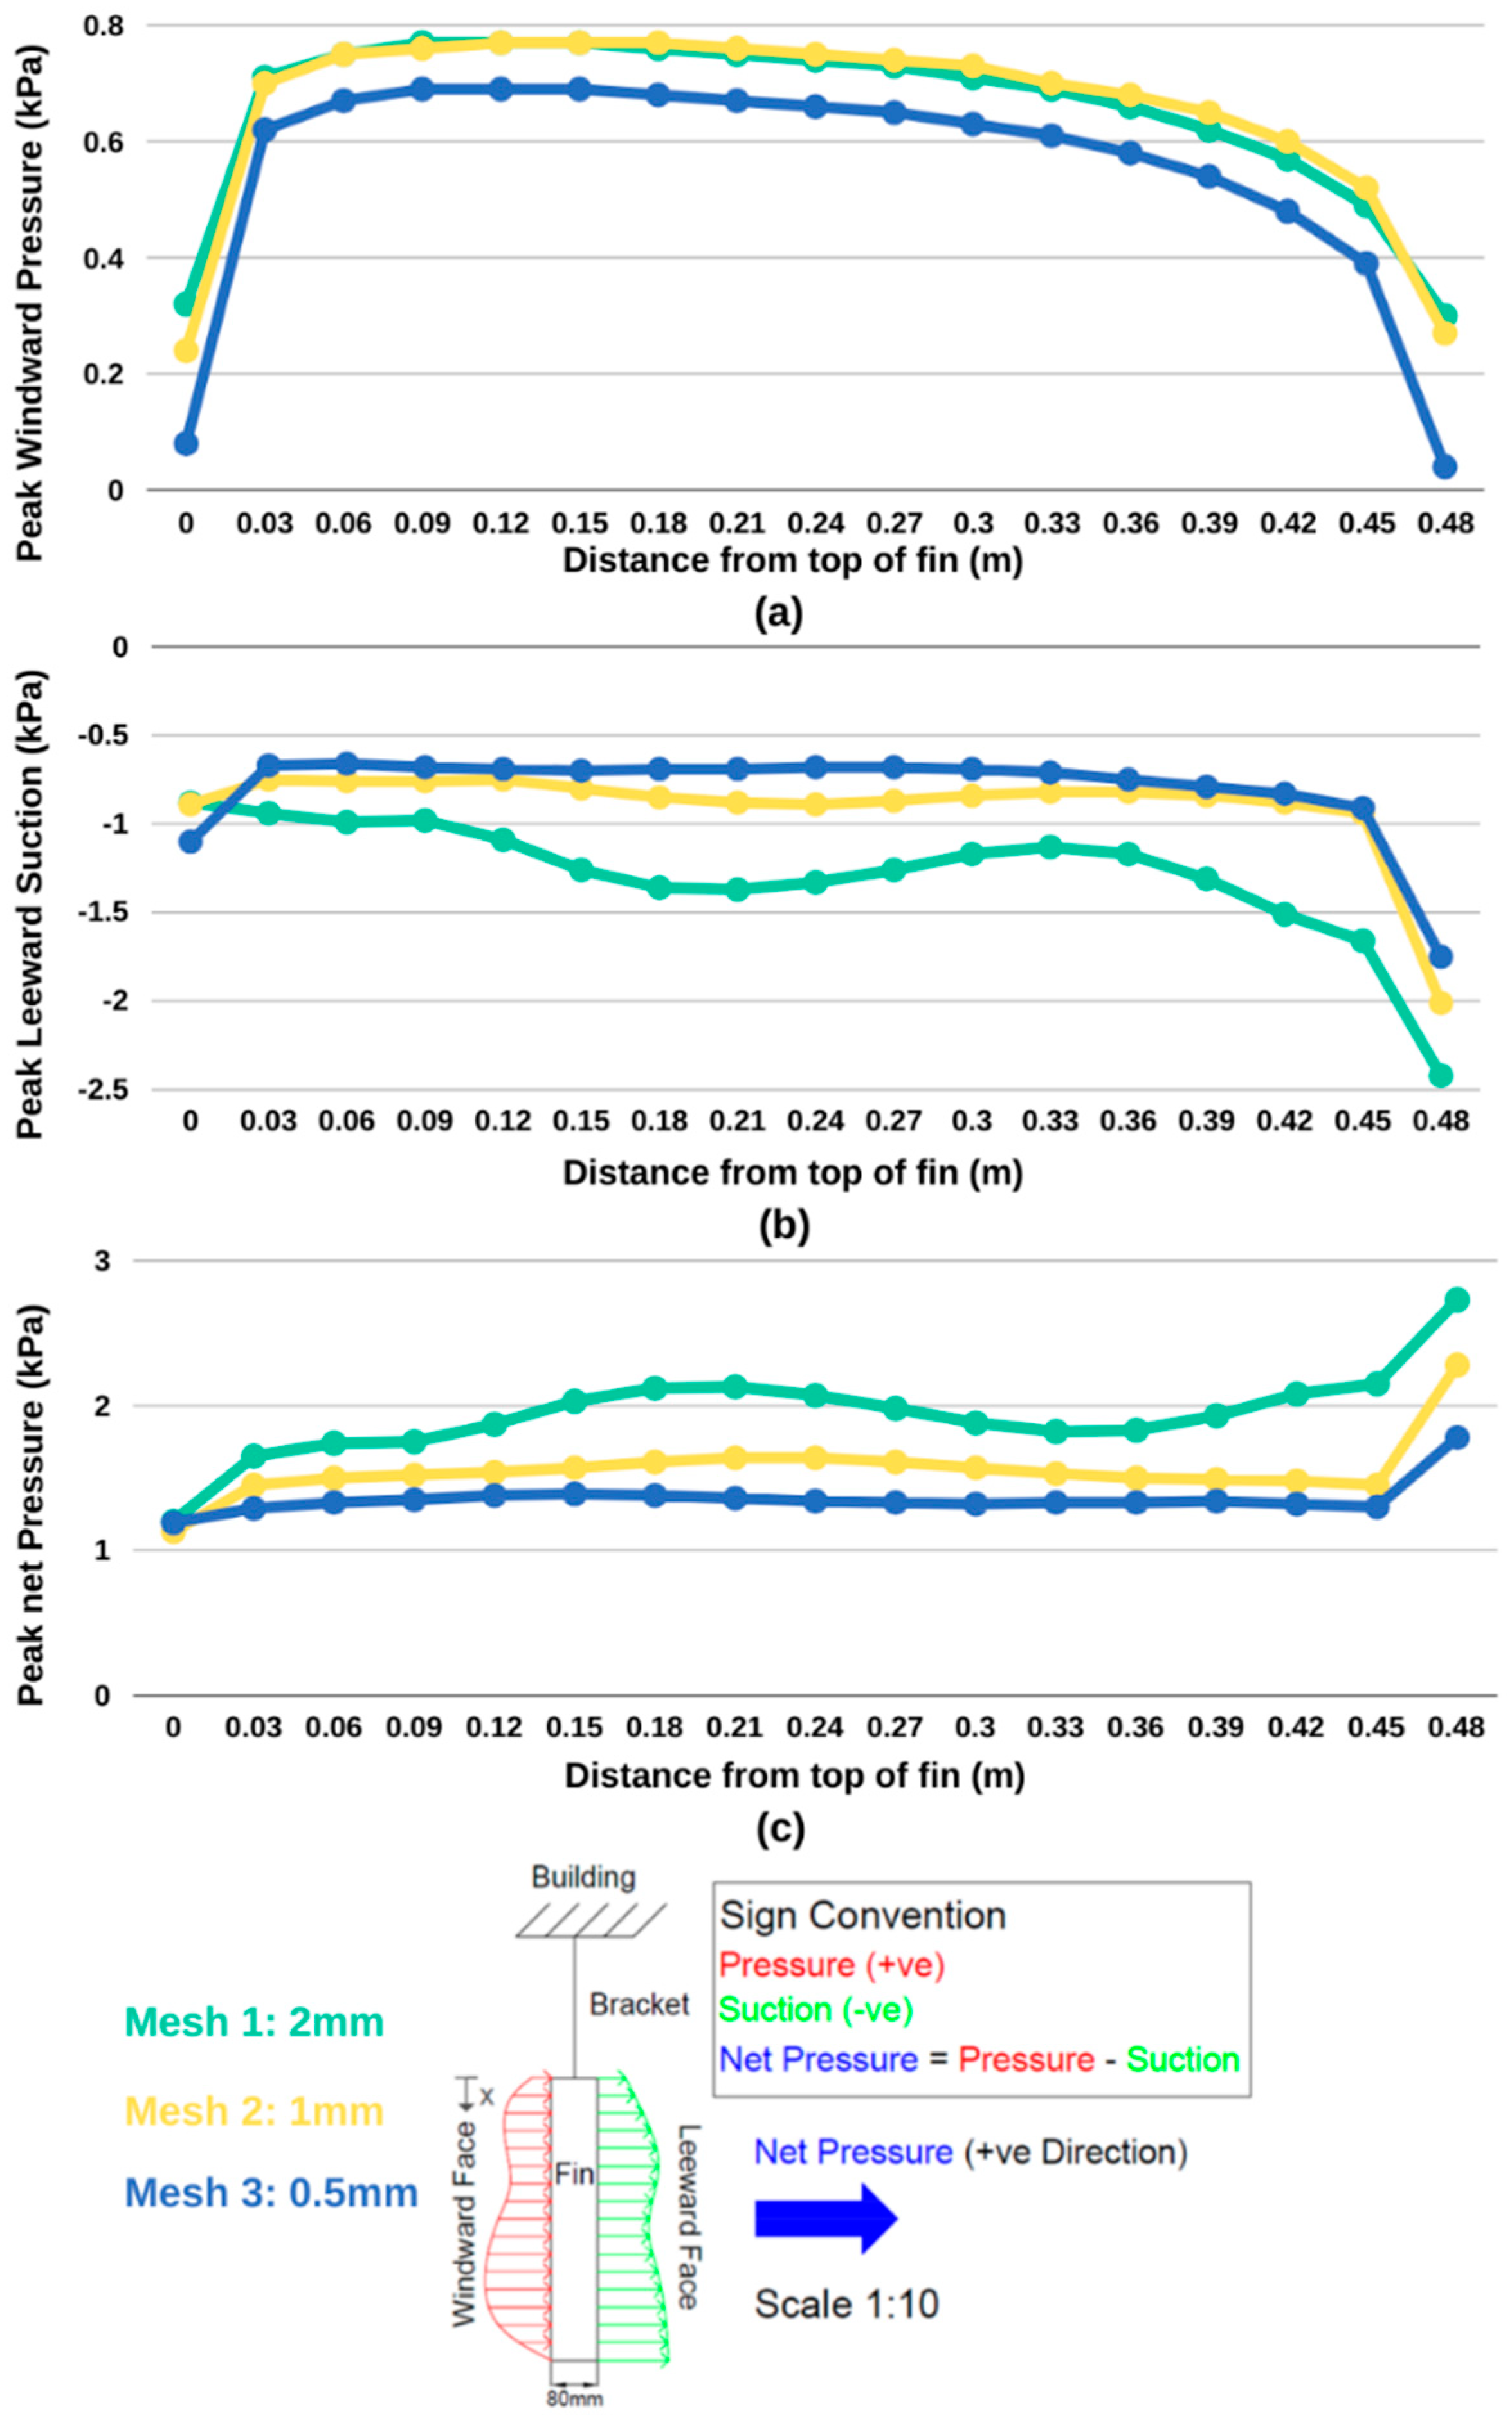
while also showing a persistent increase, or decrease, in measuring the quantity based on the mesh resolution. In Figure 5a, only three of the 17 sample points show a consistent decrease in peak pressure with greater mesh refinement. The average relative error between Mesh 1 and Mesh 2 (e12) is 3.3%, and between Mesh 2 and Mesh 3 (e23) is 12.3%. This increase in error with mesh density establishes a lack of convergence. However, the problem is not limited to this windward case, and the complexity associated with maintaining the continuity of airflow means that leeward suction influences these values.
There was close agreement found between Mesh 2 and Mesh 3, relative to the pressure distribution associated with the coarsest mesh (Figure 5b). Sixteen of the 17 sample points demonstrated a reduction in the magnitude of suction pressure, with decreasing cell sizes. The exception occurred at a corner location that induces more instability, which corresponds to higher Courant Number readings than elsewhere. The mean relative error e12 was 29.2% and e23 was 13.8%. Therefore, peak suction pressures on the leeward face of the critical fin tended to converge, independent of mesh size.
In Figure 5c, 16 of the 17 sample points measure a consistent reduction in peak net pressures, with decreasing cell size. The exception occurs at the top part of the fin closest to the building where peak net pressures increase as mesh resolution increases. The mean relative error e12 is 18.9% while e23 is 13.1%. Therefore, resultant peak net pressures on the critical fin tend to converge, independent of the mesh size.
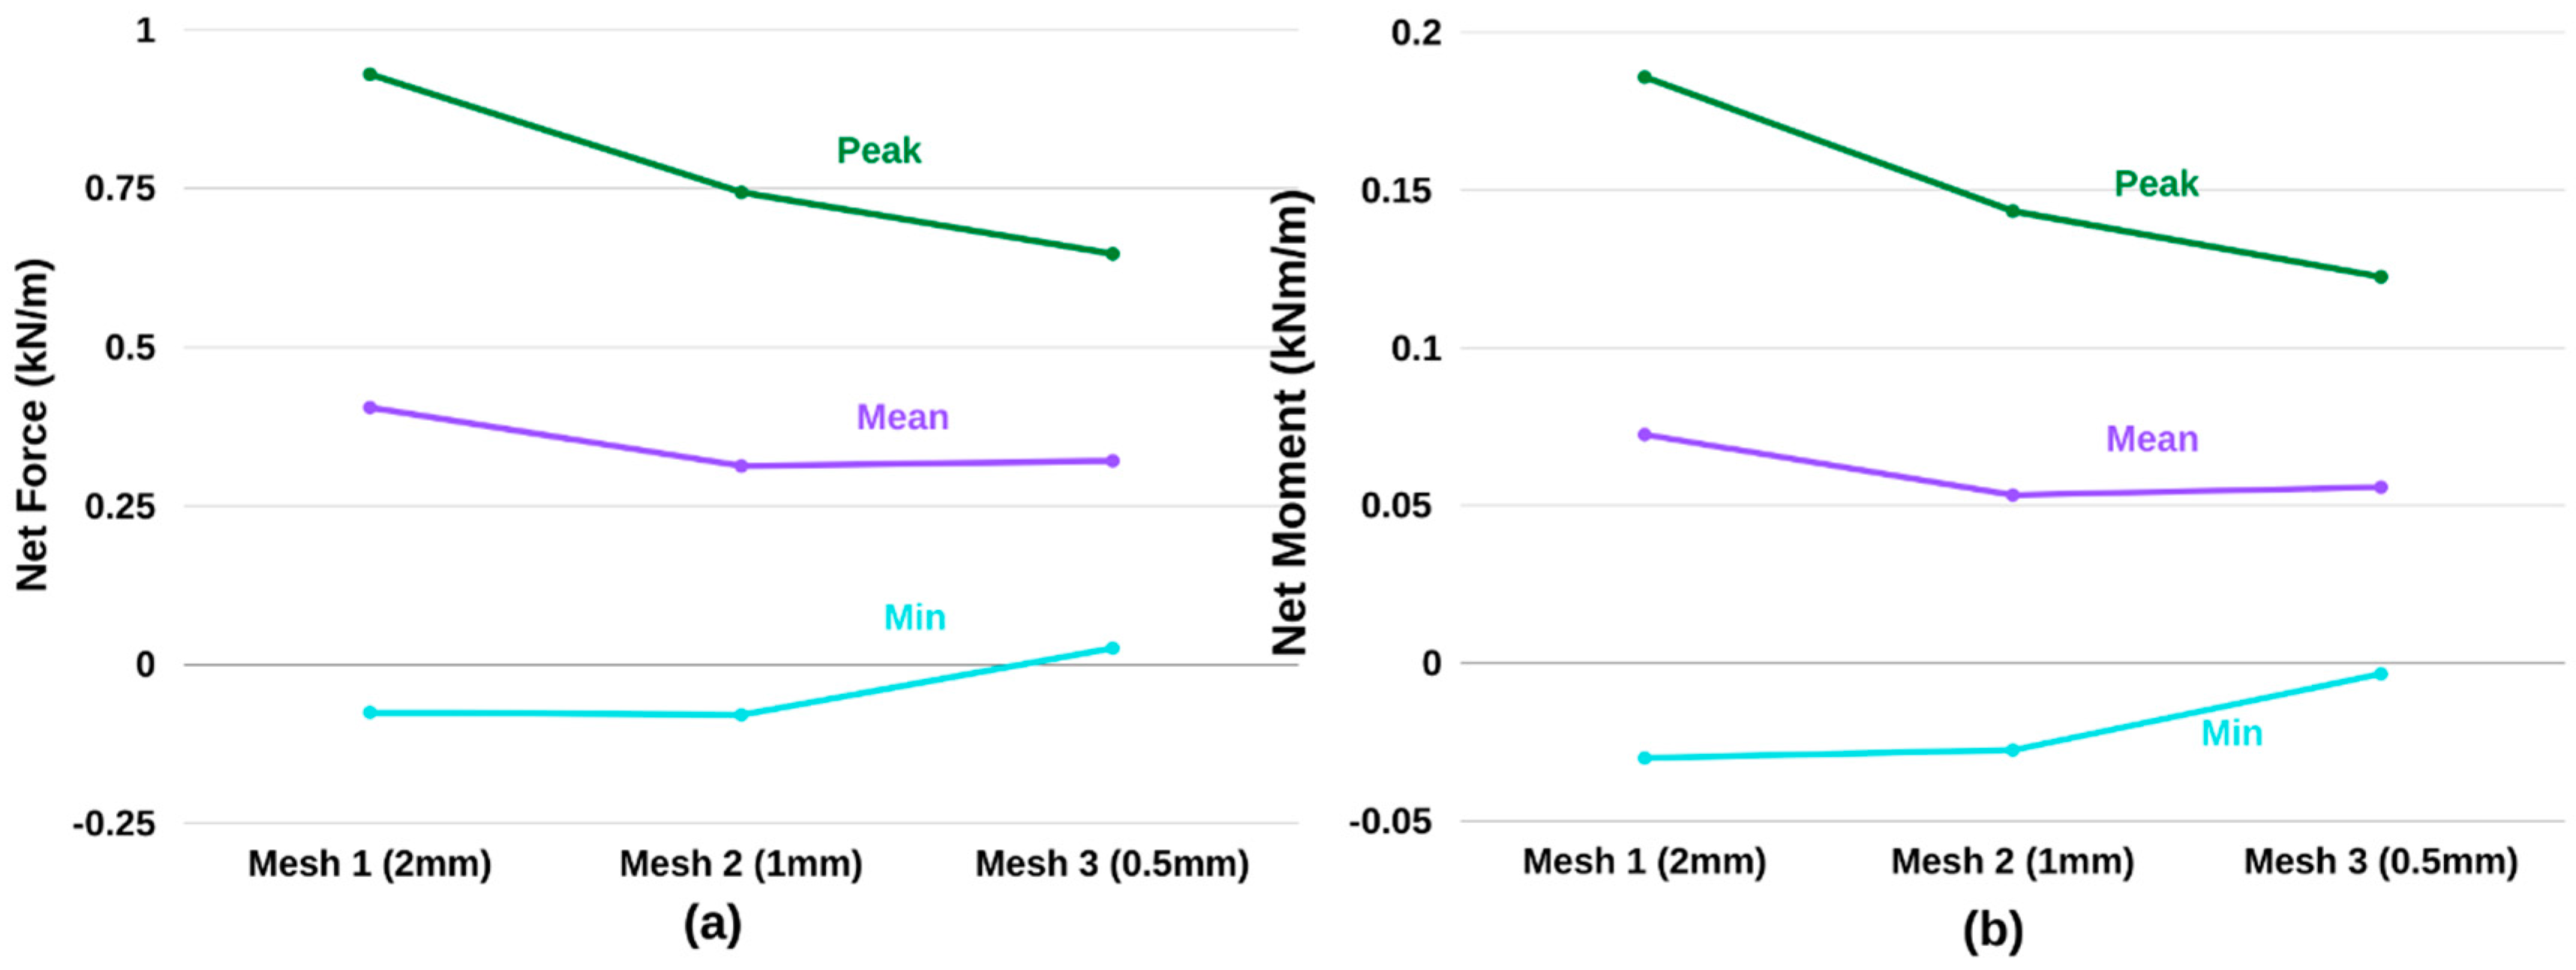
Net pressures provide a reliable quantification of how airflow translates to loading on an obstacle. While there is variance in the windward pressure case, the resultant loading can account for the complexity of the flow. Therefore, proof of convergence is based on the calculation of net force versus mesh resolution. Net force is calculated from the trapezoidal integral of the net pressures. It is positive acting rightwards as per net pressures. The units for net force are defined as kilonewtons-per-meter of height (of the fin) in the elevation of the façade. The relative error for peak net force e12 was 19.9% while e23 equaled 13.1%. This methodology was extended to investigate mean and min forces as well. An L-shaped bend is apparent in Figure 6a and therefore it was clear that peak net force converges independent of mesh resolution. Mean force was also seen to converge. Minimum values represent outlier readings where in only 5% of instances, a smaller value was reported. The moment generated from the net force onto the connection between the bottom of the bracket and the top of the fin (in plan-view) was then calculated. For this purpose, using the net pressure distribution, the lever arm, x ¯ was calculated as:
x ¯ = n = 1 n f n x n n = 1 n f n
where f n represents the area of each trapezoidal section and x n is the distance from the top of the fin to the center of each trapezoidal section. The results, reflecting the position of the net force at a distance from the bracket’s connection to the fin, are given in Table 3.
To derive net moments, the following equation was utilized:
N e t   M o m e n t = F N e t x ¯
where F N e t and x ¯ , are the net pressure derived resultant force and lever arm, respectively. As with peak net forces, net moments converge independent of changes in mesh resolution. For an e12 equal to 21.8%, there is an improvement in reducing to a 0.5 mm mesh at a value of 13.9% for e23 (Table 4). By increasing mesh resolution, the net moment decreases between each change (0.233 kNm/m in Mesh 1, 0.182 kNm/m in Mesh 2 and 0.157 kNm/m in Mesh 3). The resultant L-shaped curve is apparent in Figure 6b. As is also the case for net forces, average and minimum net moment values do not converge in the manner highlighted for peak loading conditions. Minimum values represent outlier data necessary for statistical analysis but are not useful for design—so proof of convergence is not required.
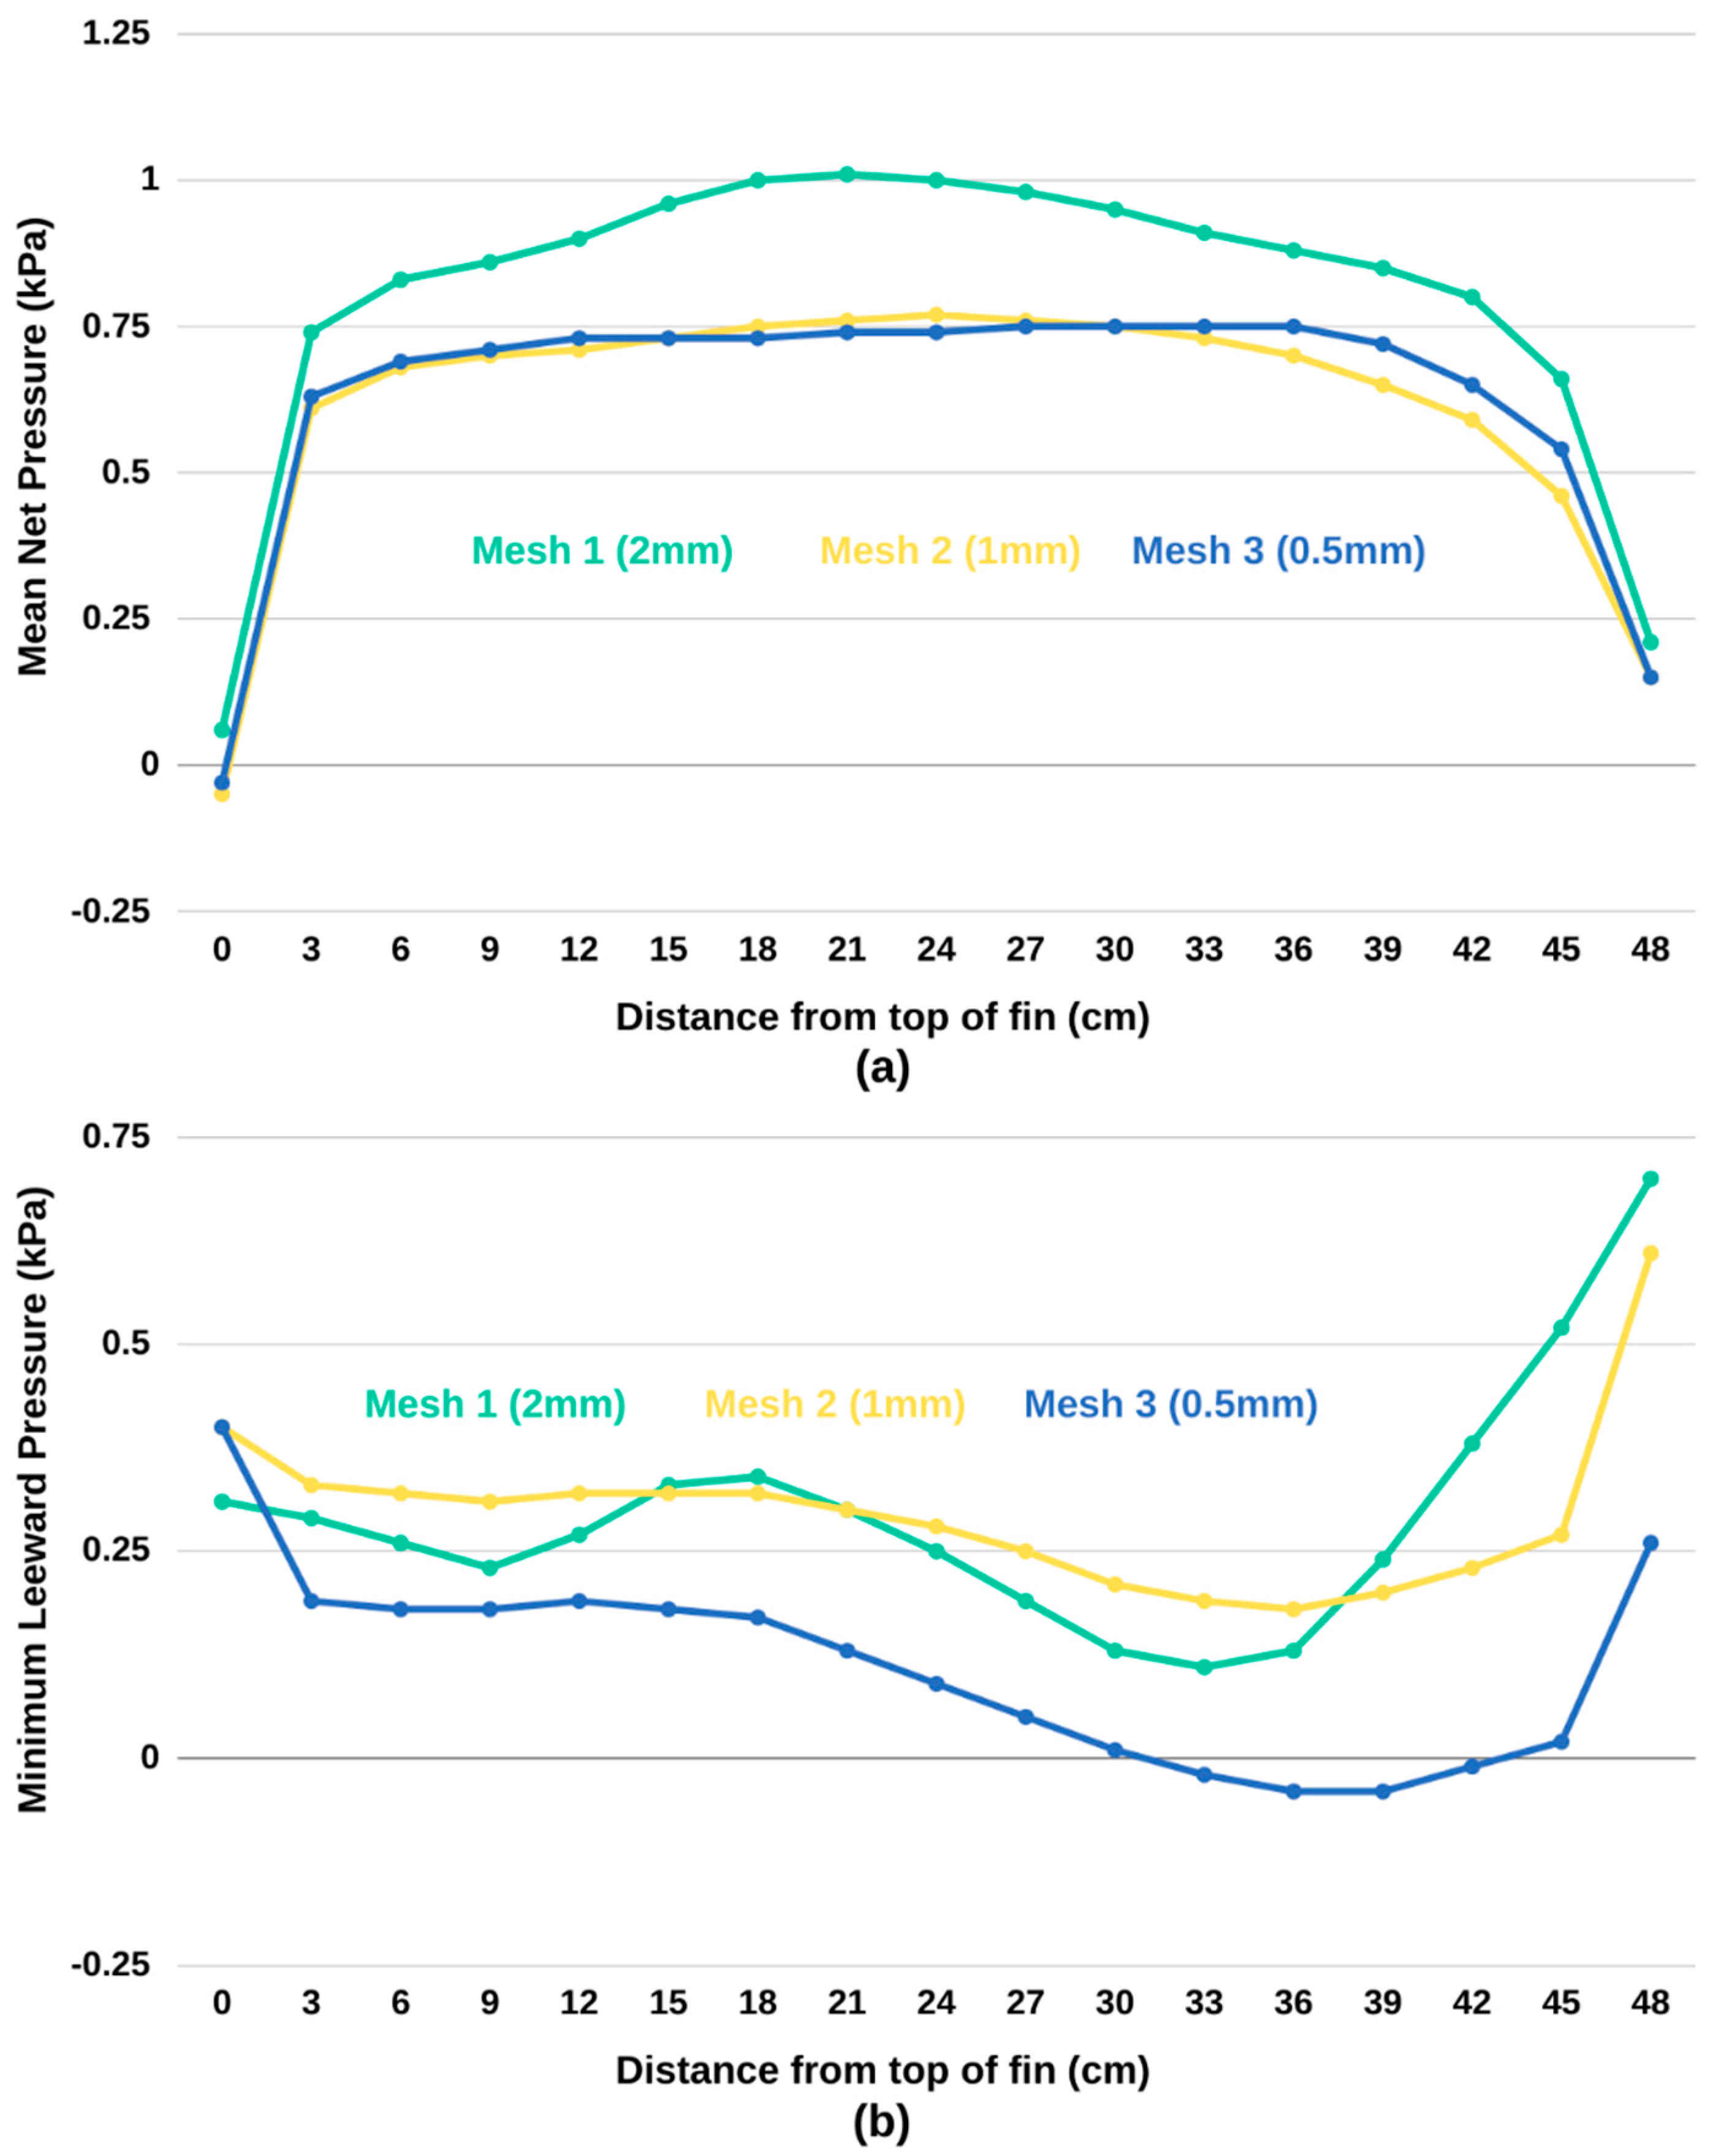
However, as average net forces and moments are considered important in choosing wind loading for façade design, they should ideally converge. To explain why there is no converged solution, it is necessary to study the reasons why Mesh 2 has a lower value with respect to Mesh 3. From Figure 7a, there are four distinct points from 0.36 m and 0.45 m along the fin where the net pressure of Mesh 3 exceeds Mesh 2, representing a discontinuity. This is explained by looking at the graph for minimum outliers that occur for the leeward face (Figure 7b). For the same locations (between 0.36 m and 0.45 m), Mesh 3 has pressure at the leeward side of approximately zero. For Mesh 2 however, the pressure equates on average to approximately 0.22 kPa. Due to its action on the leeward edge, the net pressures were reduced by this amount. As net forces and net moments are both based on net pressures, it was apparent that averages for these values are more skewed for Mesh 2 than Mesh 3 due to the small pressure outliers found in Mesh 2.
Based on the findings above, modeling was carried out with a 1 mm minimum cell size for all meshes. This mesh size was chosen because there is both improved accuracy in comparison to using a 2 mm minimum cell size mesh and strong agreement with the results of the finer 0.5 mm mesh. Also, the tendency of the 1 mm mesh to overestimate values for peak wind loading by between 13% and 14% (Table 4) ensured that the findings of the research are conservative without requiring the greater computational time demanded for calculating wind pressures and velocities in a more refined mesh.
The decision was also taken to adjust the time step (Δt) used in the 1 mm mesh case. The value of Δt equal to 4 × 10⁻⁴ s is revised down to 2.5 × 10⁻⁴ s, to account for increased wind speed in subsequent models. This adjustment is made to maintain Courant Number (Co) values less than the upper limit of 40 for solution stability. As a result of this change, the solutions were found to have sufficient stability. Solution data were acquired every 160 time-steps, or 0.04 s, to maintain the frequency of the previous studies.

4. Results

A total of 36 façade configurations were investigated for this paper (Figure 8). The values termed ‘g’ indicate bracket length (in millimeters) applying to the horizontal axis. On the vertical axis, values under ‘d’ represent the length of the fin (in millimeters). Of this population, a sample of 13 geometries was selected to determine wind pressures on façades by CFD. Figure 8 highlights these in green, while the numbering represents the order of a given setup, in this report. From this sample, the remaining 23 arrangements were interpolated. Efficient façade design geometries were then identified, without having to perform an unnecessarily demanding investigation.
Table 5 provides information on how each model is proportioned in terms of the fluid domain. It details the key dimensions that are implemented in the geometry setup of each model. Omitted from this list of figures is the building width (at 0.8 m) and the length of the structure (equal to the overall extent of the façade, at 1.68 m) that remain constant in dimensions for each model. Additional models numbering ‘14’ and ‘15’ represent the unsheltered cases that reflect a sample of two particularly inefficient façade geometries, determined through analysis of net pressures acting on the critical design fin.
The factors affecting wind forces on fins are described with a representative sample of four models where wind is at 0° to the horizontal (Section 4.1, Section 4.2, Section 4.3 and Section 4.4). Subsequently, the effect of wind direction was taken into account for the case where no fin limits the exposure of oncoming wind across the façade (i.e., where the sheltering effect is absent) in the designs that represent the extremes of the analysis (Section 4.5 and Section 4.6). A synthesis for the arising differences was then provided through an application of fundamental principles from fluid mechanics in the following section.

4.1. Results for Geometry No. 1 (g = 80 mm d = 400 mm)

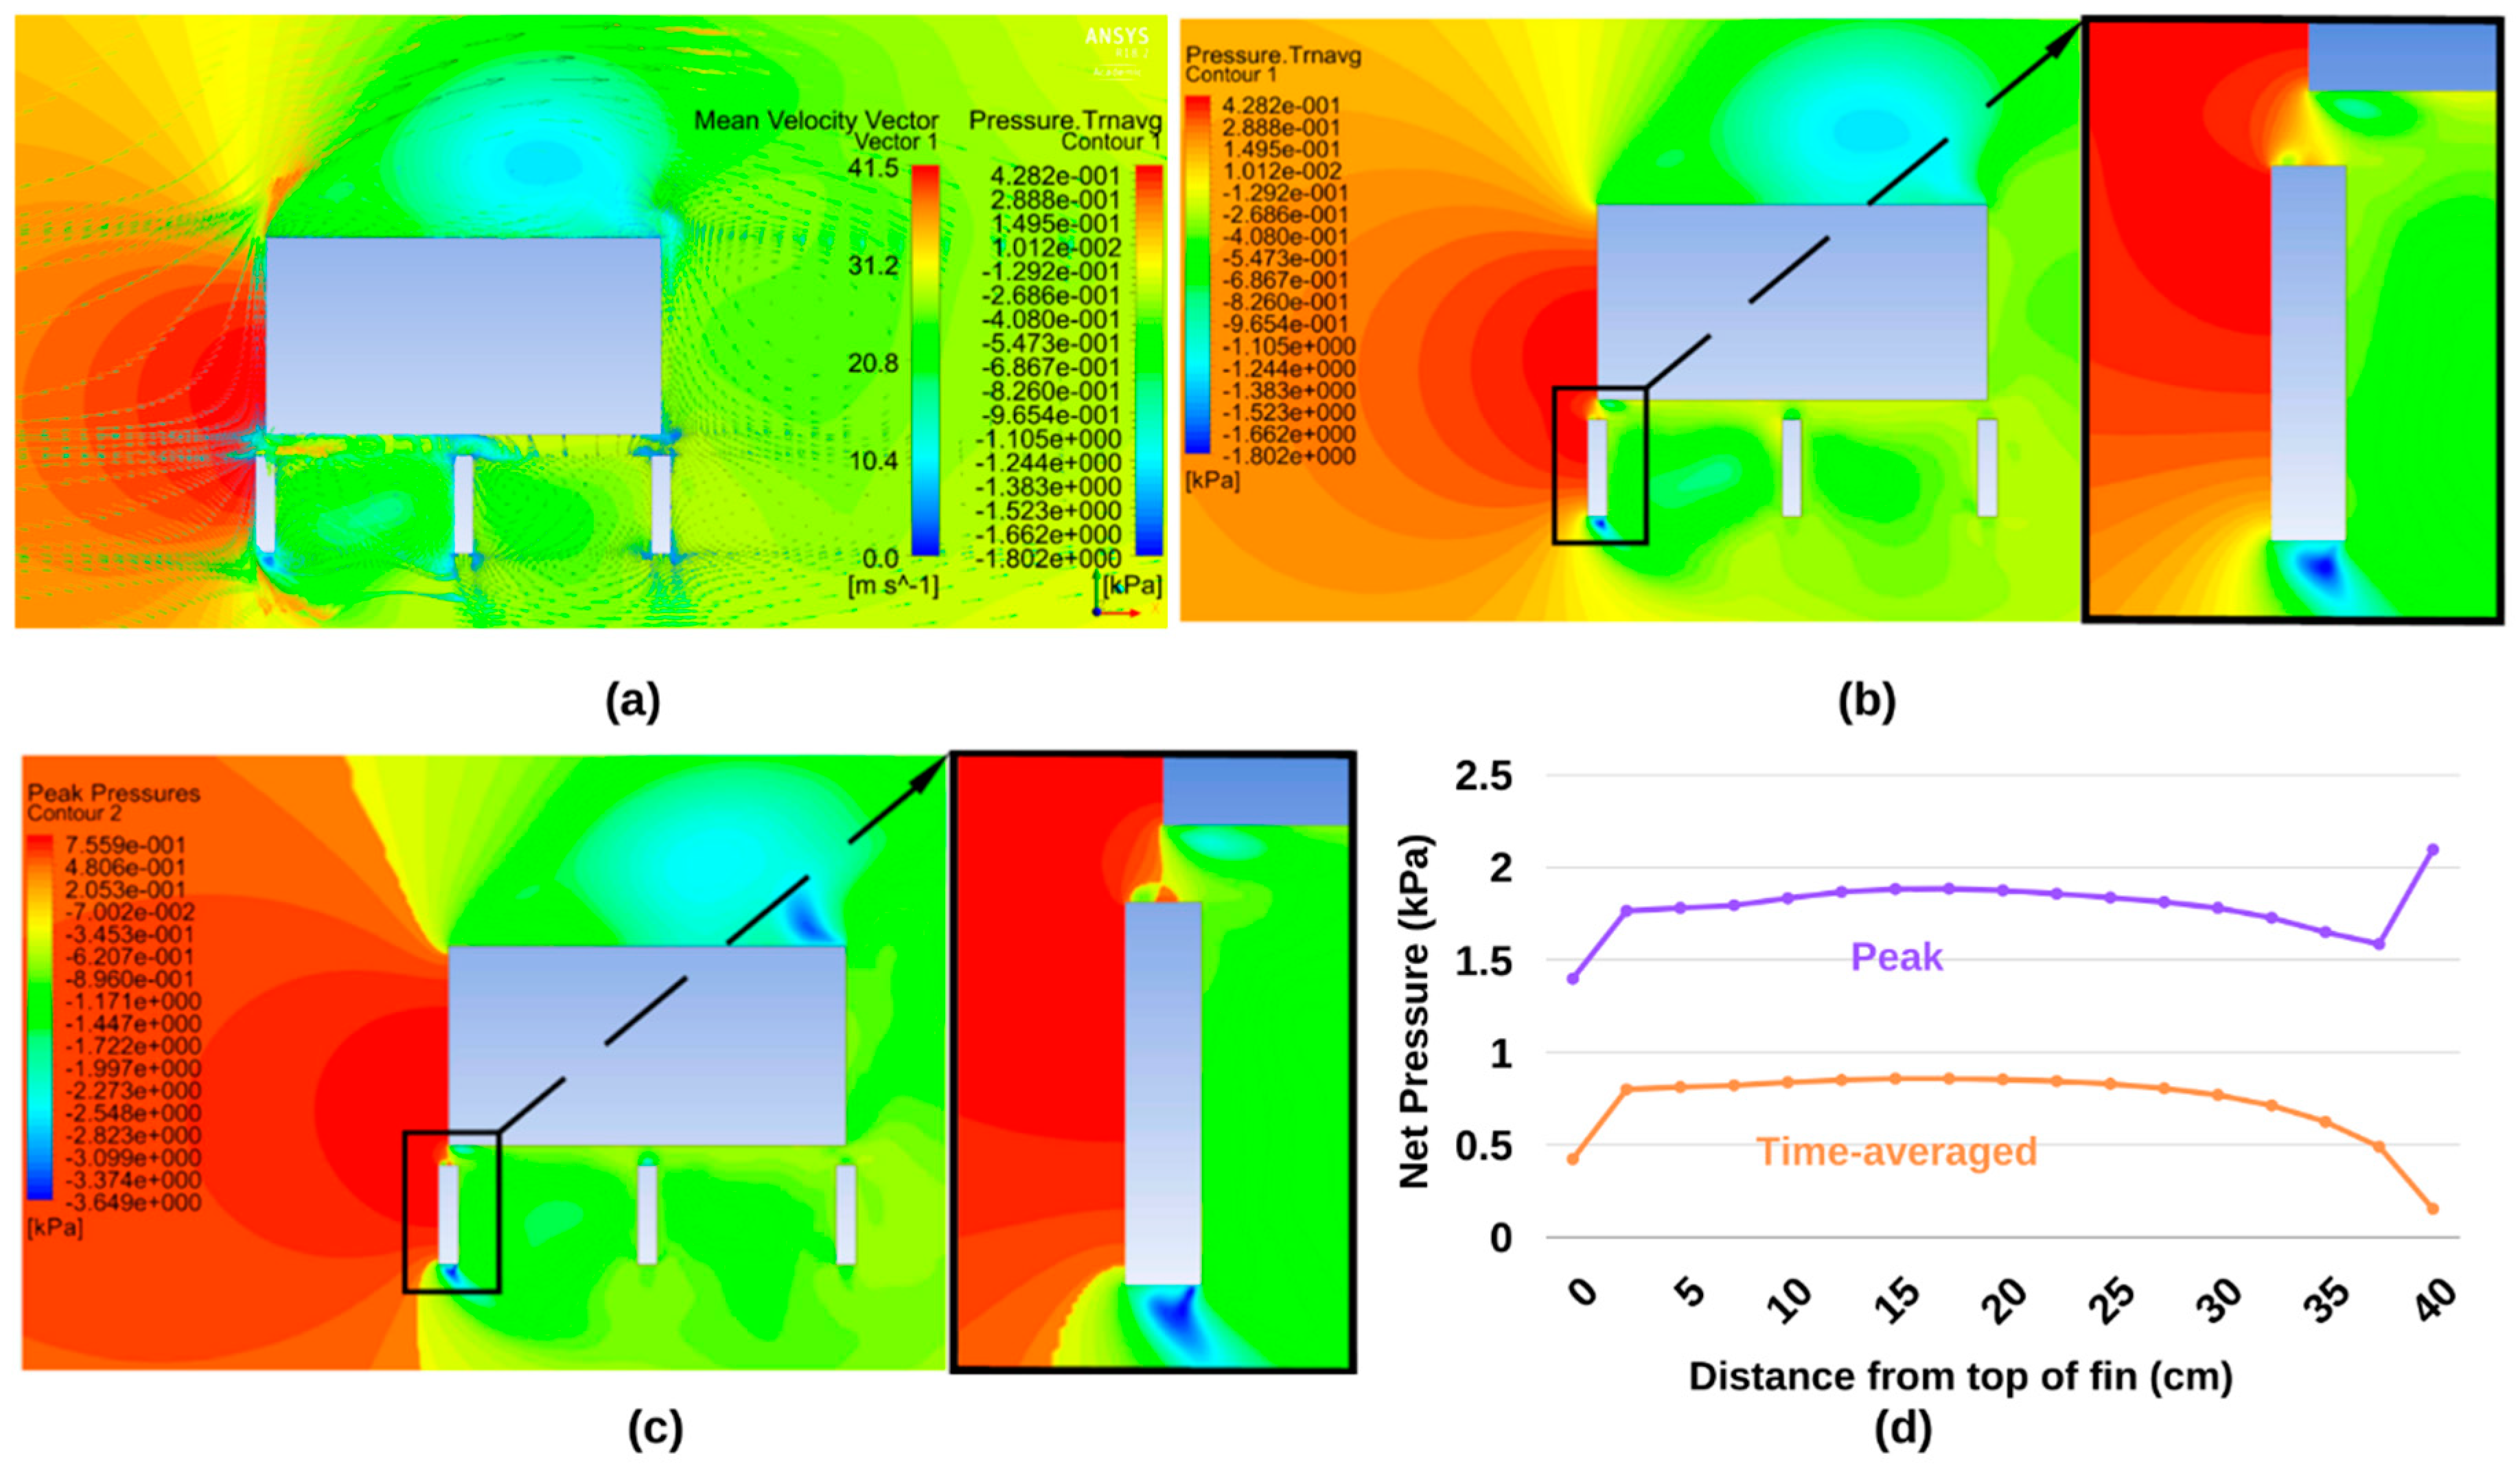
The average wind pressure distribution and wind flow behavior were captured for a period of three residence times, equal to 2.52 s (Figure 9). At the building’s upper left corner, wind speed is accelerated by 67% percent, from 24.9 m/s to 41.5 m/s, causing flow separation over the building’s length. The flow then recirculates at the rear of the building, with suction arising toward the top right corner of the building as part of maintaining a continuity of air surrounding the building. This behavior is typical of bluff bodies.
The situation was more complex in the lower half of the structure where the building interacts with the façade. Flow separation was most obvious at the bottom edge of the leading fin (in plan-view), compared with the fins that it shelters from oncoming wind. Wind speeds increase significantly at this location, as well as between the underside of the building and the top edge of the leading fin. This junction between façade and building represents a contraction in the flow, where the increased rate of airflow is accompanied by a drop in pressure, termed the Venturi Effect, evident in Figure 9b. Over time, vortex shedding is most apparent at the top right corner of the building and the bottom edge of the leading fin.
The critical fin was determined to be the leading fin. It is exposed to oncoming wind without the sheltering effect seen for both the inner fin and the end fin. The greater the combination of windward pressure and leeward suction, the greater the magnitude of net pressure. As a result, the critical fin undergoes the greatest stress within the façade. It also imposes the most significant bending moment with respect to its support bracket, as well as the building itself.
Strong negative pressure at the critical fin’s bottom end causes pressure to build toward the top of the fin. A smaller magnitude suction occurs at the fin’s top end. Vortex shedding is apparent in both of these negative regions. The leeward face tends to have an increase in magnitude of suction with distance from the top of the fin. This implies the suction arising from maintaining the continuity of airflow on the other side of the fin, places a greater drop in pressure on the leeward face, compared to the fin’s top edge where high velocity wind is squeezed across a narrow 80 mm gap. The lack of stability associated with the solution for the fin corners places greater uncertainty on the accuracy of the larger values derived at these locations.
The contour plot for peak pressures represented in Figure 9c describes the condition where, with 95% probability, pressure and suction will not be exceeded. The analysis correlates with the event of highest windward pressure directly leading to maximum leeward suction. The peak values indicate that the time-averaged case significantly underestimates the pressures in the event of extreme loading (Figure 9d). The variability of the wind flow within the transient analysis is, therefore, addressed and highlights the difficulties that arise in turbulent fluid dynamics.
The peak pressures acting on windward and leeward faces are of a similar profile to the time-averaged case. At the critical fin, the magnitude of pressures increases, with its overall wind load more than doubling. The lever-arm distance between the bracket and fin is similar to that calculated as part of a time-averaged analysis and is located at the approximate center of the fin in both cases.

4.2. Results for Geometry No. 5 (g = 160 mm d = 560 mm)

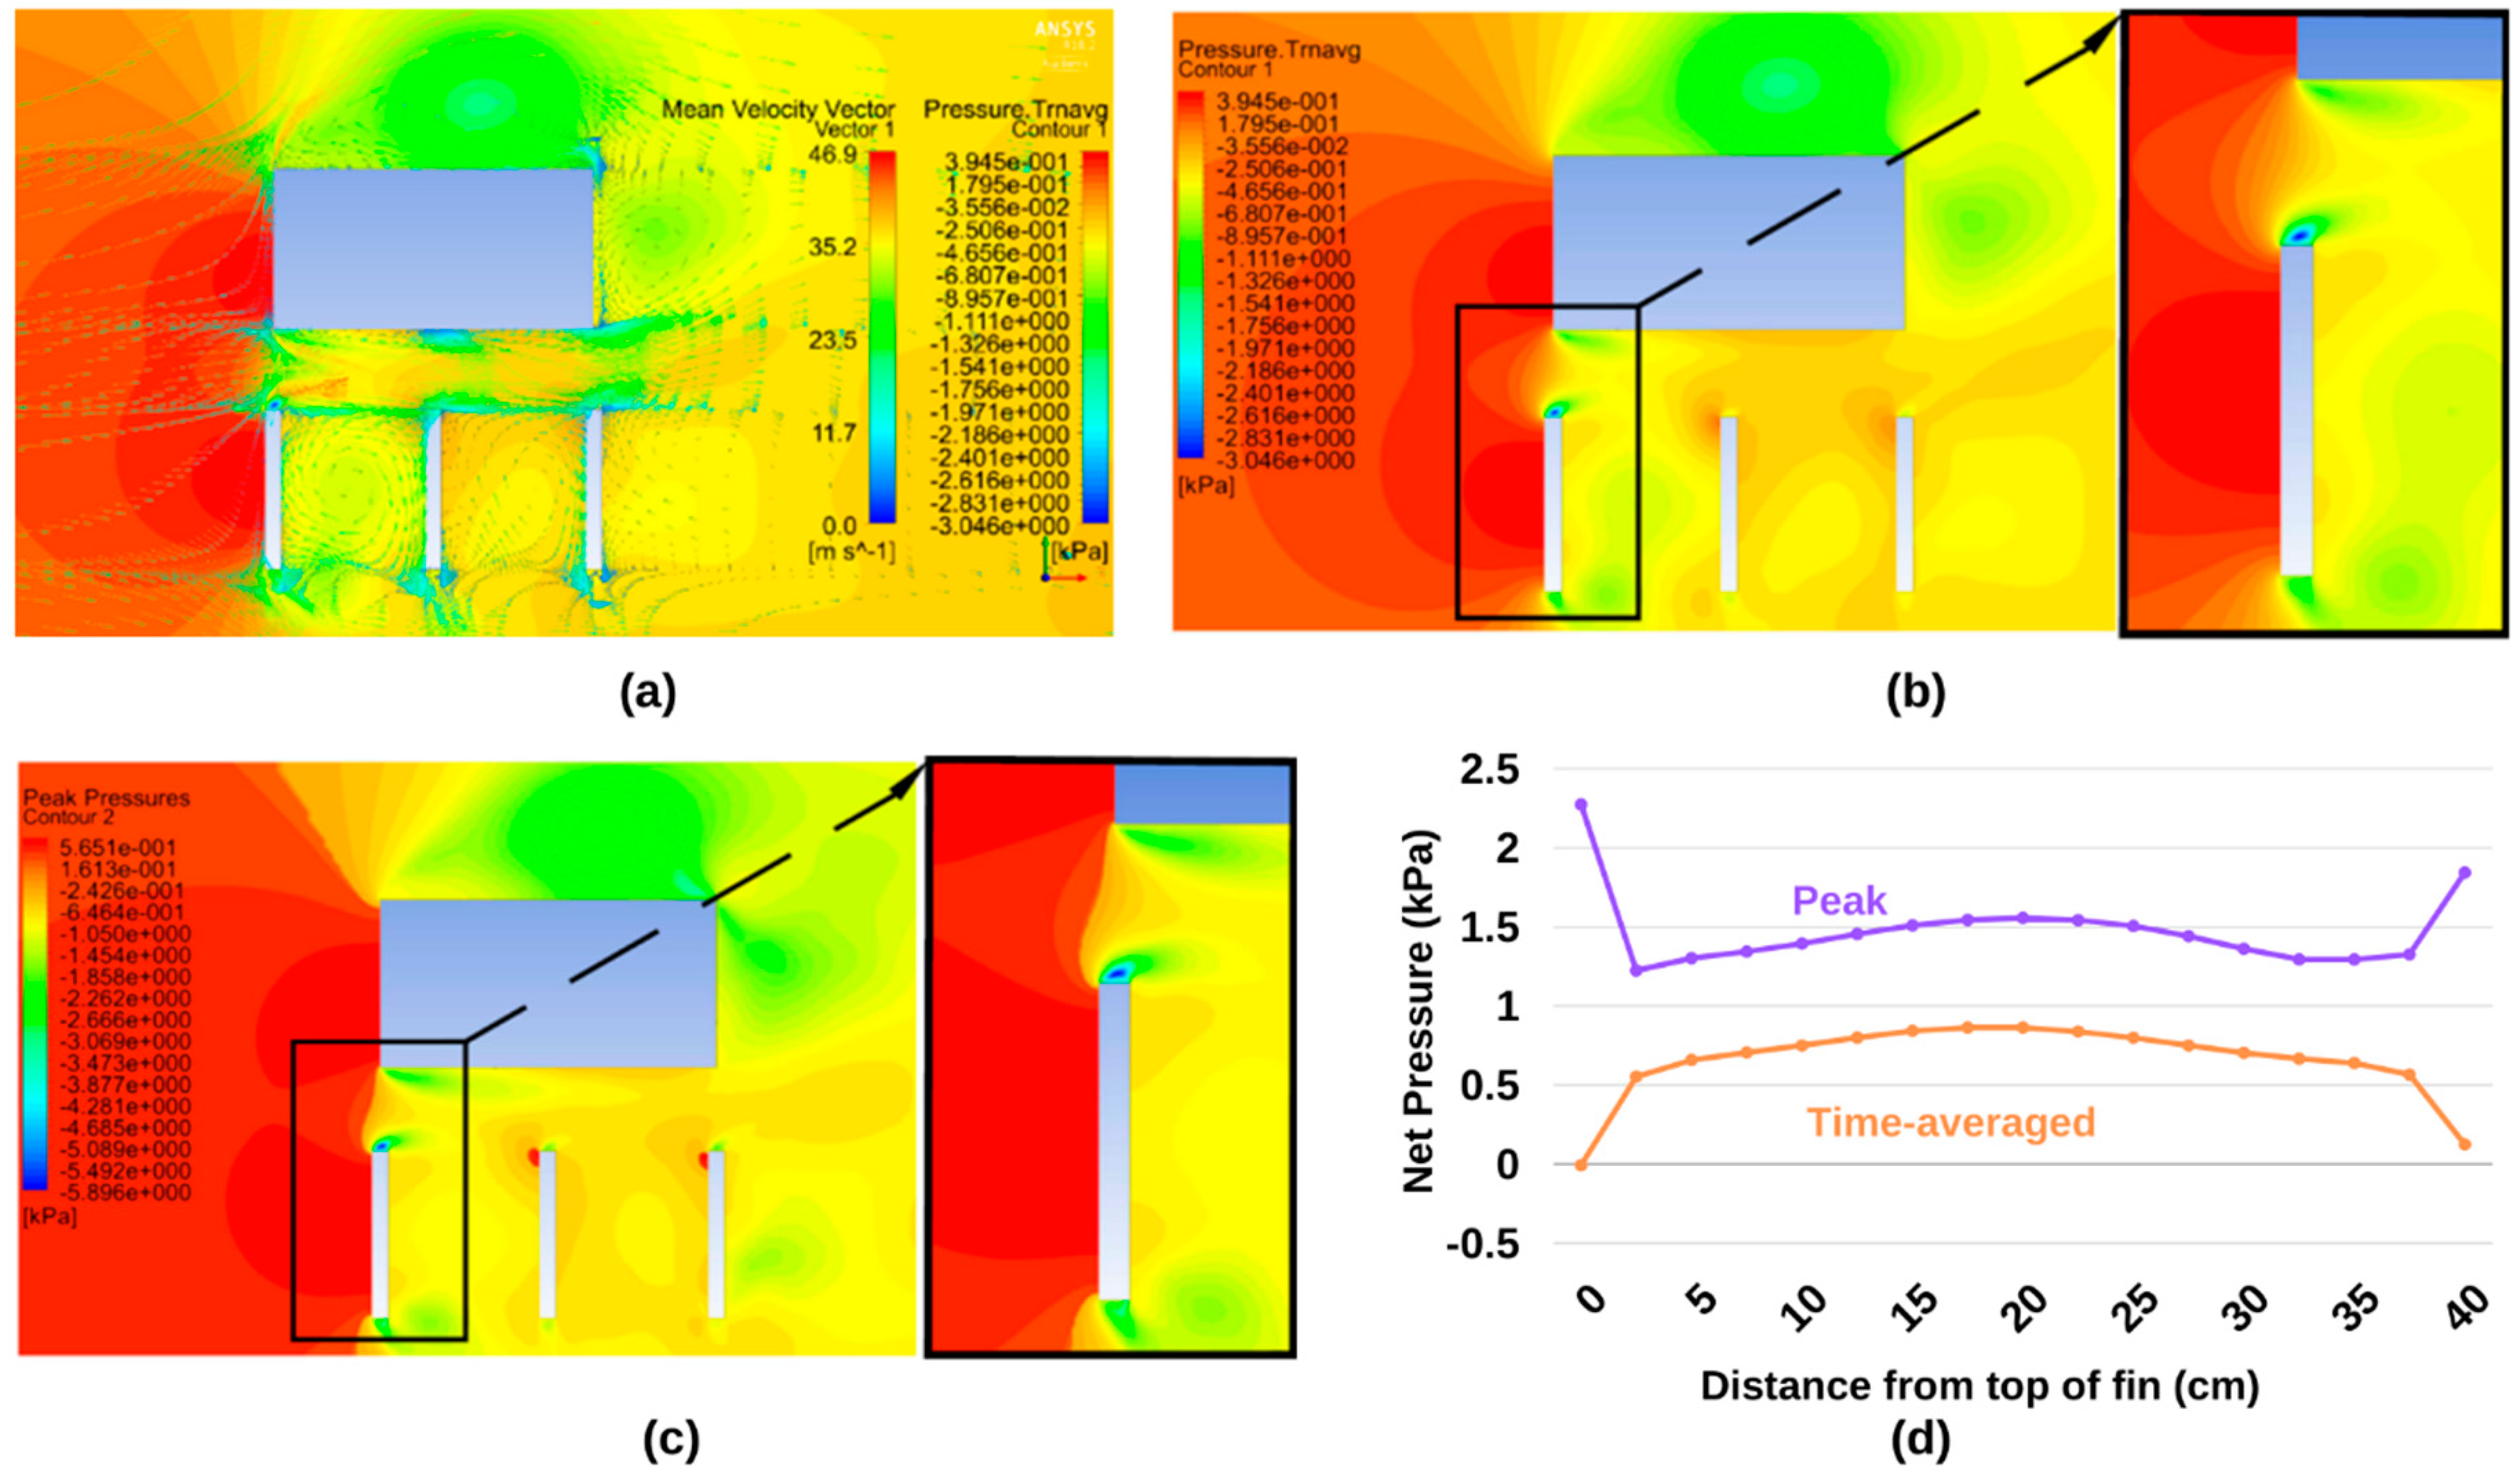
In Figure 10a, the wind flow behavior is typical of that for turbulent flow around bluff-bodies. Regions of flow separation develop as wind is accelerated by over 78% (from a mean speed of 24 m/s to 44.4 m/s) where oncoming air first contacts the corners of structure. This generates regions of strong negative pressure at sides of the building and fins parallel to the direction of the flow. Recirculation is also apparent as wind at the rear of the building tends to reverse direction, against the trajectory of mean flow. Vortex shedding occurs in areas close to corner regions throughout. These rotational eddies of low pressure develop while attached to the fins, before being transported away from the structure when of sufficient size.
The critical fin was established as the leading fin. Within this façade arrangement, the leading fin encounters the highest net pressures due to more significant windward pressure and leeward suction compared to the sheltered fins. As can be seen in Figure 10b, time-averaged pressures indicate the tendency of windward pressure to be at its maximum toward the top of the fin due to the high level of suction at the bottom edge. In turn, leeward suction is at its maximum magnitude at the base of the fin, decreasing from this point before increasing gradually at the top of the fin. From comparing the bottom and top ends in Figure 10b, it is apparent that constricting flow leads to a complex redistribution of pressure between the top end of the fin and the building that minimizes the magnitude of suction along this narrow width of the fin.
The contour plot for peak pressures represented in Figure 10c describes the condition where, with 95% probability, pressure and suction will not be exceeded. The profile for windward and leeward pressure are like the time-average case. This means that the shape of the net pressure distributions in Figure 10d are also similar. Wind load between the time-averaged case and the peak pressure values on the critical fin is increased by, approximately, 2.1 times in terms of force per meter height of the fin and 2.14 times higher for moments acting at the bracket connection. The lever arm—for moments—is approximately at the midpoint of the fin’s length with its position for the peak pressures case being fractionally closer to the bottom end of the fin than for time-averaged forces and pressures.

4.3. Results for Geometry No. 11 (g = 0 mm d = 800 mm)

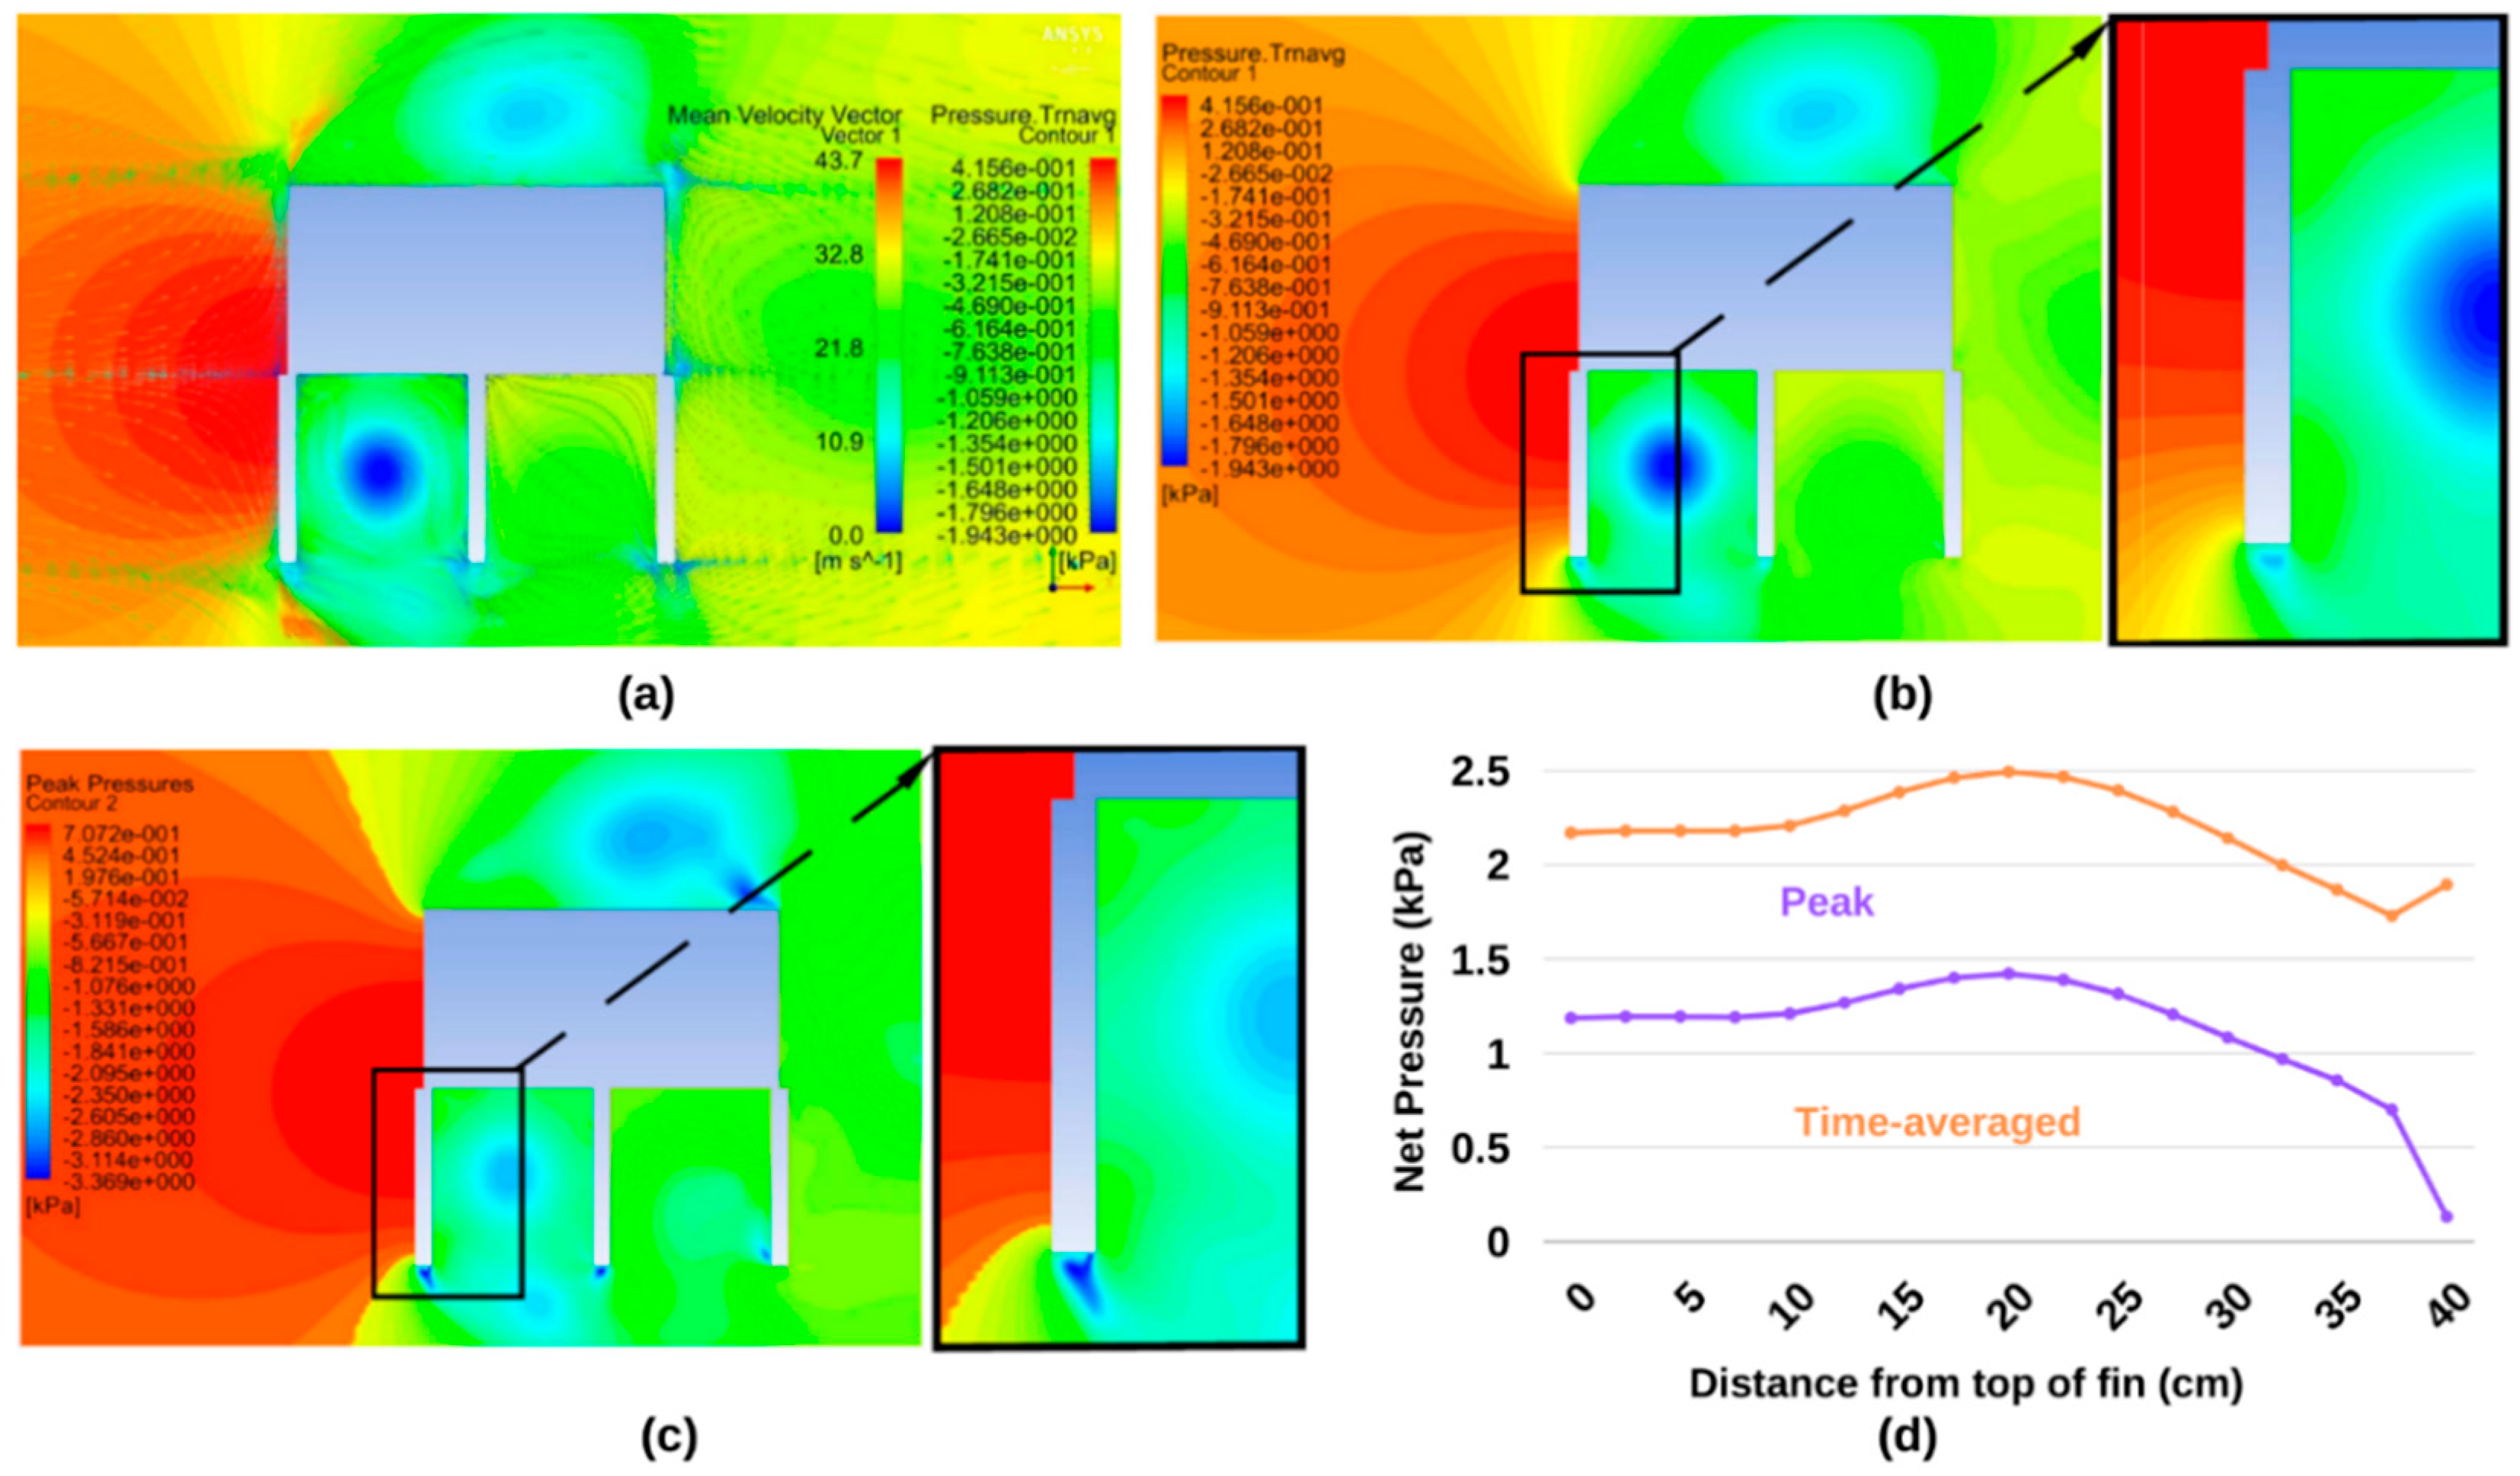
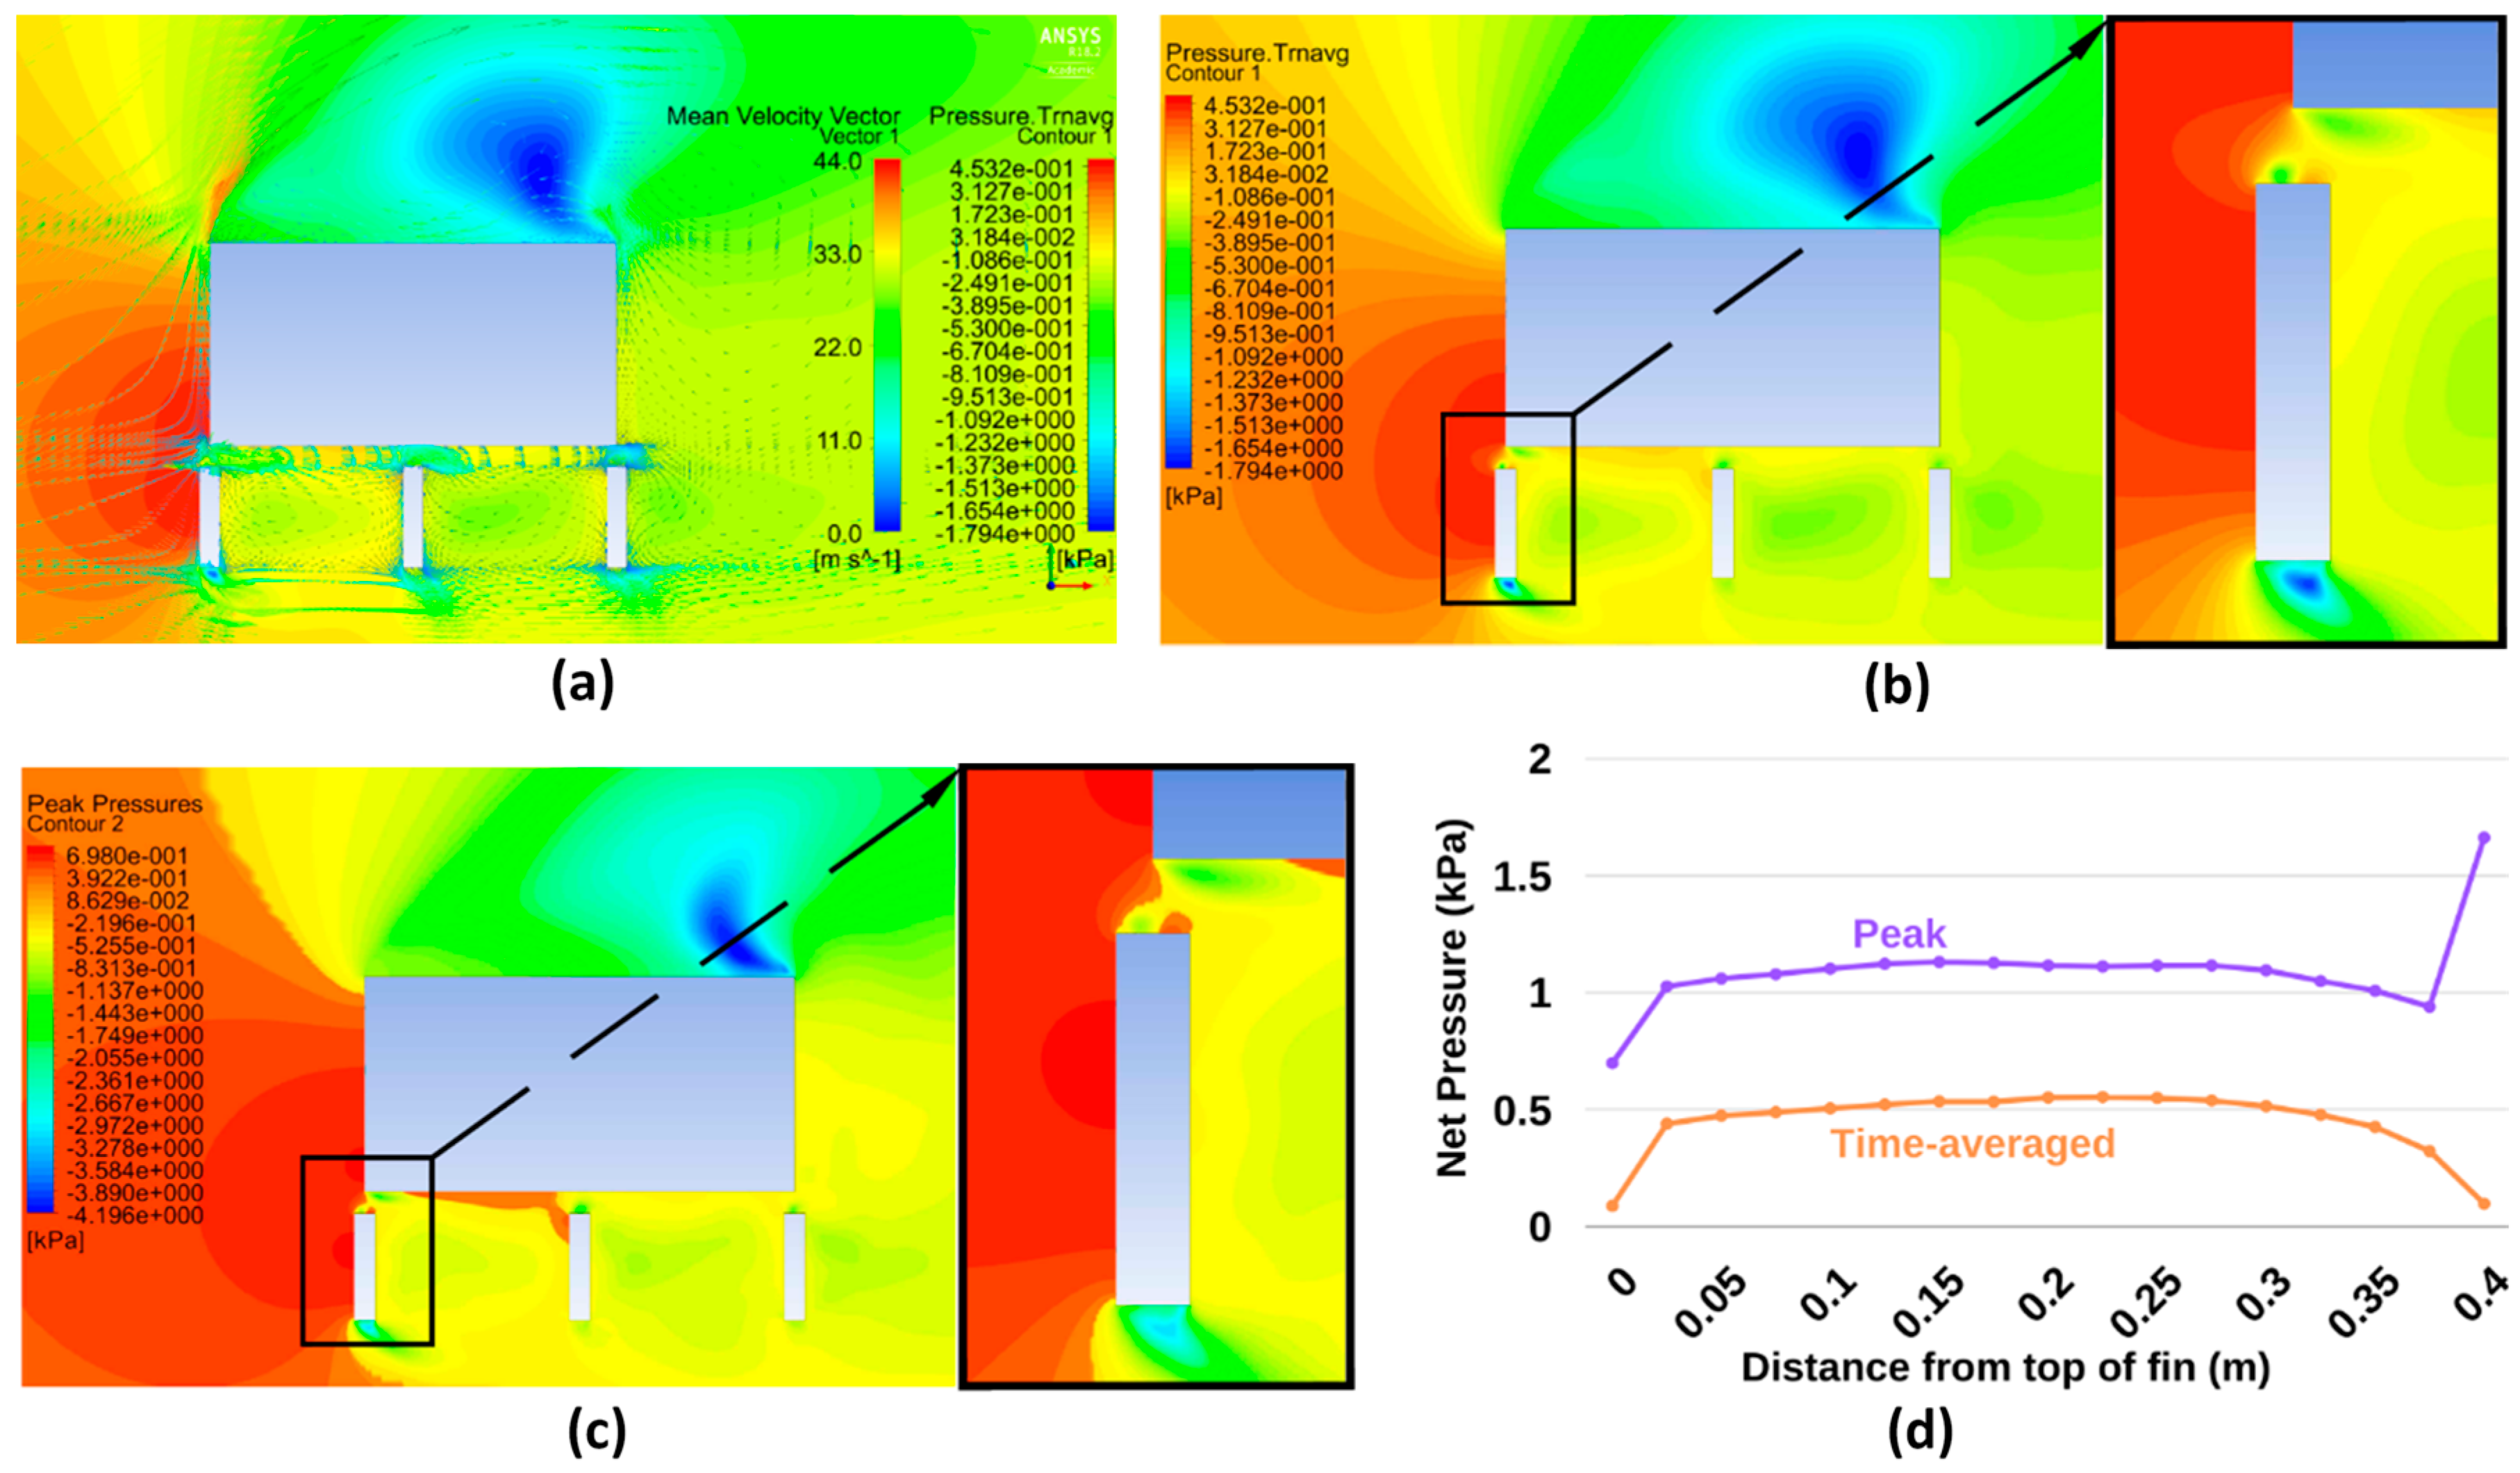
The wind flow behavior, where fins are attached directly to the building is significantly different from modeling with bracket length represented as an opening between the structure and the fins. Wind speed gathers greater momentum at the lower portion of the model recirculating air at the downstream side of the structure is more uniform (Figure 11a). More intense areas of suction form in the spaces between the fins. Overall windspeeds have an average increase of 76% (from 24.9 m/s to 43.7 m/s) through corner acceleration and flow separation. Vortex shedding remains apparent at corner locations.
The net pressures are at a maximum for the leading fin and it is therefore critical in terms of façade design. For this geometry, the leading fin features a nook where windward pressure tends to build-up to a value much higher than when a gap is provided (Figure 11b). At the opposite point on the leeward face, wind tends to stagnate. These two conditions amplify pressures for both the time-averaged and peak pressure cases. As a result, for wind acting at 0° to the horizontal, this represents the least efficient design for façade geometry.
Peak pressure contours are plotted in Figure 11c with values for wind pressures at the critical fin. Force has a peak value of 1.764 kN/m with its lever arm occurring at 0.25 m. As is reflected in the time-averaged case, the lever arm tends to be nearer to the top end of the fin, with net pressures tending to diminish towards the projected end of the fin (Figure 11d). Despite its relatively short lever arm, the peak moment is 0.444 kNm/m, 2.06 times greater than for values averaged across time.

4.4. Results for Geometry No. 13 (g = 400 mm d = 800 mm)

This façade configuration contains the longest fin and the largest spacing between the fin and the building. Interaction between the building and the fins is therefore minimized. The situation leads to increased wind speeds from corner acceleration. The mean wind speed 24.9 m/s is amplified by up to 89%, to 46.9 m/s for these regions. As before, separating flow is prominent over the upper portion of the building and beneath the fins (Figure 12a). Recirculation is apparent from the direction of mean velocity vectors, in the wake of the structure, in Figure 12a. Vortex shedding occurs predominantly in corner zones.
With the sheltering effect still apparent, the leading fin remained the critical design case. The Venturi Effect was of secondary importance to flow conditions around the fins. The enhanced levels of circulating air around the fins can be seen to induce greater suction at the top end of the leading fin (Figure 12b). This led to a more efficient distribution of suction pressures across the leeward side of the fin, with values reducing towards the outer face of the fin.
The peak values represented graphically in Figure 12c highlight both the efficiency and drawbacks of the design. Across the member average, the net pressure equated to 1.48 kPa, which is a reduction of over 30% compared to for the same fin length without a gap. While this a significant contrast, the moment that is a result of these pressures is the worst of any design sampled at 0.459 kNm/m, when the lever arm is positioned almost precisely at the midpoint of the critical fin. The net pressure profiles are shown to be similar for both the time-averaged and peak pressure cases in Figure 12d.

4.5. Results for Geometry No. 14 (g = 80 mm d = 400 mm)

Façade elements are considered to be unsheltered when the wind is orientated to act equally on each fin. The angle for this wind direction is based on the ratio of fin length to fin spacing. For this geometry, the angle (θ) equals 29.1°. This geometry consists of the smallest bracket length and fin size, and has among the highest wind load of façades containing a bracket. Therefore, the effect of wind direction is of particular interest for this configuration.
Comparing Figure 13a with the previous sheltered case (Figure 9a), indicates greater suction at the upper right corner of the building. This implies that the negative pressures are no longer singularly caused by flow separation but also due to a shift in the continuity of the flow. Recirculation has also been shifted up towards this region along the building’s width. The speed of airflow between the building and the fins tends to accelerate but to a lesser extent compared with the sheltered case. Corner acceleration is seen to increase mean wind speeds from 24.9 m/s to 44 m/s, however this is largely confined to the building’s upper left edge. Vortex shedding is associated with corner locations.
The critical fin was again determined to be the leading fin (Figure 13b). The influence of increased windward pressure on the previously sheltered fins resulted in a reduction in the magnitude of average suction seen previously in Figure 9b. As a result, net pressures were largest for the leading fin. Windward pressure has a reduced magnitude, with velocity components parallel to the fin’s length not contributing to the wind load. Overall, the loading for time-averaged pressures was significantly reduced compared with the sheltered case.
Peak pressures are represented in Figure 13c. Peak wind loading was 0.434 kN/m compared to 0.717 kN/m when wind was at 0° to the horizontal. The peak moment from the fin acting onto the bracket connection was also reduced from 0.172 kNm/m to 0.106 kNm/m (the lowest value sampled). However, despite the change of wind direction, there was little change in lever arm, position with a shift of approximately 4 mm further from the bracket. Peak net pressures showed a similar profile time-averaged net pressure (Figure 13d).

4.6. Results for Geometry No. 15 (g = 0 mm d = 800 mm)

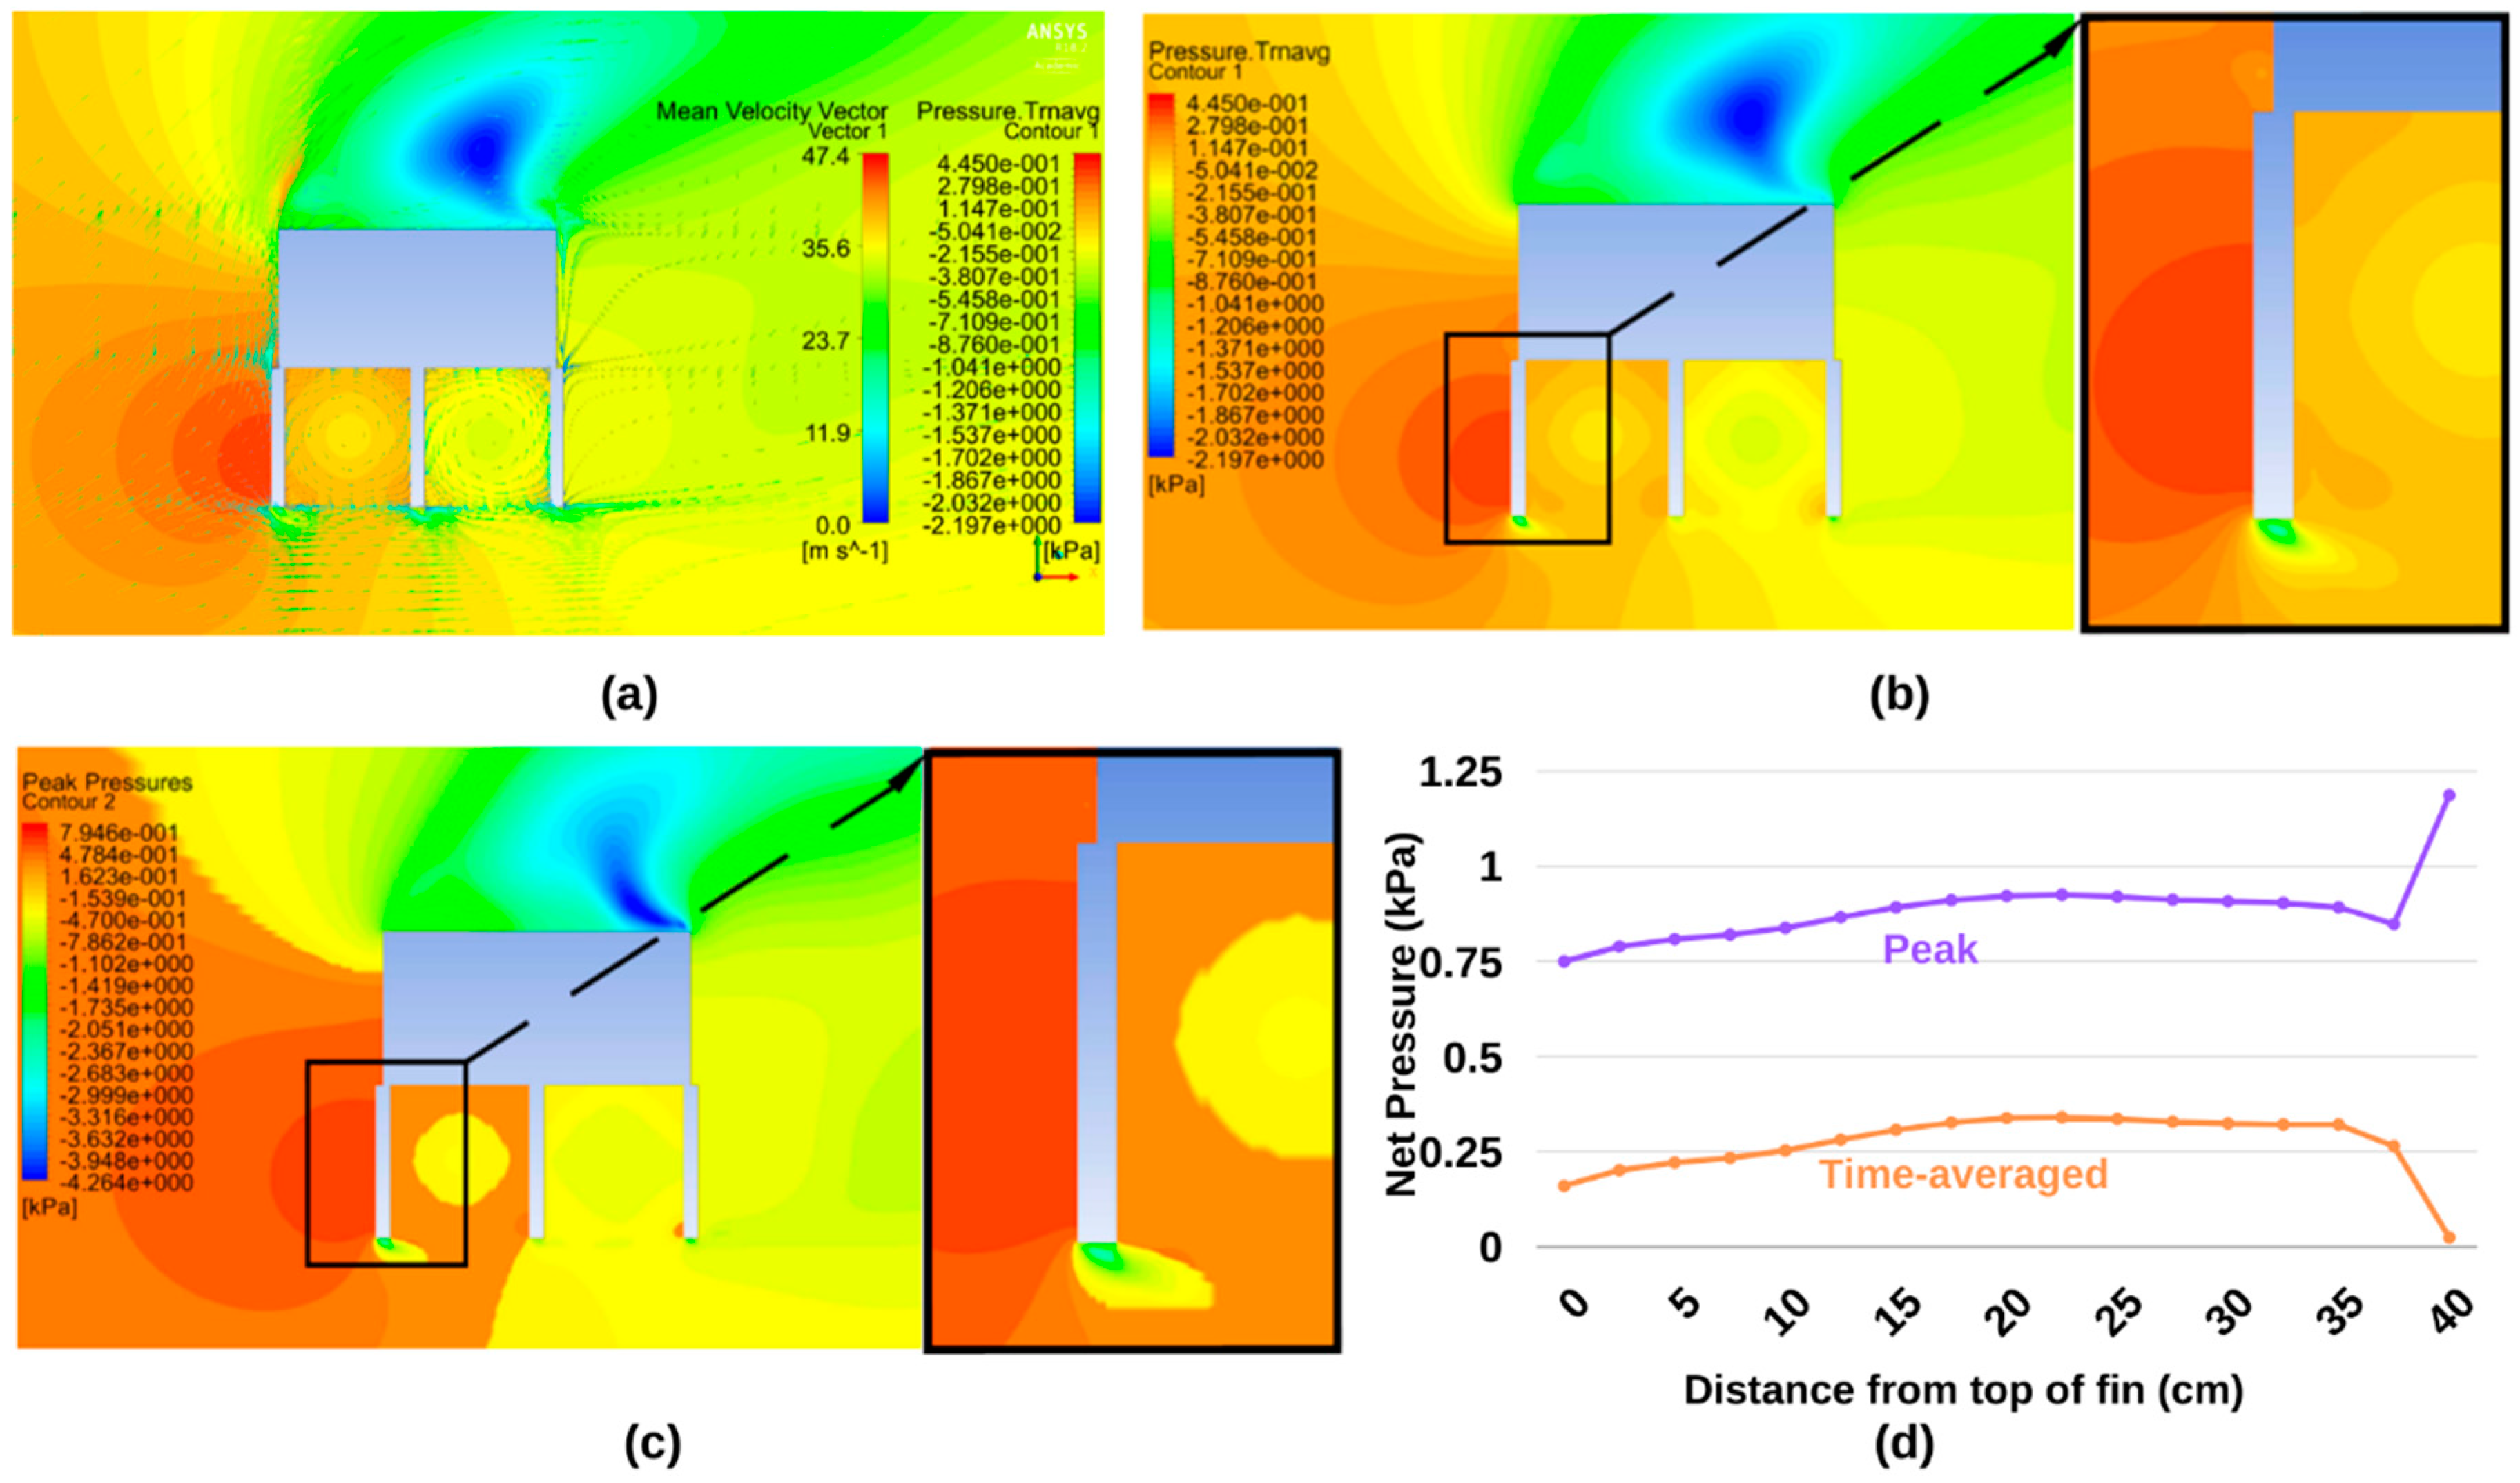
With a combination of high net pressures and overturning moments, the effect of wind direction is of particular interest in this geometry, as the design performed unfavorably in relation to (Geometry No. 13). The direction of the wind was determined from the respective dimensions of fin length at 800 mm and fin spacing to be equal to 720 mm. From these measurements, θ as the angle that the wind acted within the domain equaled 48.0°.
Due to the wake of flow of the wind shifting toward the upper right corner of the building, more significant negative pressure developed at this location to maintain continuity (Figure 14a). Separating flow was also concentrated here, with lower levels of separation occurring at the outermost ends of the fins. Recirculation was most apparent at the leeward side of the structure. Vortex shedding occurred throughout, especially at corners. Corner acceleration caused an increase of over 90% to typical mean wind speed (from 24.9 m/s to 47.4 m/s).
The leading fin was established as the critical fin, due to it developing the highest net pressures within the façade (Figure 14b). However, the situation describing pressures bears little resemblance to the circumstances of Figure 11b, where the leading fin prevents oncoming wind directly entering the bays set out across the fins and the building. Leeward pressure acts on the inner sides of the bays while weak vortex suction occurs approximately midway towards the adjacent fin. In effect, the increased air circulation has alleviated the intense suction seen in Figure 11b.
The peak values (Figure 14c), were of a similar profile to the time-averaged case (see Figure 14d). The value for wind loading where net force is calculated per meter height of the fin was reduced by a factor of approximately 2.5 times (from 1.764 kN/m, in the sheltered case to 0.706 kN/m). Moments were also substantially reduced from 0.444 kNm/m to 0.190 kNm/m by the change in wind direction. The lever arm distance increased 0.252 m to 0.268 m in the peak case because of the steeper wind angle.

5. Discussion and Interpretation

5.1. Sheltered Case

To establish the efficiency of the façade configurations, the effect of the geometry on wind loading was determined. Loading was based on peak net pressures, which represent a conservative estimate of actions on structures. This applies both to the context of structural analysis and the CFD modeling approach here, as improved mesh density converges toward smaller values for peak forces and moments (Table 4). Figure 15 presents peak net pressures for wind acting normal to the critical fin, in each case. Fin length was normalized with net pressure as a percentage from the fin’s upper end. The least efficient design is for the fin attached directly to the building, with relatively high pressures between the fin’s ends. Comparing the use of an 80 mm and a 160 mm bracket length (or gap distance), net pressures were reduced by increasing the space between the building and the fin. Net pressures related to the longest fin with the widest gap at the building has a similar shape compared to the 560 mm long fin with a bracket 160 mm in length, except at the end nearest to the building. This highlights the differences that result from extending the opening on the flow, with relative differences in the Venturi Effect. The phenomenon tends to reduce the magnitude of pressures at the end of the fin, nearest to the building. It is interesting to note the linear variation of pressure near the two ends of the plots. The variation of net pressure was defined in terms of set data points. Data outside these positions was excluded from measurement with the application of linear approximation used to establish values between known data points. The fin ends—where sharp corners are apparent—represent extremes for the analysis, as results indicate a relatively small loading in terms of windward pressure while also tending to have large leeward suction acting at the point furthest from the building structure. Therefore, the profile of net pressure near the ends of the critical fin can appear unlike the remainder of the fin’s length, with the interpolated section no greater than 5 cm long contributing a negligible loss of accuracy.
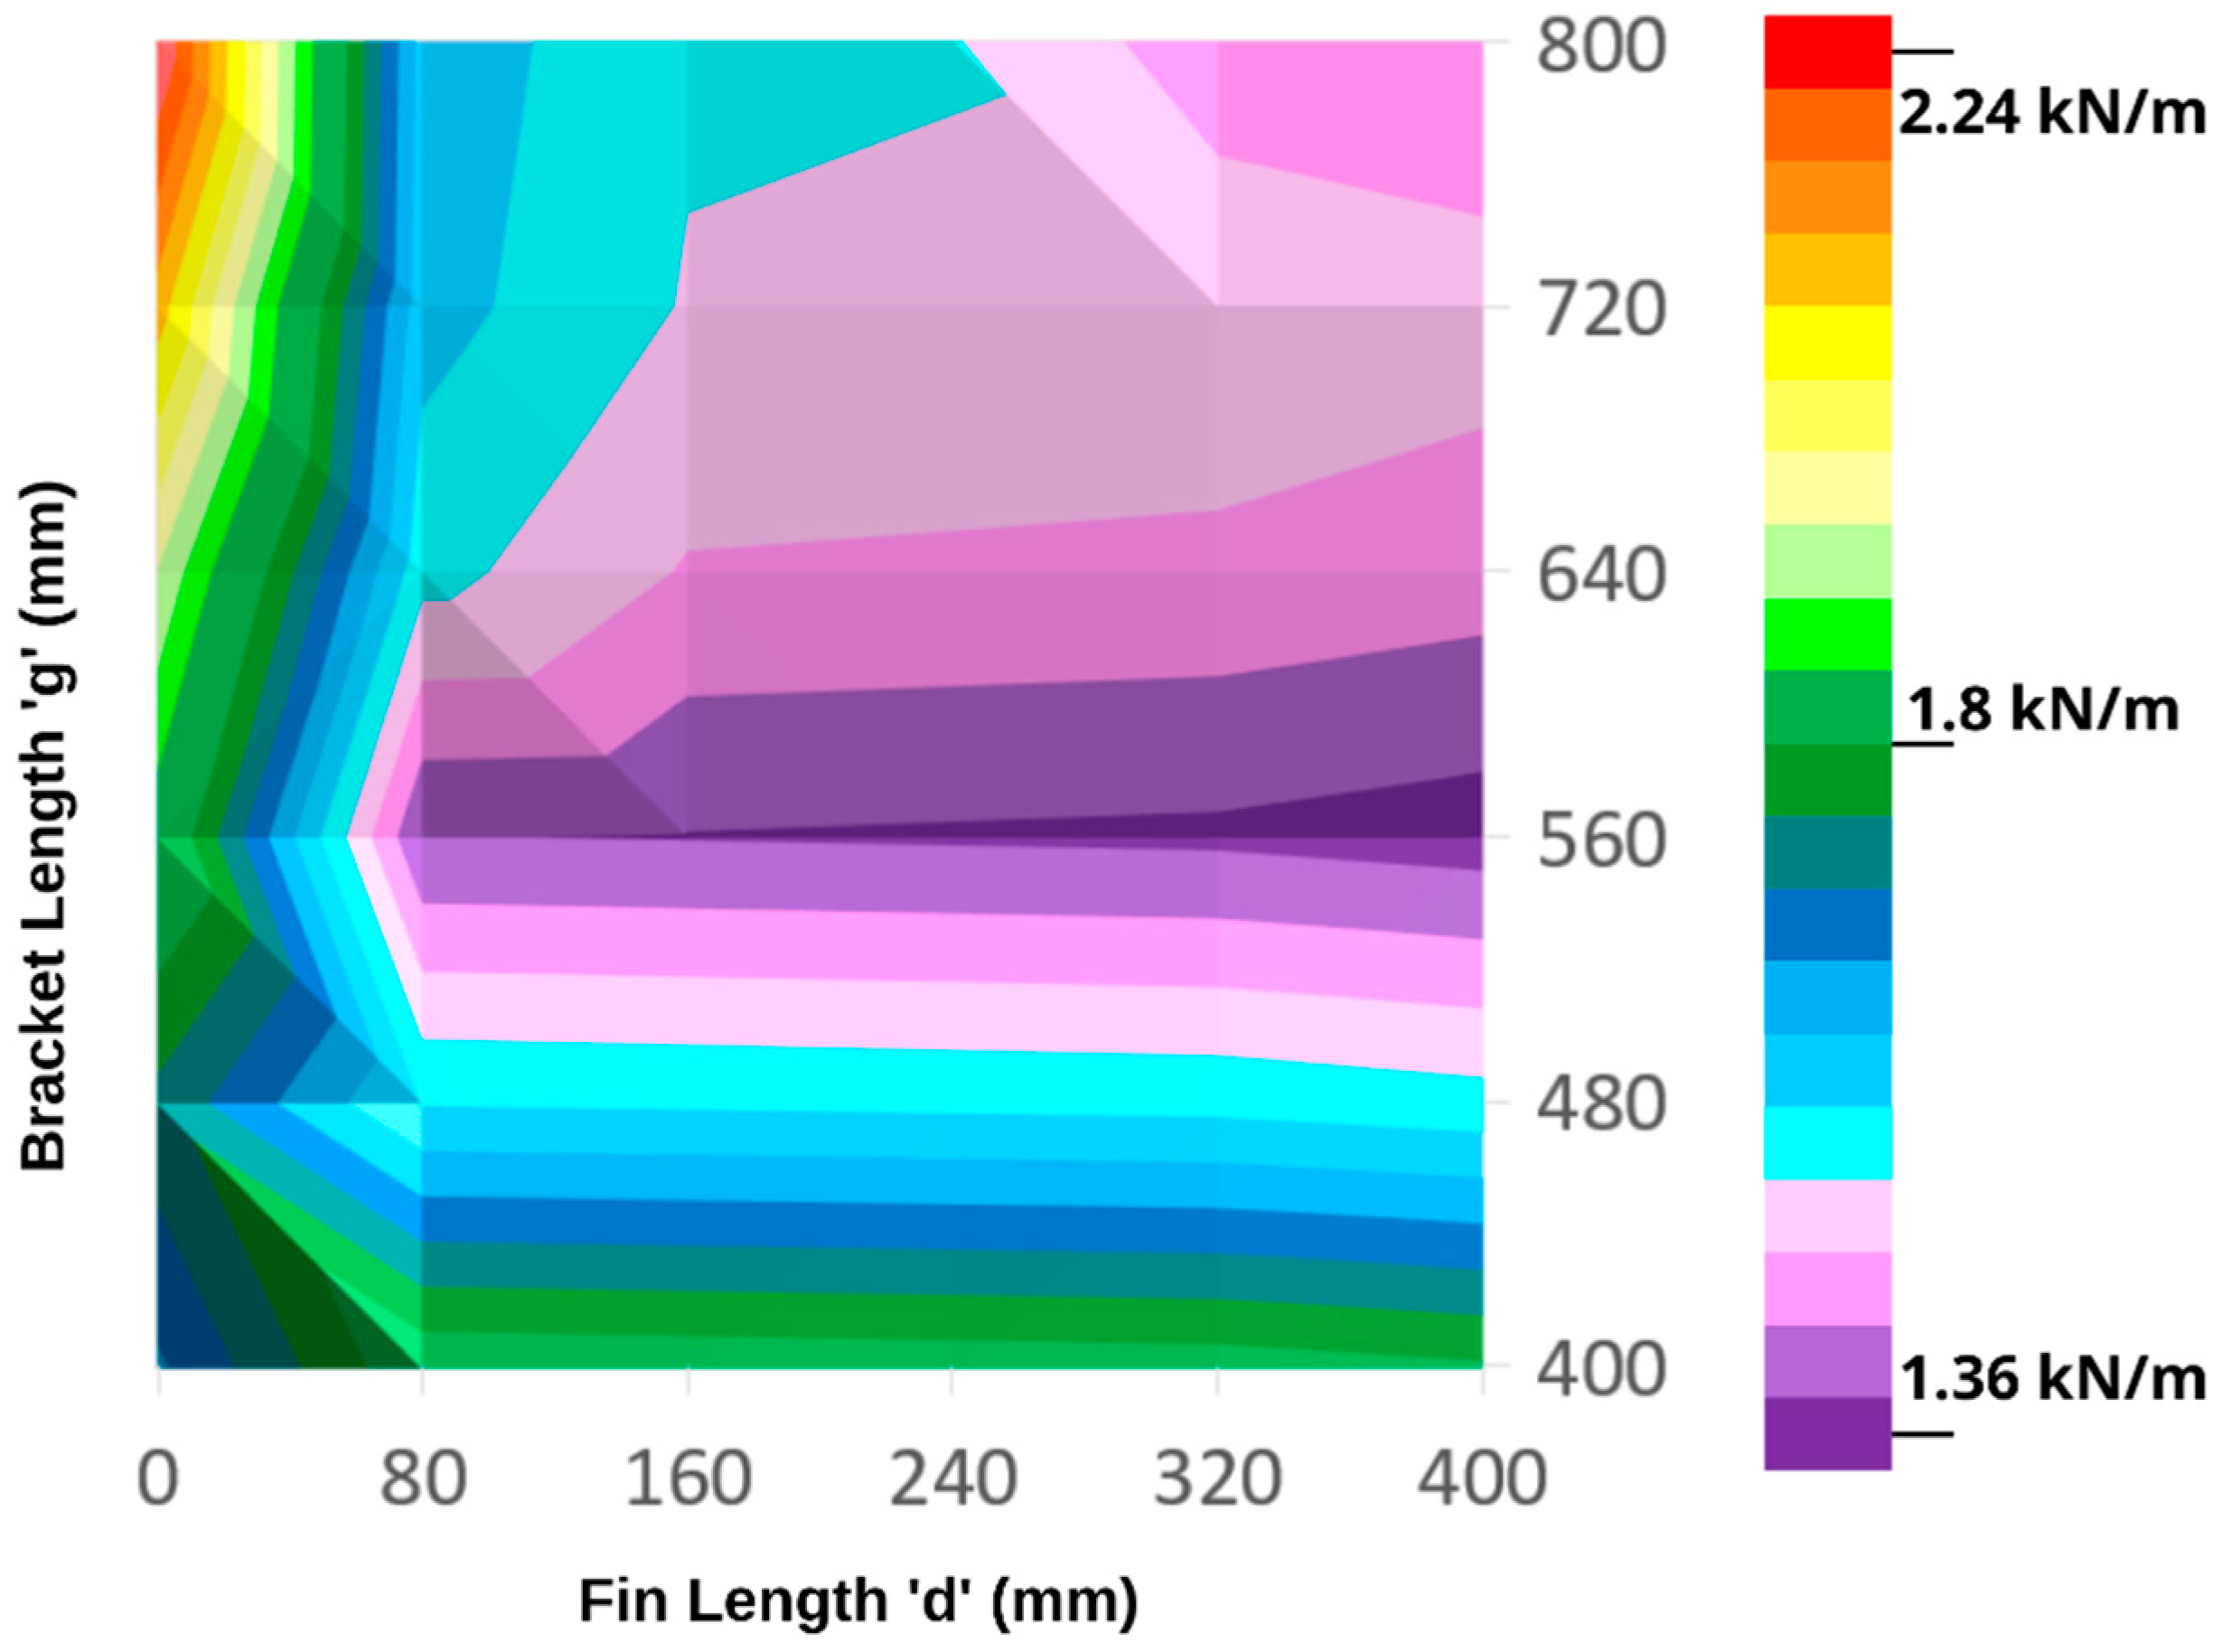
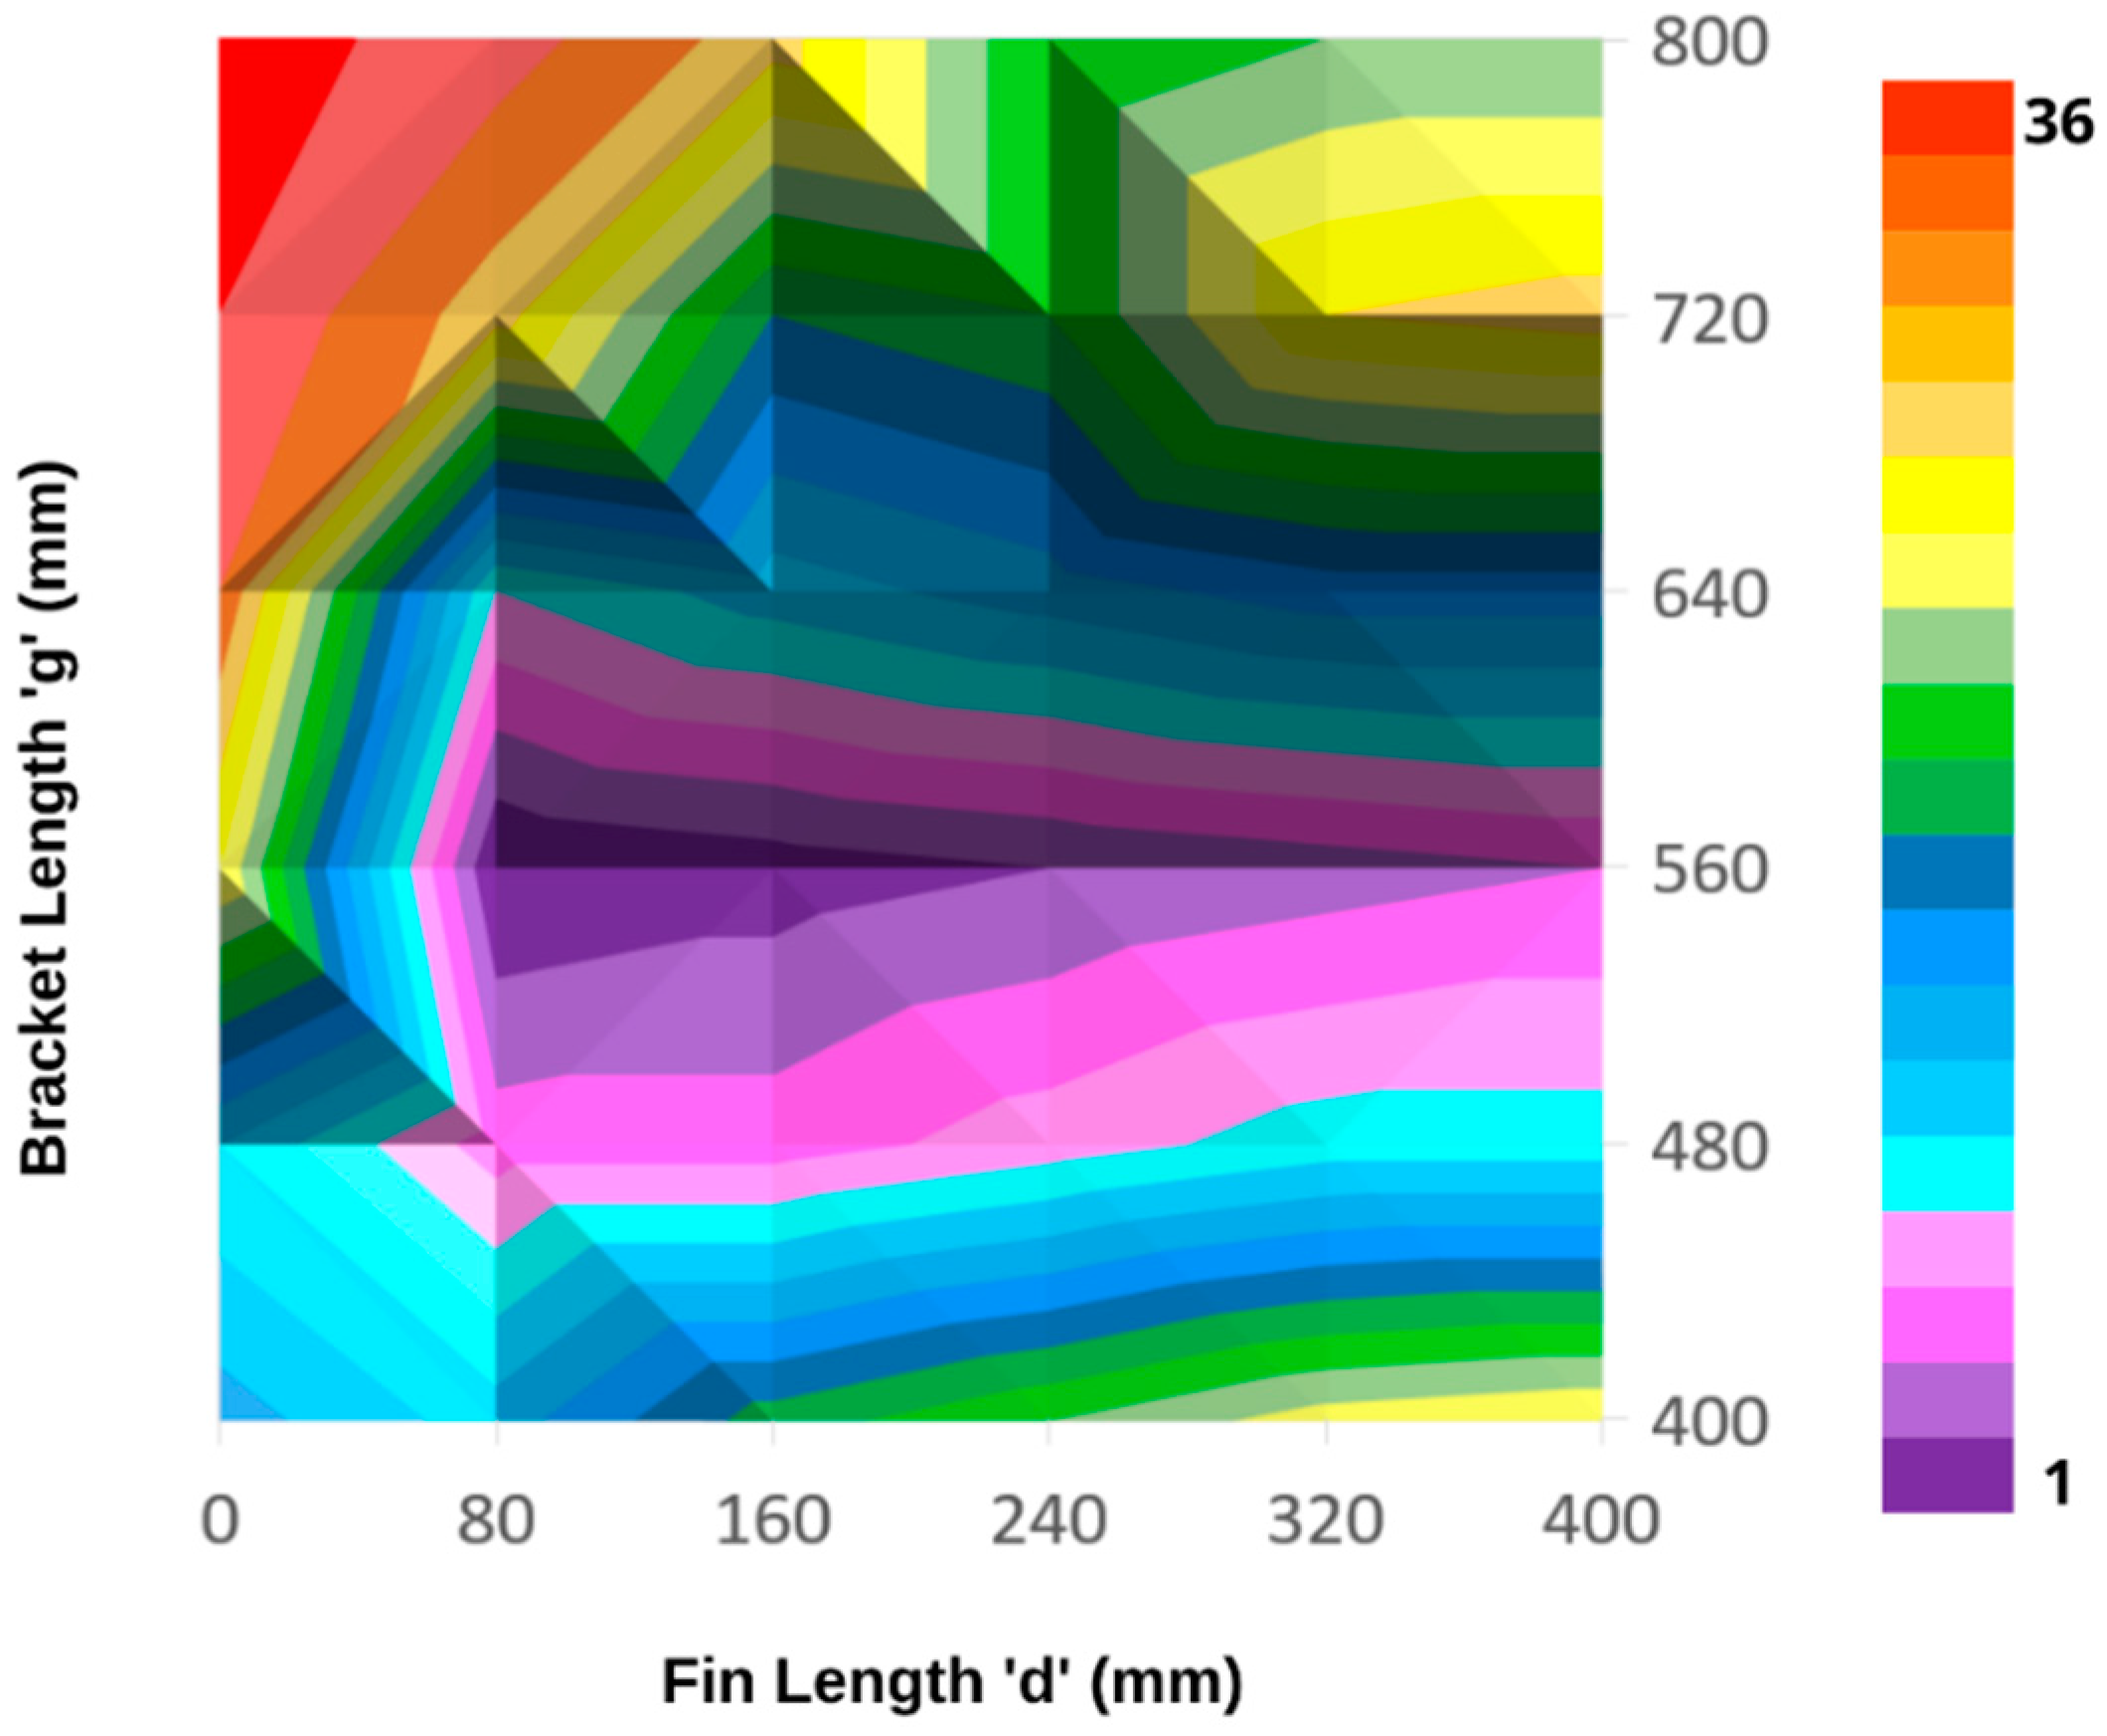
The results of the models form the basis of interpolating values for forces and moments that act throughout the population of façade configurations. Figure 16 defines peak wind loading as force across a normalized 1-m length of fin over a per meter vertical height (in units of kN/m). Wind acts normal to the critical fin in each case. In all cases, the critical fin is established as the leading fin. The significance of this load, from a design perspective, is that it imparts the maximum stress to the fin, facilitating the process of selecting the fin’s material based on its strength properties for the demand imposed. Therefore, the most efficient designs involve minimizing loading that leads to a more economical use of material.
It is apparent that peak force decreases by lengthening the bracket, where the fin length is fixed. The more the flow is constricted with the Venturi Effect, the more intense the continuity induced suction on the leeward face of the fin. As a result, the Venturi Effect tends to increase net pressures over the length of the fin. Stresses reduce as fin length increases between 400 mm and 560 mm, where brackets are employed. Improvements in efficiency of up to 22% are apparent. The wind load is spread more evenly in these cases as the benefits of the Venturi Effect are utilized without the same relative impact on the continuity of the flow—due to better aerodynamic performance. In contrast loading increases with fin length beyond 560 mm, however efficiencies specifically occur with for the longest fins, with brackets at 320 mm and 400 mm.
The practice of attaching the fins directly to the building has an optimal efficiency in cases where the length is 400 mm. However, it is advised to use brackets for fin lengths of greater size, as peak pressures result in high forces acting on the fin. There is also a greater increase in force, with length, than when higher levels of circulation around the fins occur. The optimal arrangement in terms of force is to have a bracket length of 400 mm with a fin length of 560 mm.
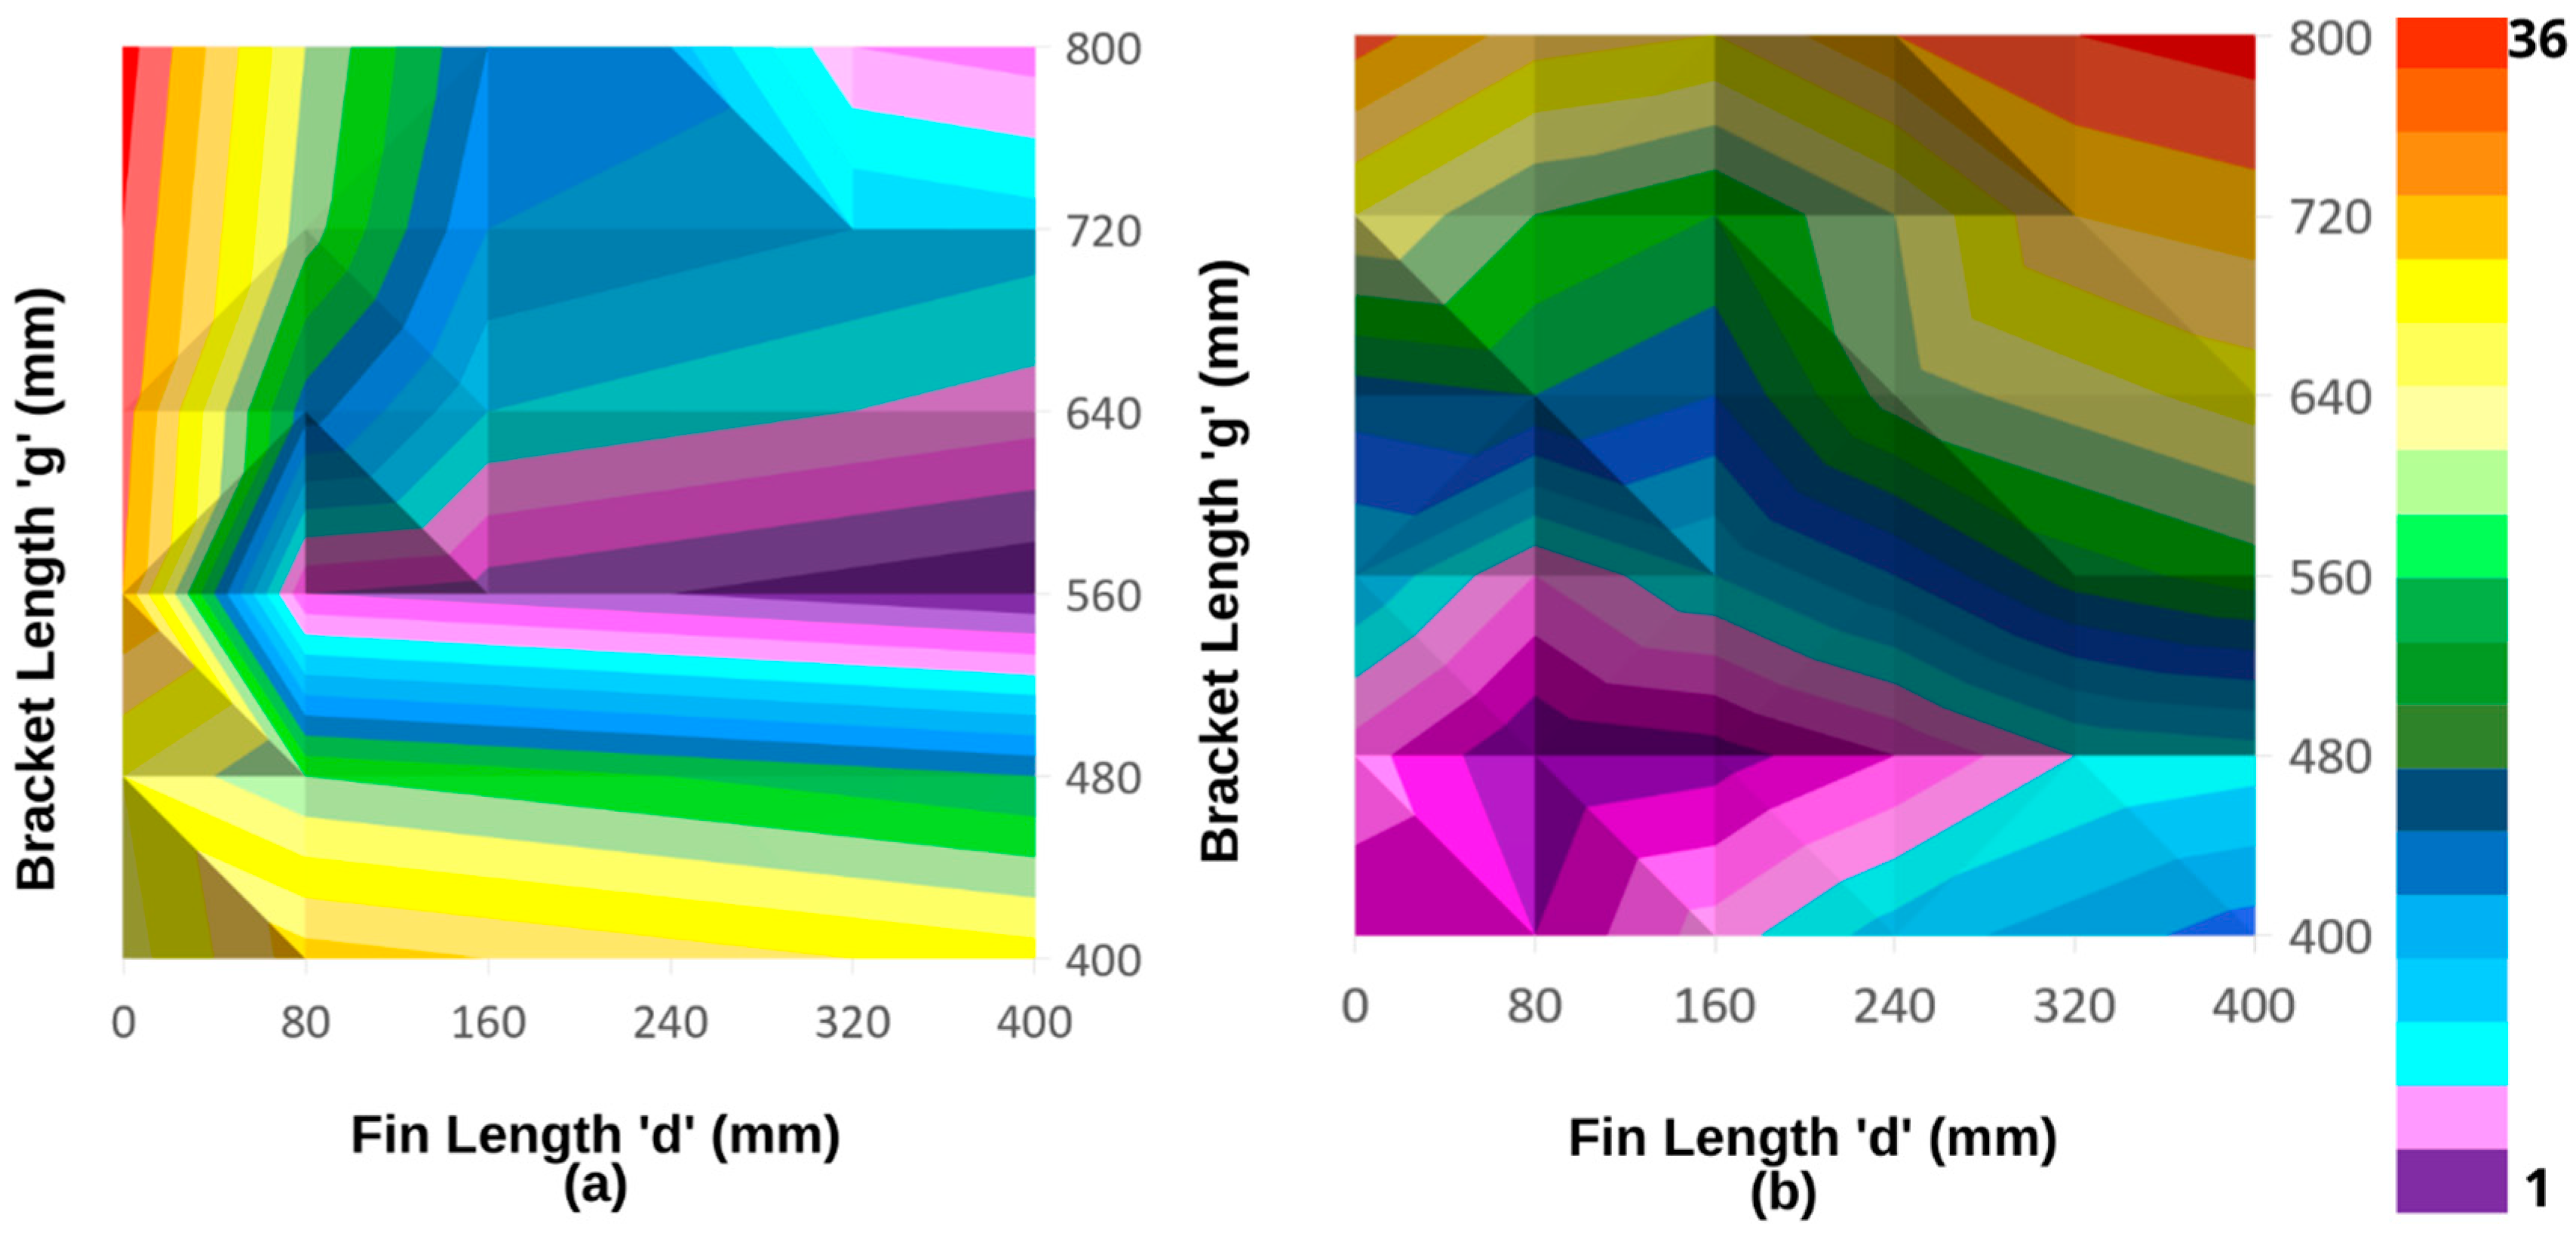
The second measure of façade performance is where the most efficient designs tend to minimize bending moments that act on the connection of the fin to the bracket, or the building. If stresses caused by moments can be minimized, connection details can be simplified, with economic savings from reducing the number of high-grade components involved in the transfer of bringing loads to the ground. Figure 17 is a contour plot of the peak moments based on the sample of 13 façade arrangements (using the same interpolation approach from Figure 16).
From this contour plot, several trends are apparent. For increases in fin length, moments tend to increase, for a given spacing from the building. The exception to this exists for fins with brackets that are 480 mm long, which have improved efficiency compared to the fins of 400 mm length. Increasing the bracket length has the effect of increasing overturning moments at the connection with the top of the fin. Relative efficiency for longer fin lengths between 640 mm and 800 mm are found from having the second smallest bracket size of 160 mm, rather than the 80 mm length that is most efficient when used elsewhere. When no bracket is used, the arrangement tends to outperform comparable fin lengths in the 320 mm and 400 mm bracket length cases. There also appears to be reduced moments for some fin lengths at 400 mm that are more efficient for gaps equal to 160 mm and 240 mm, and with fin lengths equal to 480 mm, 560 mm and 640 mm, there is an improvement over the use of a 240 mm bracket length. The optimal façade arrangement for moments is where the bracket length equals 80 mm and fin length is 480 mm, and is derived from interpolation.
The results of Figure 16 and Figure 17 are normalized by relative scores of ‘1’ for the most efficient façade geometry up to ‘36’ for the least efficient type, to produce the plots in Figure 18. For each of these façade arrangements, the two scores were summed and a new range of values between ‘2’ and ‘72’ were produced. Based on the renormalization of these scores to values from ‘1’ to ‘36’, the contour plot to evaluate overall efficiency is plotted in Figure 19.
The optimal façade design, where moments and loading of the fin element have equal importance for defining efficiency, has a fin length of 560 mm and a bracket length equal to 80 mm. In the context of the other façade geometries, it performs 5th overall for loading and 7th for moments that acts on the bracket connection. The top five most efficient designs were established as each having fin lengths of 560 mm, with sequential improvement with decreasing bracket length from 400 mm to 80 mm. The least efficient façade was model number ‘11’, which was attached to the building directly and has the longest fin dimension at 800 mm. It performs worst of all for minimizing its load distribution, while also ranking 34th for peak moment efficiency.

5.2. Unsheltered Case

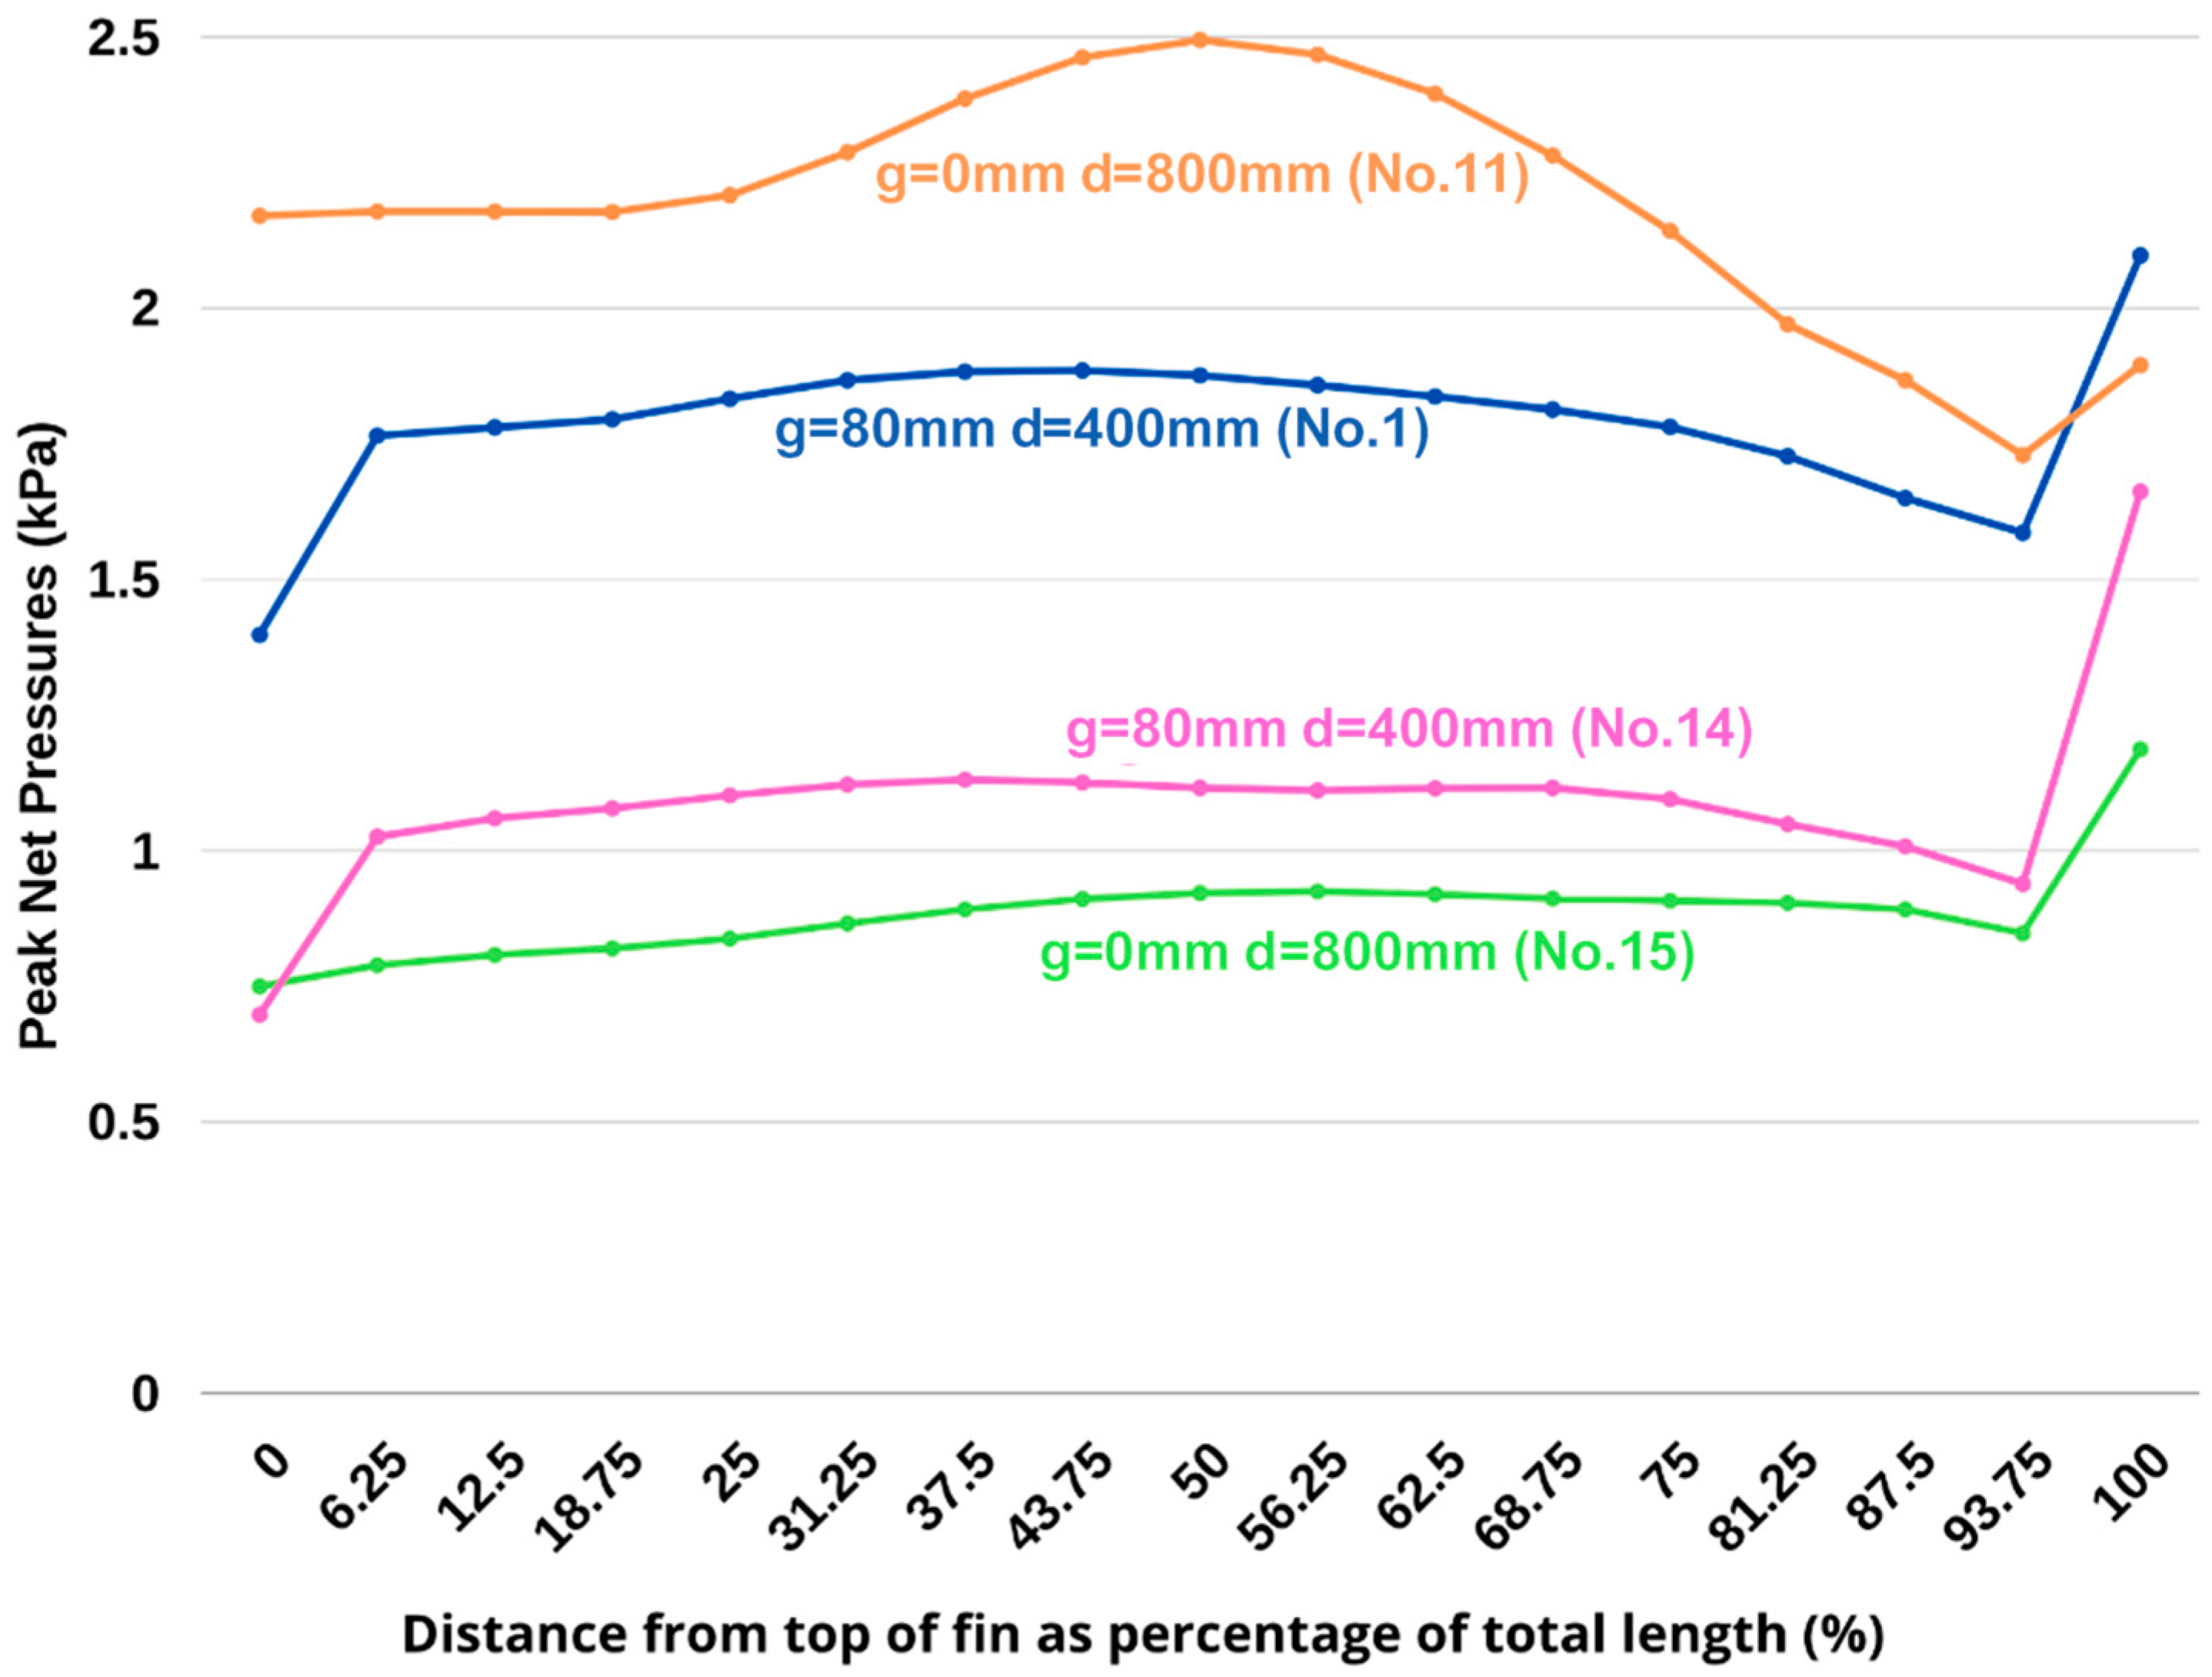
The effect of wind direction on peak net pressures can be seen in Figure 20. The deficiencies discussed about model number ‘11’ (fin connected to the building with a length of 800 mm) in the previous section are for wind acting normal to the structure. With the wind approaching between the spacing of the fins, the average peak net pressure is approximately 2.5 times reduced as a result. The analysis of Section 5 indicates that as the critical fin shelters its neighboring components, negative pressure develops into the worst case of any façade arrangement to maintain continuity. By applying wind at an angle to make each fin equally exposed, the persistent and intense vortices of suction no longer develop at this location, which results in a very stable mass of air in the bays, despite the storm level wind conditions. This is also similarly apparent, but to a lesser extent, where the façade has a fin length of 400 mm with 80 mm long bracket, which represents the least efficient member for managing wind load with a bracket. The space between the building and the façade allows peak net pressures to develop to a greater magnitude (for the unsheltered cases) that is in contrast to when the wind direction is acting in the worst case, which is where the sheltering effect occurs. Therefore, an understanding of wind direction is significant for resultant loading. Once again, it is interesting to note the linear variation of pressure near the two ends of the plot. As before, ends of the fins represent extremes for the analysis, as results indicate a relatively small loading in terms of windward pressure while also tending to have large leeward suction acting at the point furthest from the building structure.

6. Conclusions

This paper presents a parametric study that examines changes in façade bracket length, façade fin length and wind orientation using CFD. The goal is to seek the optimum design configuration that minimizes wind pressures on the façade elements. The critical fin for design is determined to be the leading fin in all cases. In the case where wind acts normal to the critical fin, the major findings are:
  • The Venturi Effect tends to reduce the magnitude of pressures at the end of the fin nearest the building. The narrower the gap for airflow, the smaller the net pressure at this location.
  • The more the flow is constricted towards the building, the greater the suction on the leeward side of the critical fin.
  • Increasing the bracket length for a given fin length, achieves efficient distribution of load.
  • Wind load is spread more evenly in cases where fin length is aerodynamically more efficient by utilizing the benefits of the Venturi Effect without the relative impact on continuity of the flow that occurs for less efficient fins.
  • Reducing both fin length and bracket length tends to reduce moments.
  • With these effects taken into account, the most efficient fin, as a combination of forces and moments has a length of 560 mm due to its ability to distribute stress through its aerodynamic efficiency, with a bracket of 80 mm recommended to minimize moments.
  • The least efficient design is where the fins are directly attached to the building and with the longest fin length (800 mm).
However, where wind direction exposes each of the fins equally to oncoming wind, average values for peak net wind pressures are reduced by a factor of up to 2.5. Therefore, an understanding of wind direction is significant for resultant loading.
The findings represent useful information on the relative performance of outstand fin elements in extreme wind conditions. The conclusions also represent a set of design criteria recommendations relevant for this type of façade. For a given vertical height of the fin element, the data is sufficient to design the composition of the fin façade panel and robustness of the connections with the bracket and building.

Author Contributions

Conceptualization, J.K.; methodology, C.M. and J.K.; software, C.M.; validation, C.M.; formal analysis, C.M.; investigation, C.M.; writing—original draft preparation, C.M.; writing—review and editing, J.K.; visualization, C.M.; supervision, J.K. All authors have read and agreed to the published version of the manuscript.

Funding

This research received no external funding.

Conflicts of Interest

The authors declare no conflict of interest.

References

  1. Costola, D.; Blocken, B.; Hensen, J.L.M. Overview of pressure coefficient data in building energy simulation and airflow network programs. Build. Environ. 2009, 44, 2027–2036. [Google Scholar] [CrossRef] [Green Version]
  2. Aylanc, N.; Kasperski, M. Design wind loads for cladding elements, in 5th European and African Conference on Wind Engineering. In Proceedings of the 5th European and African Conference on Wind Engineering, Florence, Italy, 19–23 July 2009; Firenze University Press: Florence, Italy, 2009; pp. 379–391. [Google Scholar]
  3. Blocken, B. 50 years of computational wind engineering: Past, present and future. J. Wind Eng. Ind. Aerodyn. 2014, 129, 69–102. [Google Scholar] [CrossRef]
  4. Montazeri, H.; Blocken, B. CFD simulation of wind-induced pressure coefficients on buildings with and without balconies: Validation and sensitivity analysis. Build. Environ. 2013, 60, 137–149. [Google Scholar] [CrossRef]
  5. Casey, M.; Wintergerste, T. Best Practice Guidelines, ERCOFTAC Special Interest Group on “Quality and Trust in Industrial CFD”; European Research Community on Flow; Turbulence and Combustion: London, UK, 2000. [Google Scholar]
  6. Franke, J.; Baklanov, A. Best Practice Guideline for the CFD Simulation of Flows in the Urban Environment: COST Action 732 Quality Assurance and Improvement of Microscale Meteorological Models; Meteorological Inst: Hamburg, Germany, 2007. [Google Scholar]
  7. Tominaga, Y.; Mochida, A.; Yoshie, R.; Kataoka, H.; Nozu, T.; Yoshikawa, M.; Shirasawa, T. AIJ guidelines for practical applications of CFD to pedestrian wind environment around buildings. J. Wind Eng. Ind. Aerodyn. 2008, 96, 1749–1761. [Google Scholar] [CrossRef]
  8. Blocken, B.B.; Carmeliet, J.J. Pedestrian Wind Environment around Buildings: Literature Review and Practical Examples. J. Therm. Envel. Build. Sci. 2004, 28, 107–159. [Google Scholar] [CrossRef]
  9. Delaunay, D.; Lakehal, D.; Pierrat, D. Numerical approach for wind loads prediction on buildings and structures. J. Wind Eng. Ind. Aerodyn. 1995, 57, 307–321. [Google Scholar] [CrossRef]
  10. Selvam, R.P. Computation of pressures on Texas Tech University building using large eddy simulation. J. Wind Eng. Ind. Aerodyn. 1997, 67, 647–657. [Google Scholar] [CrossRef]
  11. Cochran, L.; Derickson, R. A physical modeler’s view of computational wind engineering. J. Wind Eng. Ind. Aerodyn. 2011, 99, 139–153. [Google Scholar] [CrossRef]
  12. Haque, N.; Katsuchi, H.; Yamada, H.; Nishio, M. Strategy to develop efficient grid system for flow analysis around two-dimensional bluff bodies. KSCE J. Civ. Eng. 2015, 20, 1913–1924. [Google Scholar] [CrossRef]
  13. Liu, J.; Niu, J.; Du, Y.; Mak, C. Large Eddy Simulation on the Pedestrian Level Wind around a Building Community: Evaluation of Influencing Factors. In Proceedings of the 4th International Conference on Building Energy, Environment, Melbourne, Australia, 5–9 February 2018; pp. 390–395. [Google Scholar]
  14. Li, W.-W.; Meroney, R.N. Gas dispersion near a cubical model building. Part I. Mean concentration measurements. J. Wind Eng. Ind. Aerodyn. 1983, 12, 15–33. [Google Scholar] [CrossRef]
  15. Gousseau, P.; Blocken, B.B.; Van Heijst, G.J.F. Quality assessment of Large-Eddy Simulation of wind flow around a high-rise building: Validation and solution verification. Comput. Fluids 2013, 79, 120–133. [Google Scholar] [CrossRef]
  16. Tominaga, Y.; Mochida, A.; Murakami, S.; Sawaki, S. Comparison of various revised k-ε models and LES applied to flow around a high-rise building model with 1:1:2 shape placed within the surface boundary layer. J. Wind Eng. Ind. Aerodyn. 2008, 96, 389–411. [Google Scholar] [CrossRef]
  17. O’Rourke, M. Fundamental Concepts, Fluid Properties, Inviscid Flow, Internal Flow [Lecture to BE and BSc Engineering], (MEEN20010: Mechanis of Fluids I); University College Dublin: Belfield, Dublin, 2011. [Google Scholar]
  18. Versteeg, H.K.; Malalasekera, W. An Introduction to Computational Fluid Dynamics: The Finite Volume Method; Pearson Education: London, UK, 2007. [Google Scholar]
  19. Argyropoulos, C.D.; Markatos, N.C. Recent advances on the numerical modelling of turbulent flows. Appl. Math. Model. 2015, 39, 693–732. [Google Scholar] [CrossRef]
  20. Piomelli, U.; Balaras, E. Wall-layer models for large-eddy simulations. Annu. Rev. Fluid Mech. 2002, 34, 349–374. [Google Scholar] [CrossRef] [Green Version]
  21. Tamura, T.; Nozawa, K.; Kondo, K. AIJ guide for numerical prediction of wind loads on buildings. J. Wind Eng. Ind. Aerodyn. 2008, 96, 1974–1984. [Google Scholar] [CrossRef]
  22. Syrakos, A.; Varchanis, S.; Dimakopoulos, Y.; Goulas, A.; Fraggedakis, D. A critical analysis of some popular methods for the discretisation of the gradient operator in finite volume methods. Phys. Fluids 2017, 29, 127103. [Google Scholar] [CrossRef]
  23. Cardiff, P. Lecture 5–7: Finite Volume Method and Fluid Dynamics with Ansys Fluent [Lecture to Mechanical Engineering Stage 4], (MEEN40150: Computational Continuum Mechanics II); University College Dublin: Belfield, Dublin, Ireland, 2016. [Google Scholar]
  24. Fluent, A. Ansys Fluent Theory Guide; ANSYS Inc.: Canonsburg, PA, USA, 2011; Volume 15317, pp. 724–746. [Google Scholar]
Figure 1. Building and Façade arrangement (a) plan view (b) elevation view.
Applsci 10 08627 g001
Figure 2. Computational domain.
Applsci 10 08627 g002
Figure 3. Detail of structured mesh (a) around the building (b) around the leading fin (c) around the lower edge of the leading fin for a mesh with cell size of 2 mm.
Applsci 10 08627 g003
Figure 4. Peak wind pressures (a) Mesh 1 (2 mm), (b) Mesh 2 (1 mm), (c) Mesh 3 (0.5 mm). In each figure, the left-hand portion of the image illustrates results for the entire building and the right-hand portion of the image is zoomed in on the critical fin.
Applsci 10 08627 g004aApplsci 10 08627 g004b
Figure 5. Peak Pressure Distributions for 3 mesh resolutions with respect to distance along the fin from its top edge (a) windward side (b) leeward side (c) net pressures. Peak pressures have a 95% confidence interval of not being exceeded within the simulation.
Applsci 10 08627 g005
Figure 6. (a) Differences in peak net force (per meter fin-height) due to changes in mesh resolution, (b) Differences in peak net moment (per meter fin-height) due to changes in mesh resolution. Peak net force has a 95% confidence interval of not being exceeded within the experiment.
Applsci 10 08627 g006
Figure 7. (a) Mean net pressures distributions for 3 mesh resolutions with respect to the distance along the fin from its top edge, (b) Minimum leeward pressure distributions for 3 mesh resolutions with respect to the distance along the fin from its top edge. Minimum pressures have a 5% confidence interval of not being exceeded within the experiment.
Applsci 10 08627 g007
Figure 8. Façade geometry types for sample numbers 1–13. Bracket Length ‘g’ is defined on the horizontal axis. Fin length in millimeters is defined on the vertical axis.
Applsci 10 08627 g008
Figure 9. Results for Building with g = 80 mm, d = 400 mm (a) Time-averaged velocity (vector arrows) and pressures (contours) (b) Time-averaged pressures (c) Peak pressures (d) Peak and time-averaged net pressures (kPa) versus position from top of fin in meters.
Applsci 10 08627 g009
Figure 10. Results for Building with g = 160 mm, d = 560 mm (a) Time-averaged velocity (vector arrows) and pressures (contours) (b) Time-averaged pressures (c) Peak pressures (d) Peak and time-averaged net pressures (kPa) versus position from top of fin in meters.
Applsci 10 08627 g010
Figure 11. Results for Building with g = 0 mm, d = 800 mm (a) Time-averaged velocity (vector arrows) and pressures (contours) (b) Time-averaged pressures (c) Peak pressures (d) Peak and time-averaged net pressures (kPa) versus the position from the top of the fin in meters.
Applsci 10 08627 g011
Figure 12. Results for a building with g = 400 mm, d = 800 mm (a) Time-averaged velocity (vector arrows) and pressures (contours) (b) Time-averaged pressures (c) Peak pressures (d) Peak and time-averaged net pressures (kPa) versus position from top of fin in meters.
Applsci 10 08627 g012
Figure 13. Results for Building with g = 80 mm, d = 400 mm (a) Time-averaged velocity (vector arrows) and pressures (contours) (b) Time-averaged pressures (c) Peak pressures (d) Peak and time-averaged net pressures (kPa) versus the position from the top of the fin in meters.
Applsci 10 08627 g013
Figure 14. Results for a building with g = 0 mm, d = 800 mm (a) Time-averaged velocity (vector arrows) and pressures (contours) (b) Time-averaged pressures (c) Peak pressures (d) Peak and time-averaged net pressures (kPa) versus the position from the top of the fin in meters.
Applsci 10 08627 g014
Figure 15. Peak net pressures for models ‘1’, ‘5’, ‘11’ and ‘13’ versus distance from the top of the fin as a percentage of total fin length.
Applsci 10 08627 g015
Figure 16. Contour plot of peak net force in terms of normalized fin length, for a given façade element.
Applsci 10 08627 g016
Figure 17. Contour plot of peak moment for a given fin element.
Applsci 10 08627 g017
Figure 18. Normalized contour plots of forces (Figure 16) and moments (Figure 17) in terms of relative scores for efficiency.
Applsci 10 08627 g018
Figure 19. Combined scores from Figure 18 that are normalized in terms of relative efficiency.
Applsci 10 08627 g019
Figure 20. Peak net pressures for model numbers ‘1’, ‘11’, ‘14’ and ‘15’ versus distance from the top of the fin as a percentage of the total fin length.
Applsci 10 08627 g020
Table 1. Values for Y+ and Courant Number.
Y+
(Max)
Y+
(Mean)
Y+
(Variance)
Co
(Max)
Co
(Mean)
Co
(Variance)
Mesh 1 (2 mm)290.1212.3830.638.127.712.4
Mesh 2 (1 mm)157.2112.0276.638.419.212.8
Mesh 3 (0.5 mm)78.858.363.133.424.28.1
Table 2. Number of cells, Ratio and Refinement factors for three mesh types.
CellsRatioRefinement (r)
Mesh 1 (2 mm)78,962Mesh1–21.414Mesh1–21.189
Mesh 2 (1 mm)111,688Mesh2–31.376Mesh2–31.173
Mesh 3 (0.5 mm)153,652--------
Table 3. Summary of level arm lengths based on mesh resolution and loading condition.
Peak (m)Mean (m)Min (m)
Mesh 1 (2 mm)0.2500.2390.347
Mesh 2 (1 mm)0.2440.2370.286
Mesh 3 (0.5 mm)0.2420.2390.225
Table 4. Relative errors values for three load cases.
Net ForcesLever Arm LengthsNet Moments
PeakMeanMinPeakMeanMinPeakMeanMin
e1219.9%22.8%5.1%2.4%0.9%17.5%21.8%23.4%13.3%
e2313.1%2.7%133.5%0.9%1.2%21.4%13.9%3.9%123.6%
Table 5. Computational Domain Dimensions.
Model Nog (mm)d (mm)D (m)5D (m)10D (m)6D (m)Domain Length (m)Domain Height (m)
1/14804001.286.412.87.6820.8816.64
23204001.527.615.29.1224.4819.76
304801.286.412.87.6820.8816.64
42404801.527.615.29.1224.4819.76
51605601.527.615.29.1224.4819.76
64005601.768.817.610.5628.0822.88
706401.447.214.48.6423.2818.72
82406401.688.416.810.0826.8821.84
9807201.608.016.09.625.6820.8
103207201.849.218.411.0429.2823.92
11/1508001.608.016.09.625.6820.8
121608001.768.817.610.5628.0822.88
134008002.0010.020.012.031.6826.00
Publisher’s Note: MDPI stays neutral with regard to jurisdictional claims in published maps and institutional affiliations.