1. Introduction
Lasers are widely used as a valuable tool for laser material processing [
1,
2] in high-precision cutting and drilling manufacturing operations [
3], as well as in laser-assisted machining [
4,
5]. Laser–solid interaction constitutes a process of major scientific and technological interest, where complex physical phenomena occur. The thermal, mechanical, and optical properties of the material, the laser parameters, and the surface morphology are factors of crucial importance that influence the interaction of lasers with matter and the subsequent phase changes of the irradiated target [
6,
7,
8,
9,
10,
11,
12]. Numerical simulations of laser–solid interactions are essential in order to predict the behavior of the heated matter, to better comprehend the fundamentals of the physical problem, and to provide insights toward the interpretation of the experimental findings.
Surface roughness is a well-established property used for characterizing the surface quality of a solid material. It is indicative of the mechanical integrity and cohesion of the material, since irregularities on the surface may form nucleation sites responsible for cracks or corrosion. Therefore, taking into account the effects of the surface roughness in developing new and precise computational models of the radiation–matter interaction results in better understanding the underlying mechanisms that govern the laser–matter interaction in the micro- and nanoscale levels. However, in the literature only a few numerical approximations are reported to take into account the influence of the surface roughness when considering the mechanical and thermal properties of the irradiated target. Conde et al. [
13,
14] developed a thermal ablation Finite Element Method (FEM) model that incorporated the conditions of initial roughness to explain the target microstructure formation and the laser plume deflection. A thermal FEM model of pulsed laser polishing was presented by Perry et al., who investigated the effects of laser pulse duration and feed rate (pulses per millimeter) on the surface roughness [
15]. Ran et al. [
16] developed a FEM structural numerical model for laser shock peening, predicted the surface roughness by applying the computed results as inputs to analytical equations, and then compared them with the experimental outcomes. Hasser et al. [
17] developed a structural FEM model to investigate surface roughness effects in laser shock peening and simulated roughness, which was produced by displacing surface nodes using a statistical method.
In the current work, a 3D thermo-structural FEM model originally developed for the macroscopic study of laser–solid interactions and the generation and propagation of surface acoustic waves (SAWs) was spatially downscaled to explore the effects of surface roughness in a pulsed laser–solid aluminium alloy interaction. The original 3D FEM model was able to simulate the transient thermo-structural response of isotropic metallic targets and study the generation of ultrasounds, using a locally adaptive mesh [
6,
7,
8,
9]. Due to the high frequencies of the laser-generated SAWs, as well as the need for transient analysis, a small element size was essential in order to accurately simulate such effects. An orthogonal fine-meshed volume was generated to allow precision handling of the dynamic phase changes of matter, due to the high temperature gradients, in the center of the irradiated target [
7]. However, this locally adaptive mesh approach cannot be used for downscaling, since the size of the elements does not remain constant. Therefore, in order to keep the interpolation level of the finite elements constant and at the same time obtain the optimal spatial geometry description, a uniform mesh was here generated. The dimensions of the computational domain were reduced to include the laser-heated area and the corresponding section of the roughness periodic profile. Initially, the rectangular computational domain was modeled with a flat up-front surface, where roughness was neglected, and was further used as a reference. The small and steady size of the elements used to discretize the computational domain allowed for sequential downscaling of the initial model. Following the Gaussian filtered geometry of an experimentally measured average roughness profile, a linear approximation on the depth of roughness geometry was performed and the original flat surface was gradually downscaled to model the spatial roughness profile with increasing accuracy. As a result, a step-like linear profile was developed according to the experimentally determined characteristics of the geometry of the rough periodic surface pattern of our target, while no changes on the boundary and the loading conditions were imposed compared to the original model. Furthermore, experiments based on white light interferometry highlight the value of the proposed methodology.
The proposed FEM multiscale model will be easily upgraded in the future using local adaptivity on the roughness level that was achieved here and expanded to describe computational domains of higher dimensions. This is of great impact for the field of material characterization, when, for example, the influence of the surface roughness and micro/nano-defects on the generation and propagation of surface acoustic waves under pulsed laser irradiation is required to be investigated with high accuracy or for industrial applications such as laser polishing, engraving, and cutting [
18,
19], and the manufacturing and response of the solid targets in inertial confinement fusion [
20], where the influence of the surface micro-defects on the laser–matter interaction processes should be well determined.
2. Experimental Methodology
An Al-6061 orthogonal dry milled part, of an overall size of 10 cm × 3 cm × 0.9 cm, was the laser-irradiated target of our study.
Figure 1a shows a schematic of the optical setup for the laser-irradiation experiments.
The optical geometry for the laser-irradiation experiments is shown in detail in
Figure 1a: The laser source used for the interaction with the Al sample is a pulsed laser source (6-ns pulse duration) emitting radiation of 0.7 mJ energy per pulse at 532 nm. The value of 0.6 mJ was the threshold below which no detectable effect was induced by the laser on the target surface. The output of the laser system is guided through metallic mirrors to a converging lens (
f = 100 cm) and the beam is then focused onto the target surface. The profilometry setup is incorporated into the optical setup, as demonstrated in
Figure 1a. It constitutes the final part of the geometrical arrangement and is used for the characterization of the samples before and after they were irradiated with the laser pulse. The advantage of the experimental configuration is that the position of the sample can be maintained without the necessity of any change, during both the interaction and the characterization measurements, and, therefore, the interaction area on the target surface can be well determined and studied. The profilometry configuration is based on a Michelson white light interferometer, described in detail in [
7]. Briefly, a beam splitter separates the white light emitted from the source, generating the reference and object beams, the latter being reflected by the sample surface. A metallic mirror placed on a linear piezoelectric actuator is moved and used for altering the optical path of the reference beam. The two beams are recombined on a CCD camera, which is connected to a PC. A series of surface images and interferograms for the different positions of the moving metallic mirror are acquired and processed, allowing for the determination of the surface topology [
7].
A typical 2D grayscale surface image of the SA as extracted from the profilometry measurements is demonstrated in
Figure 1b: The selected area imaged in this figure covered a length of
x = 3 mm. The profile of the surface roughness plotted at the center of the selected area is shown in
Figure 1c,d, using a roughness meter (Roughness gauge TESA Rugosurf 20) and the profilometry setup, respectively, for validation. It is worth noting that, even though the surface roughness topology was accurately determined by both techniques, profilometry offered the advantage of measuring the roughness at the exact region of interaction with the laser pulse, as already mentioned, but also the advantage of extracting an average line-out plot in contrast to the line-out from the roughness meter, which was taken along a single line. This average line-out plot resulted from averaging the roughness values of all the points within a selected area (yellow rectangular area) of the same
x position and along the
y axis. This way, the generated plot is representative of the overall surface of the original sample, eliminating effects from local discontinuities or measured artifacts. Such an average roughness plot was extracted from
Figure 1b,d. In order to investigate the effect of roughness on the structural changes due to the laser, the laser spot was focused on the position of the maximum roughness variation (~3 μm depth). The dimensions of the elliptical laser spot determined the area of interest, which covered a region of
x = 400 μm. The average roughness profile of this area (
Figure 1e) was used as a pattern for the downscaling of the models.
3. Numerical Modeling
A 3D coupled thermal-mechanical FEM analysis was performed in LS-DYNA [
21]. The temperature distribution was found by solving the heat conduction equation:
where
x,
y, and
z are the space coordinates while
ρ,
Cp,
k are the mass density, specific heat at constant pressure, and the thermal conductivity of the target material, respectively, and
Li is the latent heat of melting, which is equal to zero in the thermoelastic regime. The source term,
Q(
x, y, z, t), has an elliptic spatial form and represents the absorbed laser energy per unit volume per unit time by the sample:
where,
I0 is the incident laser intensity on target,
R is the optical reflectivity of the sample,
αb is the optical absorption coefficient,
t0 is the laser pulse duration at full width at half maximum (FWHM),
rα is the semi-major axis and
rb is the semi-minor axis of the laser spot,
xo and
yo are the center coordinates, and
θ is the rotation angle. The conservative equations of mass, momentum, and energy are also solved:
where
ρ is the density,
v is the velocity,
U is the displacement,
λ and
μ are the
Lamé coefficients,
αΤ is the thermal expansion coefficient,
E is the energy, and
σij is the stress tensor. The strain tensor is given by:
while for the stress tensor it holds:
In continuum mechanics theory, the complete stress tensor describes the material condition state. It is divided into two components, the deviatoric and the hydrostatic tensors:
where
sij is the deviatoric stress component. The hydrostatic component of stress is associated to the pressure in the material, which is equal to the trace of the complete stress tensor
The hydrodynamic and deviatoric behavior of the metallic target is considered by using simultaneously an analytical equation of state (EOS) coupled with a strength material model. The analytical Grüneisen EOS is used and allows the extension of the application range to high-pressure values and to the liquid phase. The analytical Grüneisen EOS provides the pressure for compressed materials [
21]:
where
C0 is the sound speed,
γ0 the unitless, Grüneisen parameter that defines the effect on the atom’s vibration due to the change in energy and
a is the unitless, first-order volume correction to
γ0; while
is a volumetric parameter that holds
=
ρ/
ρ0−1. For most of the materials, shock velocity
Us varies linearly, in relation to the particle velocity,
Up, as
Us =
C0 +
S1Up, where
S1 is the unitless coefficient of the slope of the
Us-
Up curve. For expanded materials the following holds:
A proper material-constitutive model for the metal was adopted, the Johnson–Cook (J–C) material model, which considers the effect of plastic strain, strain rate, and temperature. The flow stress is expressed as [
22]:
where
A is the yield stress,
B is the hardening constant,
ε is the equivalent plastic strain,
n is the hardening exponent,
C is the strain rate sensitivity,
is the dimensionless plastic strain rate,
= 1 s
−1 is a reference strain rate used to normalize the strain rate,
Tm is the melting temperature of the workpiece,
Tr is the room temperature, and
m is the thermal softening exponent. The J–C material model also adopts a fracture model that considers the nucleation, growth, and coalescence of voids in a ductile material at high-strain rates. The equivalent plastic strain at the onset of damage is defined as:
where
D1 is the initial failure strain,
D2 is the exponential factor,
D3 is the triaxility factor,
D4 is the strain rate factor,
D5 is the temperature factor,
σVM is the Von Mises stress, and
εf is the plastic strain at fracture. The
D1–
D5 constitute unitless failure parameters. Material fracture occurs when the damage parameter
D reaches the value of 1 and the concerned elements are removed from the computation.
For the study of the generation and propagation of SAW’s under pulsed laser irradiation, we developed and demonstrated a series of FEM simulations that focus on monitoring the matter dynamics on the macroscopic level of the solid target. The developed models are capable to simulate the transient thermo-structural matter’s response from solid to plasma state under ns and fs pulsed laser irradiation and to study the generation and propagation of SAWs [
6,
7,
8,
9]. The common characteristic of these models is the generation of a locally adaptive mesh, around the irradiated area of the spot, capable to handle the phase changes of matter due to the high-temperature gradients. This sophisticated finite element grid allows for the smooth transition of the SAWs from their source in the epicenter of the target [
7] and provides the appropriate nodal distribution to the entire computational domain. Thus, the computing of the new nodal positions and temperature values in the Lagrangian mesh were accurately performed without exaggerating the computational resources and the run time.
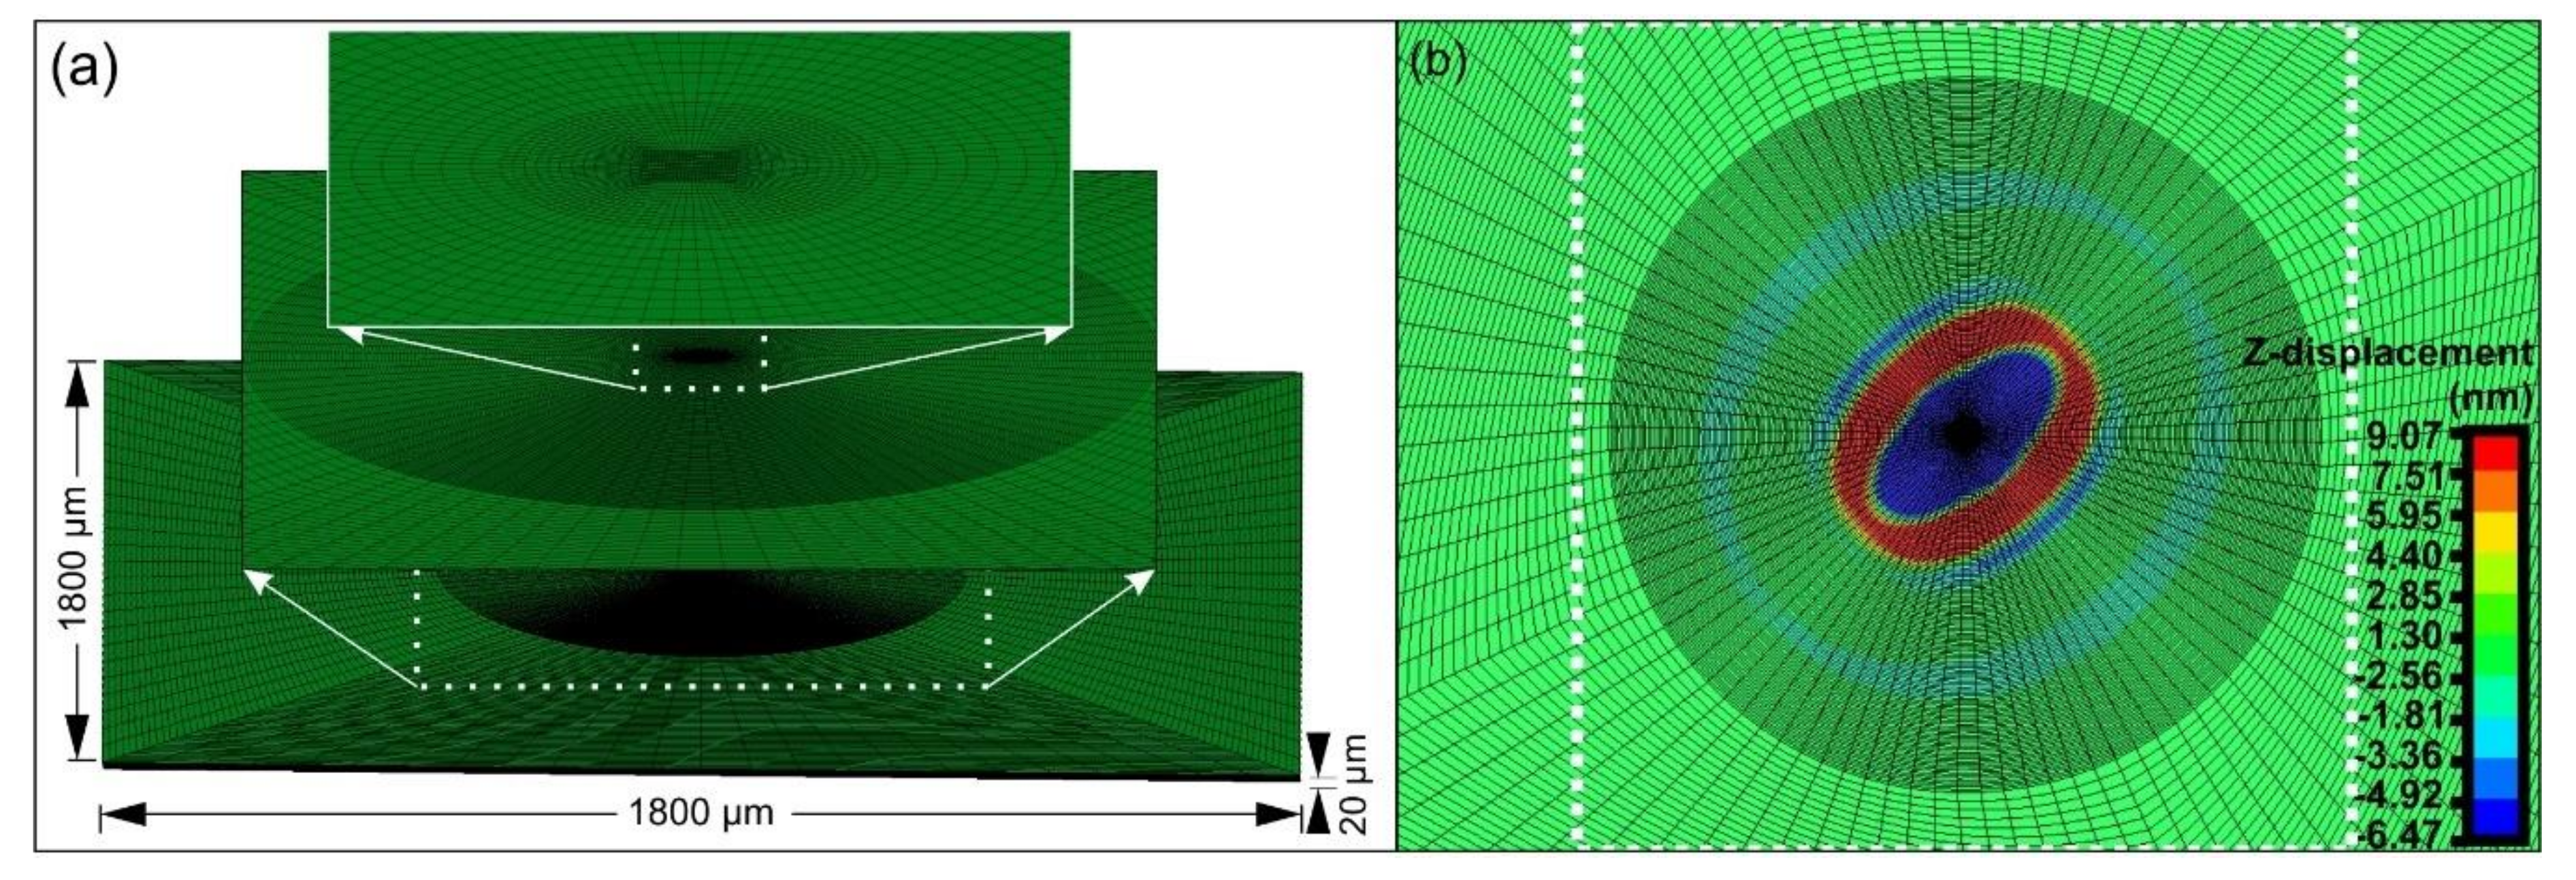
Figure 2 shows a typical FEM locally adaptive model, that precisely simulates the pulsed laser–Al target interaction. The dimensions of the solid target were 1800 μm × 1800 μm × 20 μm and the generated mesh consisted of approximately 2 million elements, as presented in
Figure 2a. Moreover, the beam spot had an elliptical shape. The major and minor axes of the elliptical laser spot were 160 μm and 75 μm long, as indicated by the experiment. The rotation angle was 29°.This model considered the phase changes of matter and provided identical monitoring of the ultrasounds’ generation and propagation throughout the computational domain, as demonstrated in the vertical Z-displacement results in
Figure 2b. For laser fluence of 2 J/cm
2, which was computed to be above the melting threshold of the sample, two SAWs could be depicted having an amplitude of 3 nm and 6 nm and 550 μm and 350 μm, far away the epicenter, respectively. However, this non-uniform grid generation is not efficient to properly model the microscale characteristics of the surface roughness. Any geometrical modification of the non-uniform element distribution is affecting the entire solution domain and disturbs the smooth nodal distribution.
Therefore, a new FEM model with a uniform mesh was here developed within a small solution domain, able to simulate the laser heated area of interest, around the laser spot and the characteristic part of the roughness periodic profile included therein. The model was based on the models that have been validated by surface acoustic waves’ generation and propagation experiments with ns and fs laser sources in the works [
6,
7,
8,
9]. The increase of the discretization level, due to the downscaling, aimed at in this work, was further increasing the approximation accuracy of the simulation. The dimensions of the solid target were 400 μm × 400 μm × 12 μm, while a total of approximately 1.9 million elements were used. The element size of the uniform mesh was 5 μm × 5 μm × 0.04 μm. To model the surface roughness, a linear approximation on the depth (vertical
z-axis) of the roughness profile was performed. The flat surface was sequentially downscaled from 0 to 3 μm, to 1.5 μm, to 1 μm, and finally to 0.5 μm, reaching with increasing accuracy the spatial roughness profile. Thus, a step-like linear profile was developed according to the experimentally measured real geometry characteristics. A range of approximately 1.7–1.8 million elements was used for the models where surface roughness was considered. The beam spot had the same previously mentioned geometry. A hexahedral, 3D-solid, eight-node element was adopted for the transient analysis for all models. The temperature-dependent thermomechanical properties, the J–C material model, and failure parameters as well as the Grüneisen EOS coefficient properties of the sample were taken from the literature [
23,
24,
25].
4. Results and Discussion
The simulation results of the laser matter irradiation are demonstrated in
Figure 3 and
Figure 4, for a pulse energy of 0.7 mJ and a fluence of 2 J/cm
2, above the melting threshold of the Al alloy, which was computed to be 1.5 J/cm
2. For the simulated laser fluence, no ablation phenomena occurred and the structural changes of the target due to laser irradiation were restricted in the plastic and melting regimes. Thus, structural changes related to plastic and melting effects occurred in the submicrometer scale.
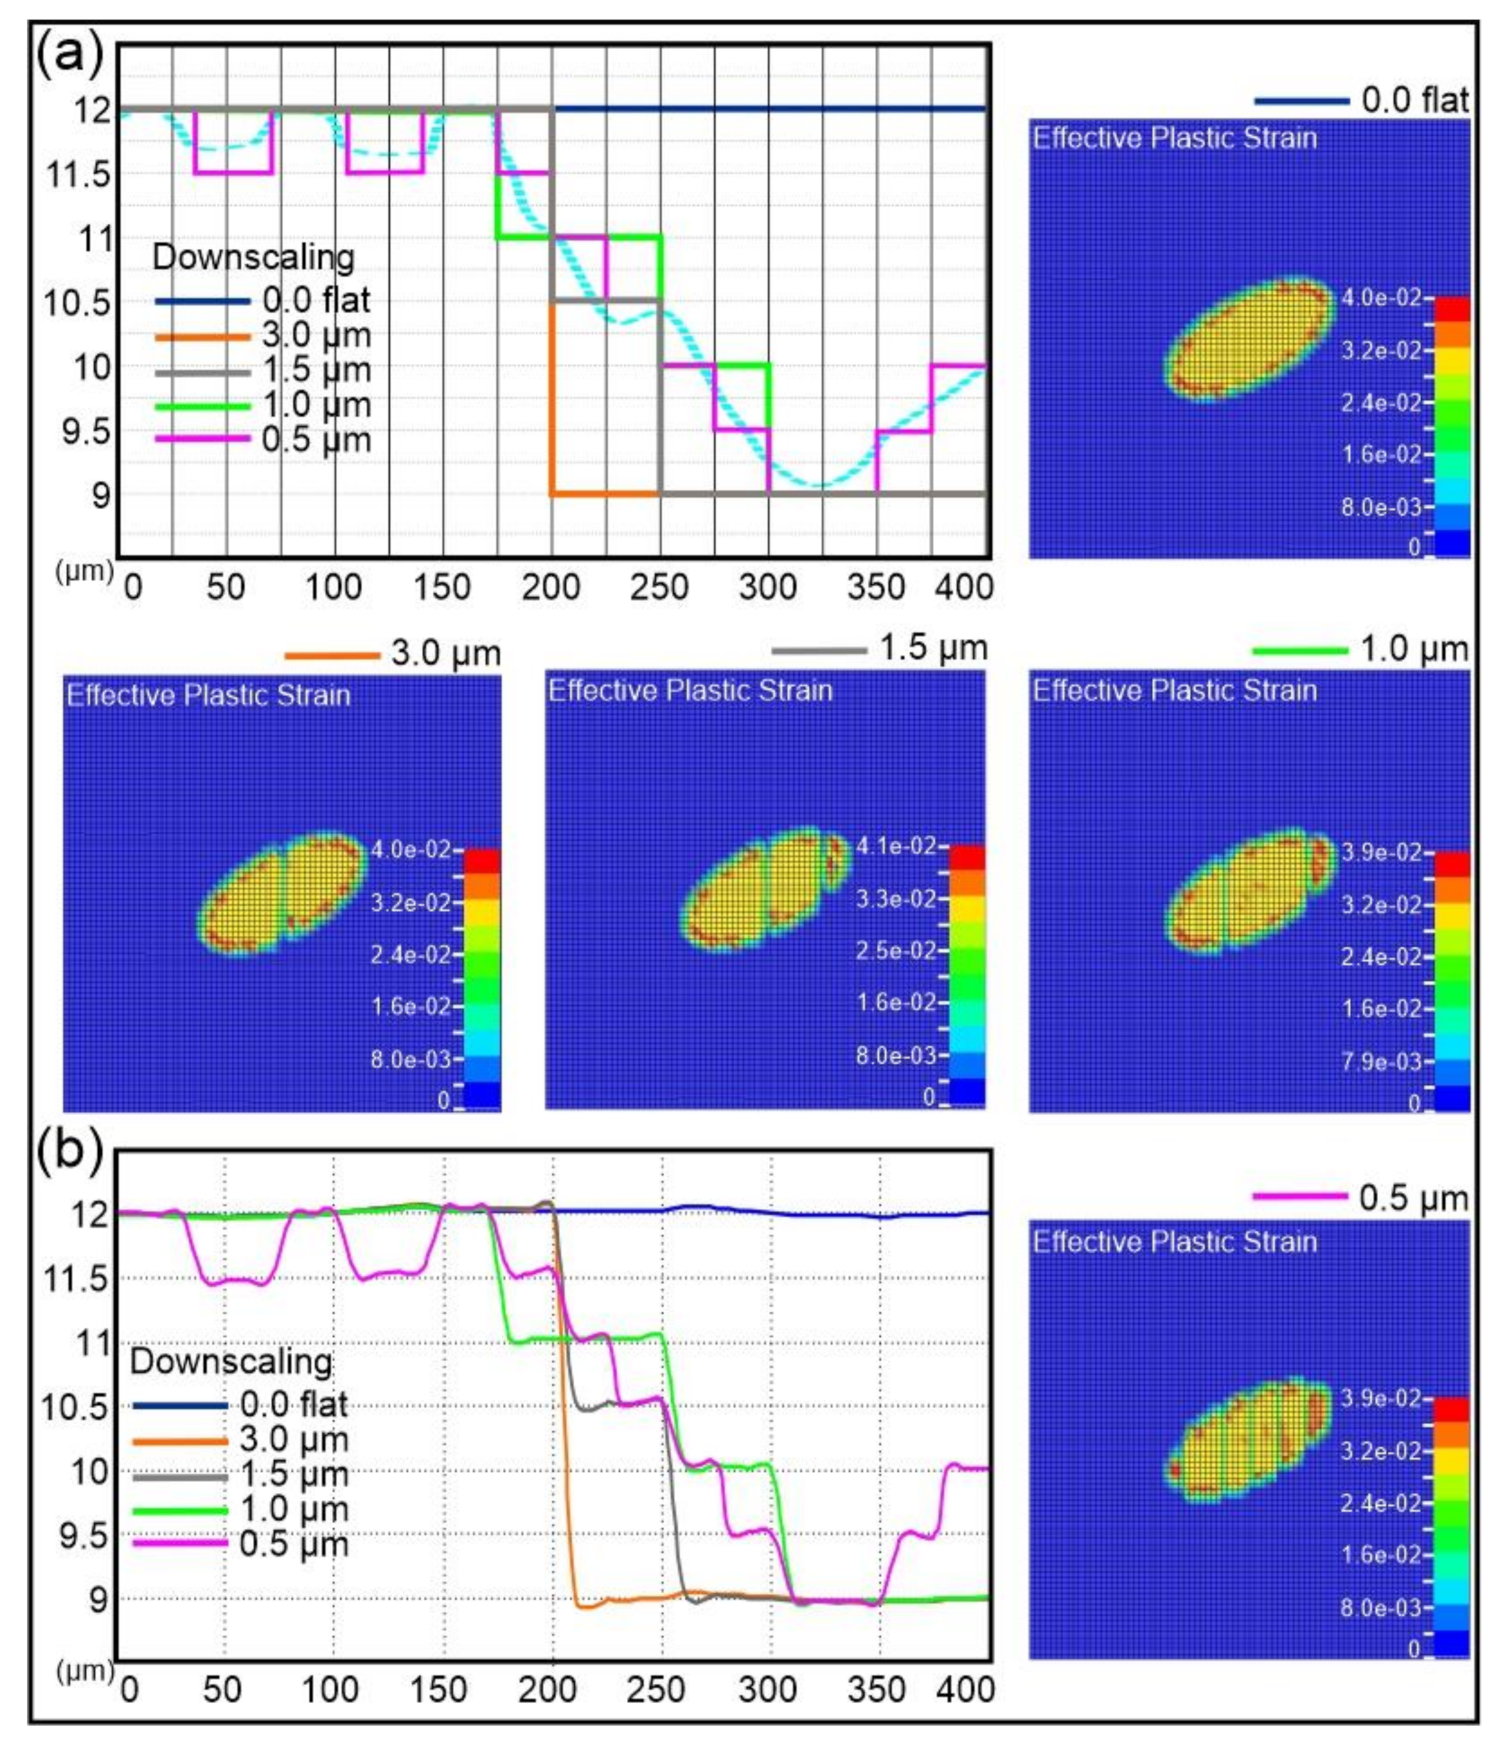
Figure 3 presents results for five models where sequential downscaling of the surface roughness level was performed. Roughness was neglected in the flat surface model. To perform the downscaling, the average roughness profile, presented in
Figure 1e, was processed in MATLAB using a Gaussian smoothing filter that resulted in the cyan, dashed curve, presented in
Figure 3a. Based on the geometrical characteristics of this curve, a linear approximation was performed and the flat surface model was firstly downscaled to describe a step of 3 μm. Then, this model was downscaled to describe two steps of 1.5 μm each, following the geometry of the cyan, dashed curve. Following this procedure, two more downscaled models were built and resulted in a total of four downscaled models having a geometrical step accuracy from 3 to 0.5 μm. Each one of the sequentially developed multiscale models could simulate the thermal-mechanical laser–solid interactions, according to the irradiated area of interest and the surface roughness profile therein, with a predefined geometrical accuracy. The identification of these positions, where changes in surface roughness took place after their interaction with a single laser pulse in this energy regime, is of high importance, especially for research works that concern changes of matter of micro- or nanoscale order, which affect the material structure, since this is where different types of cracks initialize [
26], ripples may be formed [
27,
28], and mechanical and optical materials’ properties change [
29,
30].
Figure 3 presents the simulation results for the five models 100 ns after the laser beam irradiation. According to the developed permanent plastic strain distributions, the maximum value was about 0.04 for all. At 100 ns the maximum temperature decreased to ~50 °C, reaching the environmental temperature. Furthermore, in
Figure 3b the permanent nodal positions on the top surface along the central horizontal
x-axis are plotted. The maximum depth due to material fracture was 0.1 μm for all the models. The maximum computed temperature values were lower than 900 °C at 16 ns, securing that ablation phenomena did not occur. The total fractured volume of the downscaled model to 0.5-μm step accuracy was computed to be ~340 μm
3, while for the rest of the models this value was gradually reduced to ~310 μm
3 (model neglecting roughness). It was obvious that as the geometrical accuracy of the roughness approximation was downscaled to the maximum of 0.5 μm, the submicron regions, where fracture occurs, permanent deformations are developed, and the material properties change, were more precisely identified.
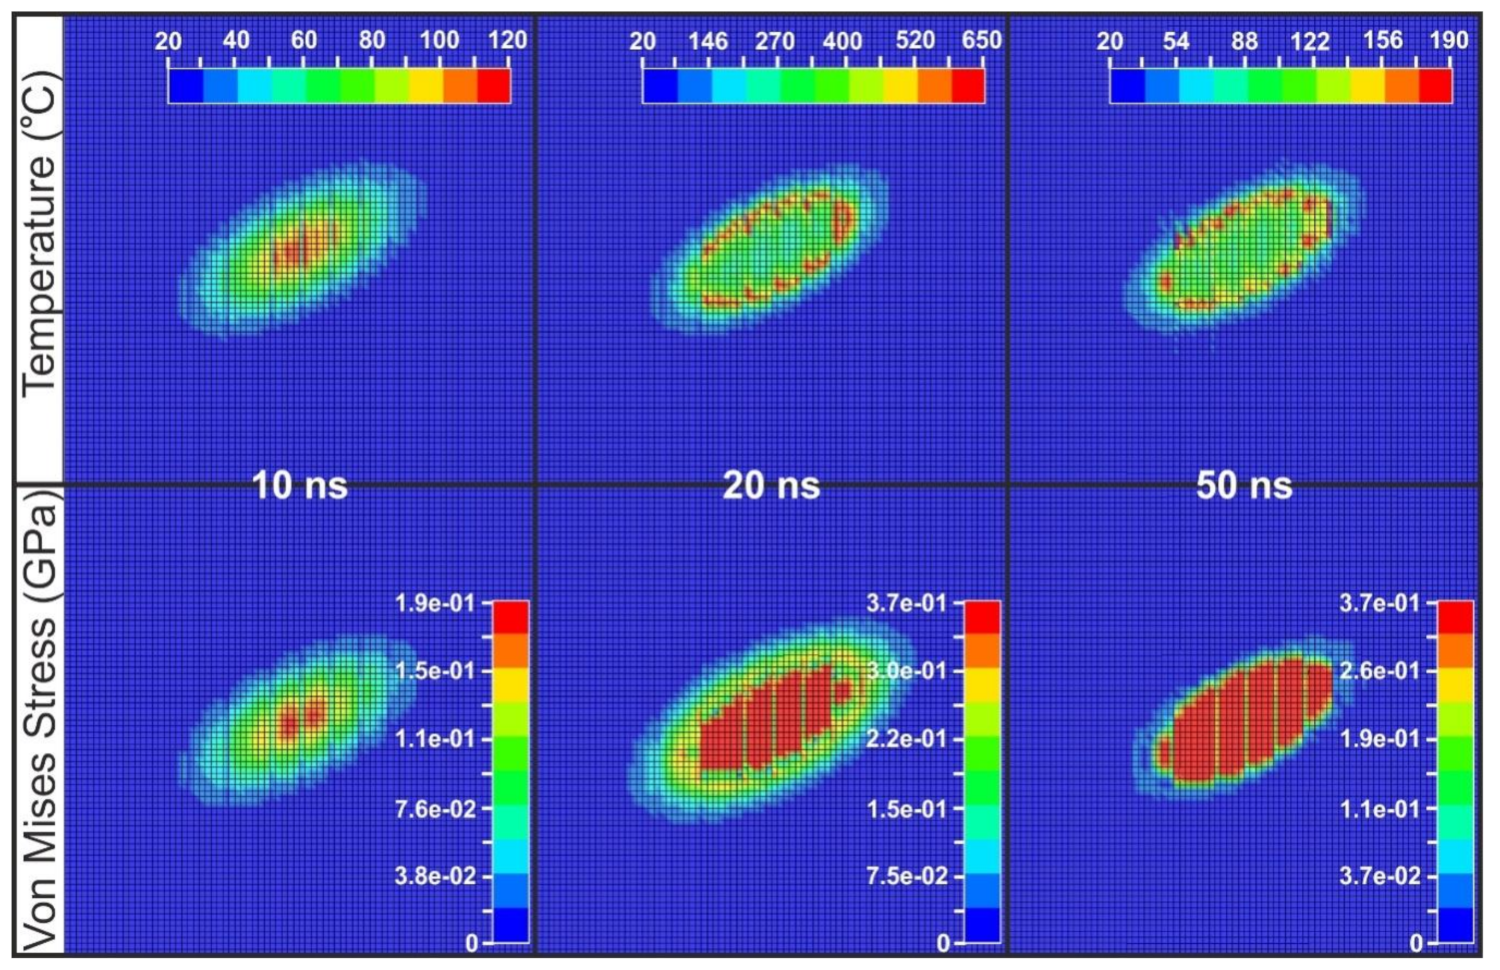
Representative FEM results of temperature and Von Mises stresses for the model downscaled to the 0.5-μm step accuracy, are presented in
Figure 4 at 10 ns, 20 ns, and 50 ns and for laser fluence of 2 J/cm
2. The heated sample at 10 ns was in the thermoelastic regime. Plastic effects started to develop 2 ns later and, at 16 ns, the maximum surface temperature exceeded the melting point. At 20 ns the heated material was in the melting regime and from this temporal moment and afterwards the maximum surface temperature started to decrease. Furthermore, the maximum developed Von Mises stresses of 380 MPa were observed at 18 ns. The advantage of such a high geometrical accuracy for surface roughness level was clearly visible at 50 ns, where the residual stresses that existed due to the plastic deformation of the heated samples were apparent and were above the yield stress of the Al alloy, which is 324 MPa [
25].
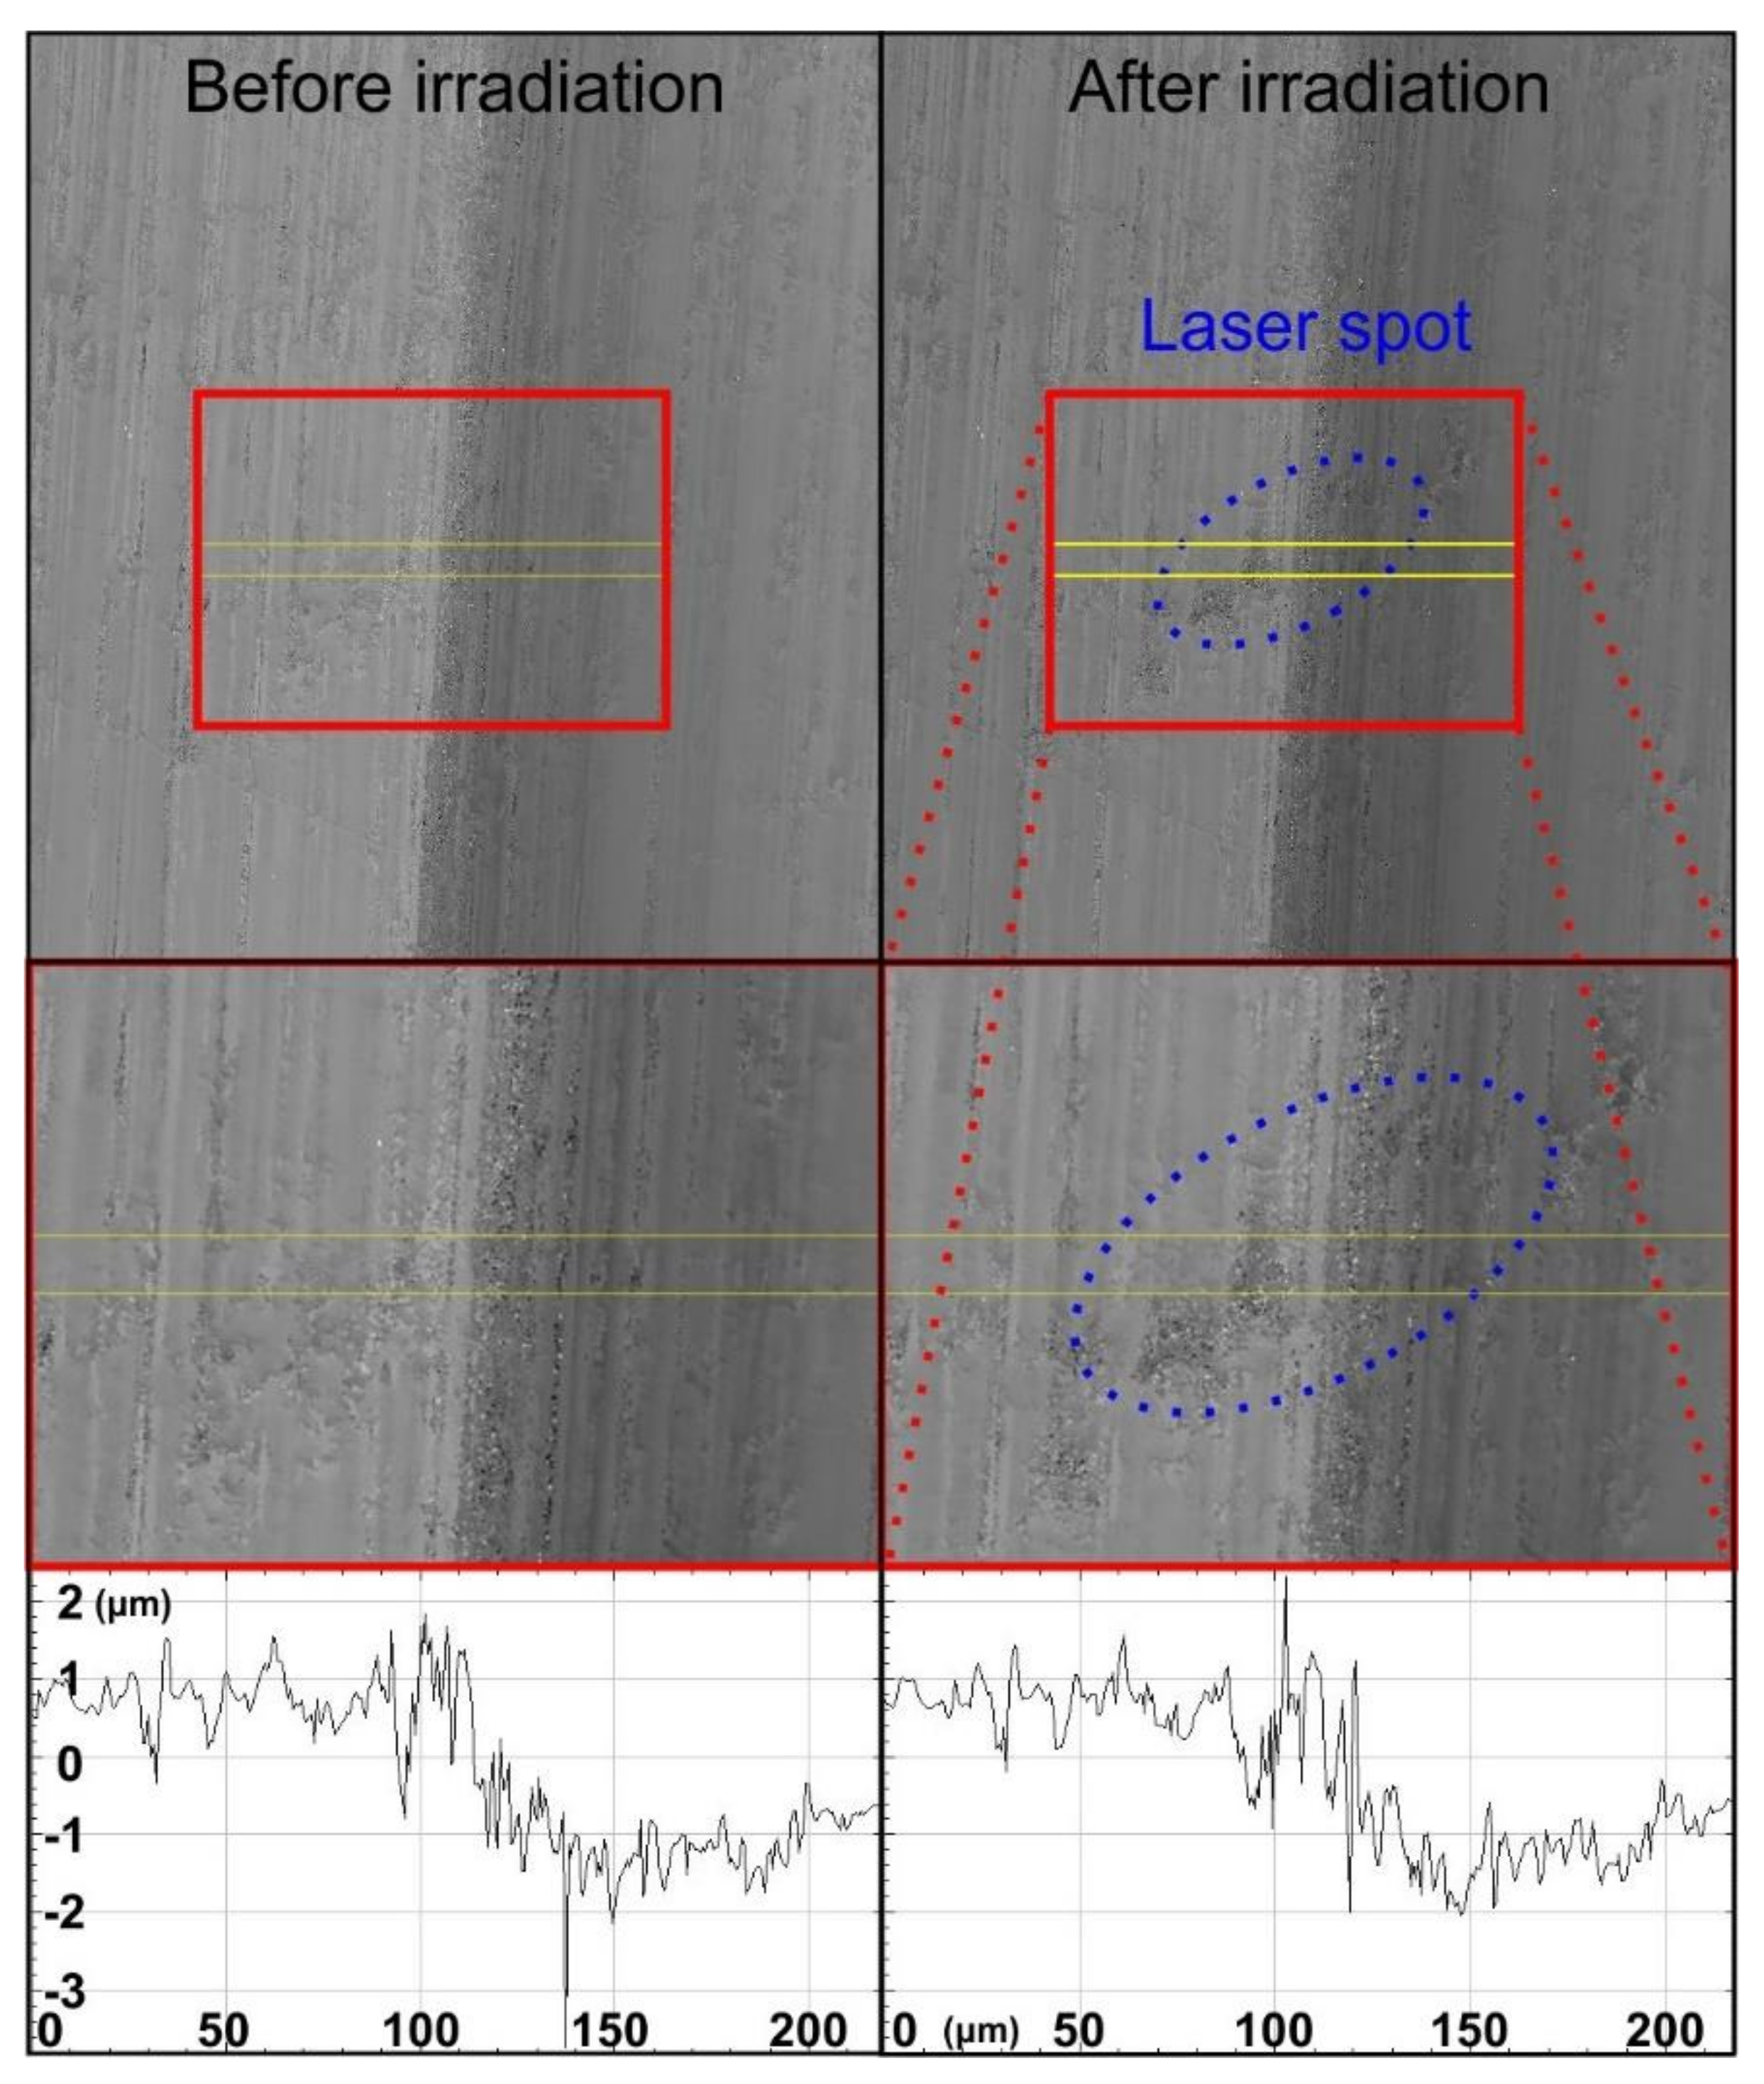
The effect of the laser pulse on the surface roughness of the workpiece is experimentally demonstrated in
Figure 5 for the same pulse energy of 0.7 mJ and fluence of 2 J/cm
2. Experiments performed with pulse energies below 0.6 mJ showed that no detectable effect of the laser pulse shot was measurable on the surface of the target.
Figure 5 shows two-dimensional images of the area of interest and cropped images, at a position of the target with the maximum roughness variation (~3 μm depth), on which the laser elliptical spot was focused. The cropped images cover a length of
x = 220 μm. The two-dimensional graphs of
Figure 5 show the surface roughness (height) plotted against the x dimension, passing through the center of the irradiated region as determined by the experiment. For every
x position, the roughness values at every point along the
y direction were averaged, for a length
y = 4 μm within the yellow rectangular area. The graphs produced exhibit the average surface roughness (
z dimension, height) plotted along the
x direction. The images refer to the same area of interest before and after the laser pulse interacts with the surface.
Figure 5 demonstrates that the laser pulse affected the interaction area of the surface, while the roughness profile line-outs revealed the relative changes on the position of the affected peaks, as well as on their height and/or depth before and after the interaction with the laser pulse, reaching the micrometer and submicrometer scale. By processing the images before and after laser irradiation, the average difference in height and/or depth experienced by the peaks due to the influence of the laser pulse was found to be less than 0.3 μm. Some resulting laser-affected roughness peaks showed differences reaching up to 1 μm. Such spikes that existed also outside the laser-affected region of the sample were considered as artefacts (measurement noise) and were attempted to be kept low through the averaging performed on the roughness values. These artefacts limited the direct correlation of the detailed features of the roughness profiles to the corresponding simulation outcomes. The experimental findings regarding the fractured volume agreed with the simulation results of the downscaled model to 0.5-μm step accuracy, since from the roughness profiles of
Figure 5 the extracted value of the fractured volume was ~360 μm
3. It is worth noting that, through the averaging performed on the roughness values, large fluctuations arising from local surface discontinuities were also smoothened, while information on the location and the type of the changes experienced by the roughness peaks was less influenced, compared to the case where a single line was chosen for plotting the roughness profile, by its exact position relative to the pulse spot center. The complicated pattern of the structural changes in surface roughness due to the interaction with a single laser pulse, as well as the agreement between the experimental and computational outcomes regarding qualitative and quantitative characteristics of the modified roughness pattern, established that downscaling for surface roughness level is of great importance in order to fully characterize the microstructures and new features that evidently arise, even at low energies, and very importantly determine the scale (micro- and/or nanoscale) and the nature of the changes that take place.
5. Conclusions
Modeling of pulsed laser radiation on an Al alloy target was performed, using a single pulse of 6-ns duration and energy of 0.7 mJ that induced changes, in a predefined surface roughness pattern, in the plastic and melting regimes. The induced changes were also experimentally visualized by a white light profilometry setup with submicrometer resolution. FEM thermal-structural analysis was carried out to model the laser-irradiated rough surface, performing downscale modeling for surface roughness level of the experimentally obtained surface roughness profile. Each one of the sequentially developed multiscale models can simulate the thermal-mechanical laser–solid interactions, according to the irradiated area of interest and the surface roughness profile therein, with a predefined geometrical accuracy. The numerical and experimental results presented a qualitative and quantitative agreement and determined the scale (micro- and/or nanoscale) and the nature of the changes that took place. The correlation of the experimental measurements to the simulation findings was obtained by the comparison of the experimentally measured and numerically computed fractured volume of the workpiece. In our future work, we aim to extend the capabilities of the FEM model on the modification and control of the morphological behavior of the surface roughness profile under a sequential irradiation of laser pulses. The corresponding experiments that will be performed and compared to the numerical outcomes will provide a complete surface roughness modification and control method.
The determination of these positions, where changes in surface roughness take place after their interaction with a single laser pulse in this energy regime, is of major importance. Applications where changes of matter of micro- or nanoscale order affect the material structure depend on this knowledge, since at these scales different types of cracks may initialize, ripples may be formed, and mechanical and optical materials’ properties may change. Furthermore, the combination of numerical modeling with the experimental methodology presented in this study constitutes a promising tool for an in-depth analysis of the influence of heat parameters on the surface roughness of solid materials and can be further extended to various laser–solid interactions, such as laser machining and micromachining applications, solid materials’ testing using generated ultrasounds, and laser material processing. Higher spatial modeling of the micro-roughness characteristics will be further included in future work that will concern the influence of the surface roughness on the generation and propagation of ultrasounds based on the knowledge gained from this work, while the energy absorption on the rough surface will be treated by initially performing a ray-tracing analysis.


 ,
, 


