
Quantitative Set-Based Design to Inform Design Teams


Abstract
:Featured Application
Abstract
1. Introduction
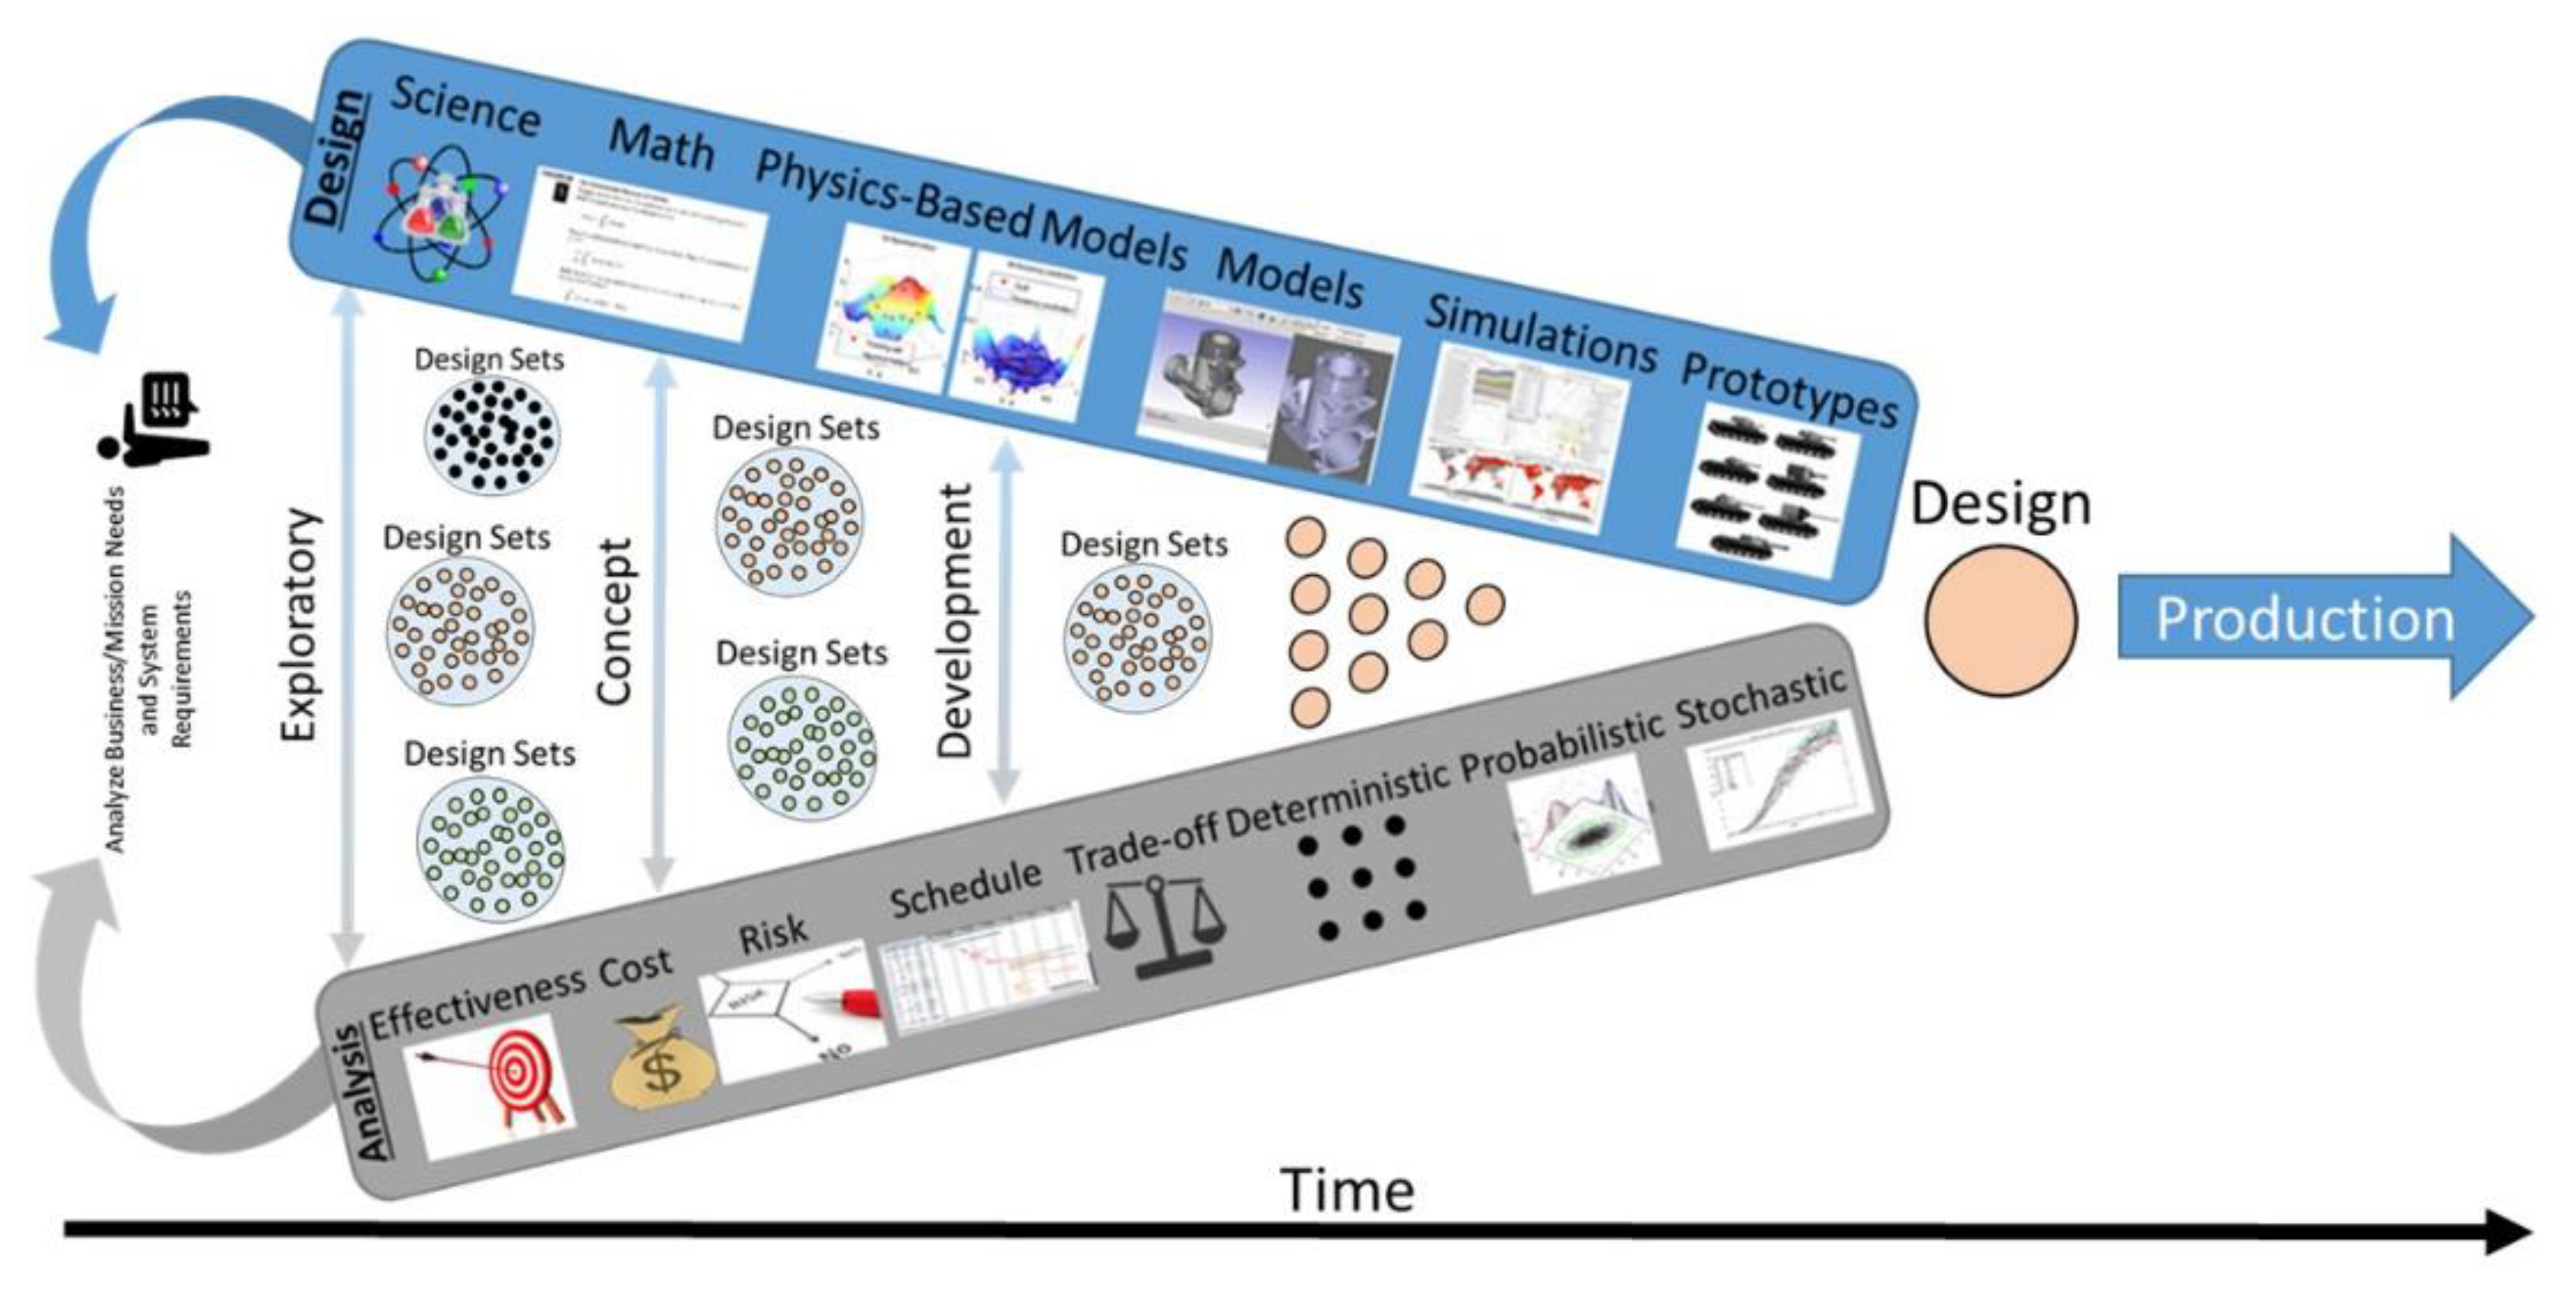
2. Set-Based Design
2.1. Point-Based versus Set-Based Design
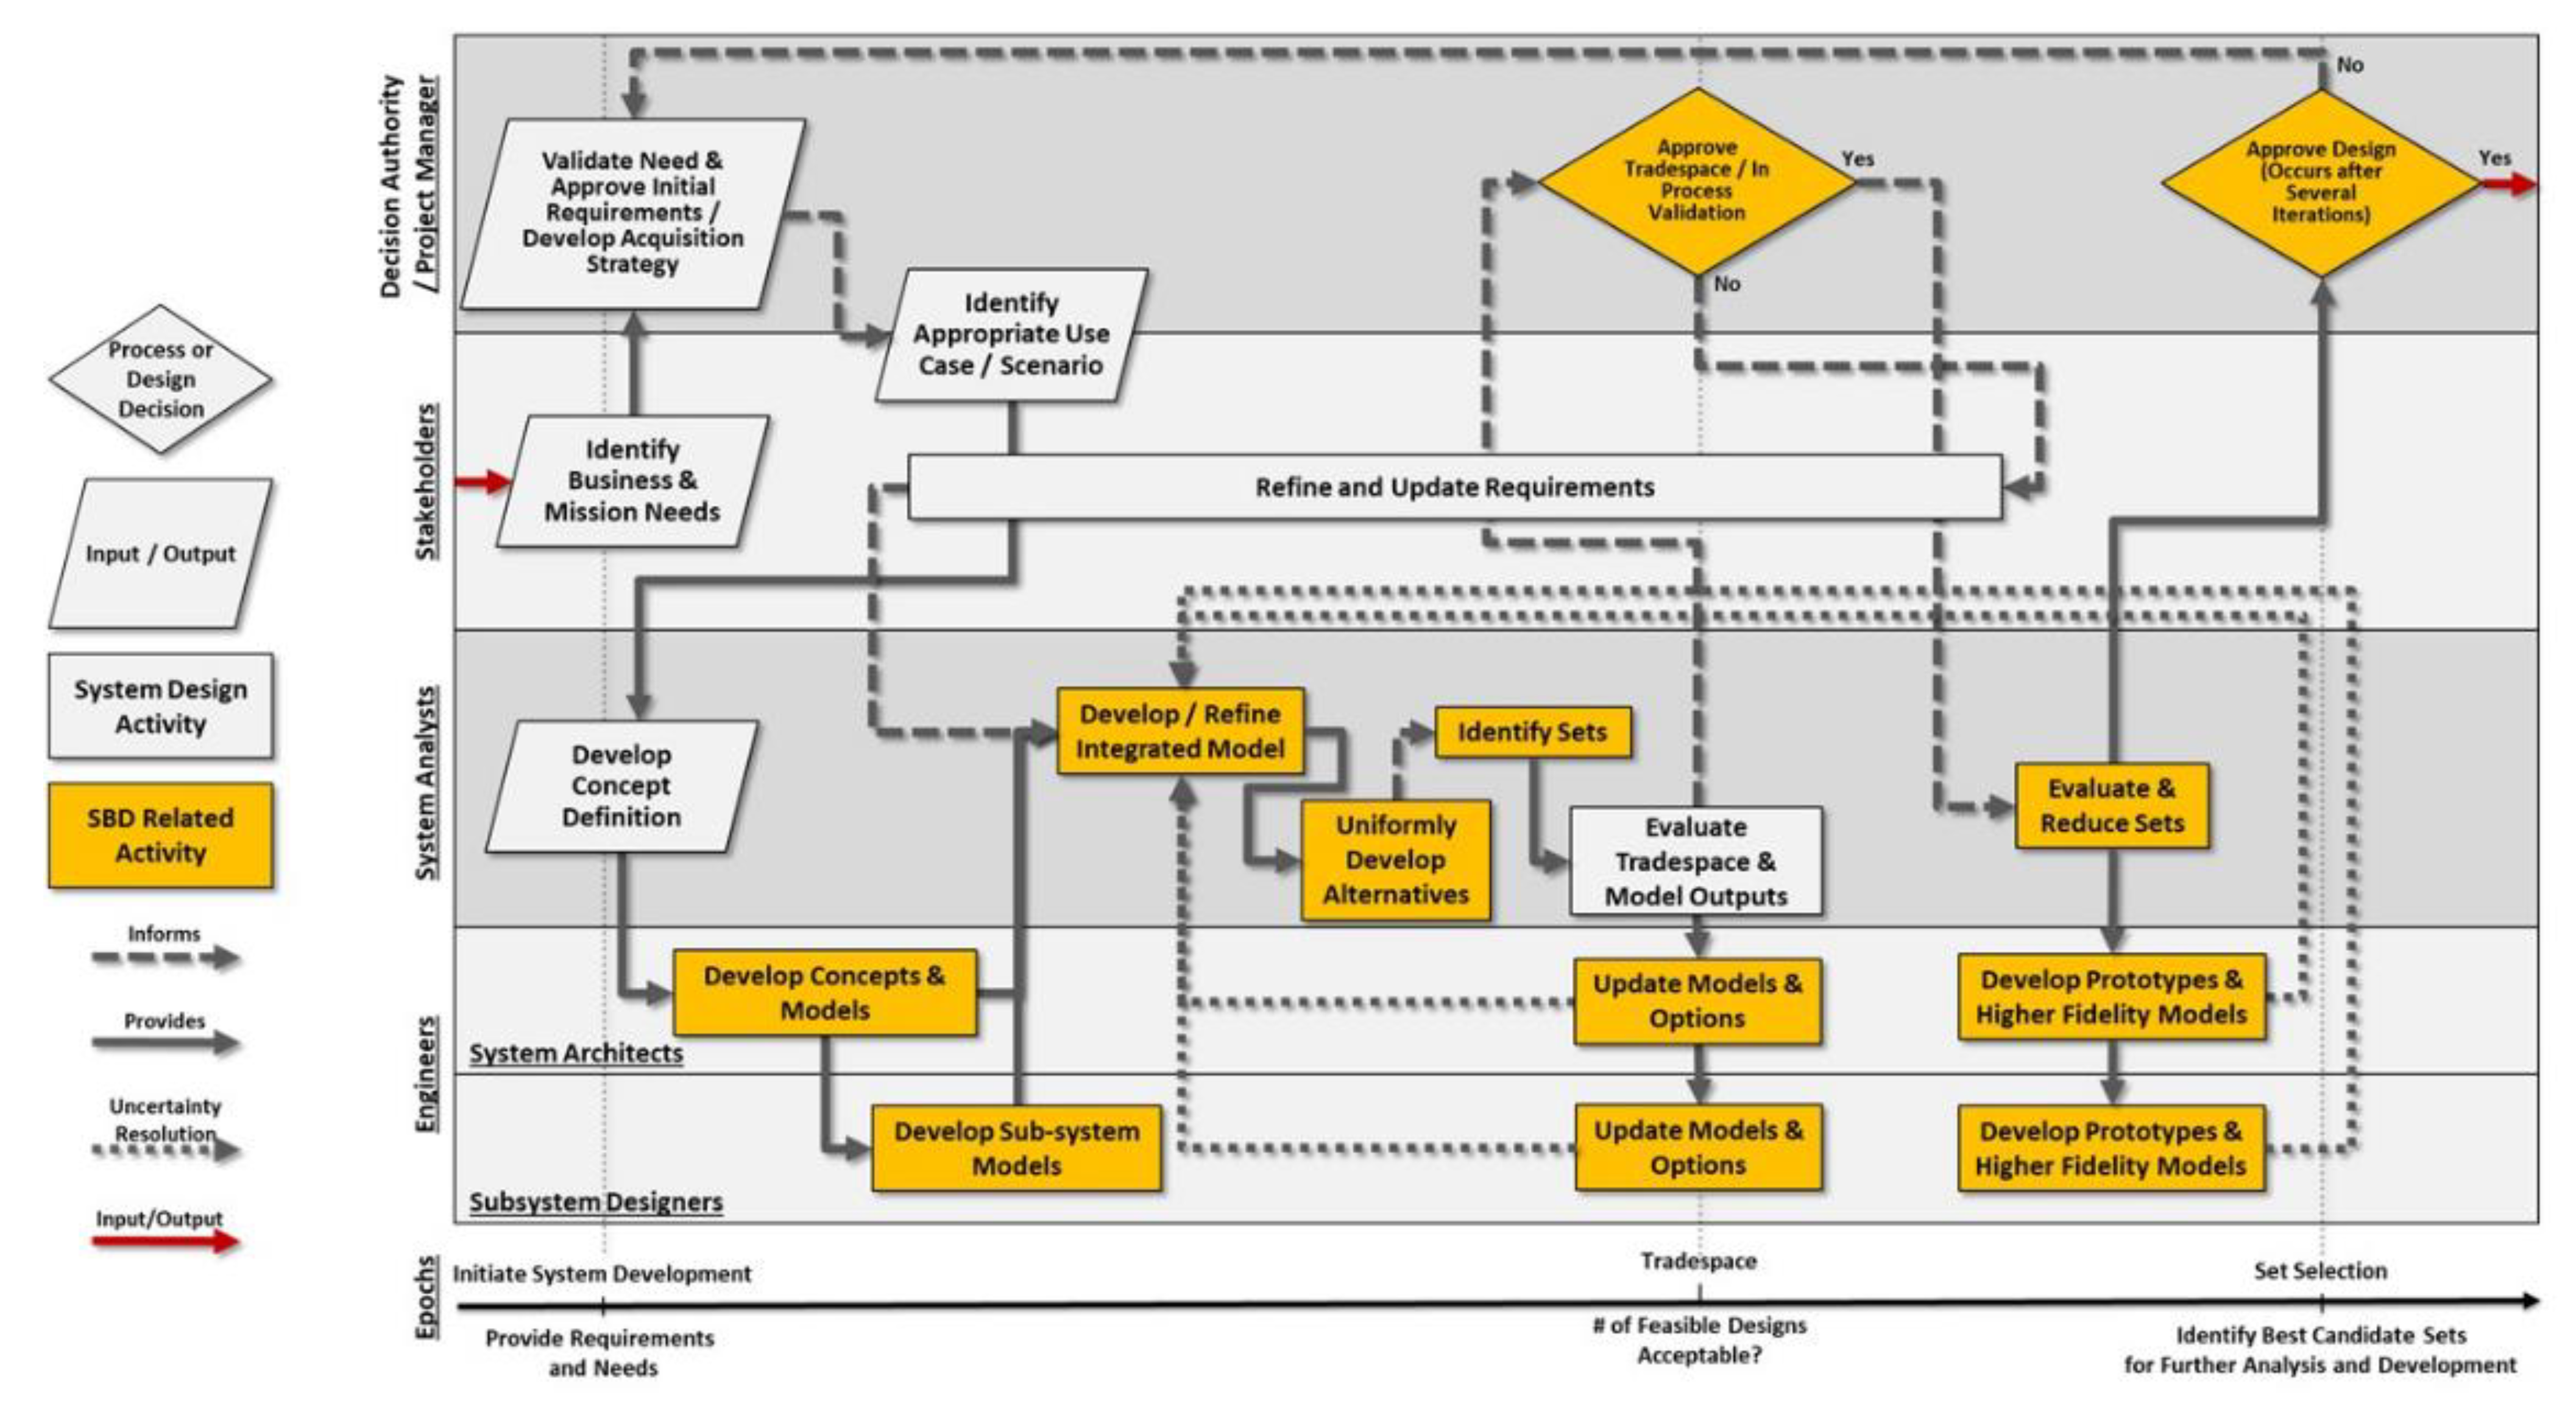
2.2. Set-Based Design Conceptual Framework
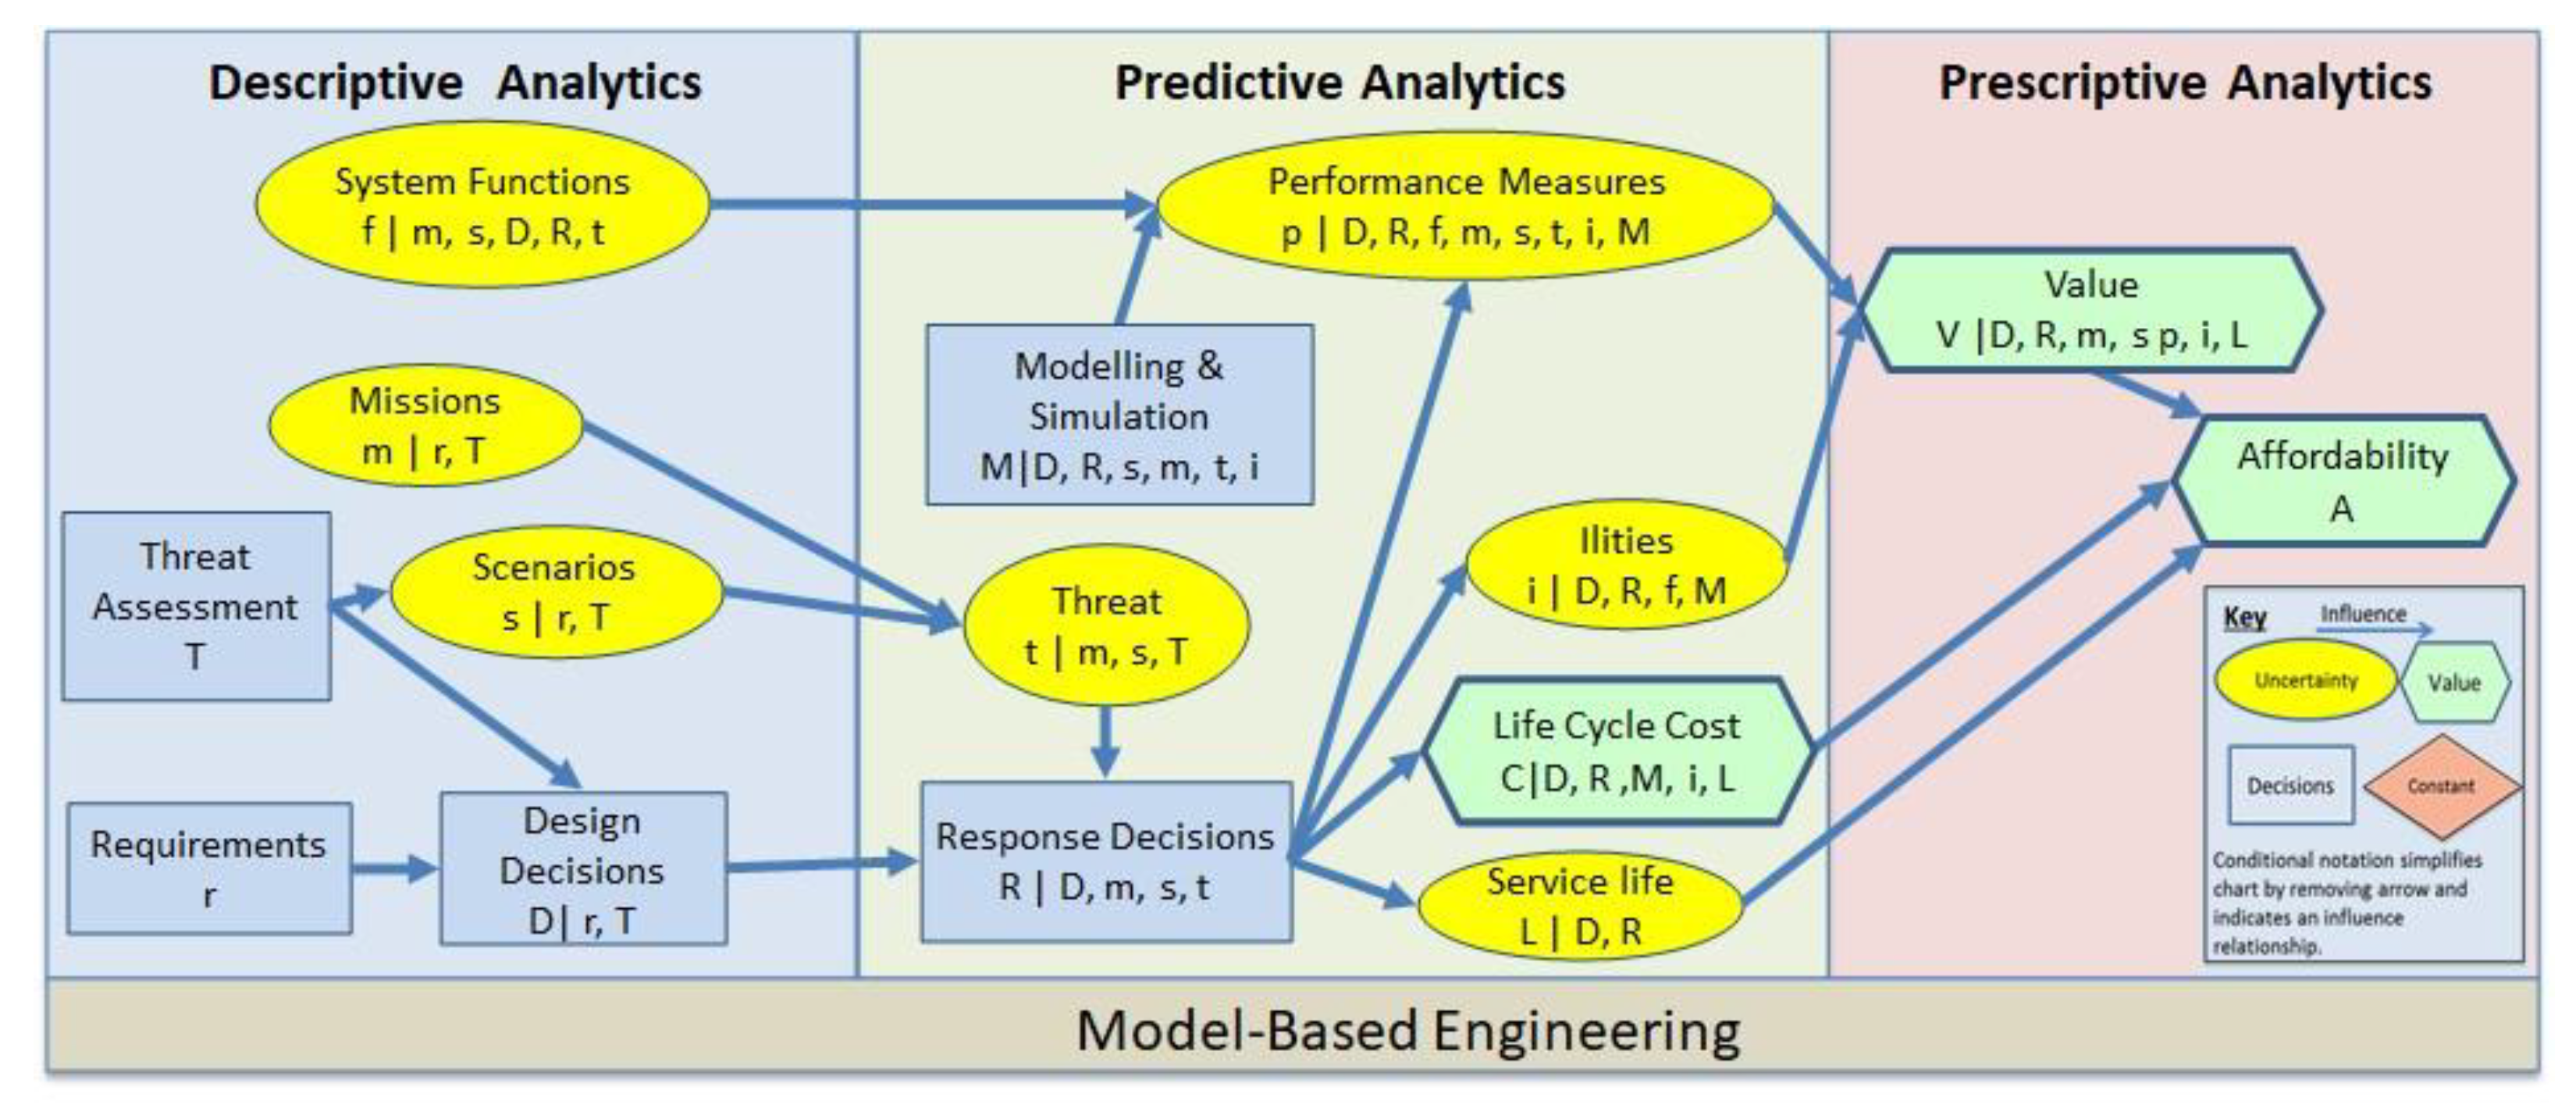
2.3. Quantitative Set-Based Design with System Design Teams
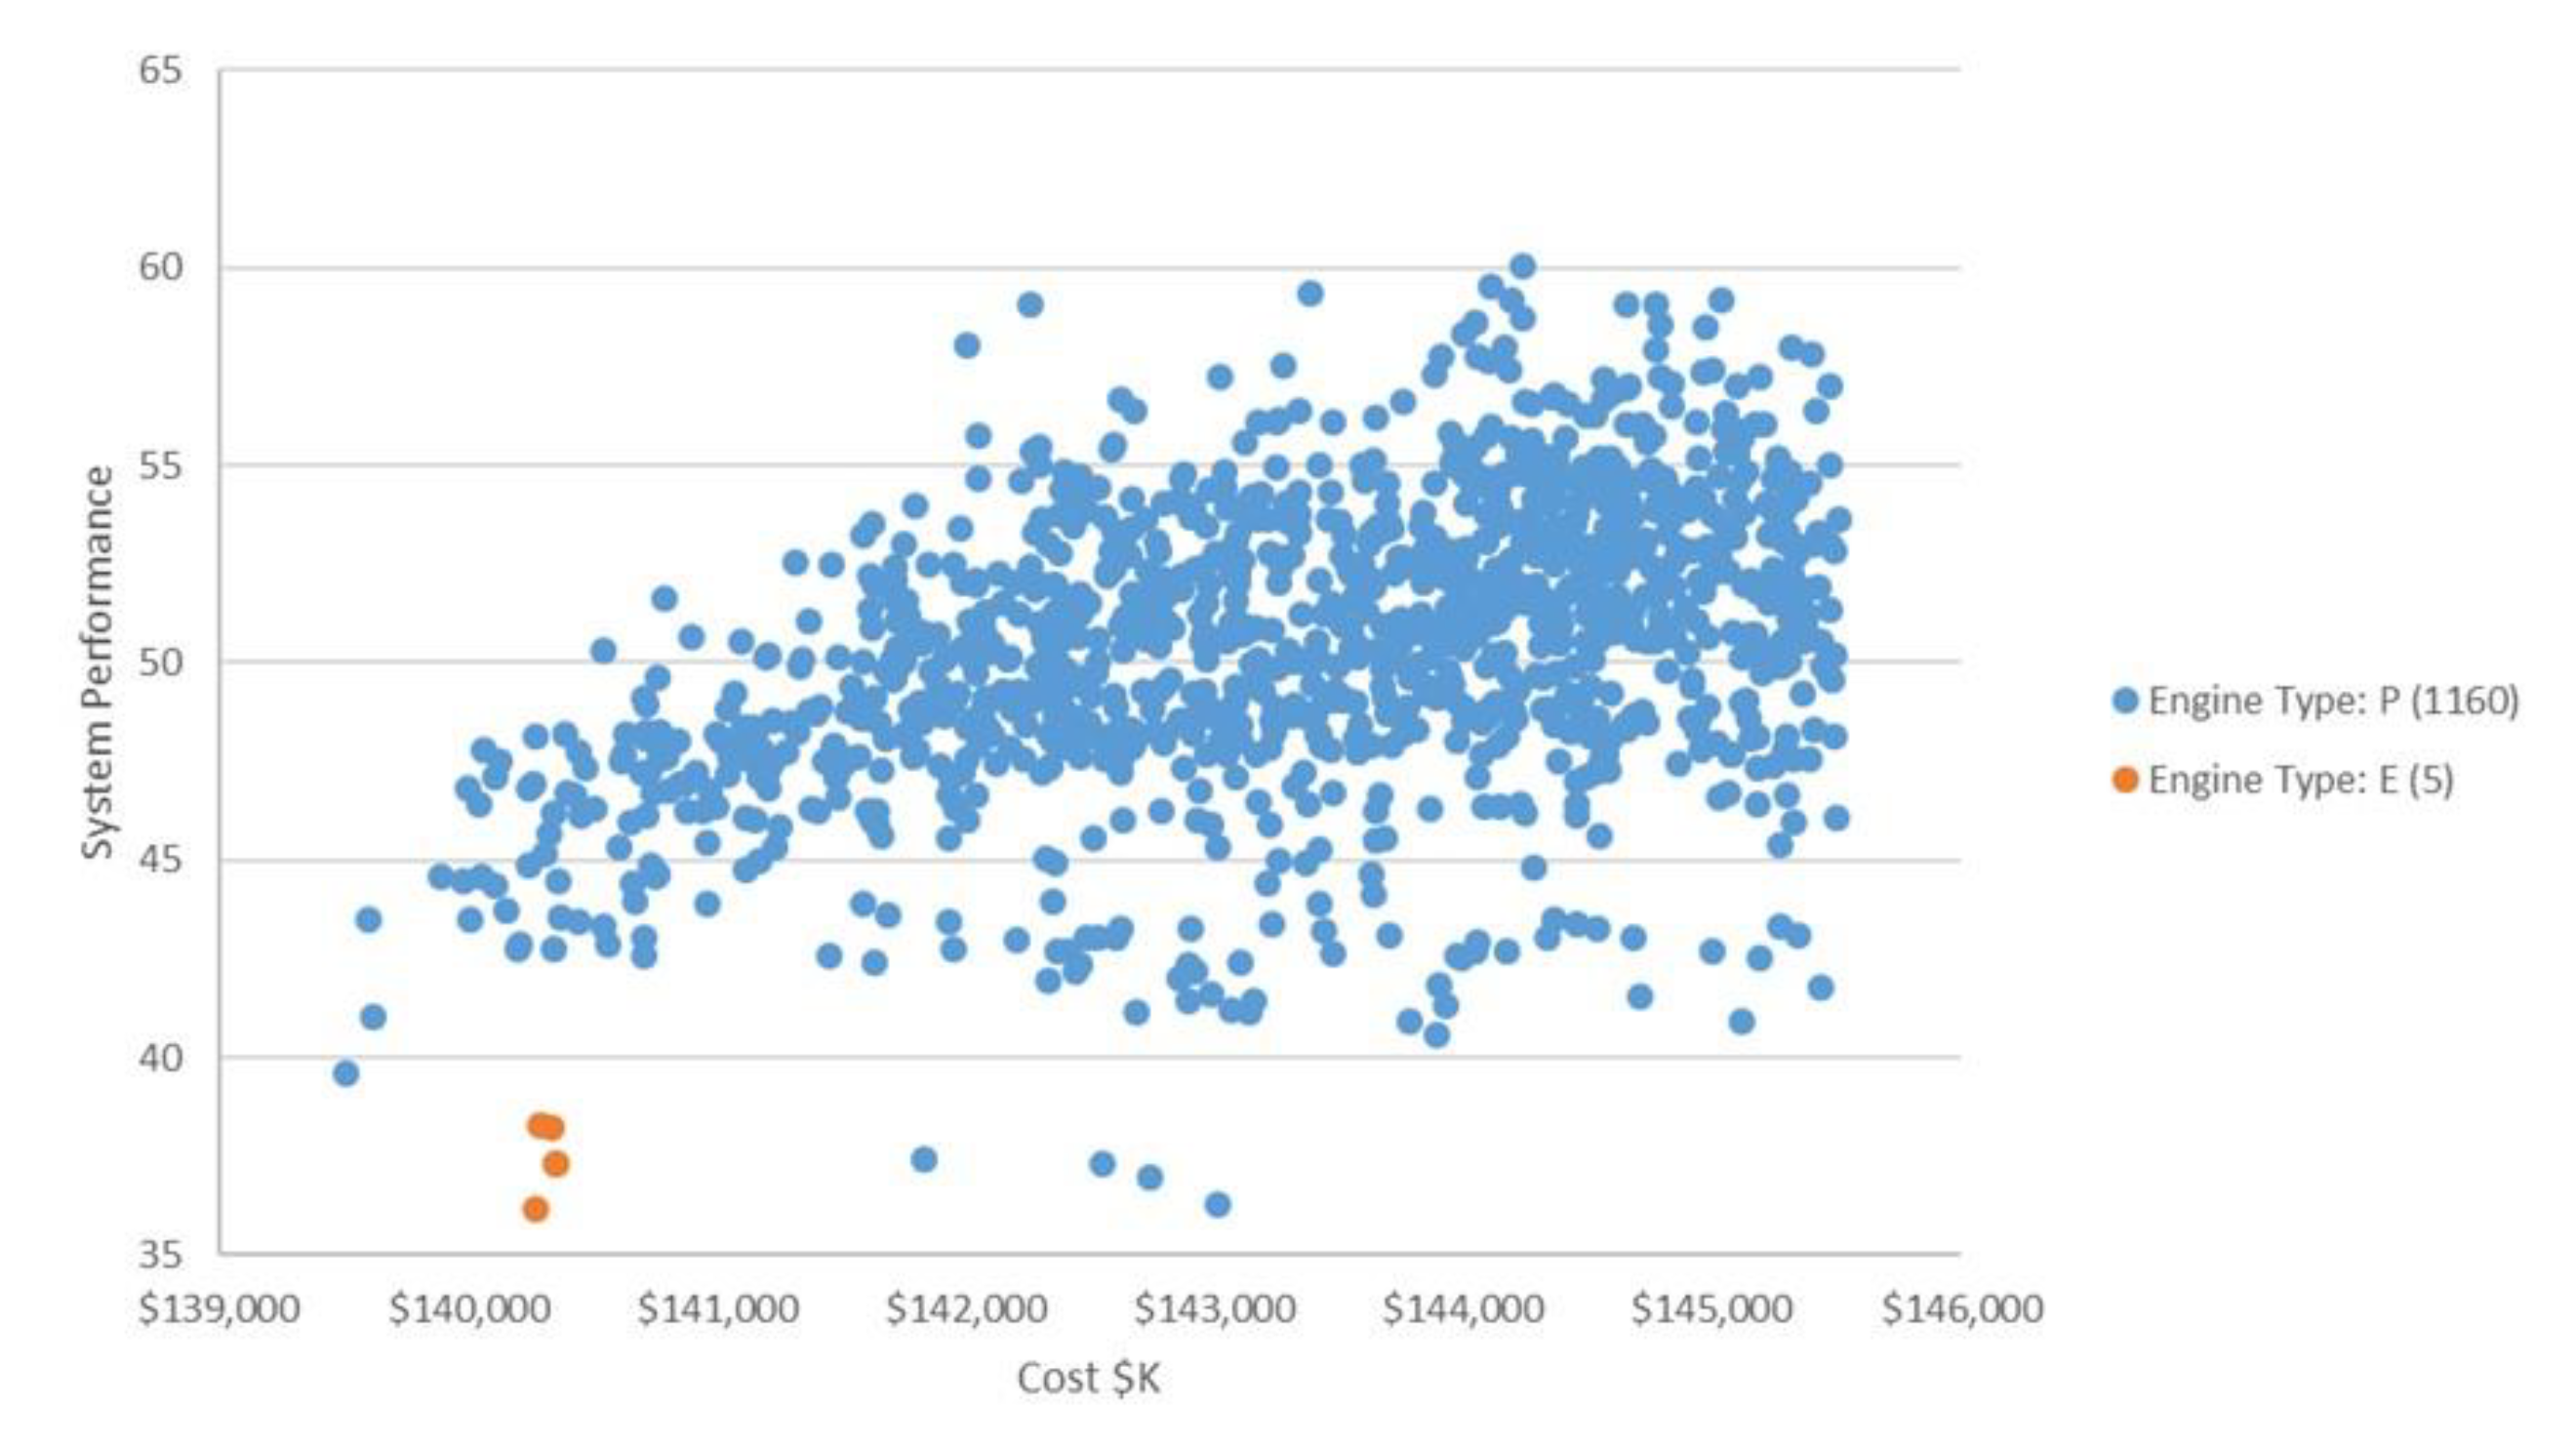
3. Unmanned Aerial Vehicle Case Study
3.1. Overview
3.2. SBD Method Verification
4. Insights from Quantitative Set-Based Design
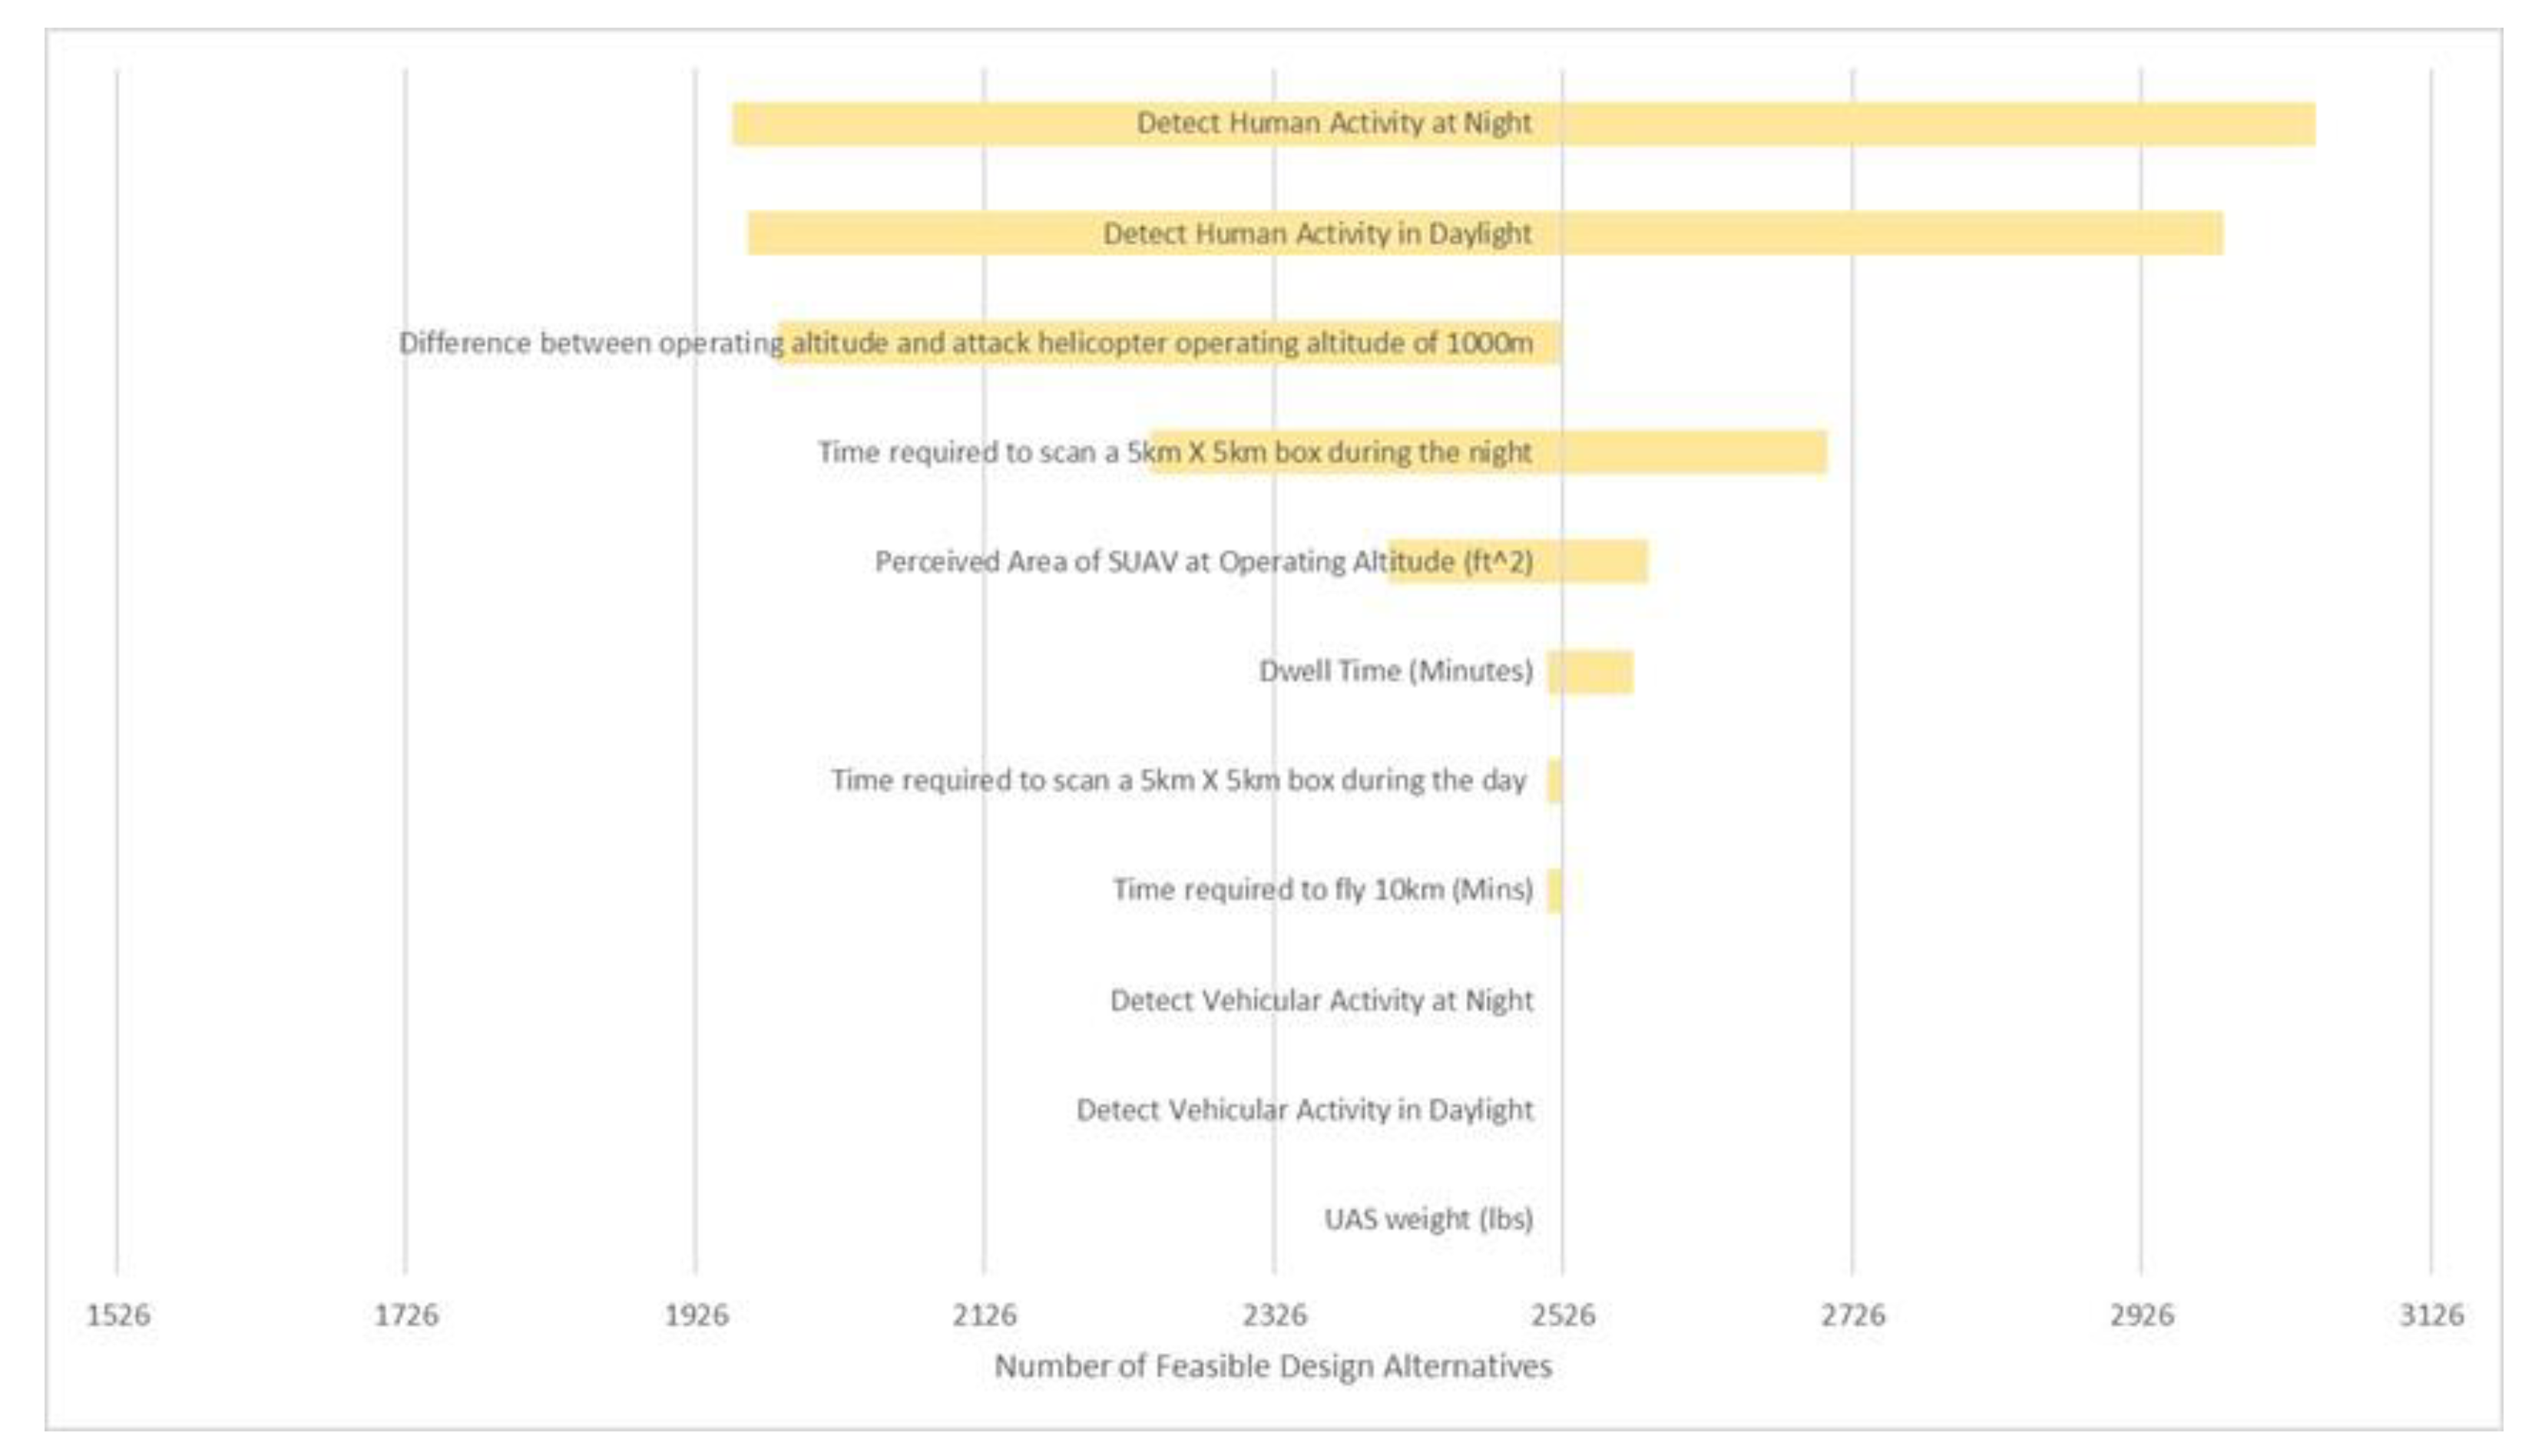
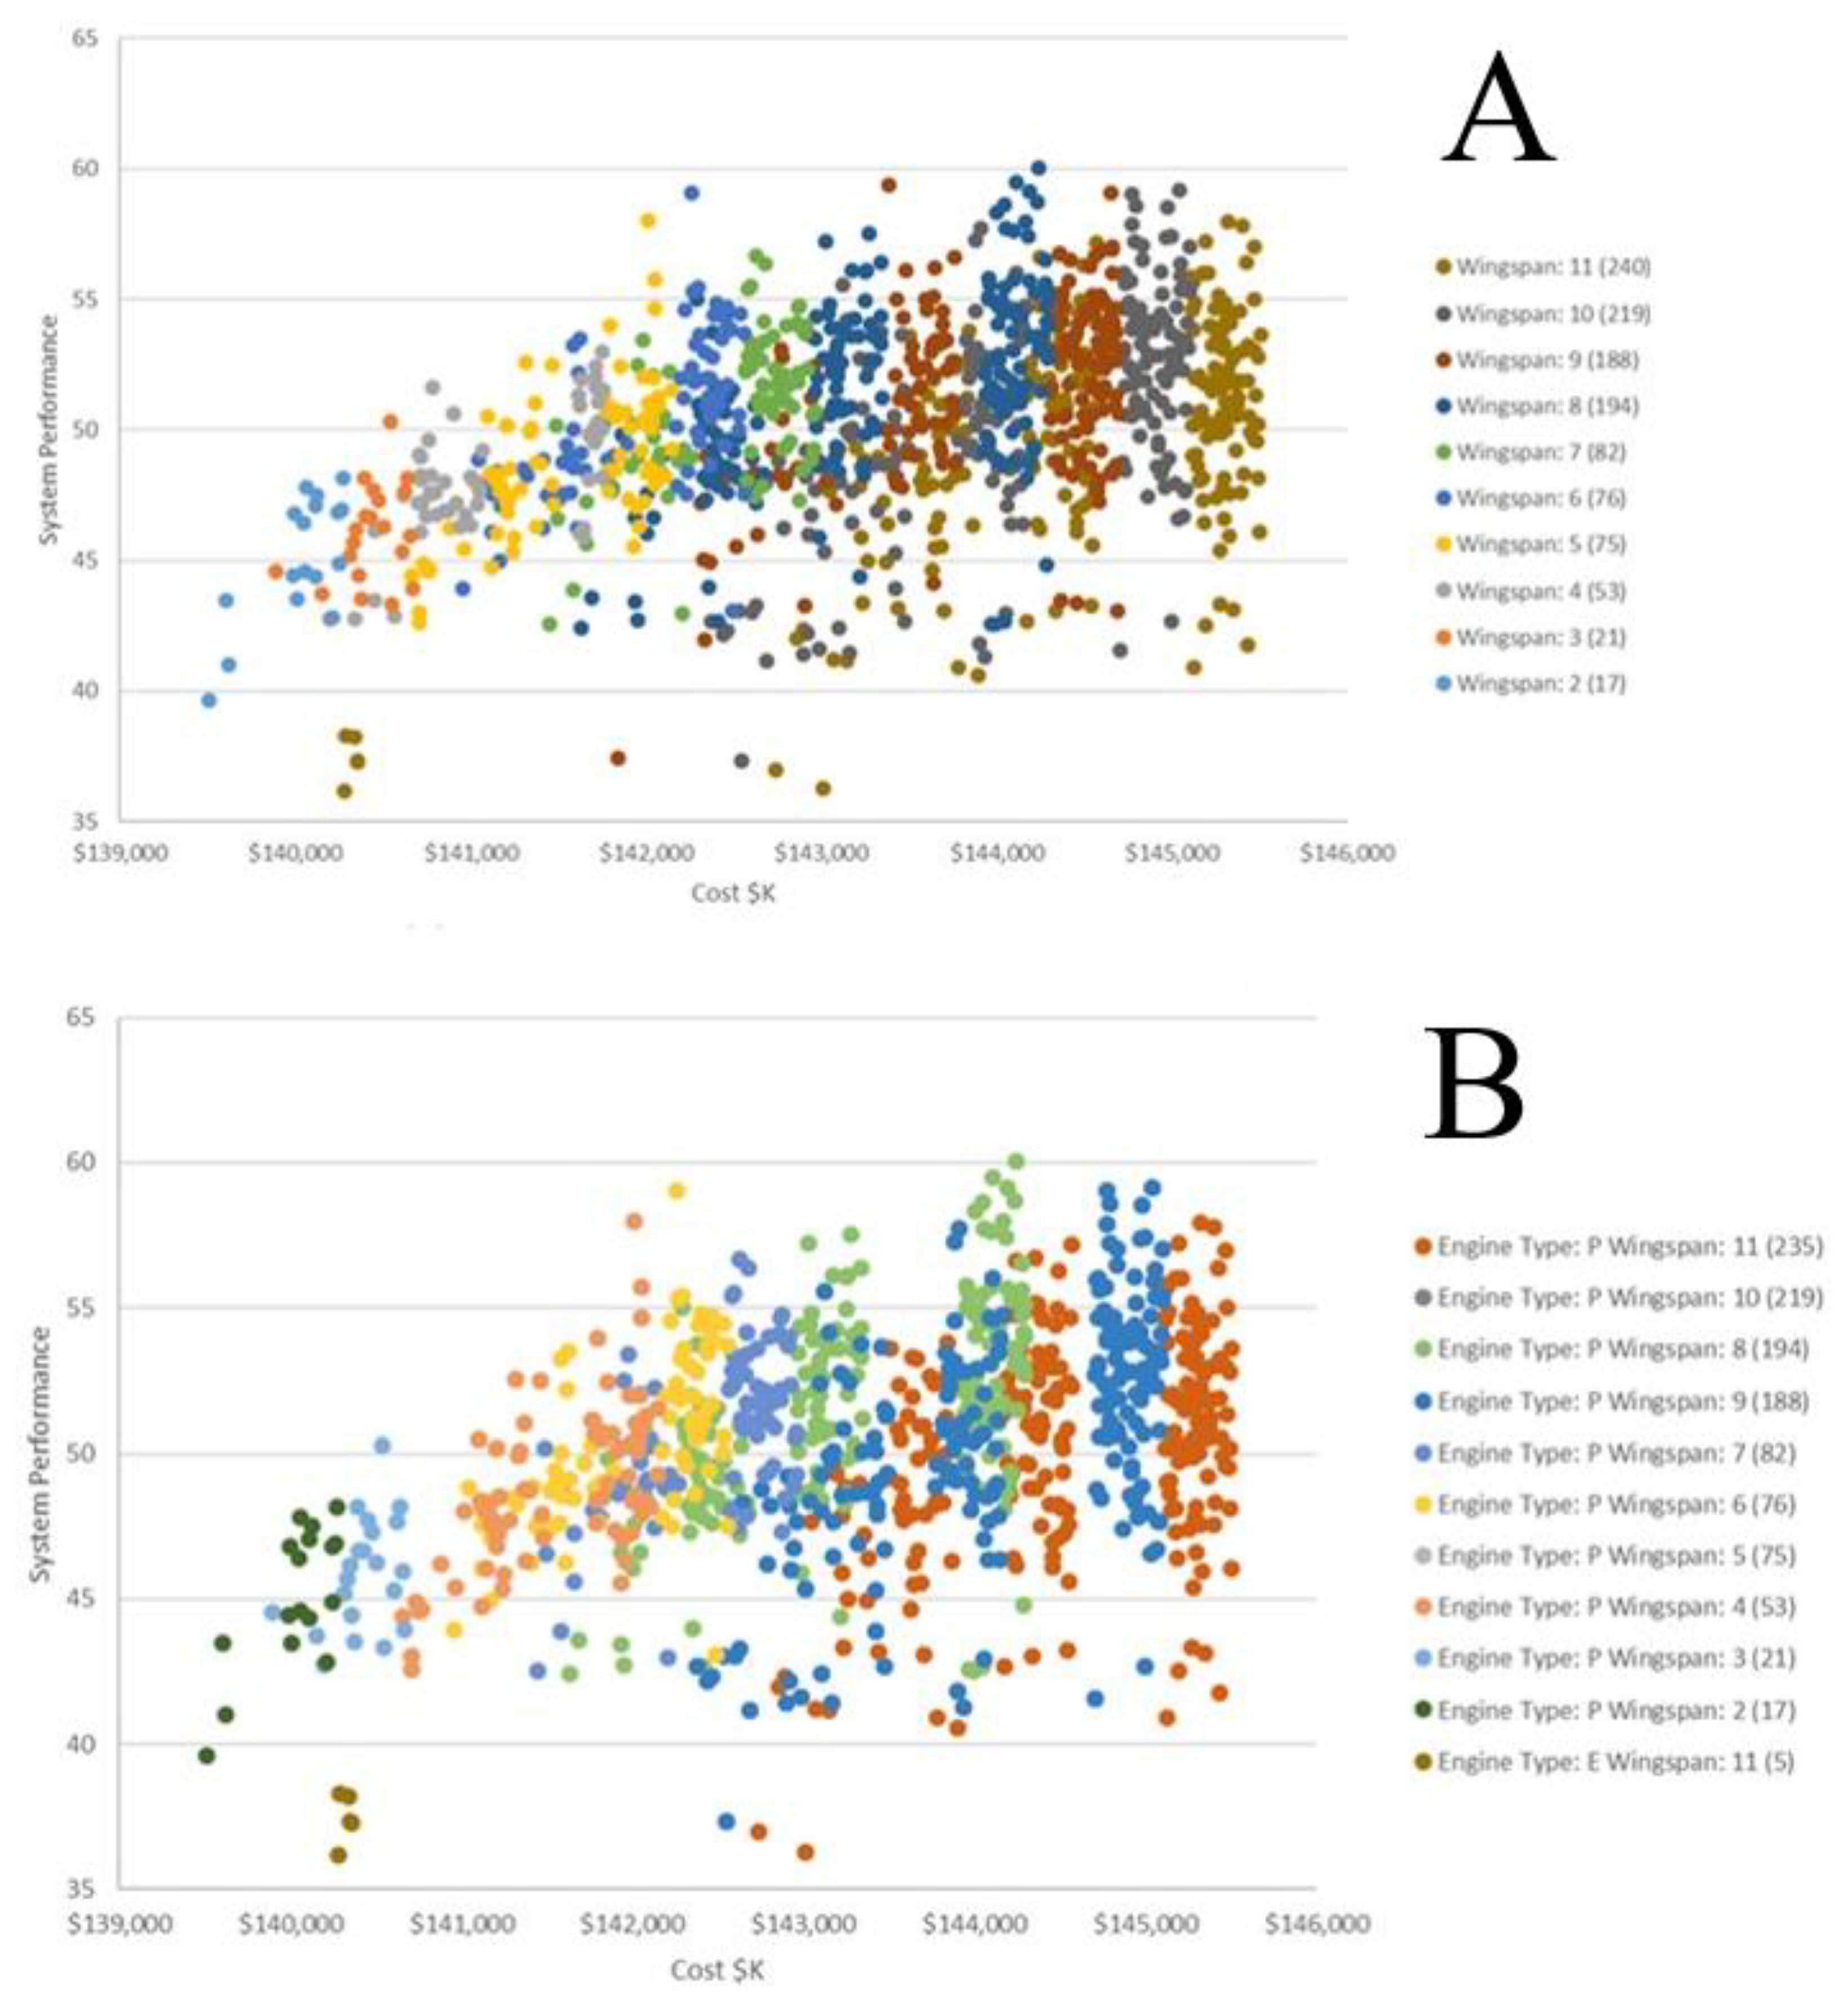
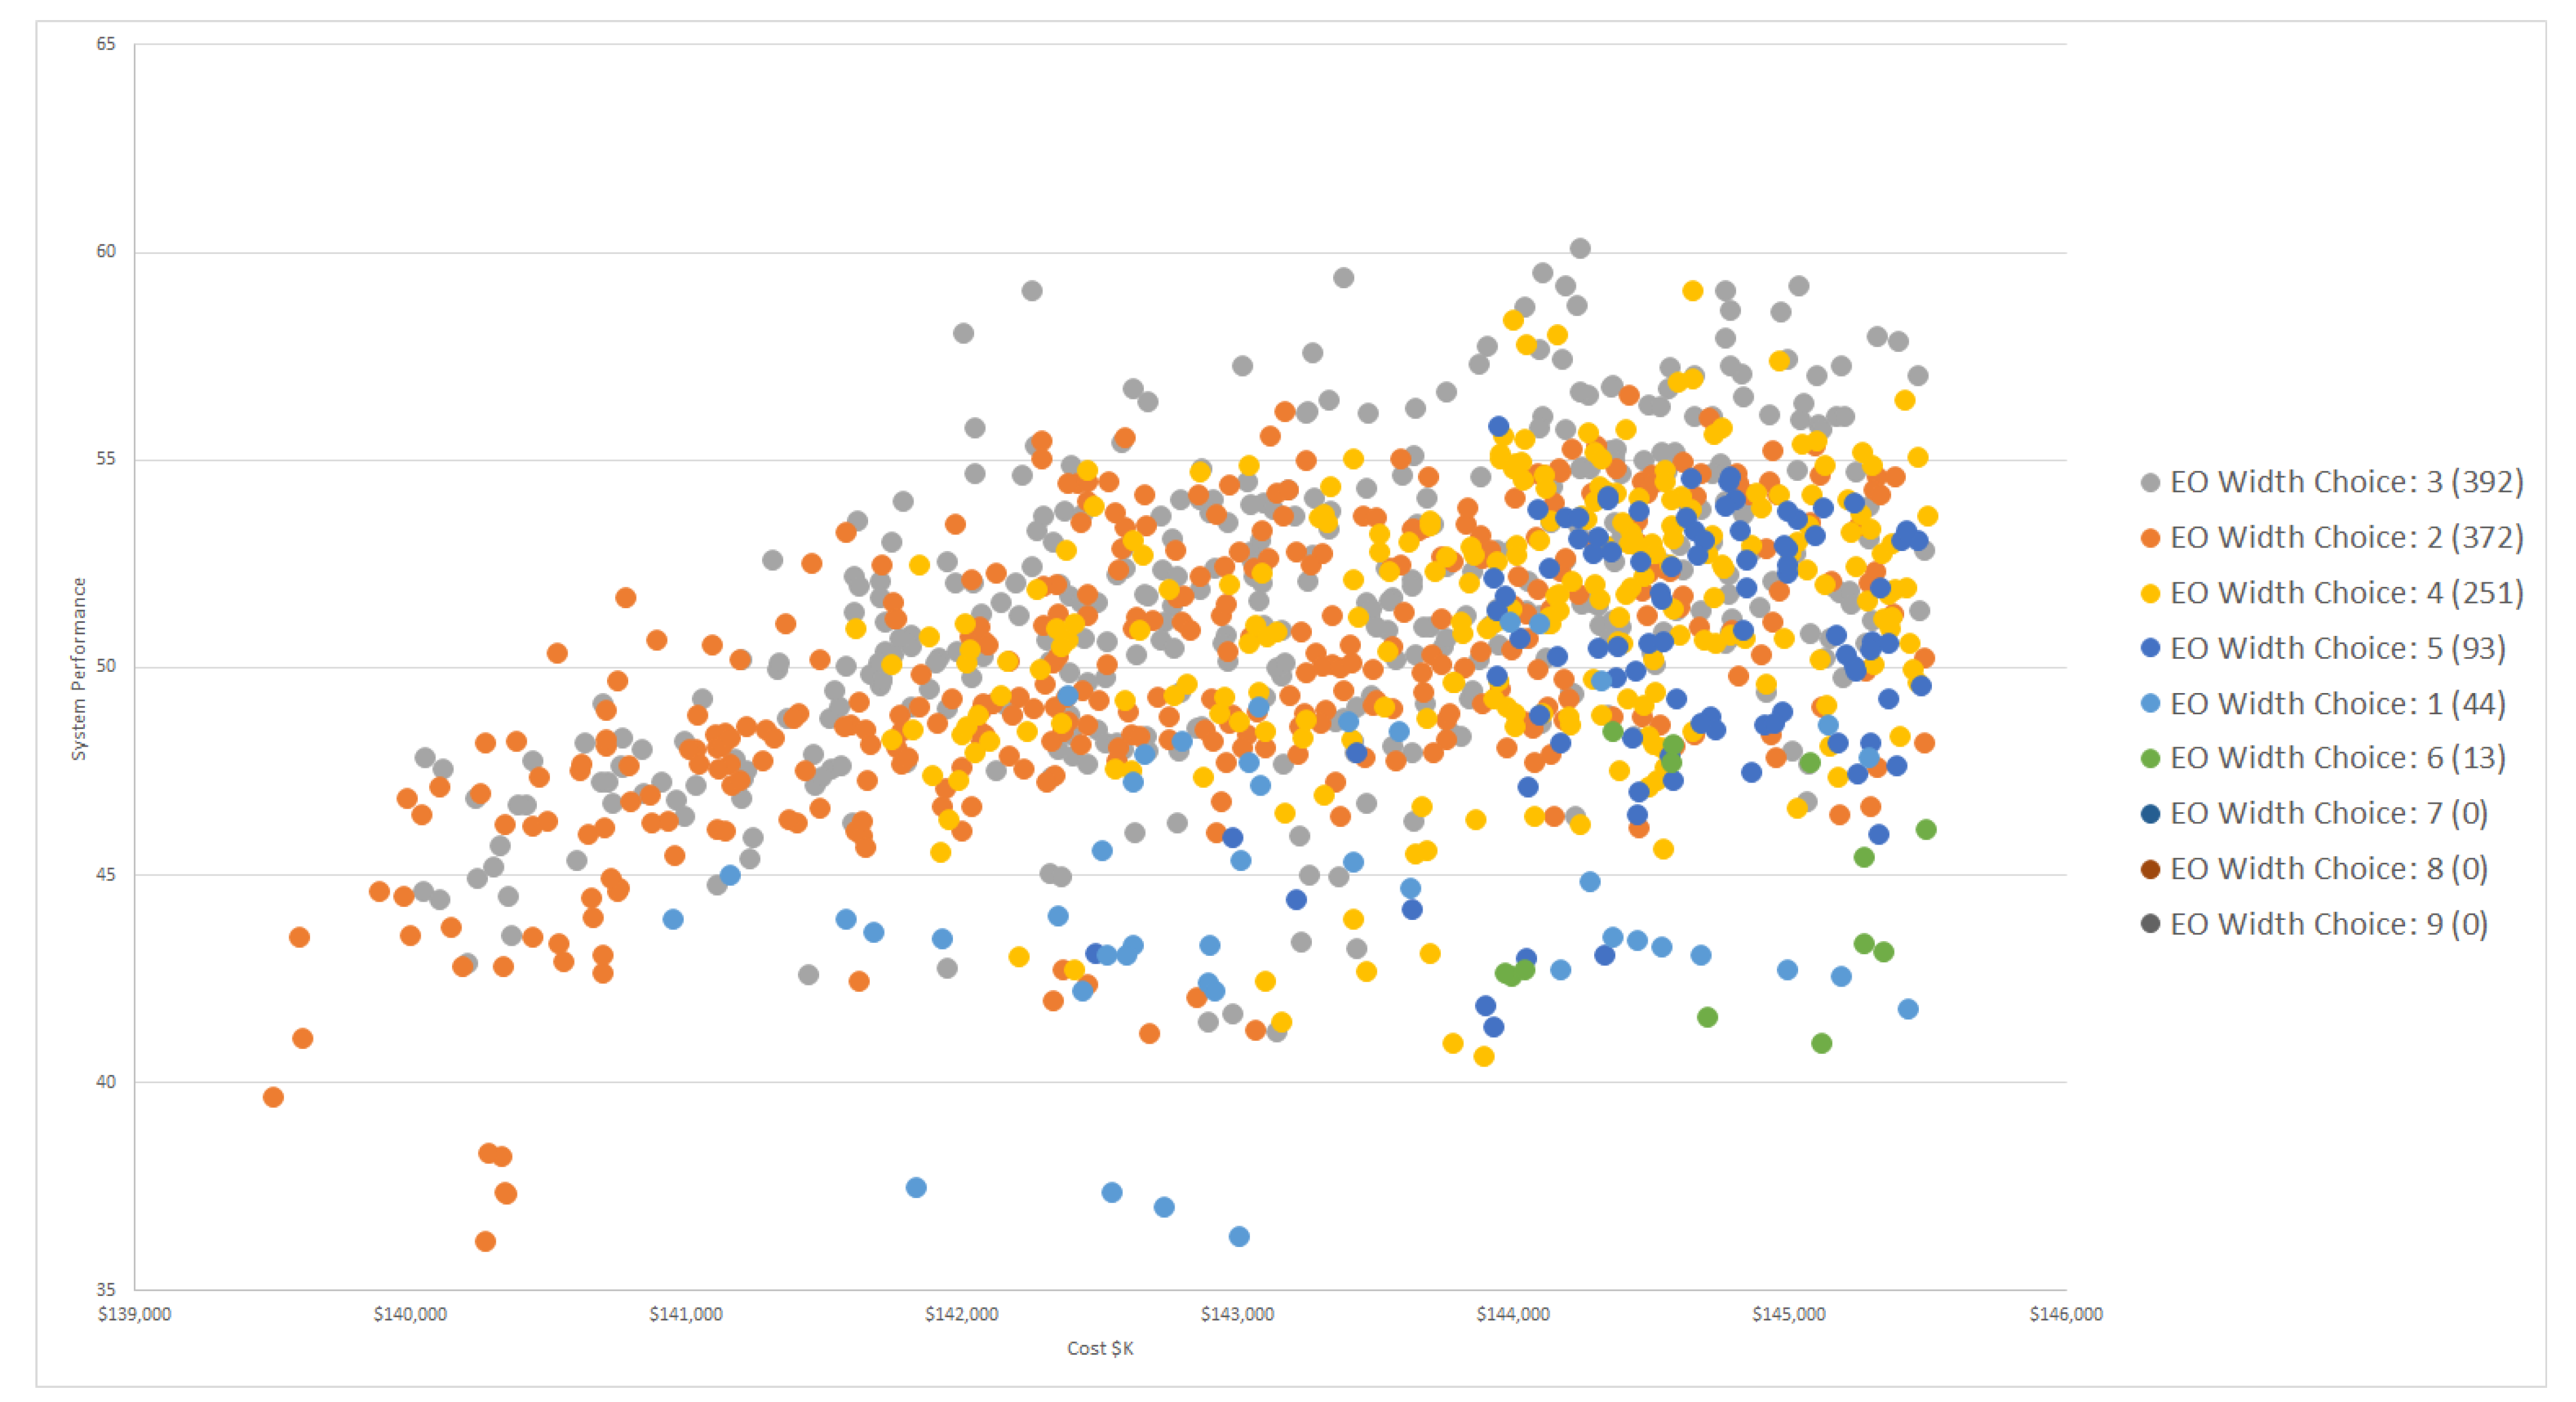
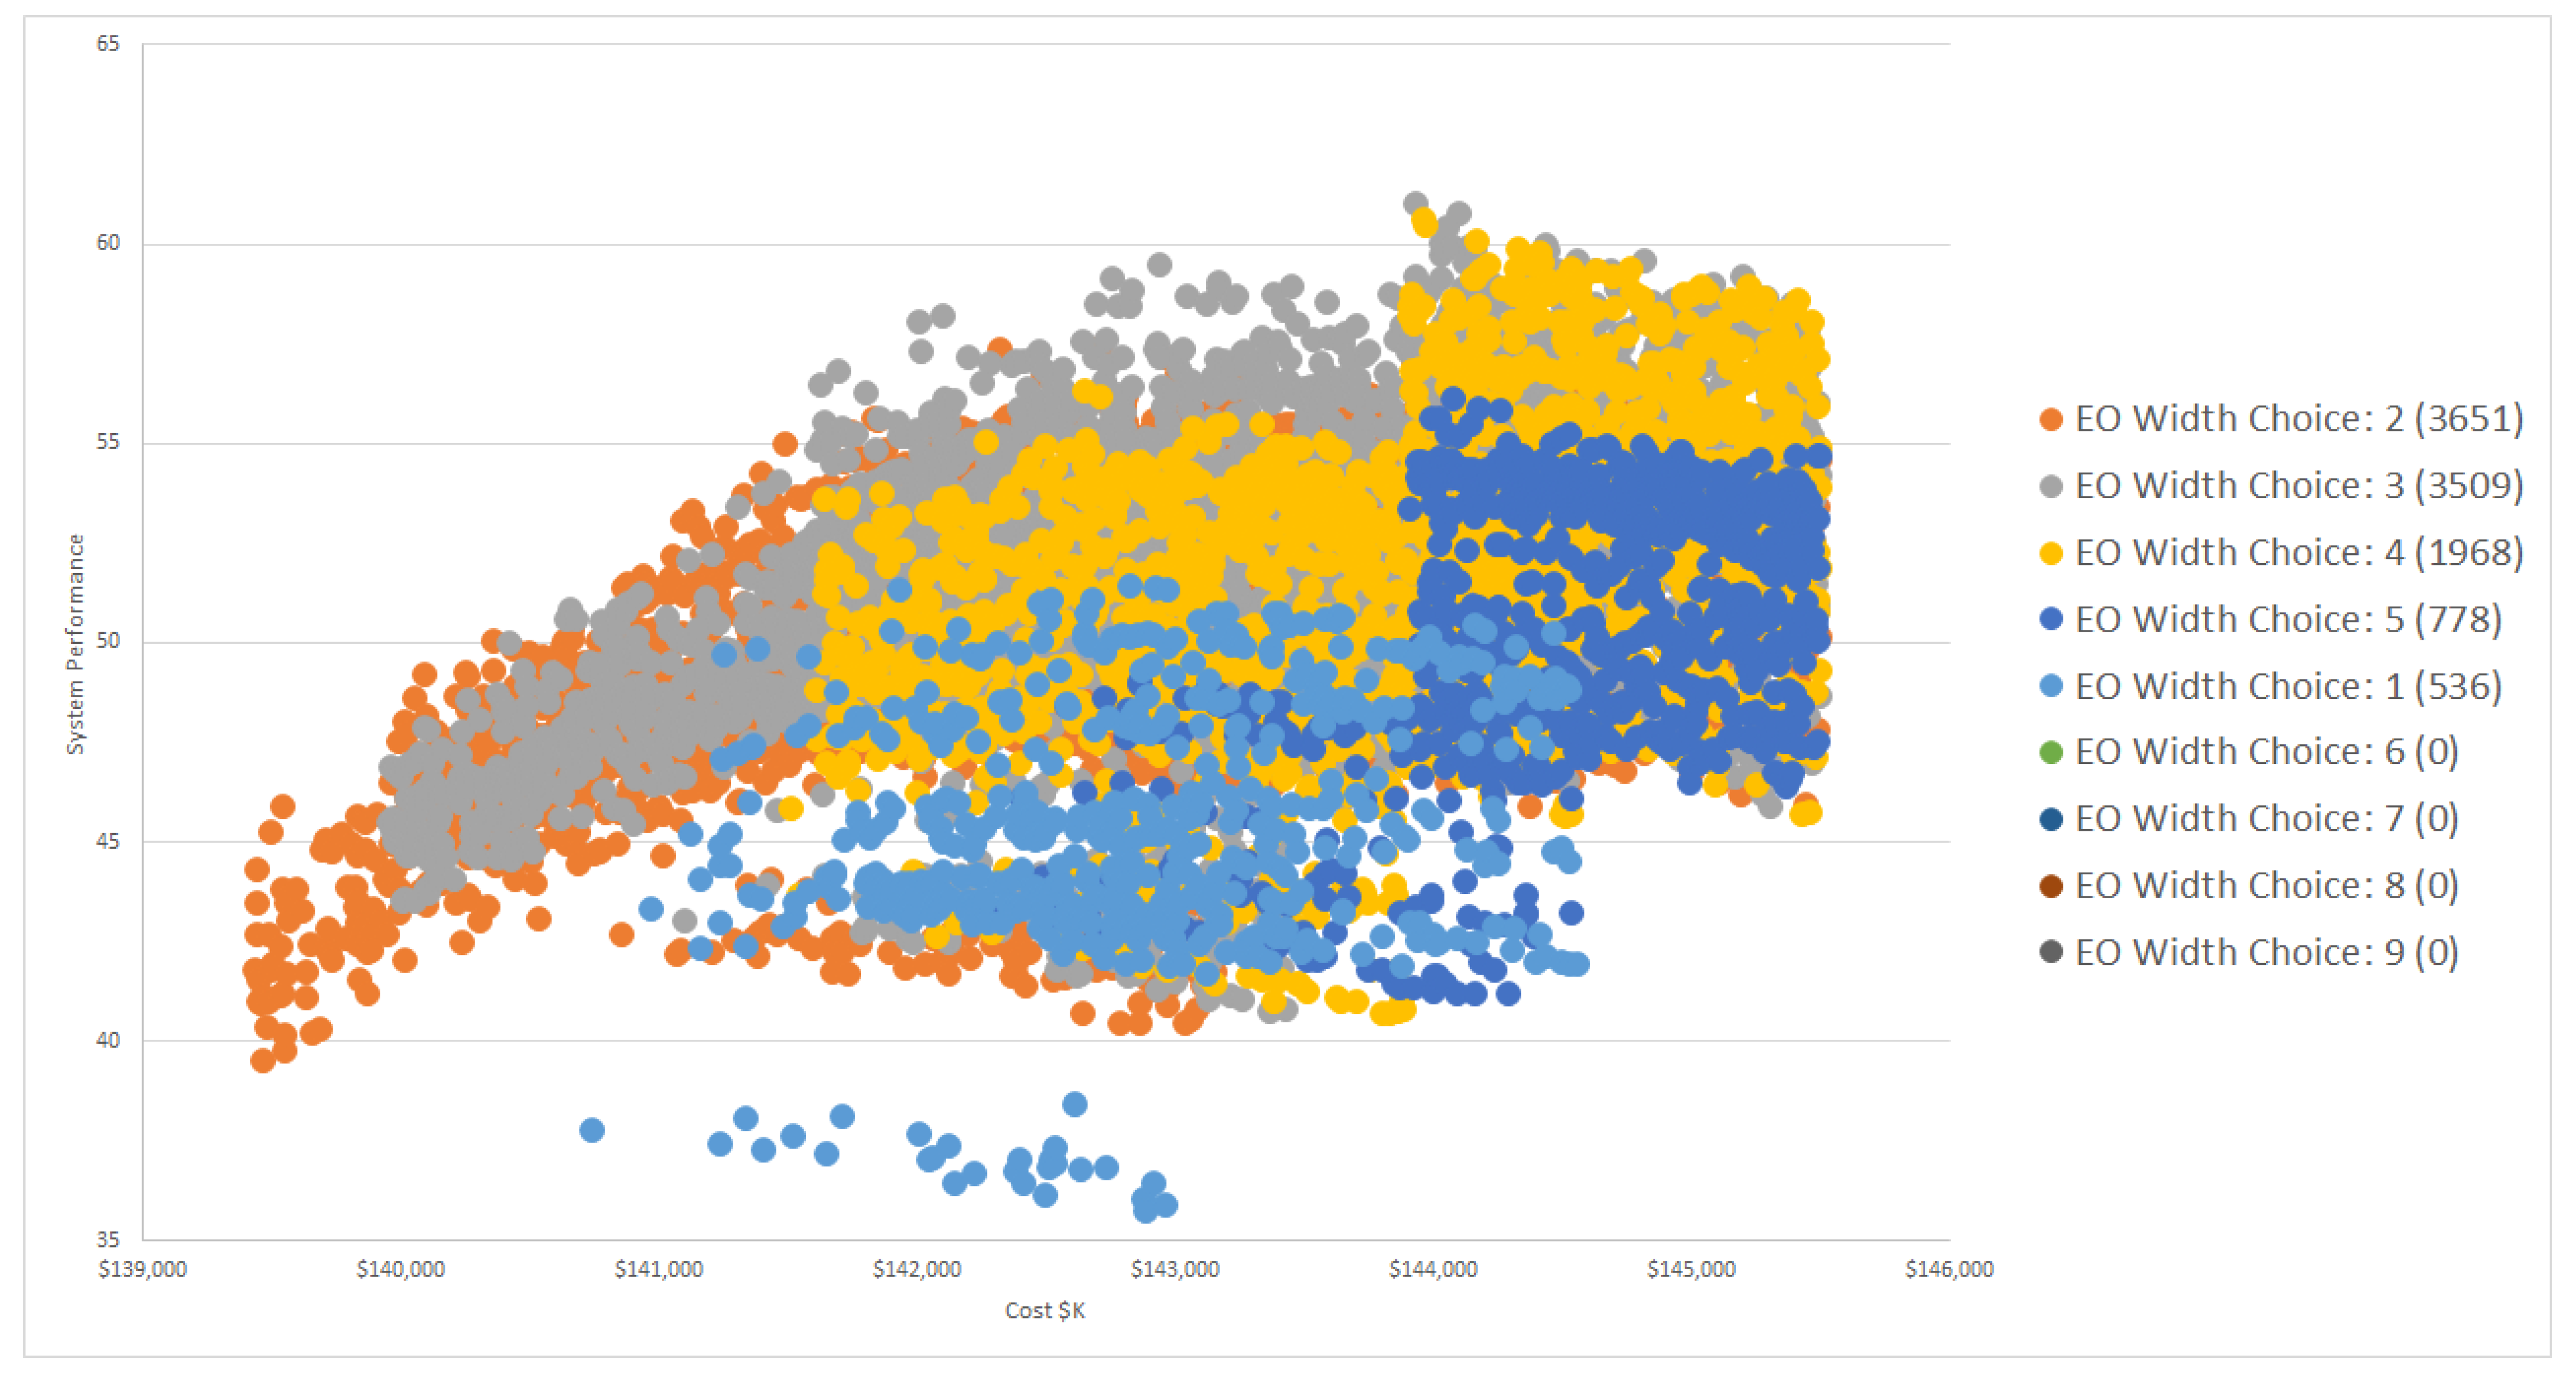
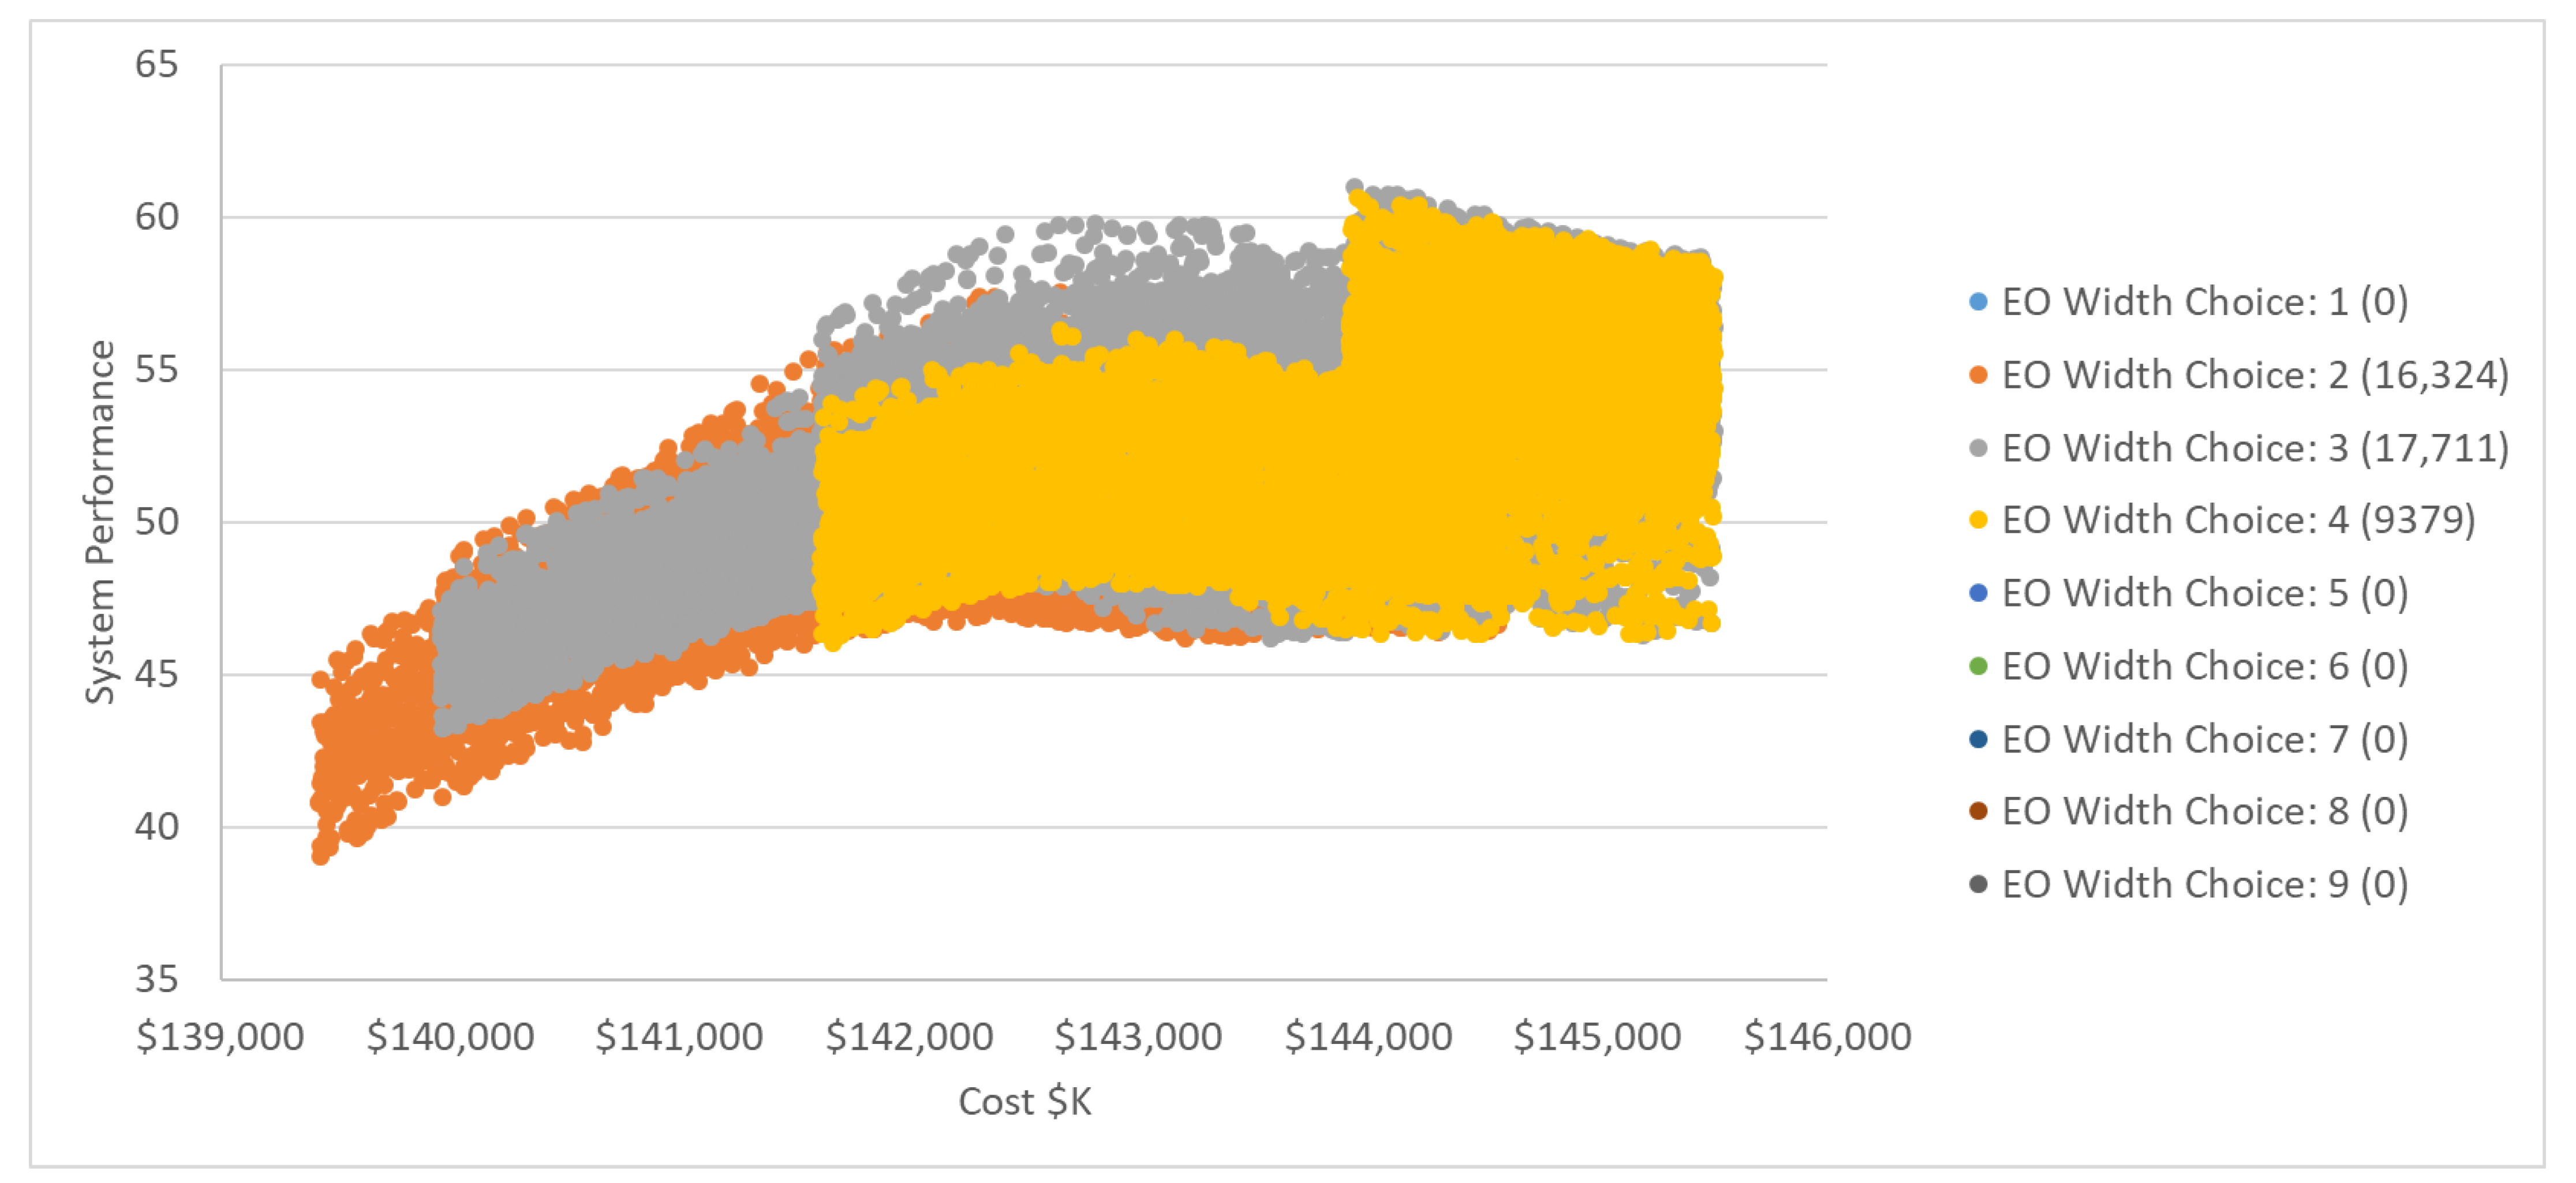
4.1. Informing Requirement Analysis
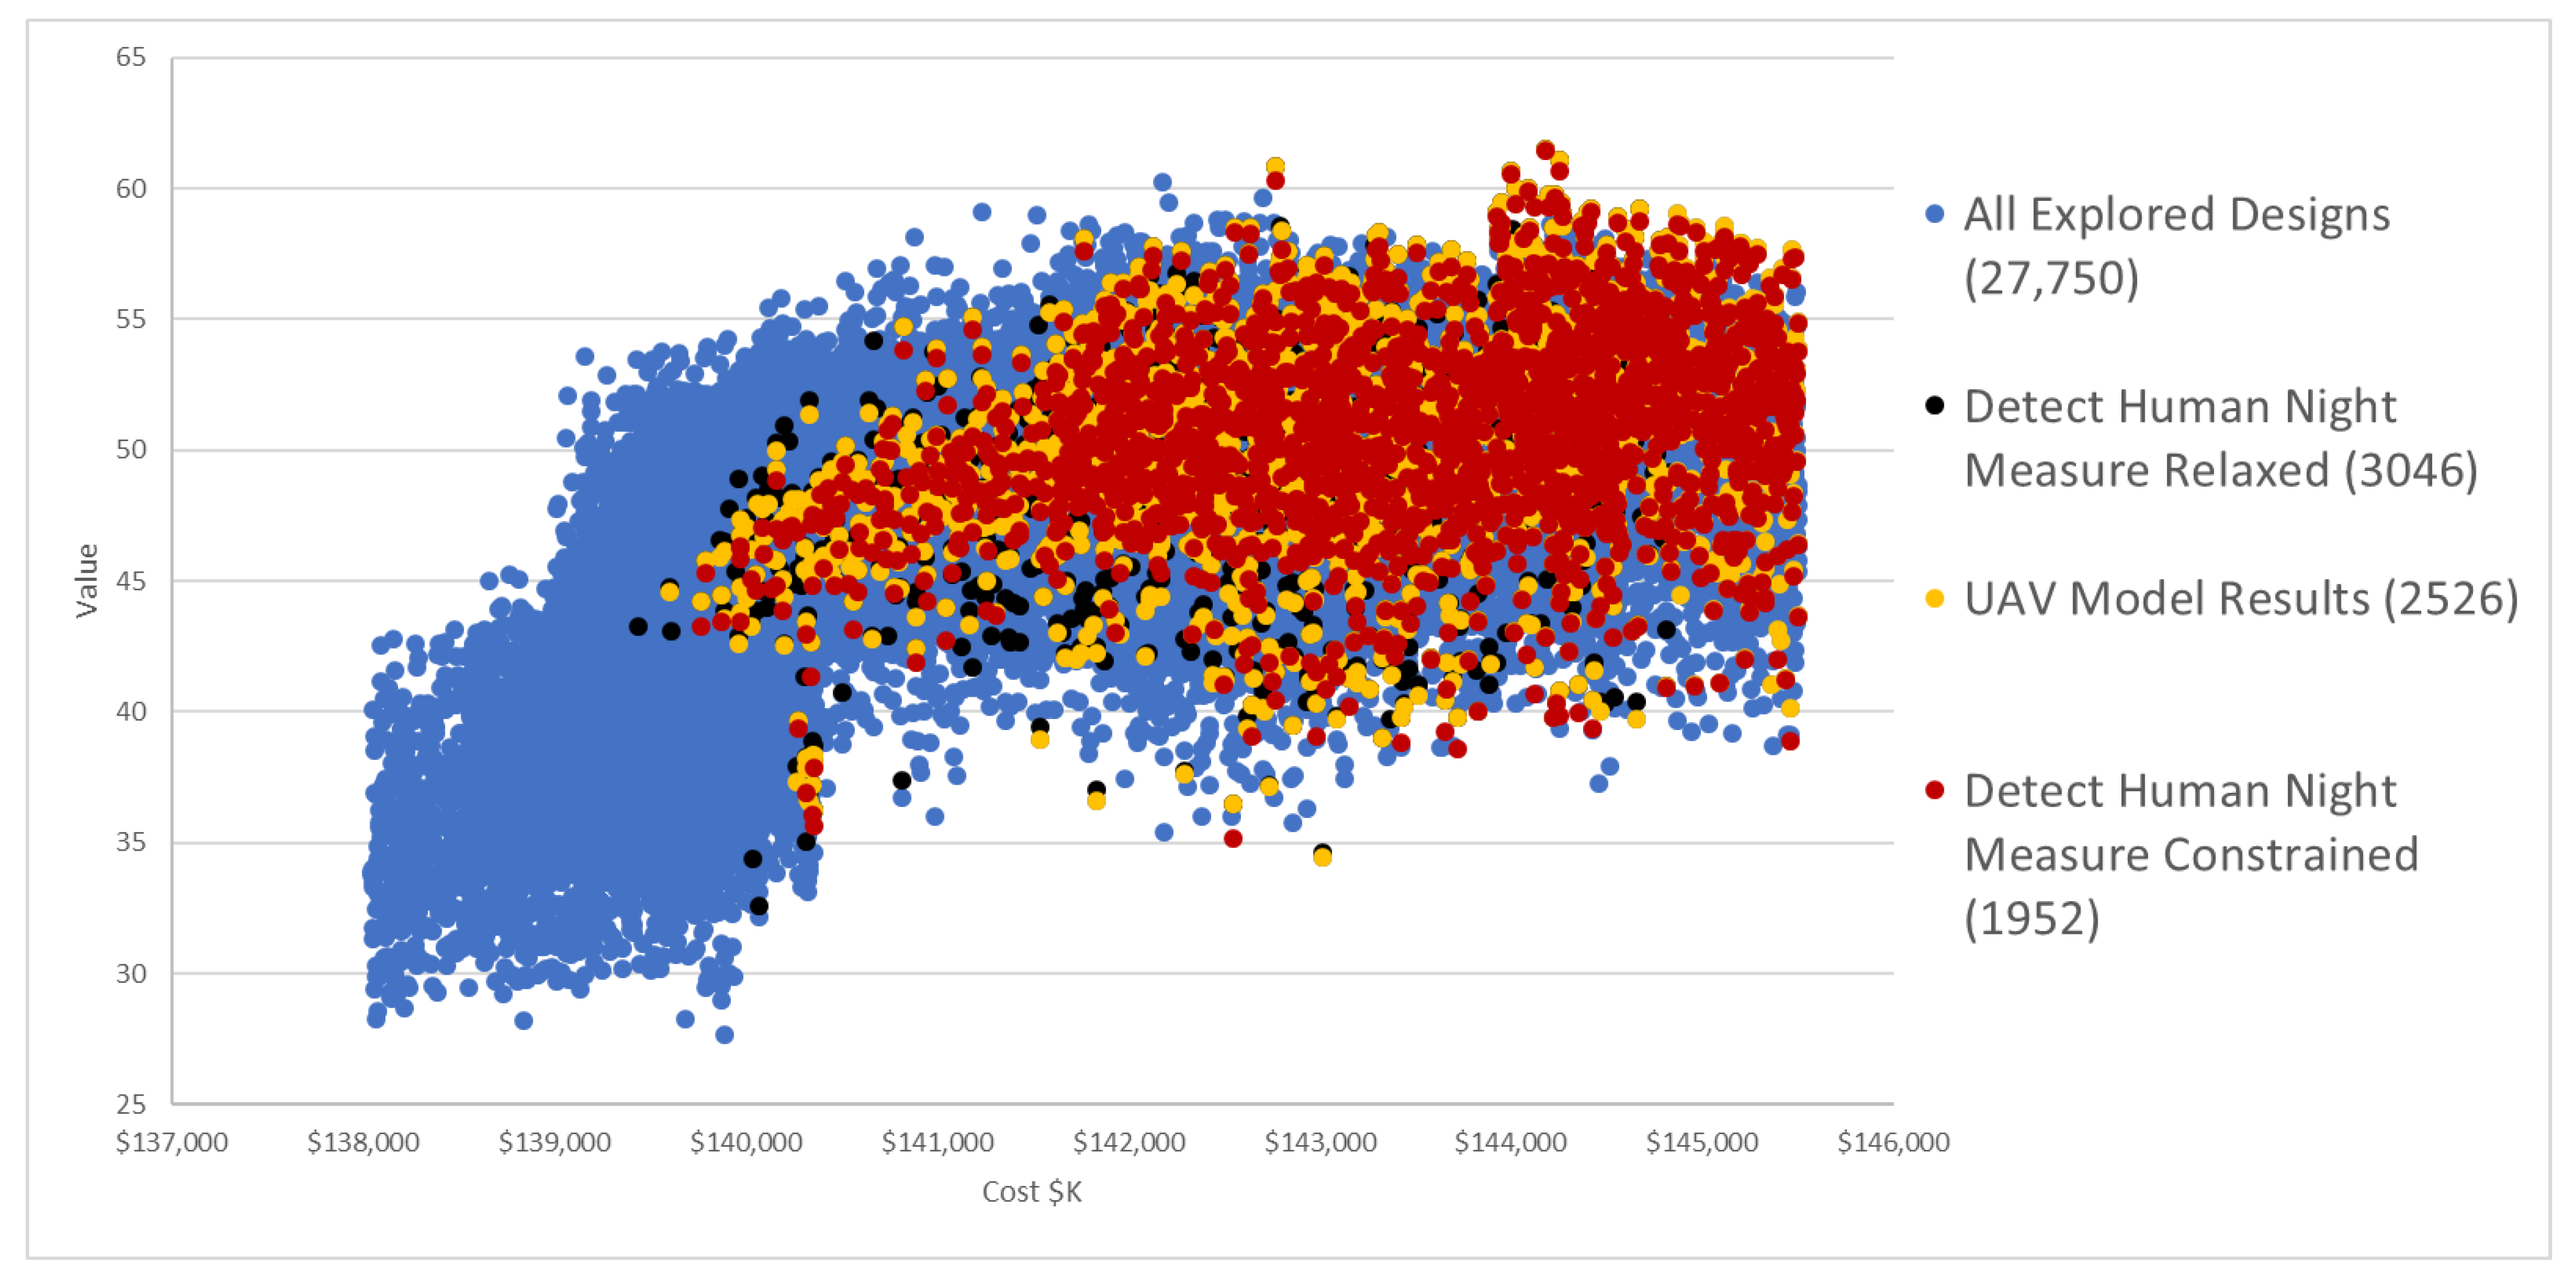
4.2. Assessing Design Decisions Using Sets
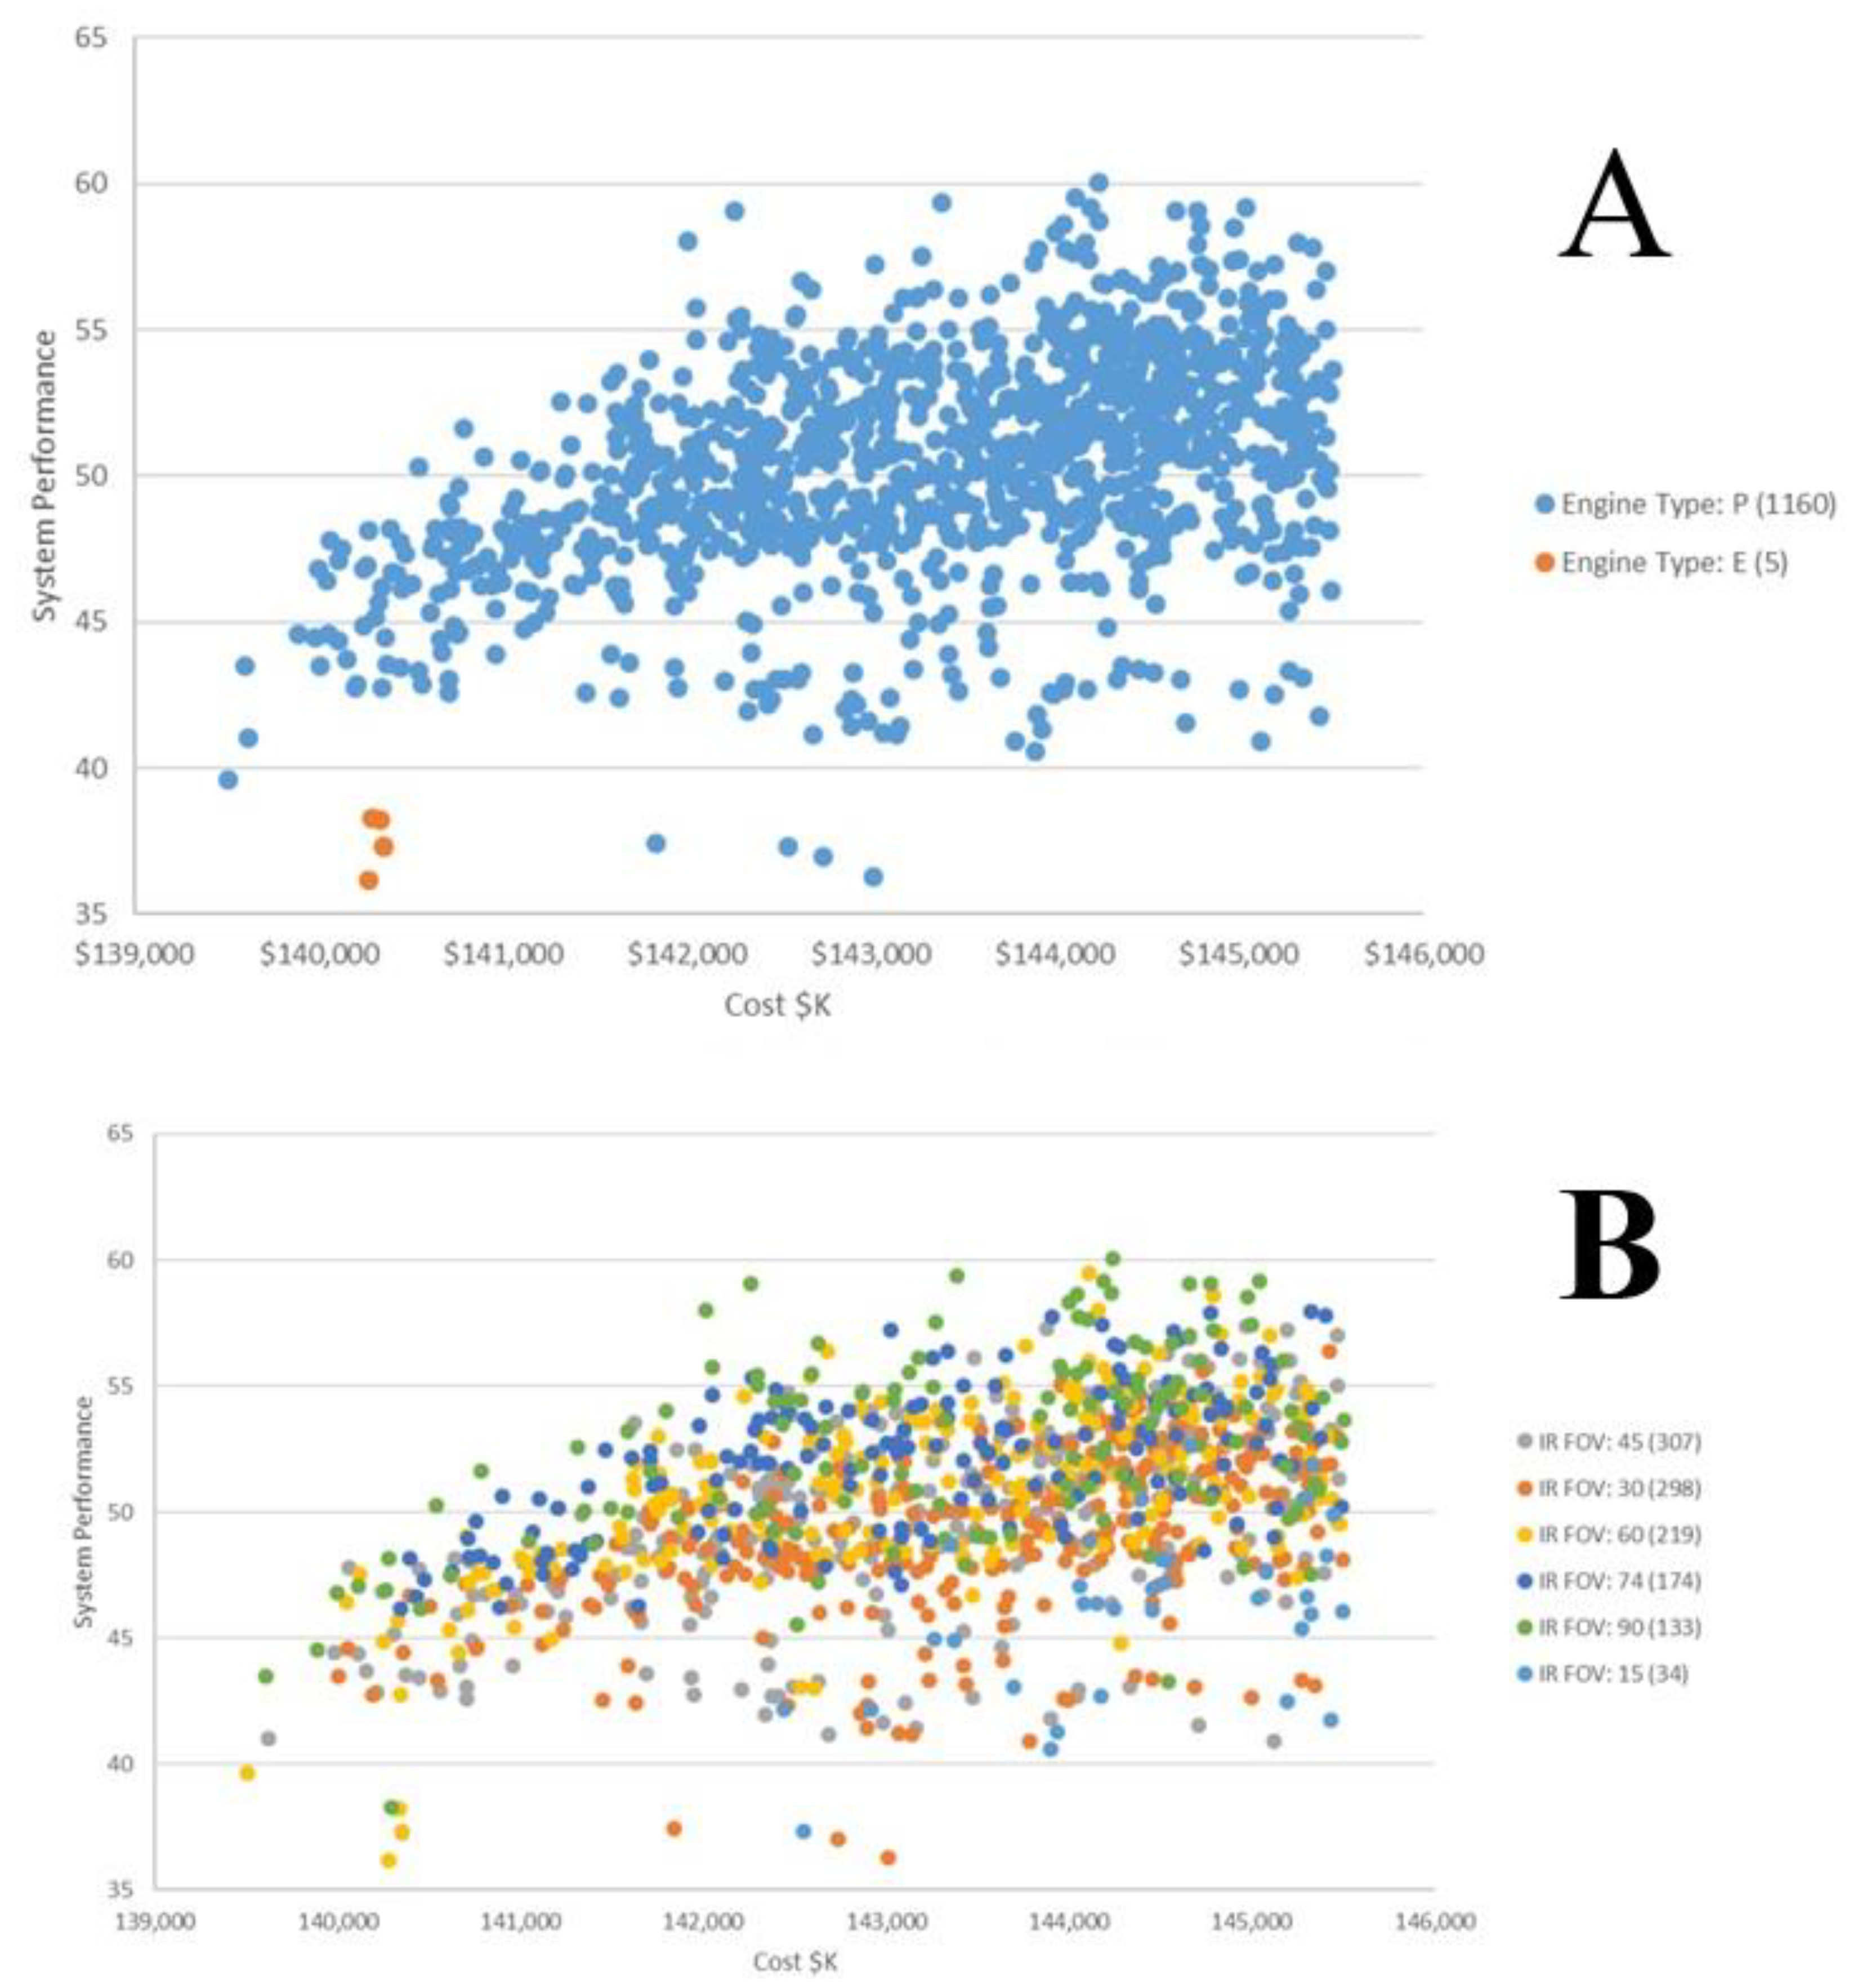
4.3. Providing Design Decisions Insights to Design Teams
5. Summary and Future Work
Author Contributions
Funding
Institutional Review Board Statement
Informed Consent Statement
Data Availability Statement
Acknowledgments
Conflicts of Interest
References
- Lasdon, L.S. Optimization Theory for Large Systems; Courier Corporation: North Chelmsford, MA, USA, 1970. [Google Scholar]
- Wismer, D.A. Optimization Methods for Large-Scale Systems... with Applications; McGraw-Hill Companies: New York, NY, USA, 1971. [Google Scholar]
- Sobieszczanski-Sobieski, J.; Barthelemy, J.-F.M.; Giles, G.L. Aerospace Engineering Design by Systematic Decomposition and Multilevel Optimization; National Aeronautics and Space Administration, Langley Research Center: Hampton, VA, USA, 1984. [Google Scholar]
- Azarm, S.; Li, W.-C. Multi-level design optimization using global monotonicity analysis. J. Mech. Transm. Autom. Des. 1989, 111, 259–263. [Google Scholar] [CrossRef]
- Haimes, Y.Y. Hierarchical Multiobjective Analysis of Large-Scale Systems; Hemisphere Pub.: New York, NY, USA, 1990. [Google Scholar]
- Sobieszczanski-Sobieski, J. Sensitivity analysis and multidisciplinary optimization for aircraft design: Recent advances and results. In Proceedings of the 16th Congress International Council of the Aeronautical Sciences (ICAS), Jerusalem, Israel, 28 August–2 September 1988. [Google Scholar]
- Sheridan, D.; Clark, D.; Jones, R.; Fein, J. The ASSET Program- A Current Navy Initiative. In Proceedings of the SNAME Spring Meeting, Los Angeles, CA, USA, 15 December 1984. [Google Scholar]
- Cramer, E.J.; Frank, P.D.; Shubin, G.R.; Dennis, J.; Lewis, R. On alternative problem formulations for multidisciplinary design optimization. In Proceedings of the 4th Annual AIAA/Air Force/NASA/OAI Symposium on Multidisciplinary Analysis and Optimization, Cleveland, OH, USA, 21–23 September 1992. [Google Scholar]
- Davis, W. A generalized decomposition procedure and its application to engineering design. J. Mech. Des. 1978, 100, 739–746. [Google Scholar] [CrossRef]
- Johnson, R.; Benson, R. A basic two-stage decomposition strategy for design optimization. J. Mech. Transm. Autom. Des. 1984, 106, 380–386. [Google Scholar] [CrossRef]
- Johnson, R.; Benson, R. A multistage decomposition strategy for design optimization. J. Mech. Transm. Autom. Des. 1984, 106, 387–393. [Google Scholar] [CrossRef]
- Ward, A.C.; Seering, W.P. The Performance of a Mechanical Design Compiler. Trans. Am. Soc. Mech. Eng. J. Mech. Des. 1993, 115, 341–345. [Google Scholar] [CrossRef]
- Ward, A.C.; Seering, W.P. Quantitative inference in a mechanical design compiler. Trans. Am. Soc. Mech. Eng. J. Mech. Des. 1993, 115, 29–35. [Google Scholar] [CrossRef]
- Doerry, N. A Vision for Ship Design and Analysis Tools. In Marine Technology; SNAME: Alexandria, VA, USA, 2012. [Google Scholar]
- Hootman, J.C.; Whitcomb, C. A military effectiveness analysis and decision making framework for naval ship design and acquisition. Naval Eng. J. 2005, 117, 43–61. [Google Scholar] [CrossRef] [Green Version]
- Wade, Z.; Parnell, G.; Goerger, S.; Pohl, E.; Specking, E. Designing Engineered Resilient Systems Using Set-Based Design. In Proceedings of the 16th Annual Conference on Systems Engineering Research, Charlottesville, VA, USA, 8–9 May 2018. [Google Scholar]
- Ward, A.; Liker, J.K.; Cristiano, J.J.; Sobek, D.K. The second Toyota paradox: How delaying decisions can make better cars faster. Sloan Manag. Rev. 1995, 36, 43. [Google Scholar]
- Singer, D.J.; Doerry, N.; Buckley, M.E. What Is Set-Based Design? Naval Eng. J. 2009, 121, 31–43. [Google Scholar] [CrossRef]
- Burrow, J.; Doerry, N.; Earnesty, M.; Was, J.; Myers, J.; Banko, J.; McConnell, J.; Pepper, J.; Tafolla, T. Concept Exploration of the Amphibious Combat Vehicle; SNAME Maritime Convention: Houston, TX, USA, 2011. [Google Scholar]
- Finch, W.W.; Ward, A.C. A set-based system for eliminating infeasible designs in engineering problems dominated by uncertainty. In Proceedings of the 1997 ASME Design Engineering Technical Conferences, Sacramento, CA, USA, 14–17 September 1997. Paper No. DETC97/DTM-3886. [Google Scholar]
- Ford, D.N.; Sobek, D.K. Adapting real options to new product development by modeling the second Toyota paradox. IEEE Trans. Eng. Manag. 2005, 52, 175–185. [Google Scholar] [CrossRef]
- Ghosh, S.; Seering, W. Set-Based Thinking in the Engineering Design Community and Beyond. In Proceedings of the ASME 2014 International Design Engineering Technical Conferences and Computers and Information in Engineering Conference, New York, NY, USA, 17–20 August 2014; p. V007T07A040. [Google Scholar]
- Kim, W. A Framework for Set-Based Manufacturing Analysis and Visual Feedback. Ph.D. Thesis, The Pennsylvania State University, Centre County, PA, USA, 2015. [Google Scholar]
- Liker, J.K.; Sobek, D.K.; Ward, A.C.; Cristiano, J.J. Involving suppliers in product development in the United States and Japan: Evidence for set-based concurrent engineering. IEEE Trans. Eng. Manag. 1996, 43, 165–178. [Google Scholar] [CrossRef]
- Madhavan, K.; Shahan, D.; Seepersad, C.C.; Hlavinka, D.A.; Benson, W. An industrial trial of a set-based approach to collaborative design. In Proceedings of the ASME 2008 International Design Engineering Technical Conferences and Computers and Information in Engineering Conference, New York, NY, USA, 3–6 August 2008; pp. 737–747. [Google Scholar]
- Malak, R.J.; Aughenbaugh, J.M.; Paredis, C.J. Multi-attribute utility analysis in set-based conceptual design. Comput. Aided Des. 2008, 41, 214–227. [Google Scholar] [CrossRef]
- McKenney, T.A.; Kemink, L.F.; Singer, D.J. Adapting to Changes in Design Requirements Using Set-Based Design. Naval Eng. J. 2011, 123, 66–77. [Google Scholar] [CrossRef] [Green Version]
- McKenney, T.A.; Singer, D.J. Determining the influence of variables for functional design groups in the set-based design process. In Proceedings of the ASNE Day 2012: Proceedings of the American Society of Naval Engineers Day 2012, Alexandria, VA, USA, 10 February 2012. [Google Scholar]
- Mebane, W.L.; Carlson, C.M.; Dowd, C.; Singer, D.J.; Buckley, M.E. Set-Based Design and the Ship to Shore Connector. Naval Eng. J. 2011, 123, 79–92. [Google Scholar] [CrossRef] [Green Version]
- Nahm, Y.-E.; Ishikawa, H. A new 3D-CAD system for set-based parametric design. Int. J. Adv. Manuf. Technol. 2006, 29, 137–150. [Google Scholar]
- Naval Sea Systems Command. Ship Design Manager (SDM) and Systems Integration Manager (SIM) Manual; Naval Seay Systems Command: Washington, DC, USA, 2012. [Google Scholar]
- Panchal, J.H. A Framework for Simulation-Based Integrated Design of Multiscale Products and Design Processes. Ph.D. Thesis, Georgia Institute of Technology, Atlanta, GA, USA, 2005. [Google Scholar]
- Raudberget, D. The decision process in Set-based Concurrent Engineering-An industrial case study. In Proceedings of the DS 60: Proceedings of DESIGN 2010, the 11th International Design Conference, Dubrovnik, Croatia, 17–20 May 2010. [Google Scholar]
- Sobek, D.K.; Ward, A.C.; Liker, J.K. Toyota’s principles of set-based concurrent engineering. Sloan Manag. Rev. 1999, 40, 67. [Google Scholar]
- Ward, A.; Durward Sobek, I.; John, J.C.; Jeffrey, K.L. Toyota, concurrent engineering, and set-based design. In Engineered in Japan: Japanese Technology-Management Practices; Oxford University Press: Oxford, UK, 1995; pp. 192–216. [Google Scholar]
- Specking, E.; Whitcomb, C.; Parnell, G.; Goerger, S.; Pohl, E.; Kundeti, N. Literature Review: Exploring the Role of Set-Based Design in Trade-off Analytics. Naval Eng. J. 2018, 130, 51–62. [Google Scholar]
- Diaz Dominguez, D. Enhancing the conceptual design process of automotive exterior systems. Master’s Thesis, Massachusetts Institute of Technology, Cambridge, MA, USA, 2011. [Google Scholar]
- Rapp, S.; Chinnam, R.; Doerry, N.; Murat, A.; Witus, G. Product development resilience through set-based design. Syst. Eng. 2018, 21, 490–500. [Google Scholar] [CrossRef]
- Specking, E.; Parnell, G.; Pohl, E.; Buchanan, R. Early Design Space Exploration with Model-Based System Engineering and Set-Based Design. Systems 2018, 6, 45. [Google Scholar] [CrossRef] [Green Version]
- Small, C. Demonstrating Set-Based Design Techniques—A UAV Case Study. Master’s Thesis, University of Arkansas, Fayetteville, AR, USA, 2018. Available online: http://scholarworks.uark.edu/etd/2699 (accessed on 6 June 2019).
- Parnell, G.S.; Bresnic, T.A.; Tani, S.N.; Johnson, E.R. Handbook of Decision Analysis; Wiley: Hoboken, NJ, USA, 2013. [Google Scholar]
- Specking, E.; Parnell, G.; Pohl, E.; Buchanan, R. Evaluating the Tradespace Exploration Process of an Early System Design. In Proceedings of the 17th Annual Conference on Systems Engineering Research, Washington, DC, USA, 3–4 April 2019. [Google Scholar]
- Parnell, G.S.; Specking, E.; Goerger, S.; Cilli, M.; Pohl, E. Using Set-Based Design to Inform System Requirements and Evaluate Design Decisions. In Proceedings of the 29th Annual INCOSE International Symposium, Orlando, FL, USA, 20–25 July 2019. [Google Scholar]


| Role | Responsibilities |
|---|---|
| Decision Authority/Project Manager | Make decisions, answer for the successes or failures of the project, and communicate with stakeholders |
| Stakeholders | Provide insight into project needs and requirements |
| System Analysts | Work with system designers and engineers to gather relevant models to develop and analyze the integrated model to provide information to the decision authority |
| System Architects | Develop overall system architecture, concepts, and models |
| Subsystem Designers | Develop subsystem designs and models |
| Performance Measure | Constrained | UAV Case Study | Relaxed |
|---|---|---|---|
| UAS weight (lbs) | 40 | 50 | 60 |
| Time required to fly 10 km (minutes) | 10 | 15 | 20 |
| Time required to scan a 5 km × 5 km box during the day (minutes) | 180 | 200 | 220 |
| Time required to scan a 5 km × 5 km box during the night (minutes) | 180 | 200 | 220 |
| Dwell time (minutes) | 90 | 60 | 30 |
| Perceived area of UAV at operating altitude (ft2) | 14 | 16 | 18 |
| Difference between operating altitude and attack helicopter operating altitude of 1000 m | 250 | 0 | 0 |
| Detect human activity in daylight | 0.7 | 0.6 | 0.5 |
| Detect vehicular activity in daylight | 0.7 | 0.6 | 0.5 |
| Detect human activity at night | 0.7 | 0.6 | 0.5 |
| Detect vehicular activity at night | 0.7 | 0.6 | 0.5 |
| Design Decision | Original | 1st Revised | 2nd Revised | Final |
|---|---|---|---|---|
| Wingspan | 2–12 | 2–12 | 2–12 | 2–12 |
| Engine Type | E, P | P | P | P |
| Operating Altitude | 300–1000 | 300–599 | 300–599 | 300–599 |
| EO Sensor Width Choice | 1, 2, 3, 4, 5, 6, 7, 8, 9 | 1, 2, 3, 4, 5 | 2, 3, 4 | 2, 3, 4 |
| IR Sensor Width Choice | 1, 2, 3, 4, 5, 6, 7, 8, 9 | 1, 2, 3, 4, 5 | 2, 3, 4 | 2, 3, 4 |
| EO Sensor FOV | 15, 30, 45, 60, 75, 90 | 15, 30, 45, 60, 75, 90 | 30, 45, 60, 75, 90 | 45, 60, 75, 90 |
| IR Sensor FOV | 15, 30, 45, 60, 75, 90 | 15, 30, 45, 60, 75, 90 | 30, 45, 60, 75, 90 | 45, 60, 75, 90 |
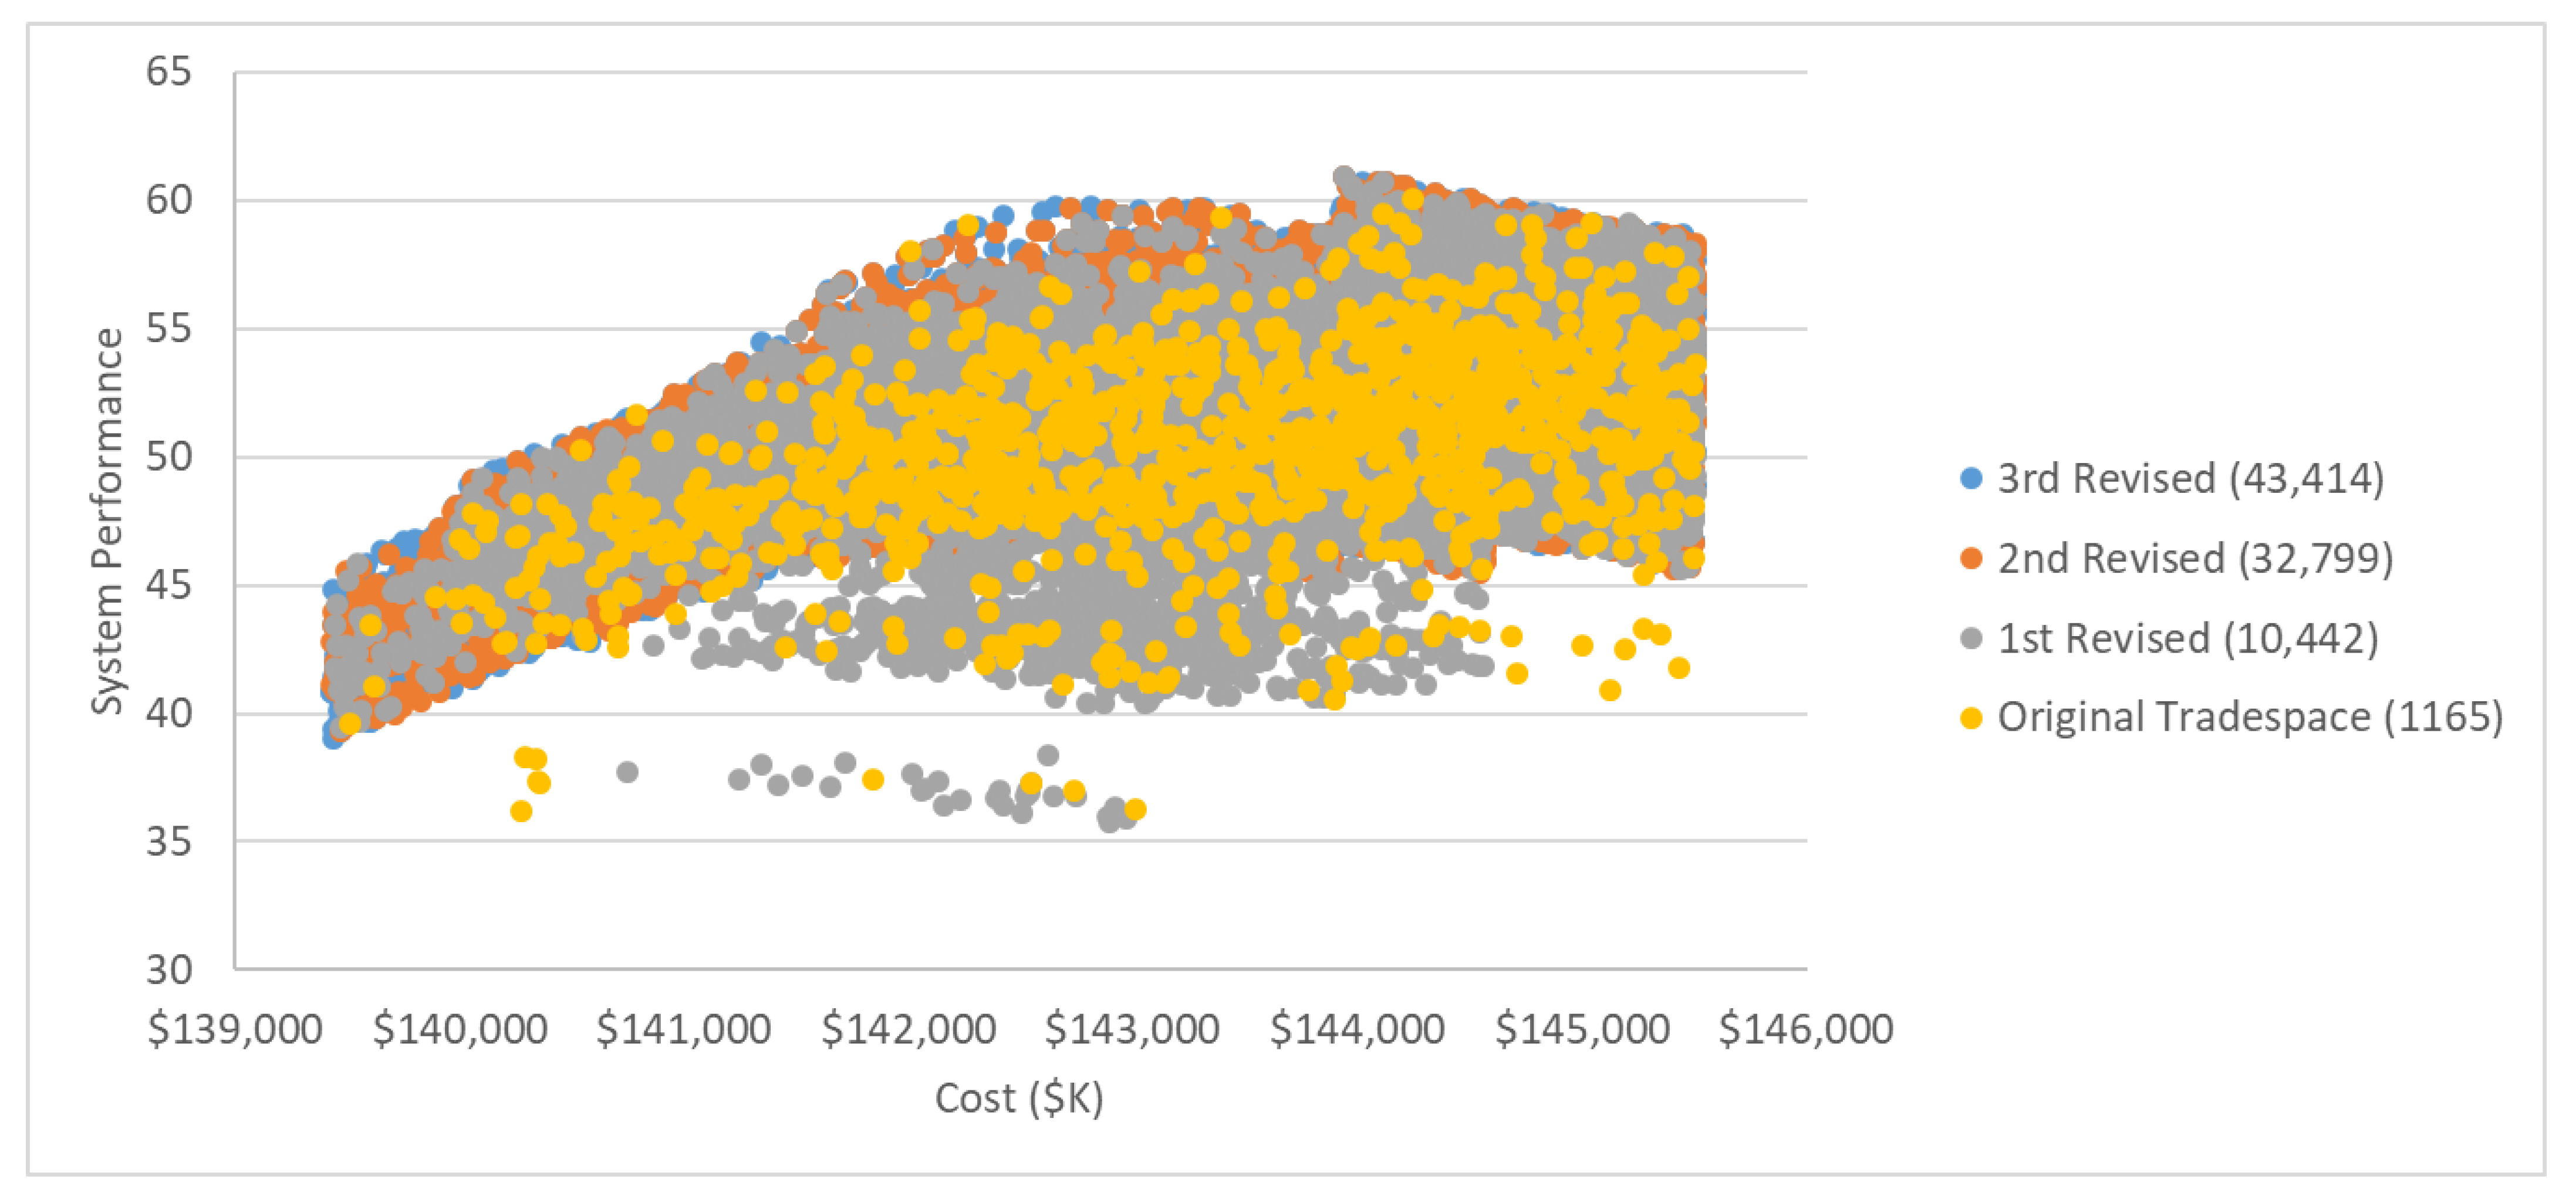
| Tradespace | # of Considered Alternatives | # of Feasible Alternatives | # of Pareto Points | % Feasible (of Sampled) |
|---|---|---|---|---|
| Original | 100,000 | 1165 | 12 | 1.2% |
| 1st Revised | 100,000 | 10,442 | 19 | 10.4% |
| 2nd Revised | 100,000 | 32,799 | 19 | 33% |
| Final | 100,000 | 43,414 | 18 | 43% |
Publisher’s Note: MDPI stays neutral with regard to jurisdictional claims in published maps and institutional affiliations. |
© 2021 by the authors. Licensee MDPI, Basel, Switzerland. This article is an open access article distributed under the terms and conditions of the Creative Commons Attribution (CC BY) license (http://creativecommons.org/licenses/by/4.0/).
Share and Cite
Specking, E.; Shallcross, N.; Parnell, G.S.; Pohl, E. Quantitative Set-Based Design to Inform Design Teams. Appl. Sci. 2021, 11, 1239. https://doi.org/10.3390/app11031239
Specking E, Shallcross N, Parnell GS, Pohl E. Quantitative Set-Based Design to Inform Design Teams. Applied Sciences. 2021; 11(3):1239. https://doi.org/10.3390/app11031239
Chicago/Turabian StyleSpecking, Eric, Nicholas Shallcross, Gregory S. Parnell, and Edward Pohl. 2021. "Quantitative Set-Based Design to Inform Design Teams" Applied Sciences 11, no. 3: 1239. https://doi.org/10.3390/app11031239
APA StyleSpecking, E., Shallcross, N., Parnell, G. S., & Pohl, E. (2021). Quantitative Set-Based Design to Inform Design Teams. Applied Sciences, 11(3), 1239. https://doi.org/10.3390/app11031239