
A Virtual Prototype for Fast Design and Visualization of Gerotor Pumps

 , , , and
Abstract
1. Introduction
2. Previous Works
2.1. Fluid Mechanical Simulation
2.2. Digital Twins and Virtual Prototypes in Gerotor Applications
2.3. Conclusions of Literature Review
3. Methodology
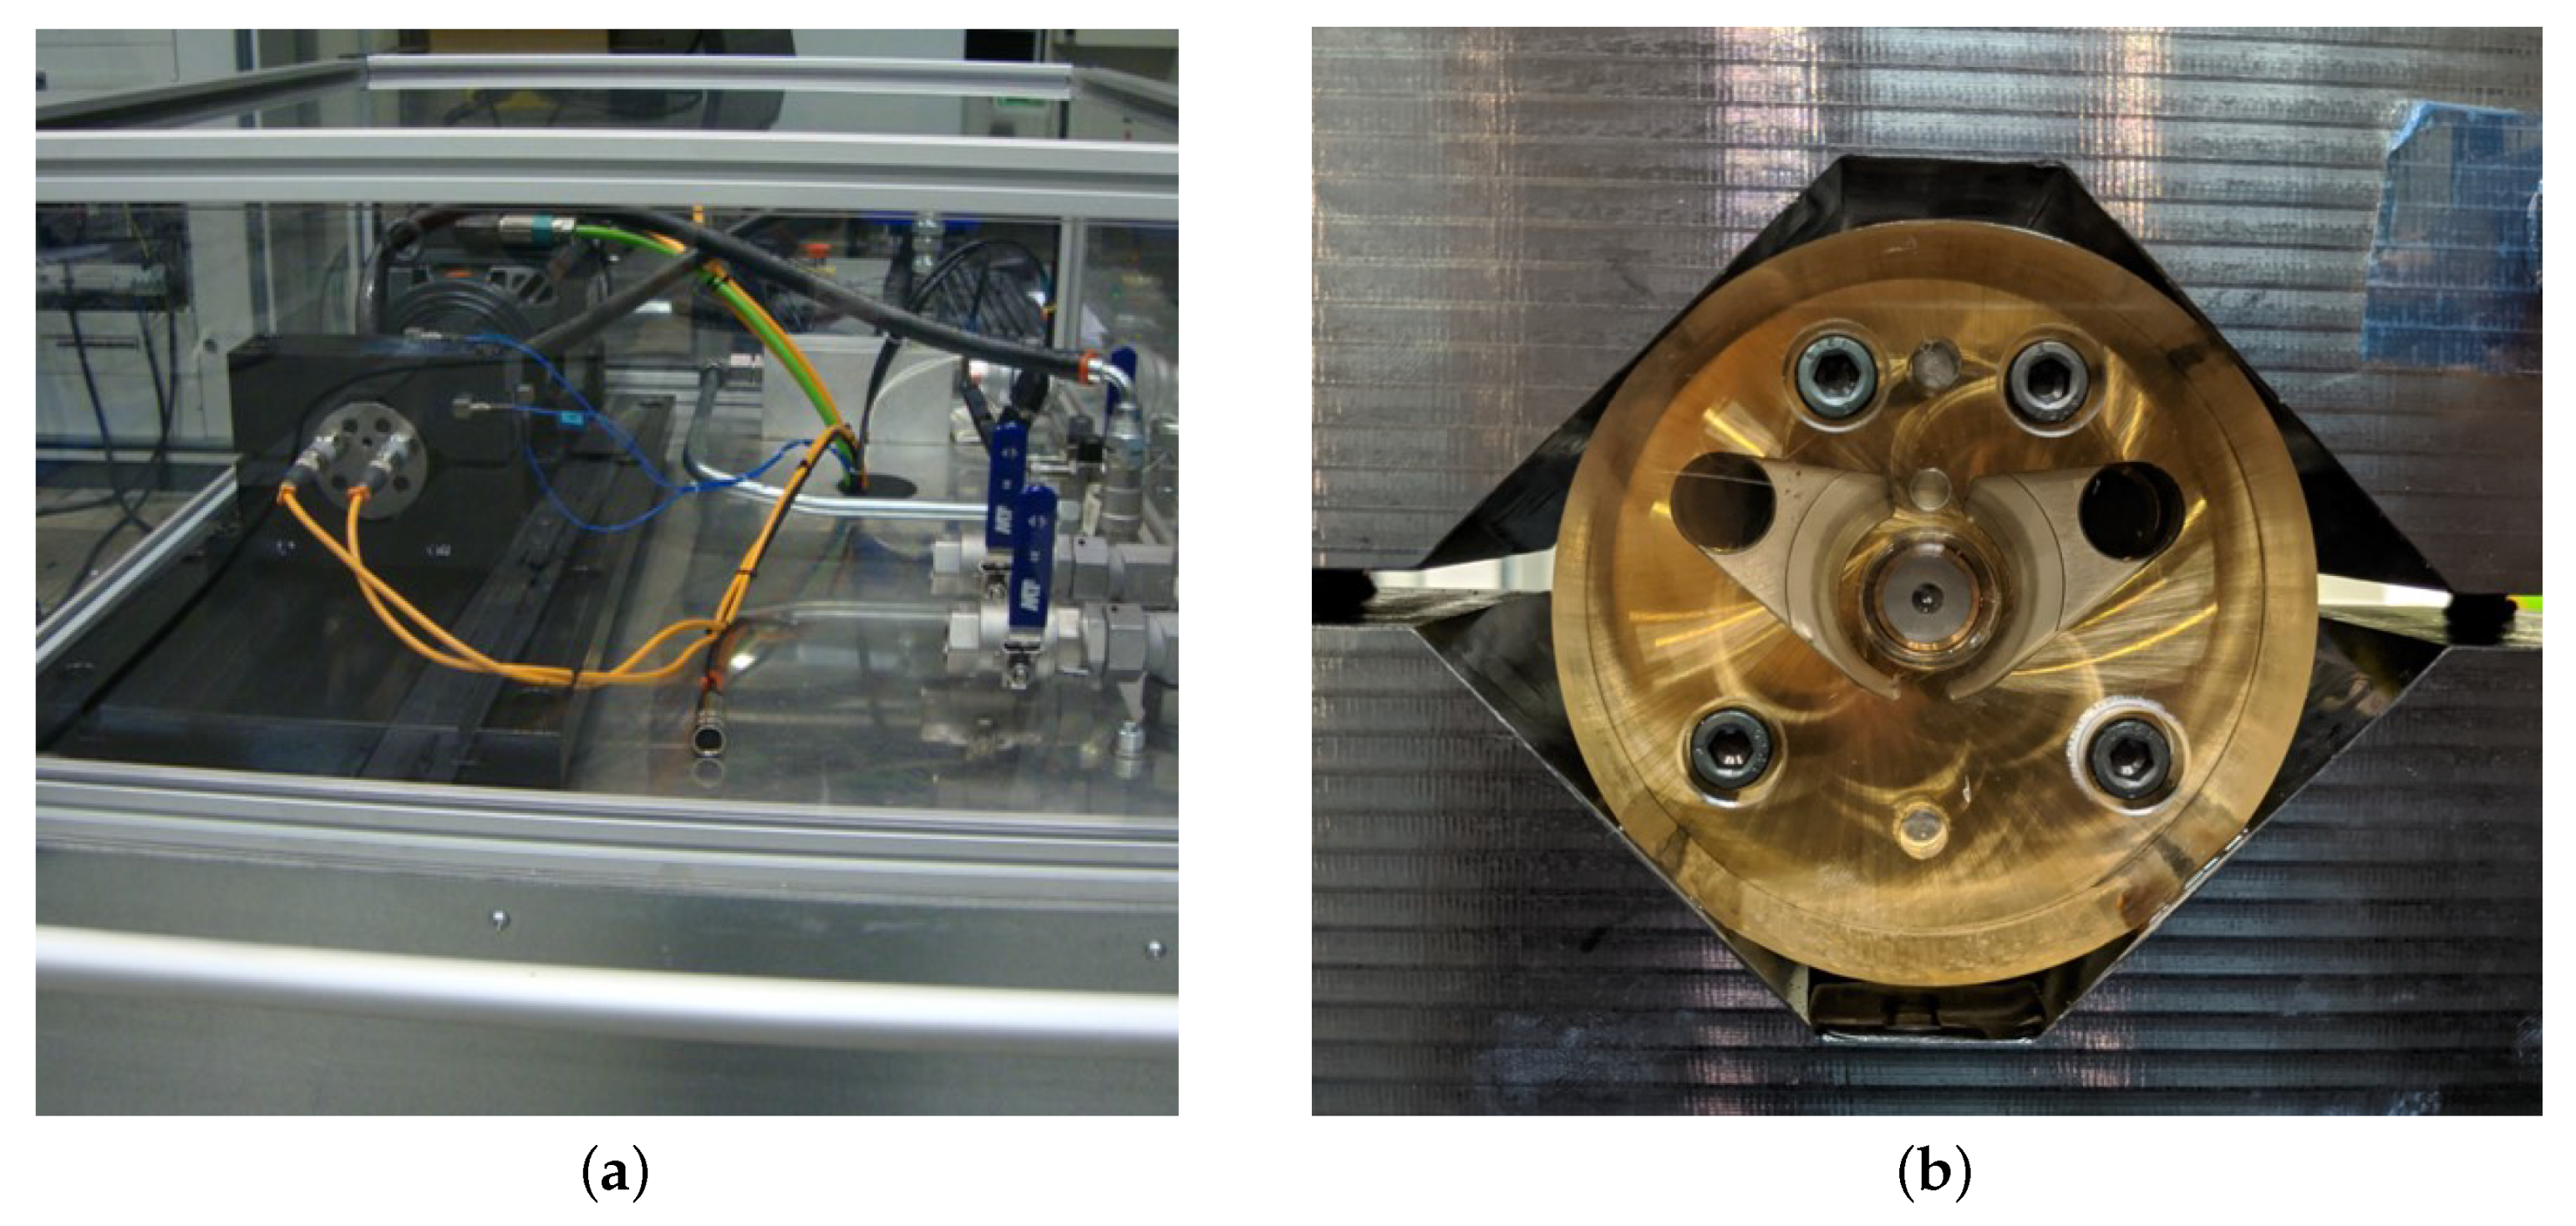
3.1. Experimental Setup
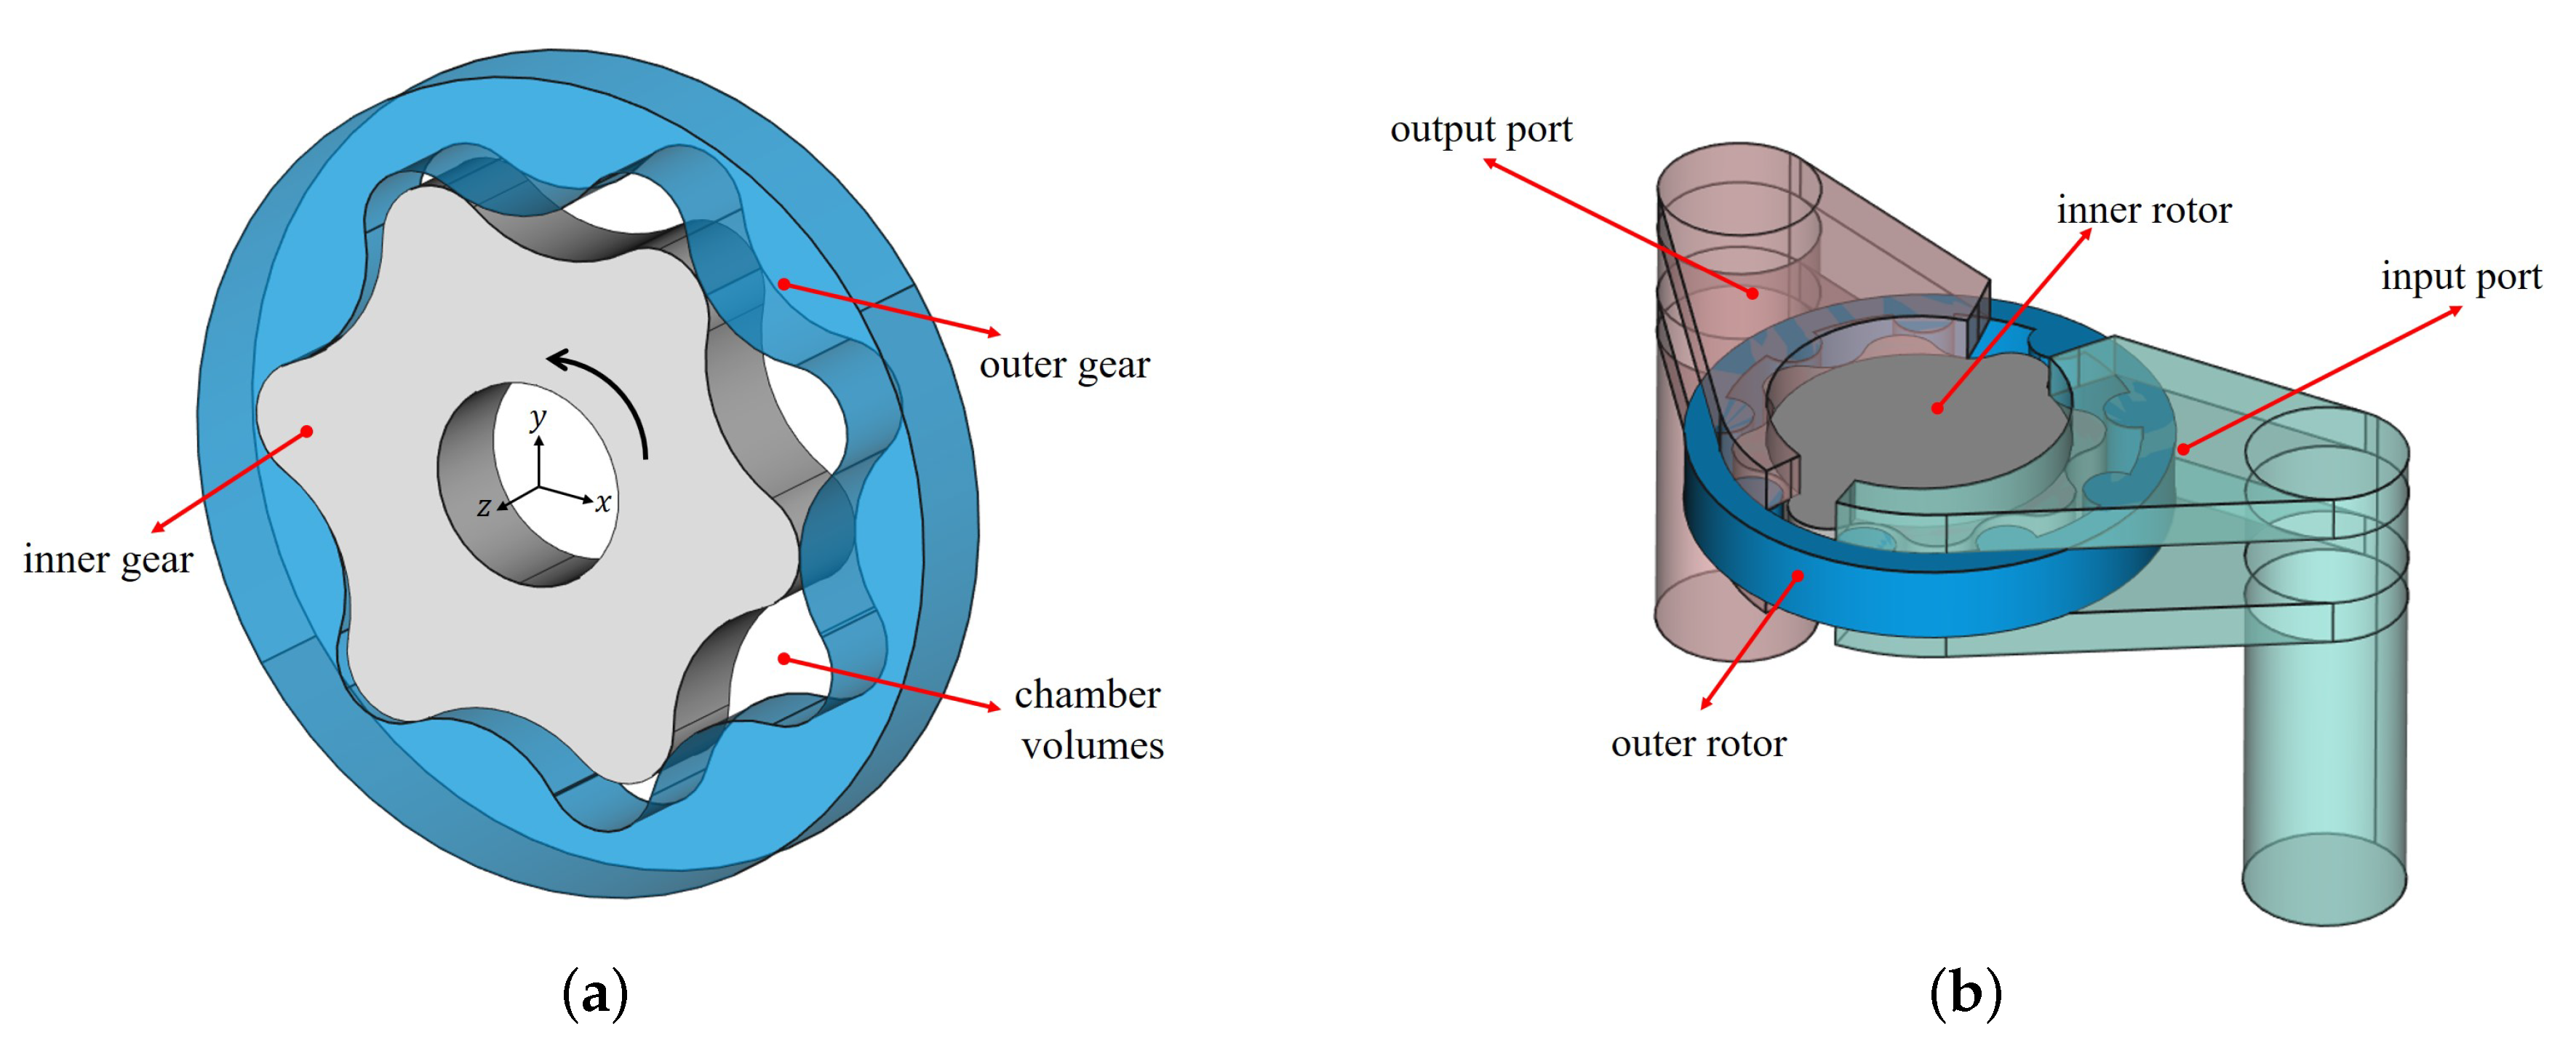
3.2. Geometric Model
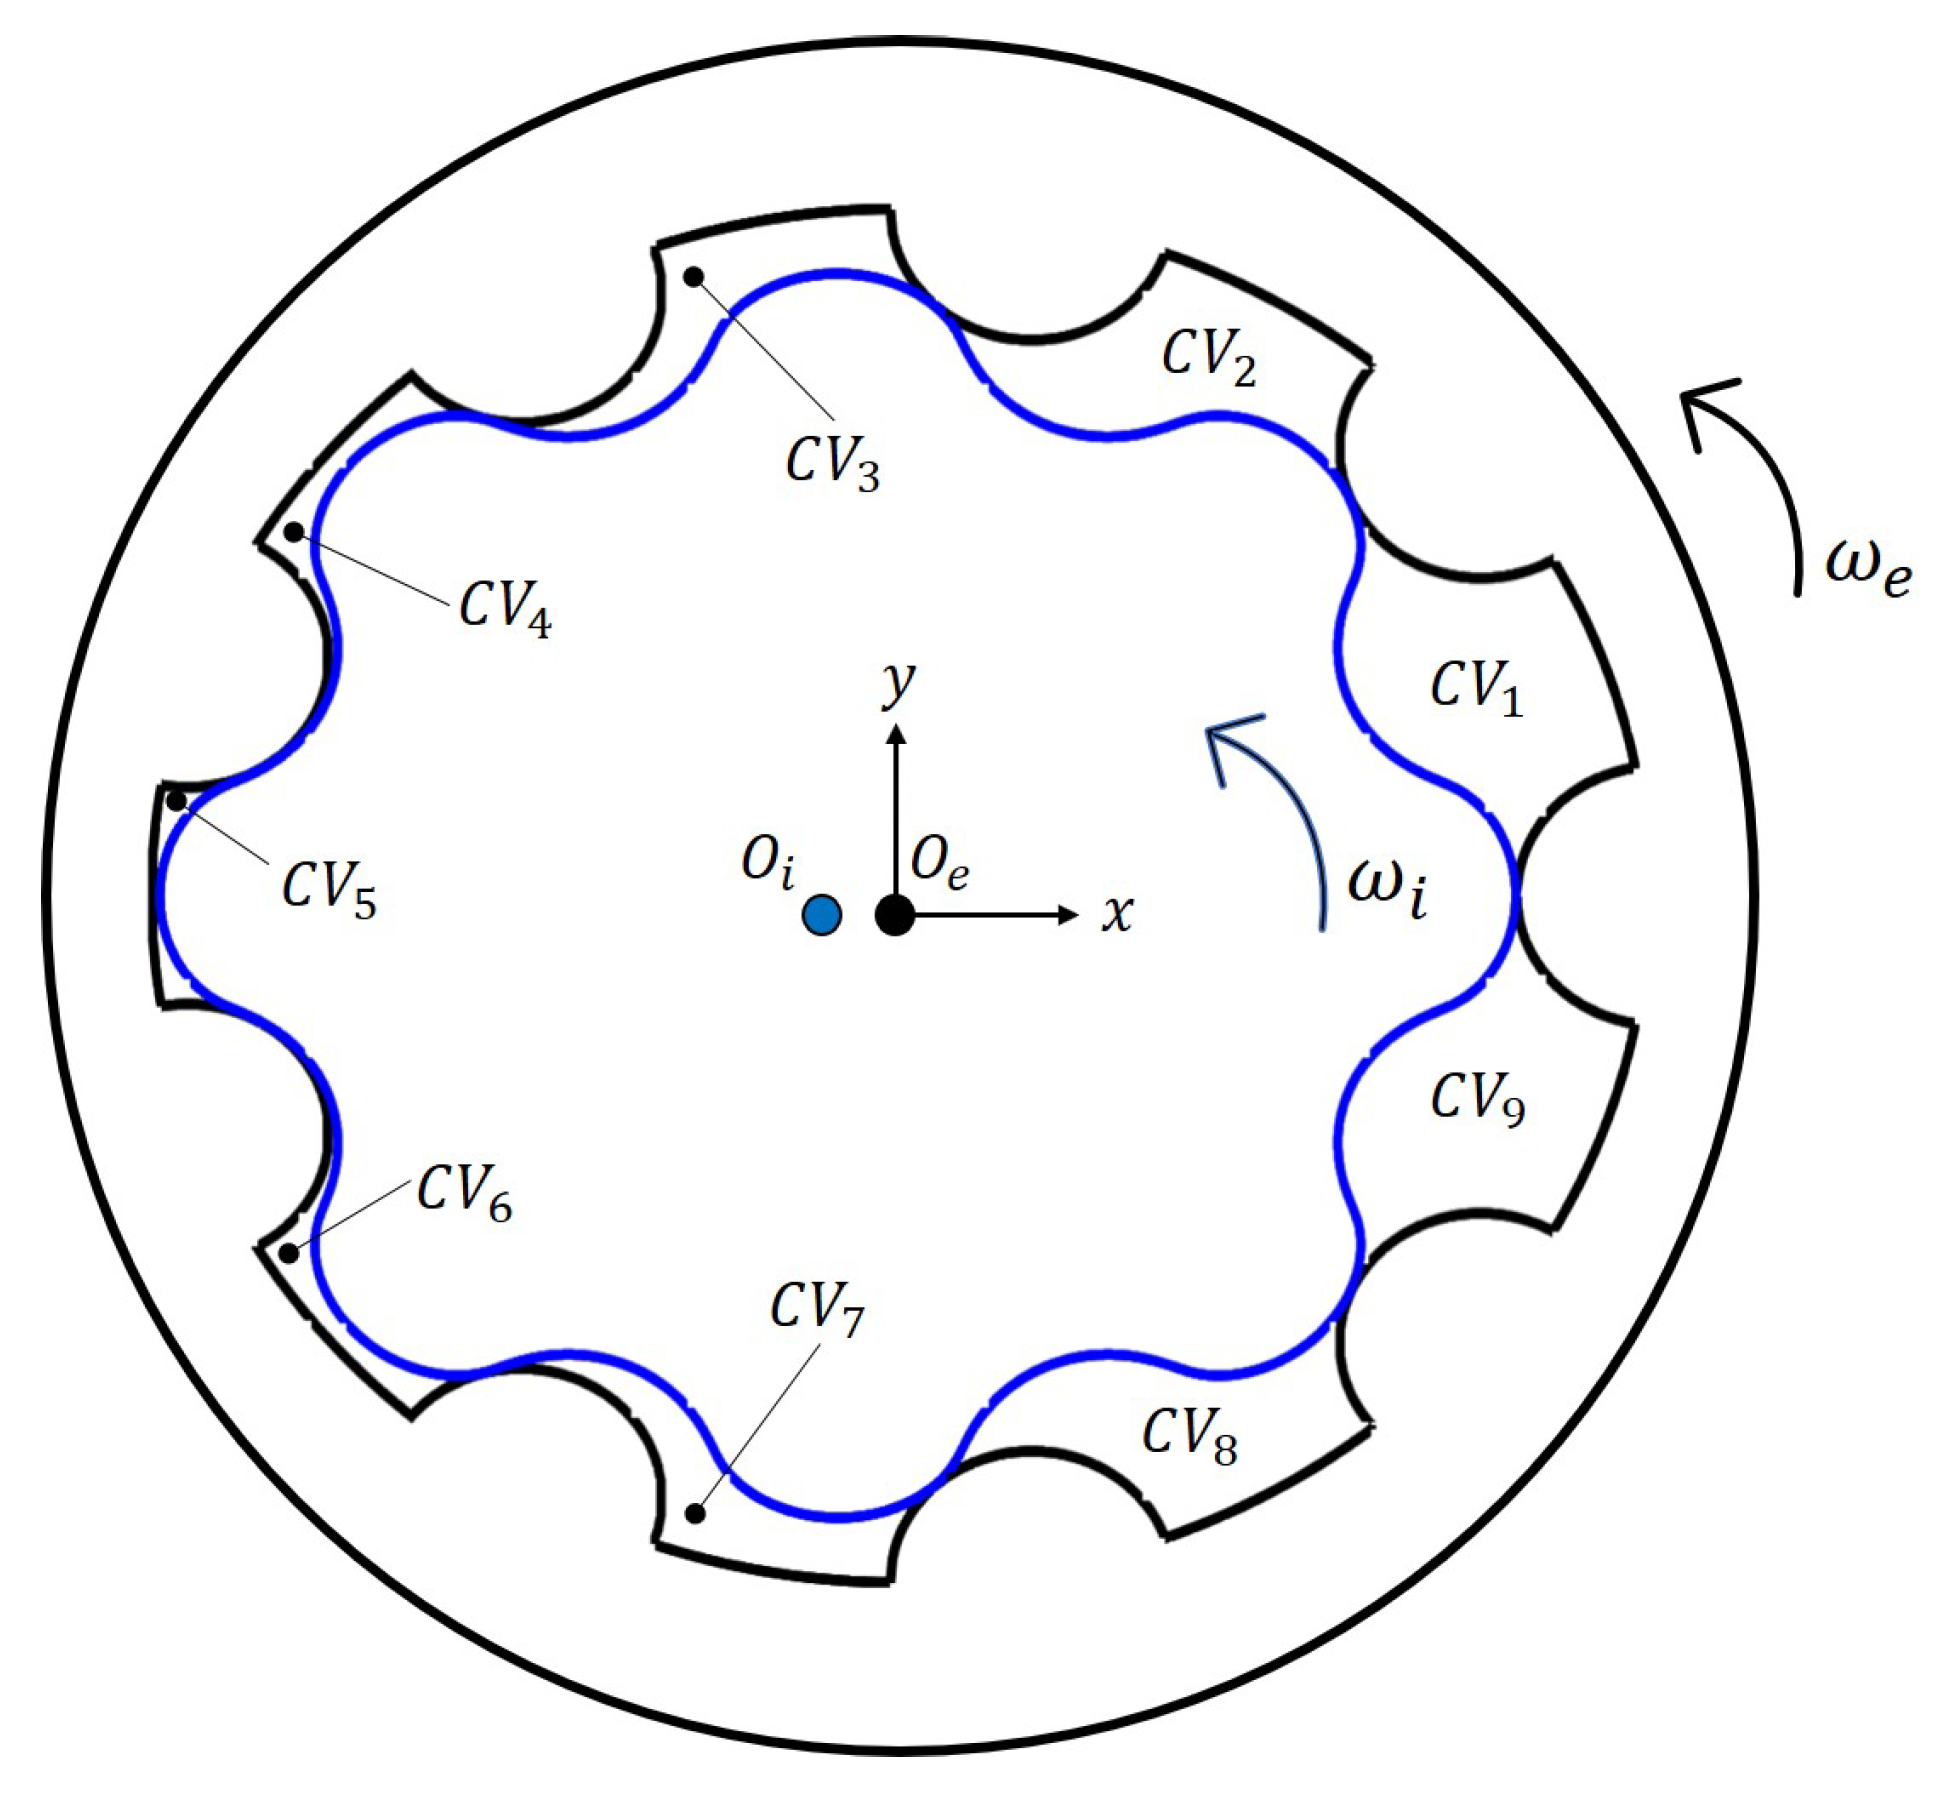
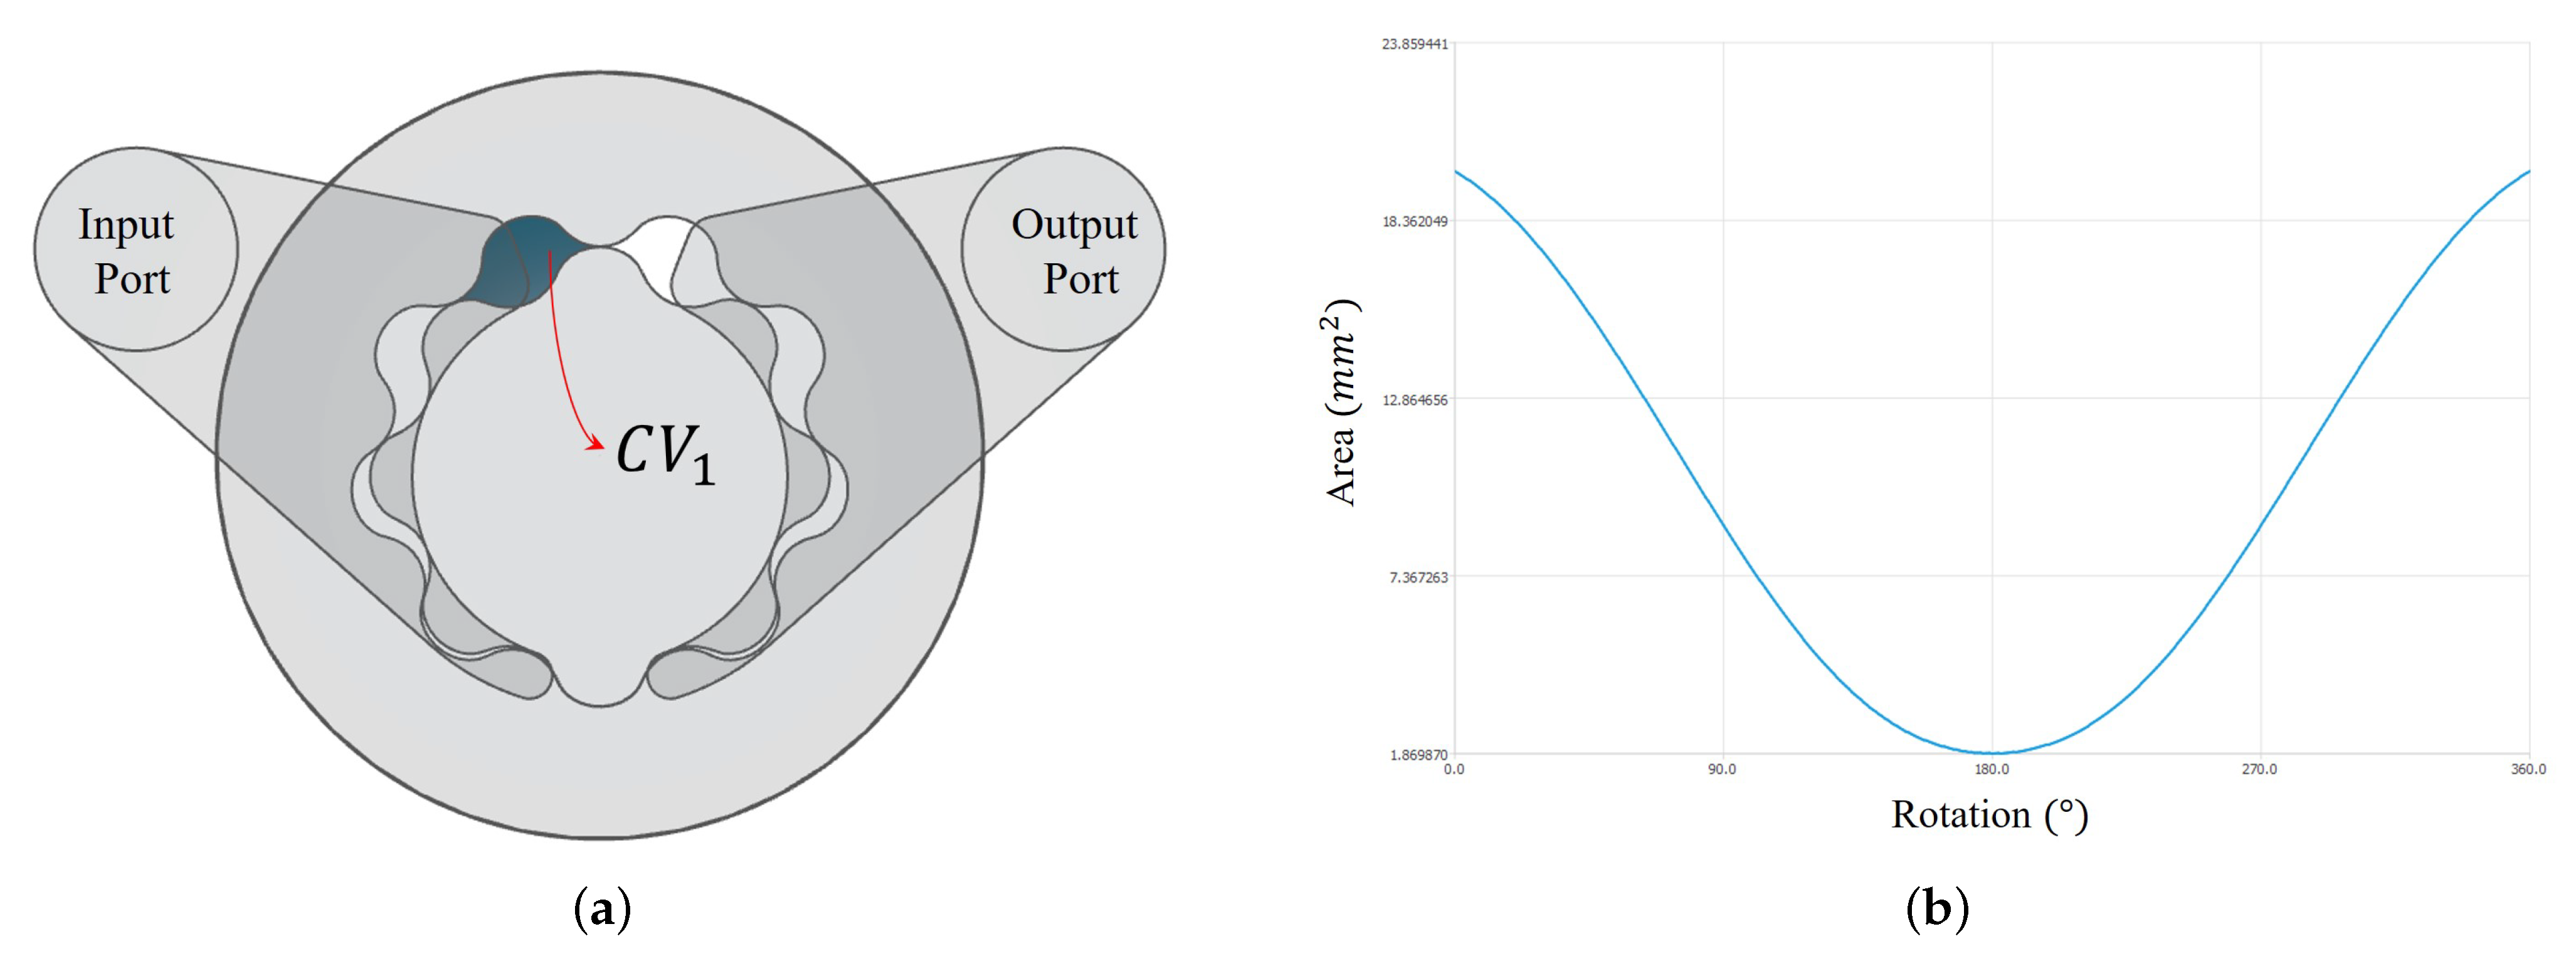
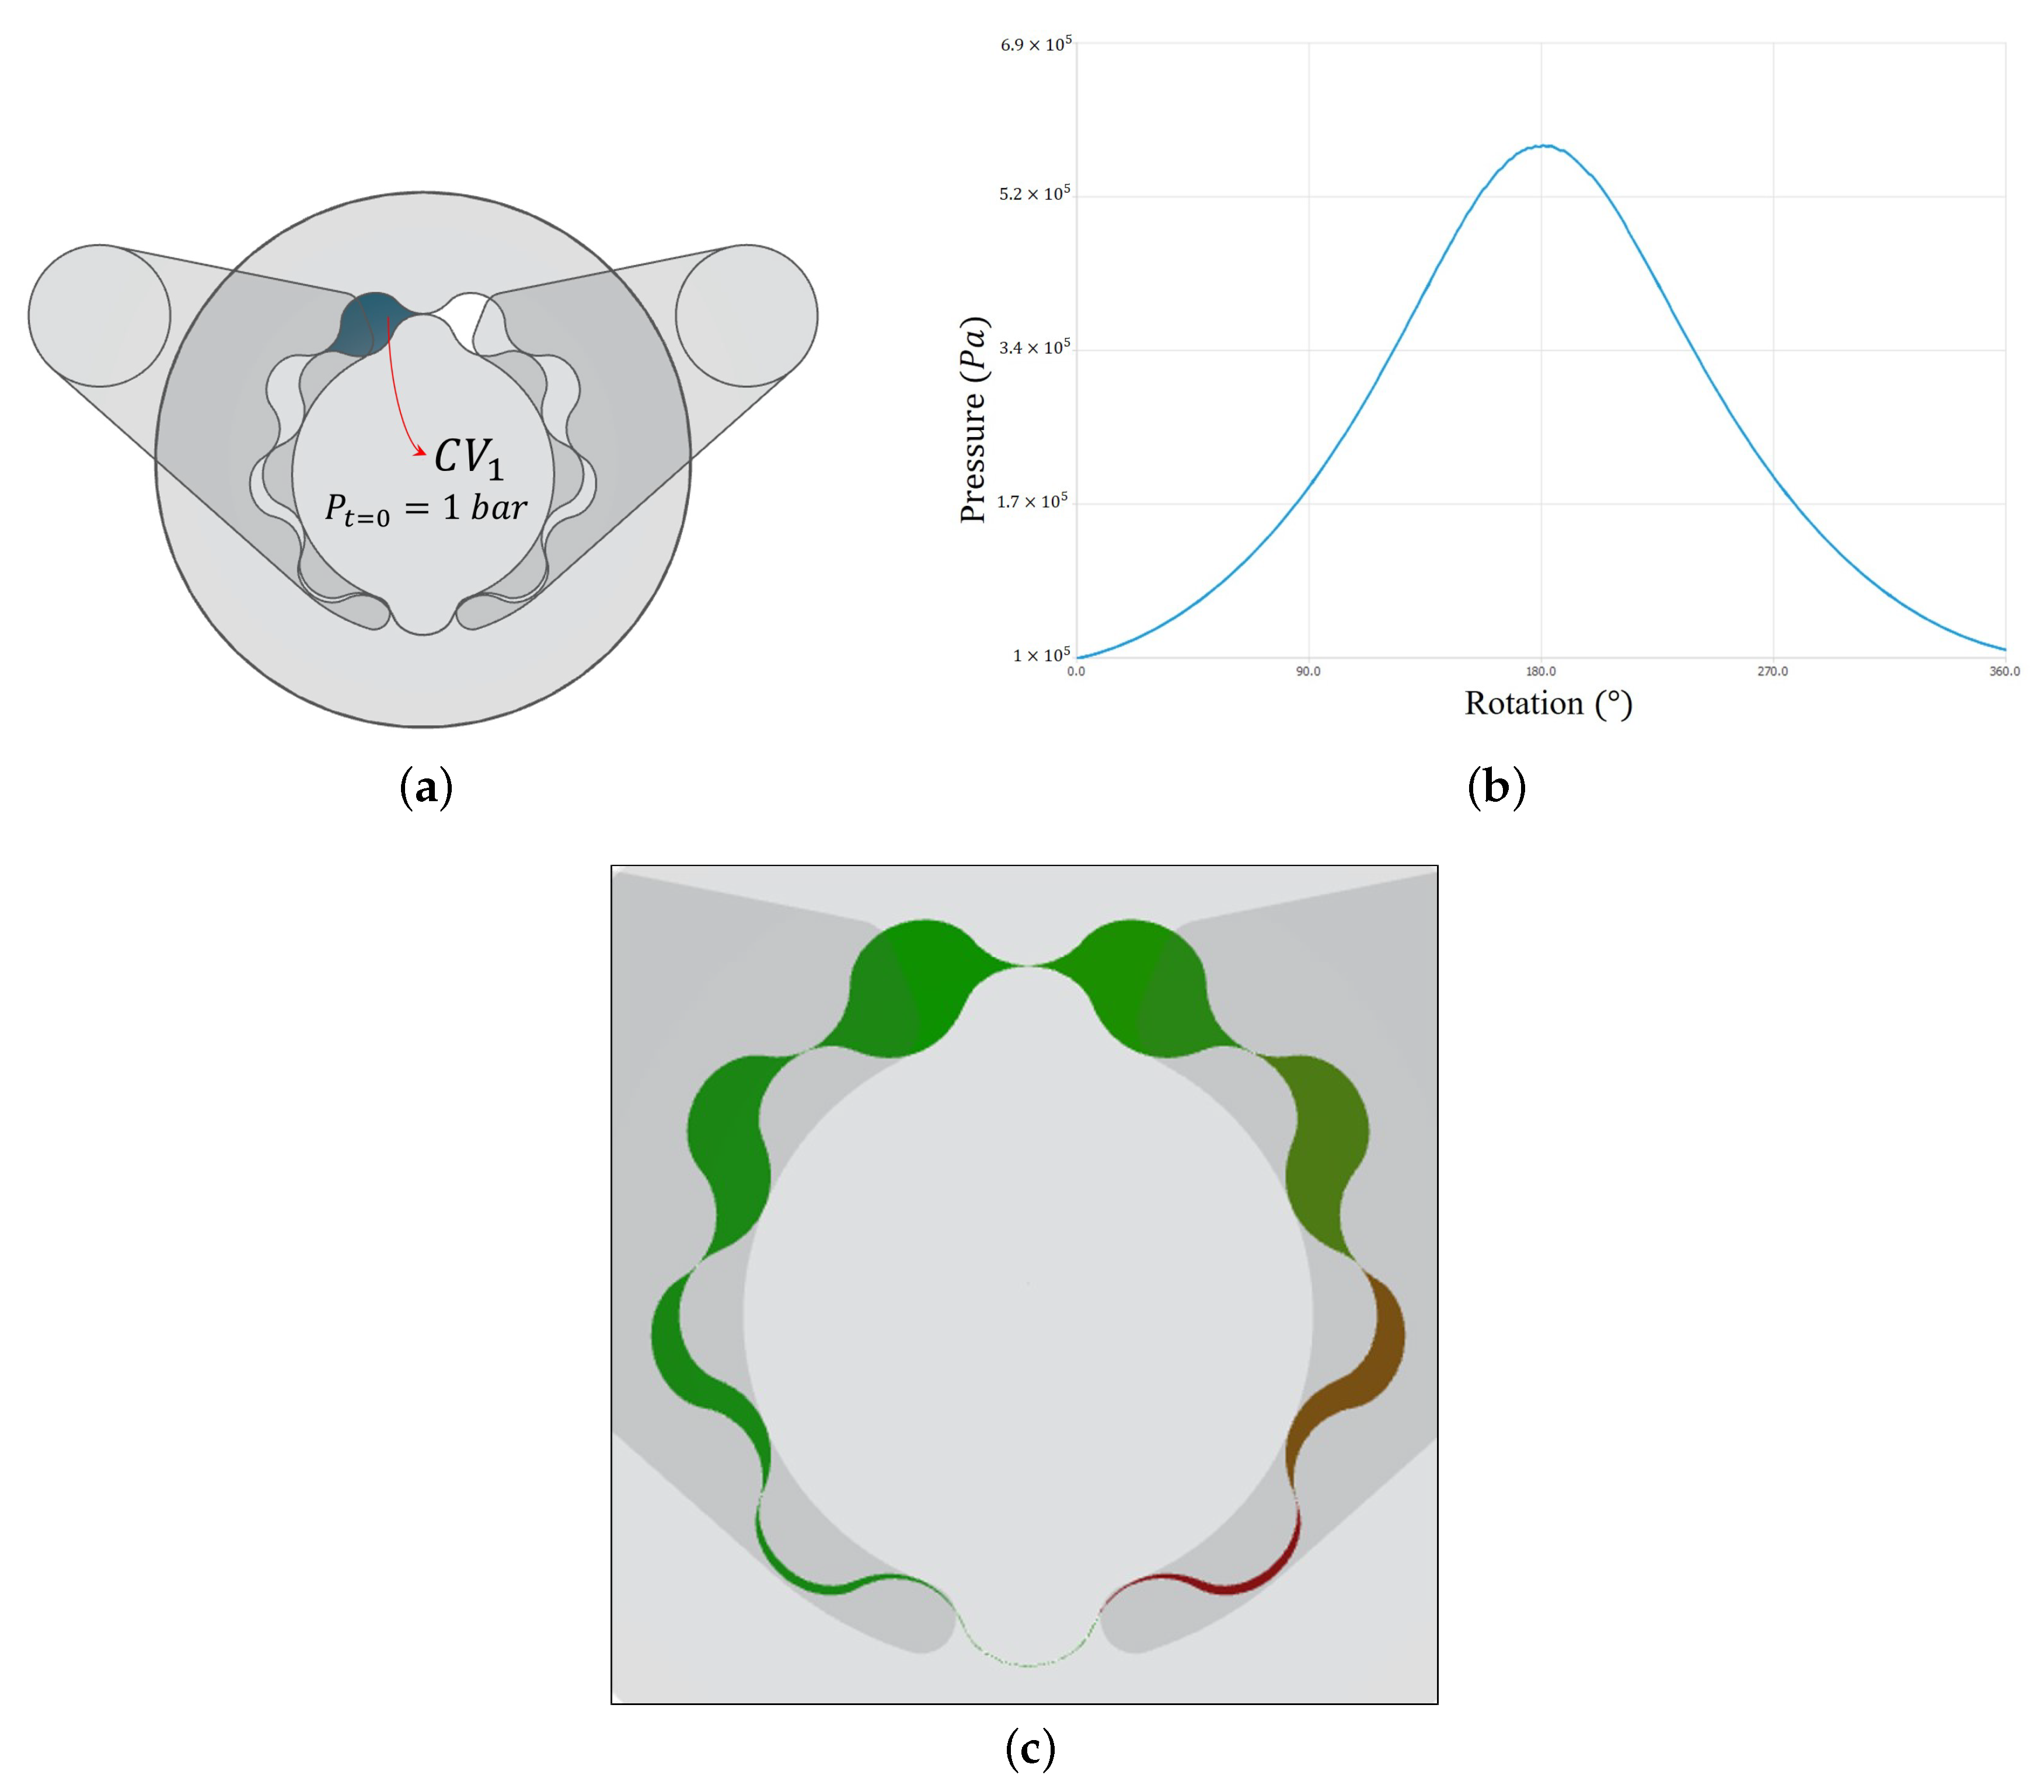
3.3. Fluid Dynamics Module
- Input/Output flow: fluid flowing from the input port to the inside of the pump (charge) or from the inside of the pump to the output port (discharge).
- Fluid leak flow: fluid flowing from one chamber to another due to imperfect sealing that results from manufacturing defects and design constraints.
- Difference of pressure between adjacent control volumes (Poiseuille flow).
- Difference in angular speed between inner and outer rotor (Couette flow).
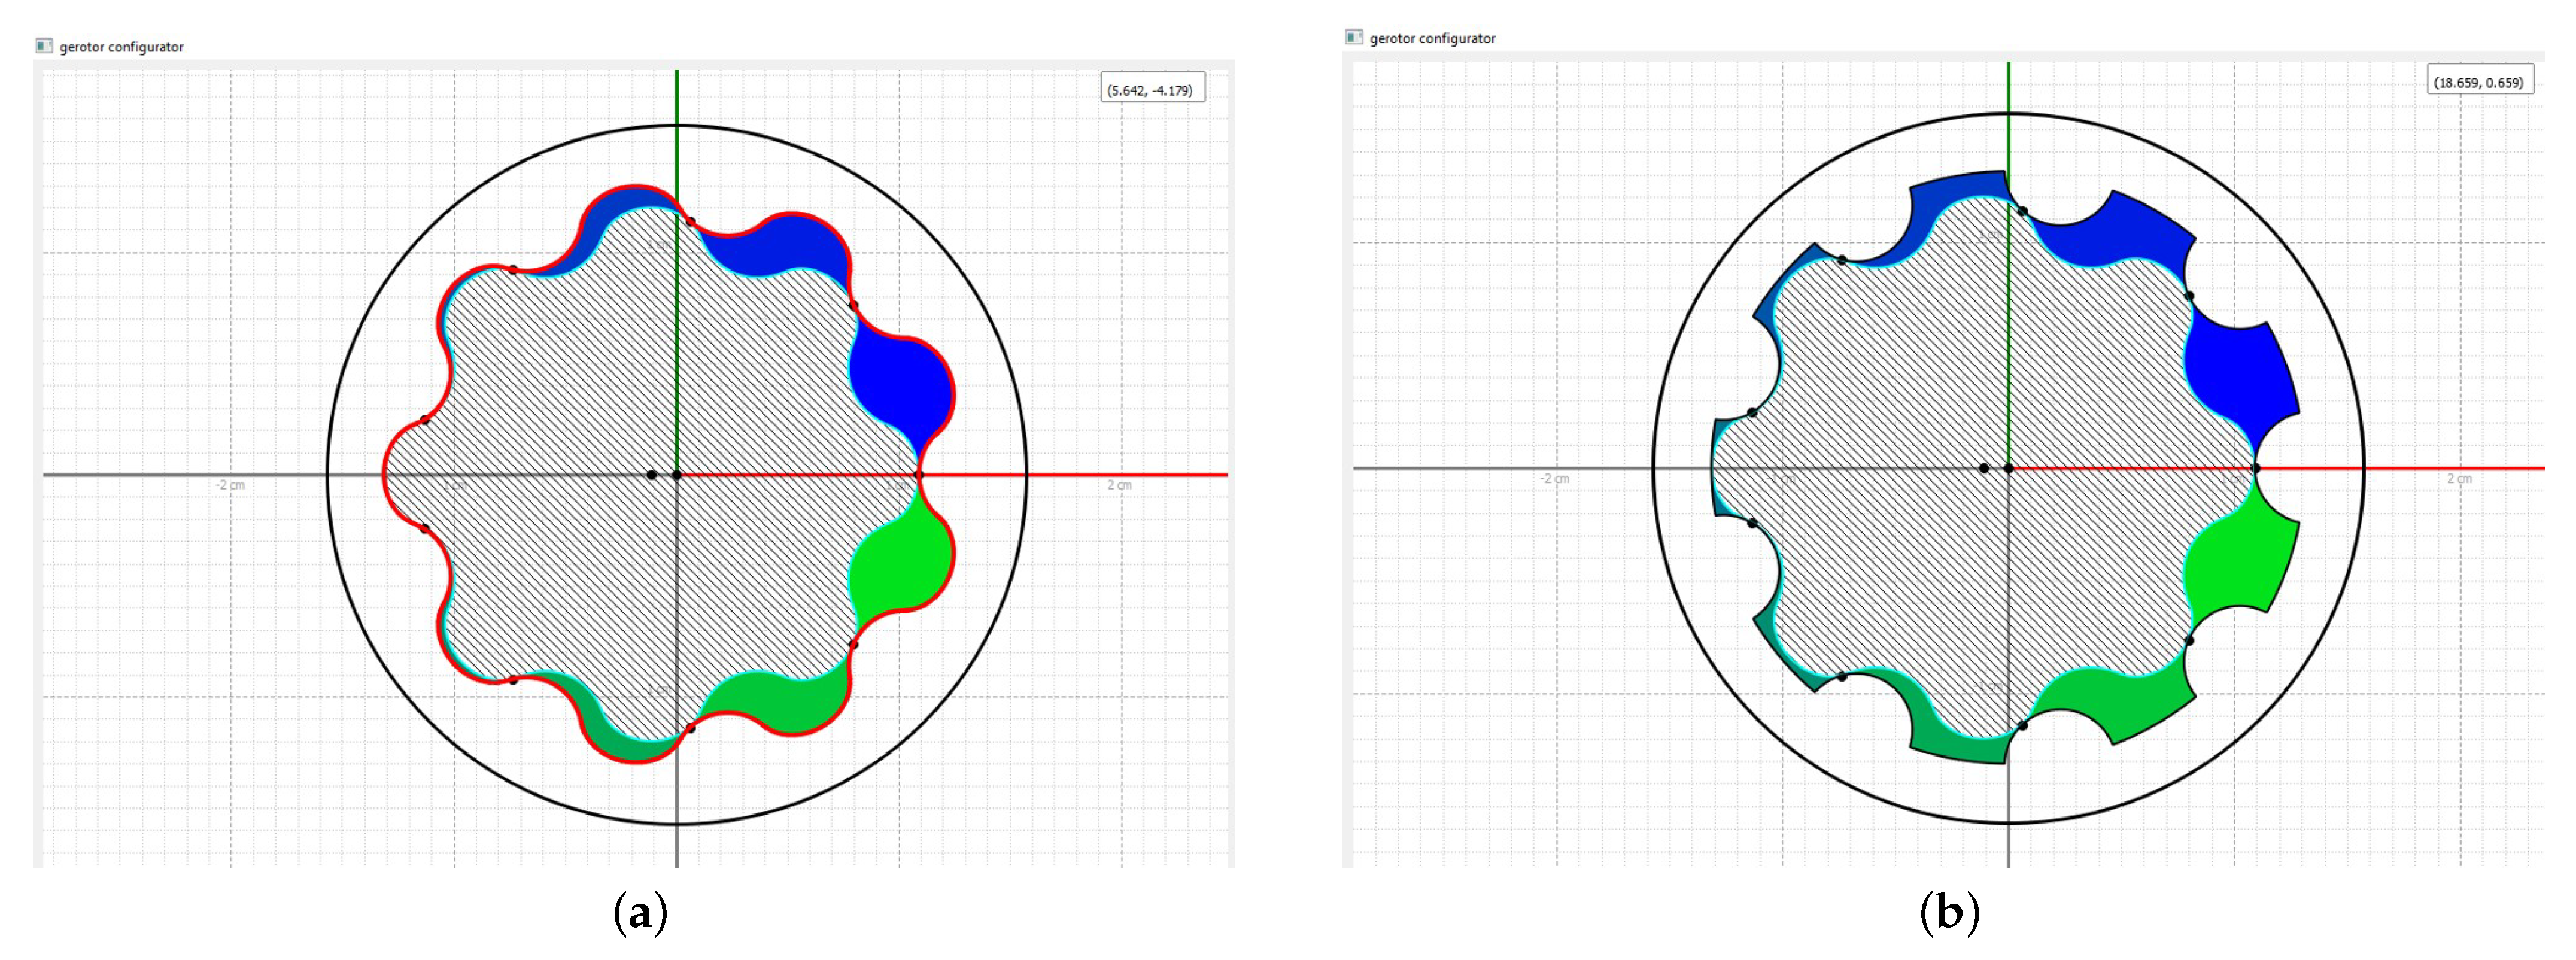
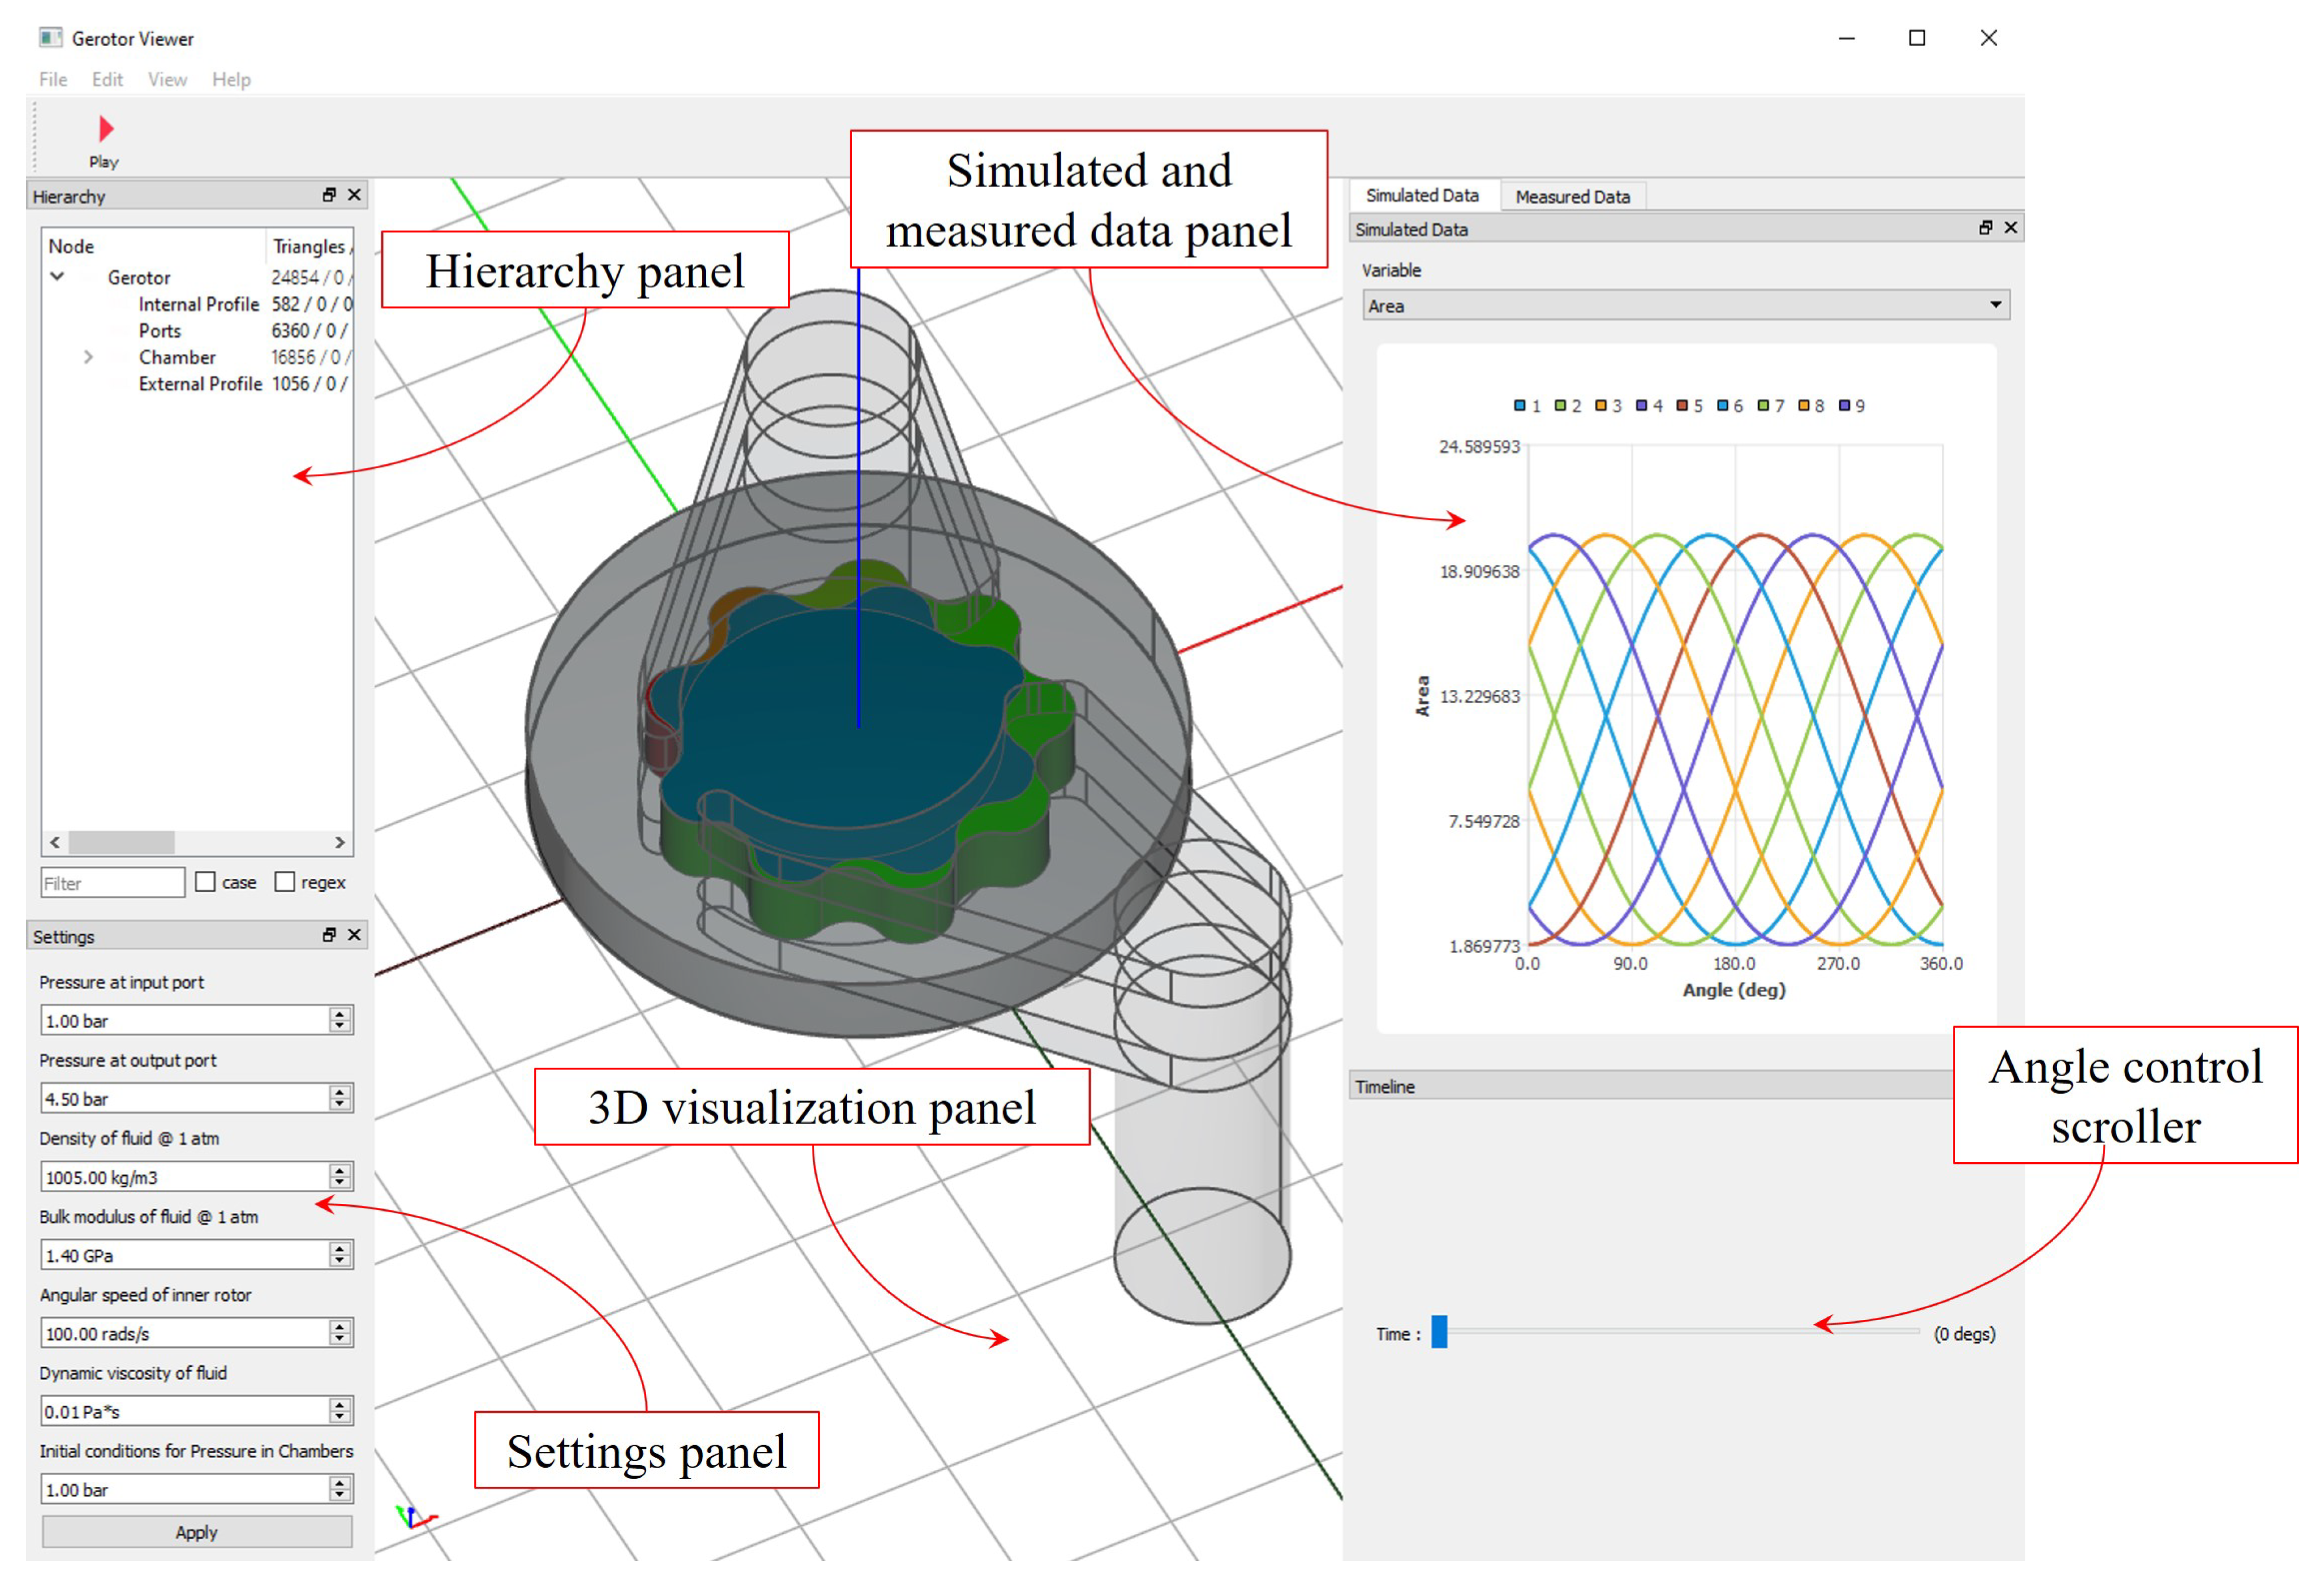
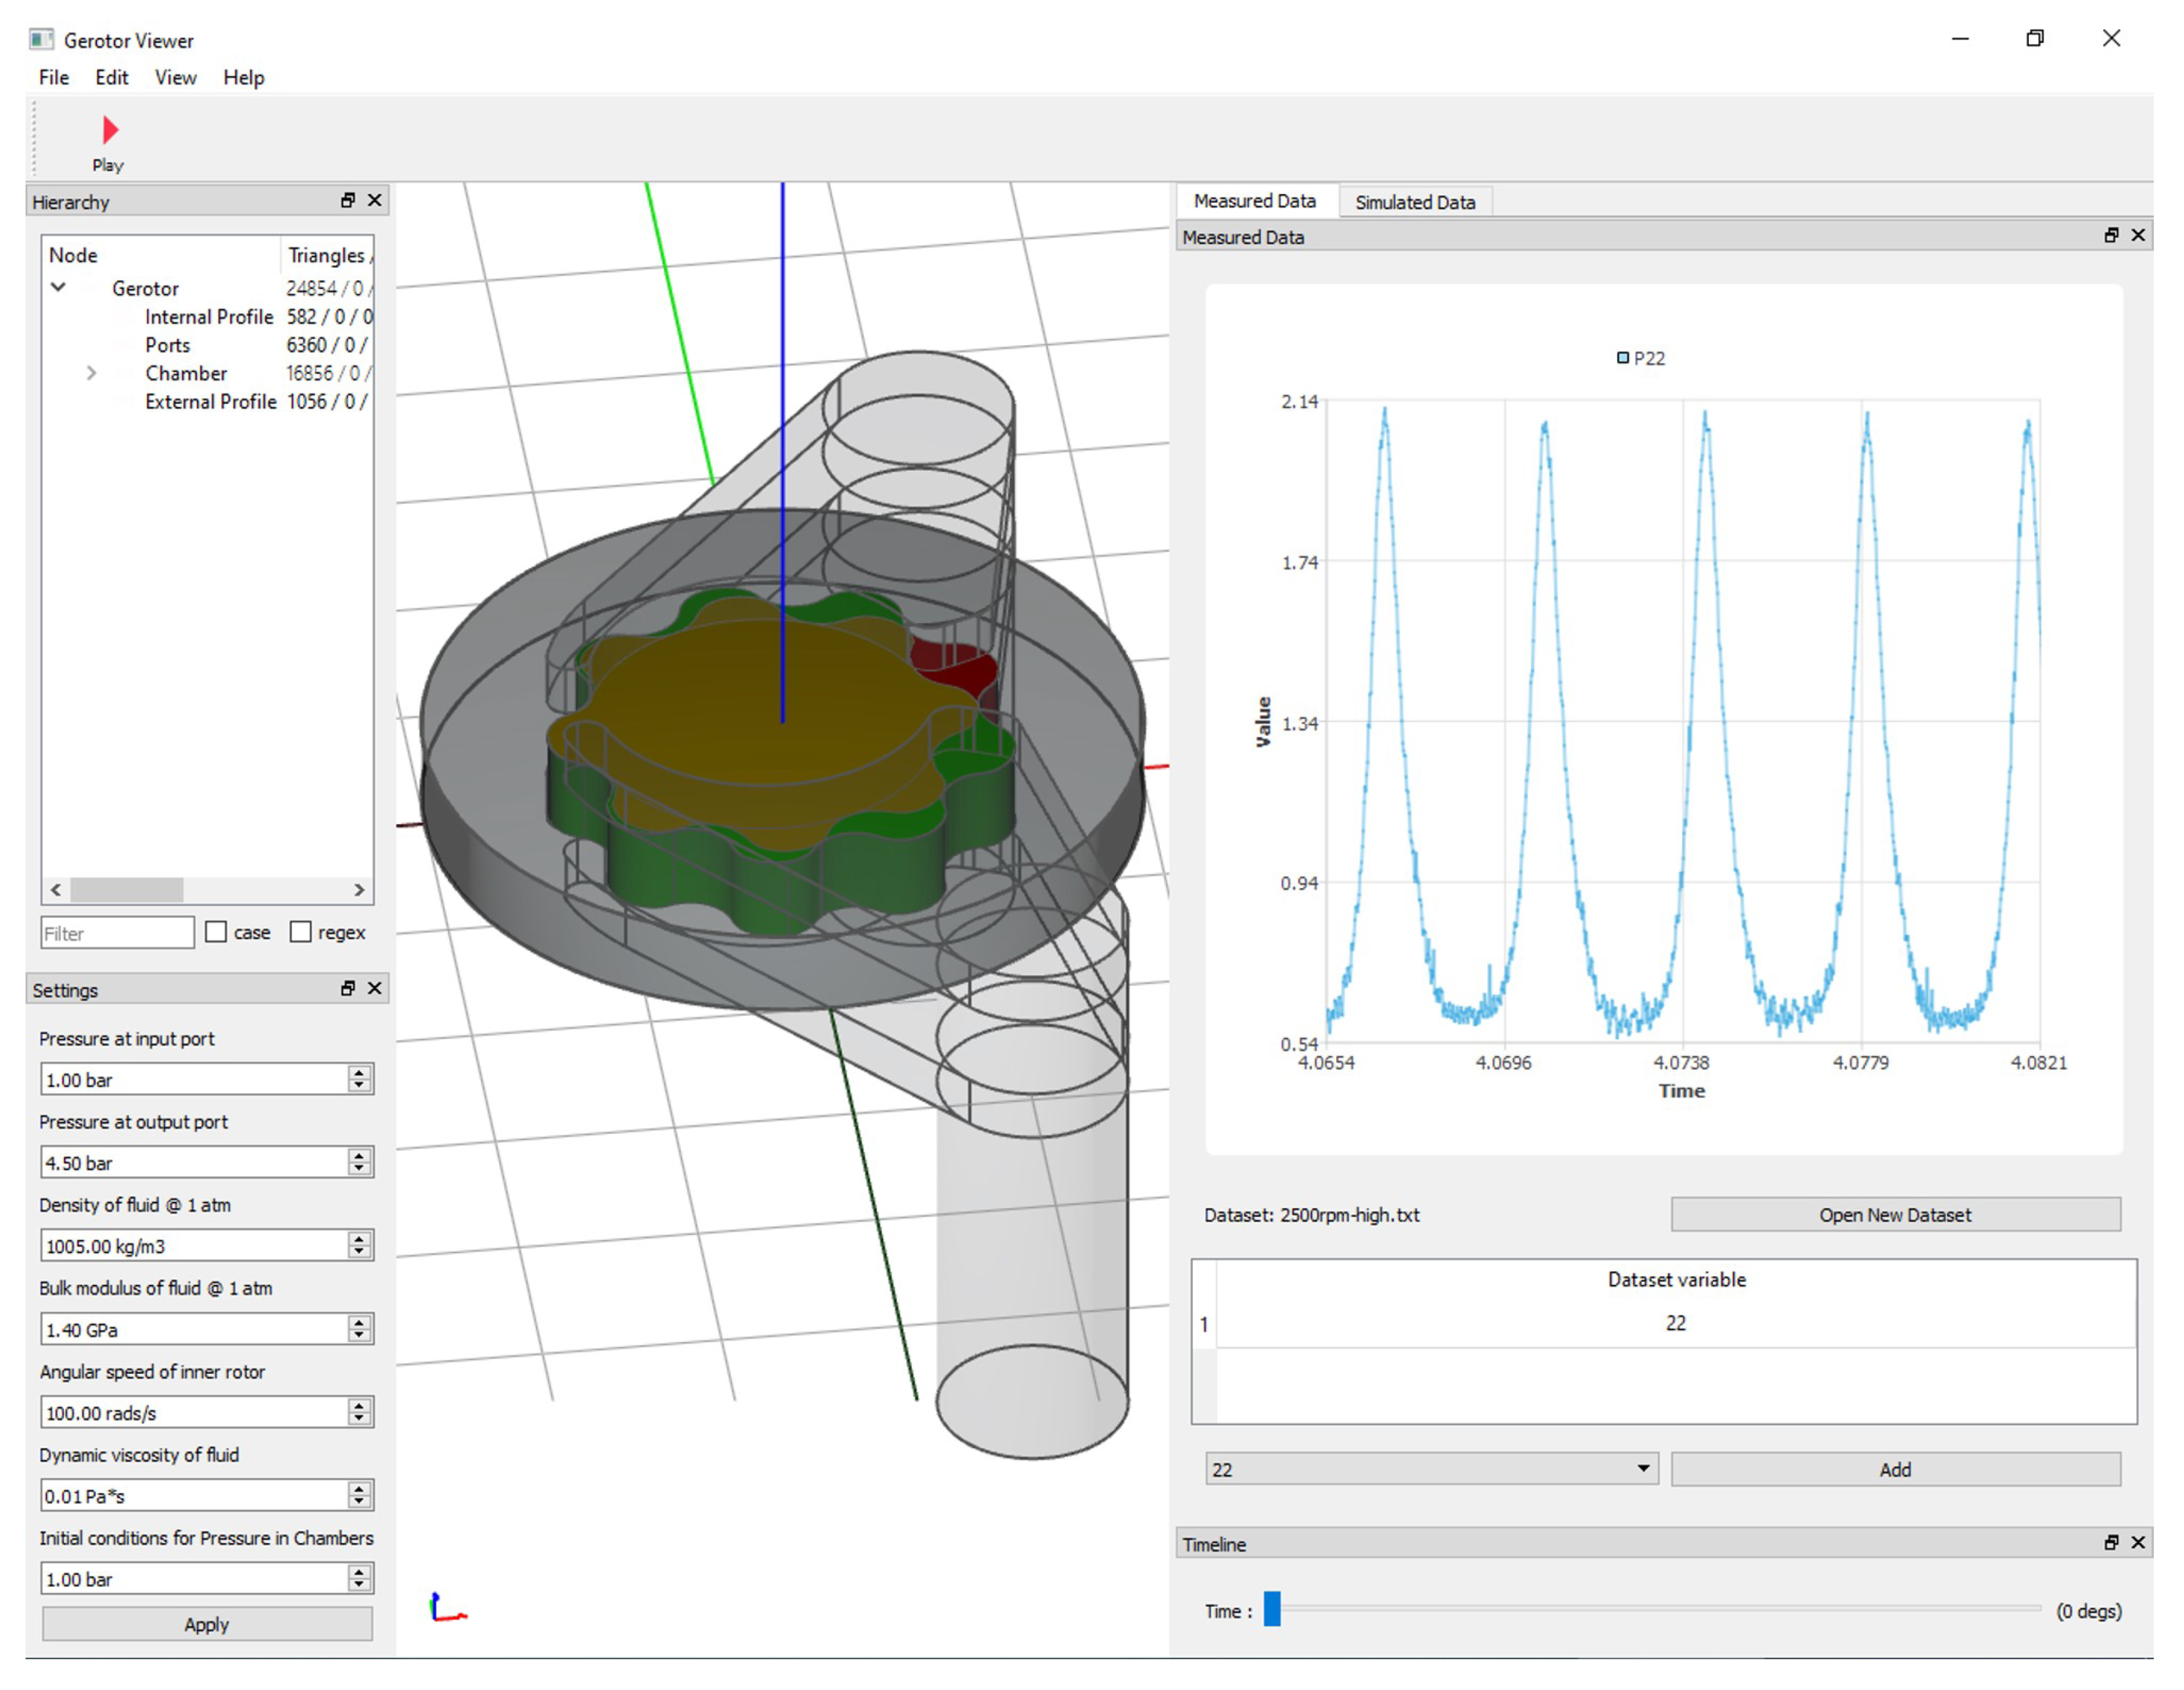
3.4. Software Tool
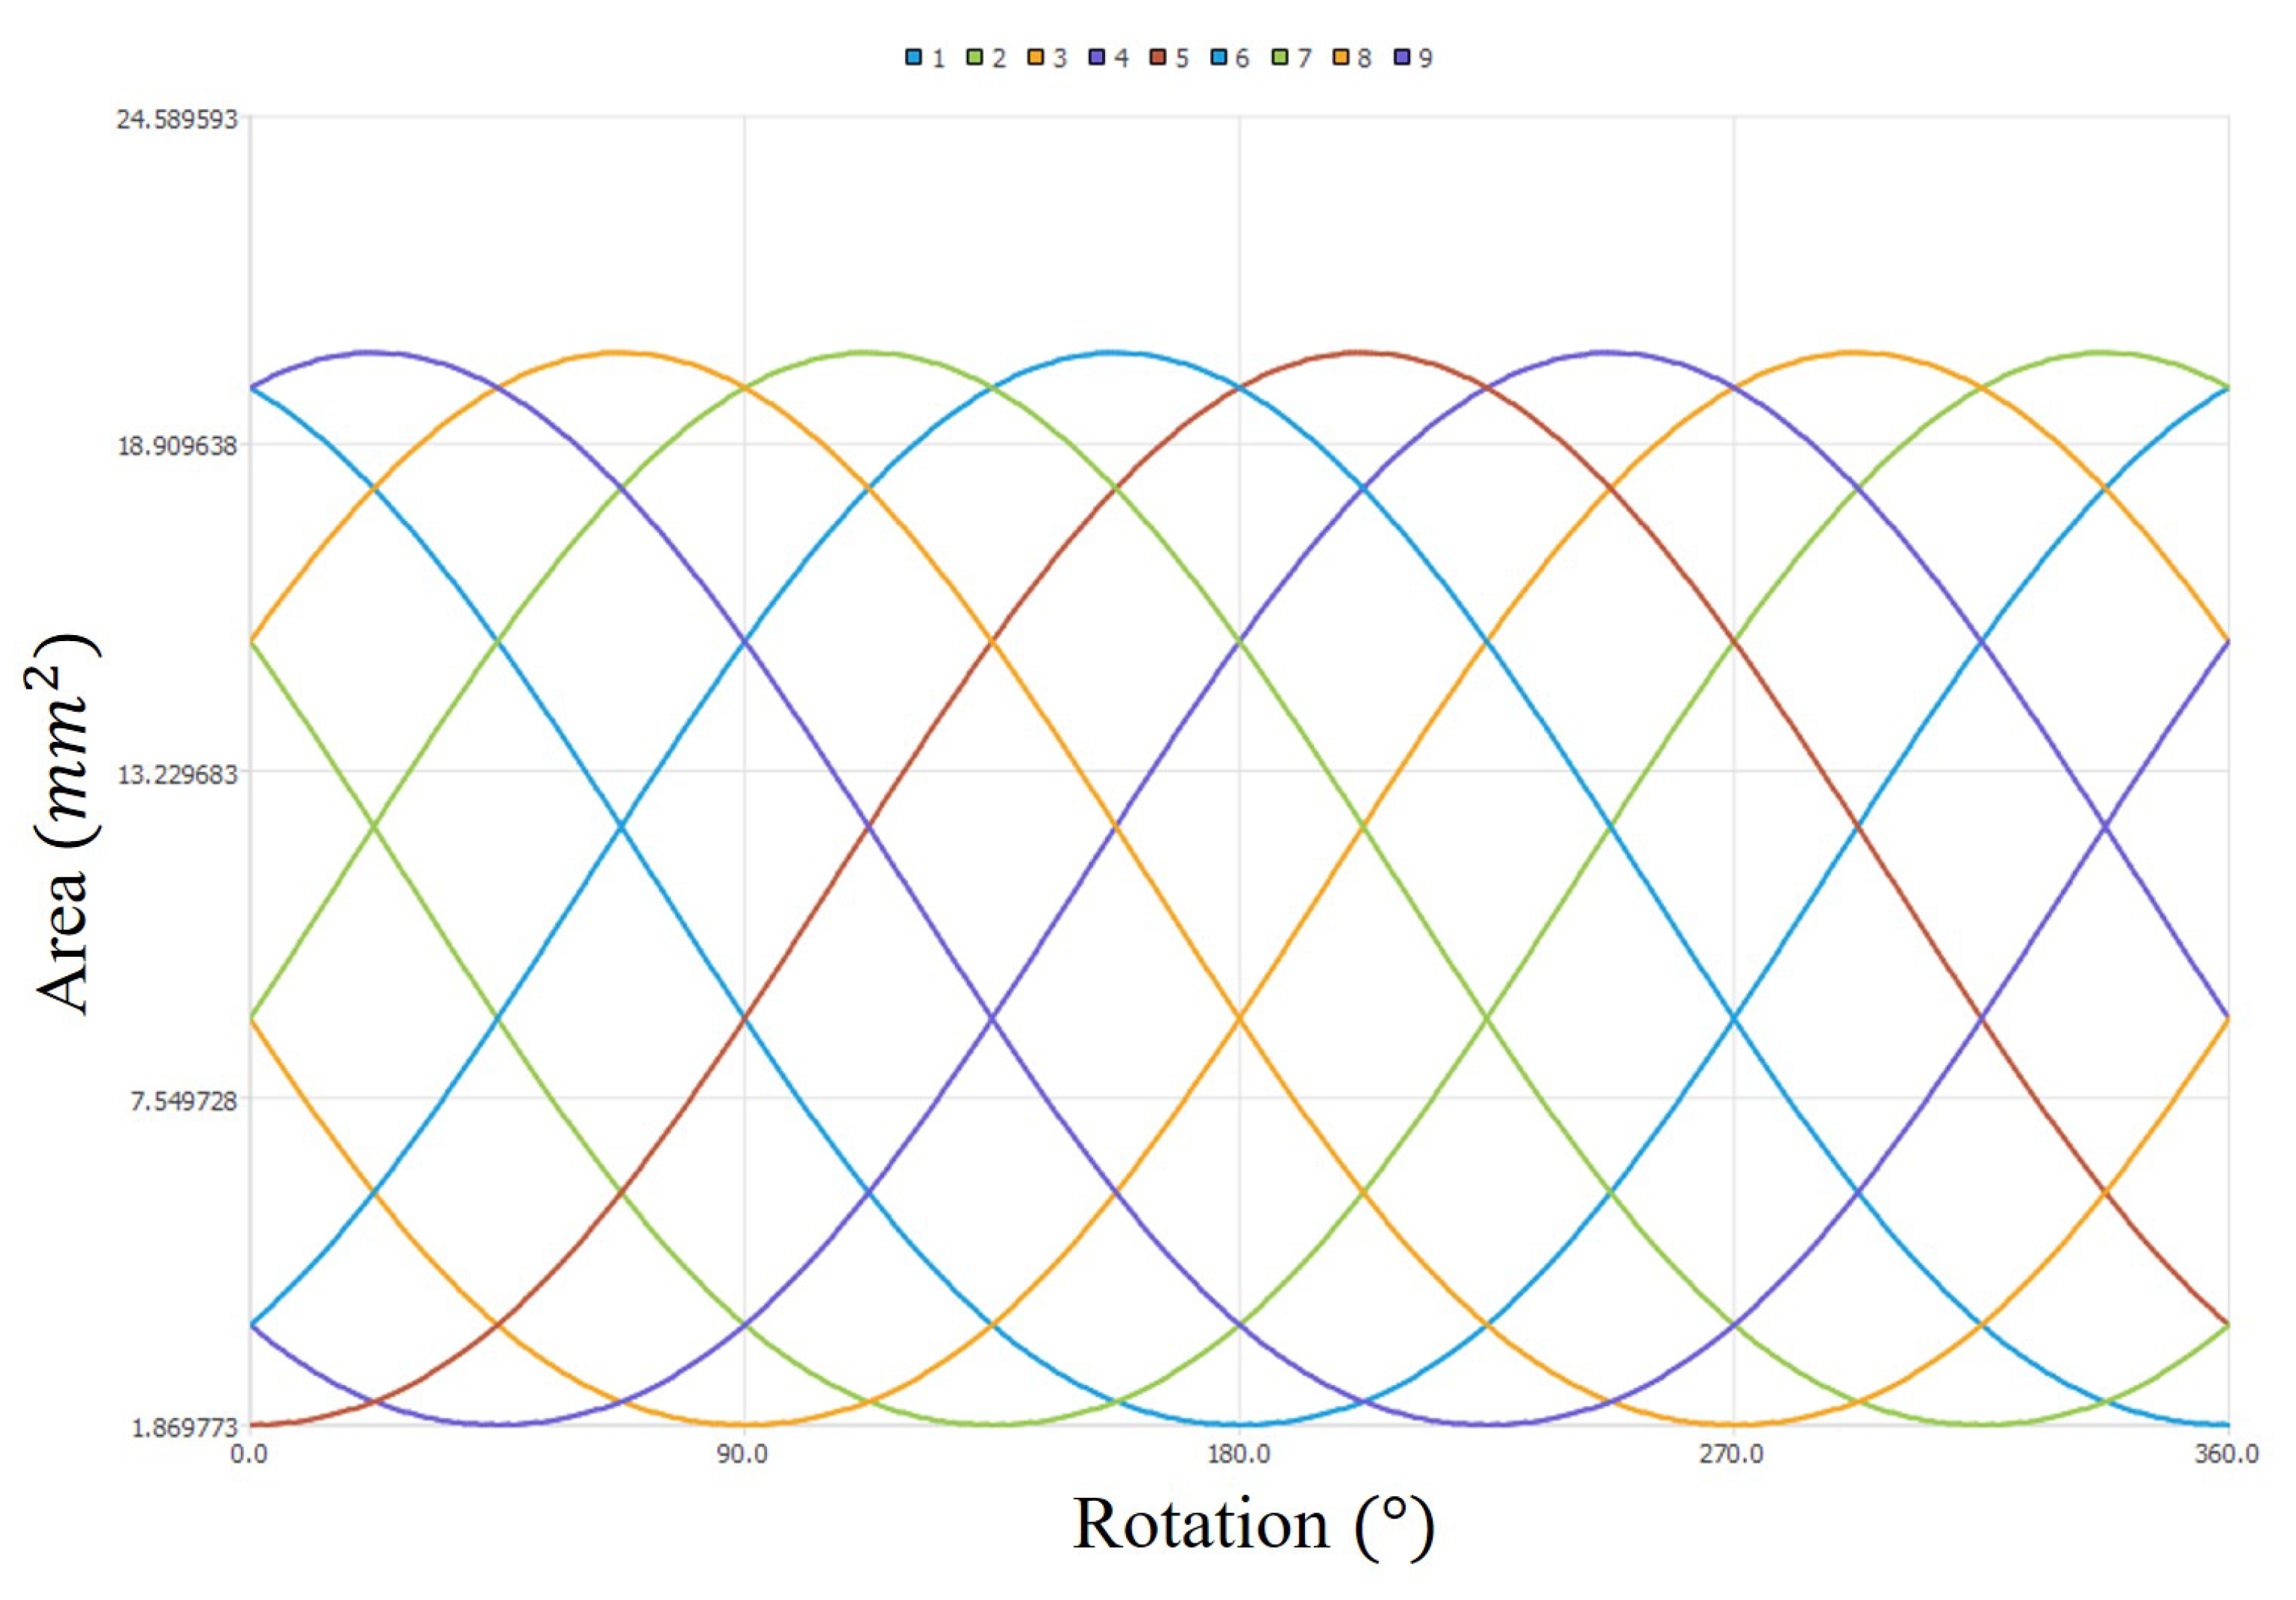
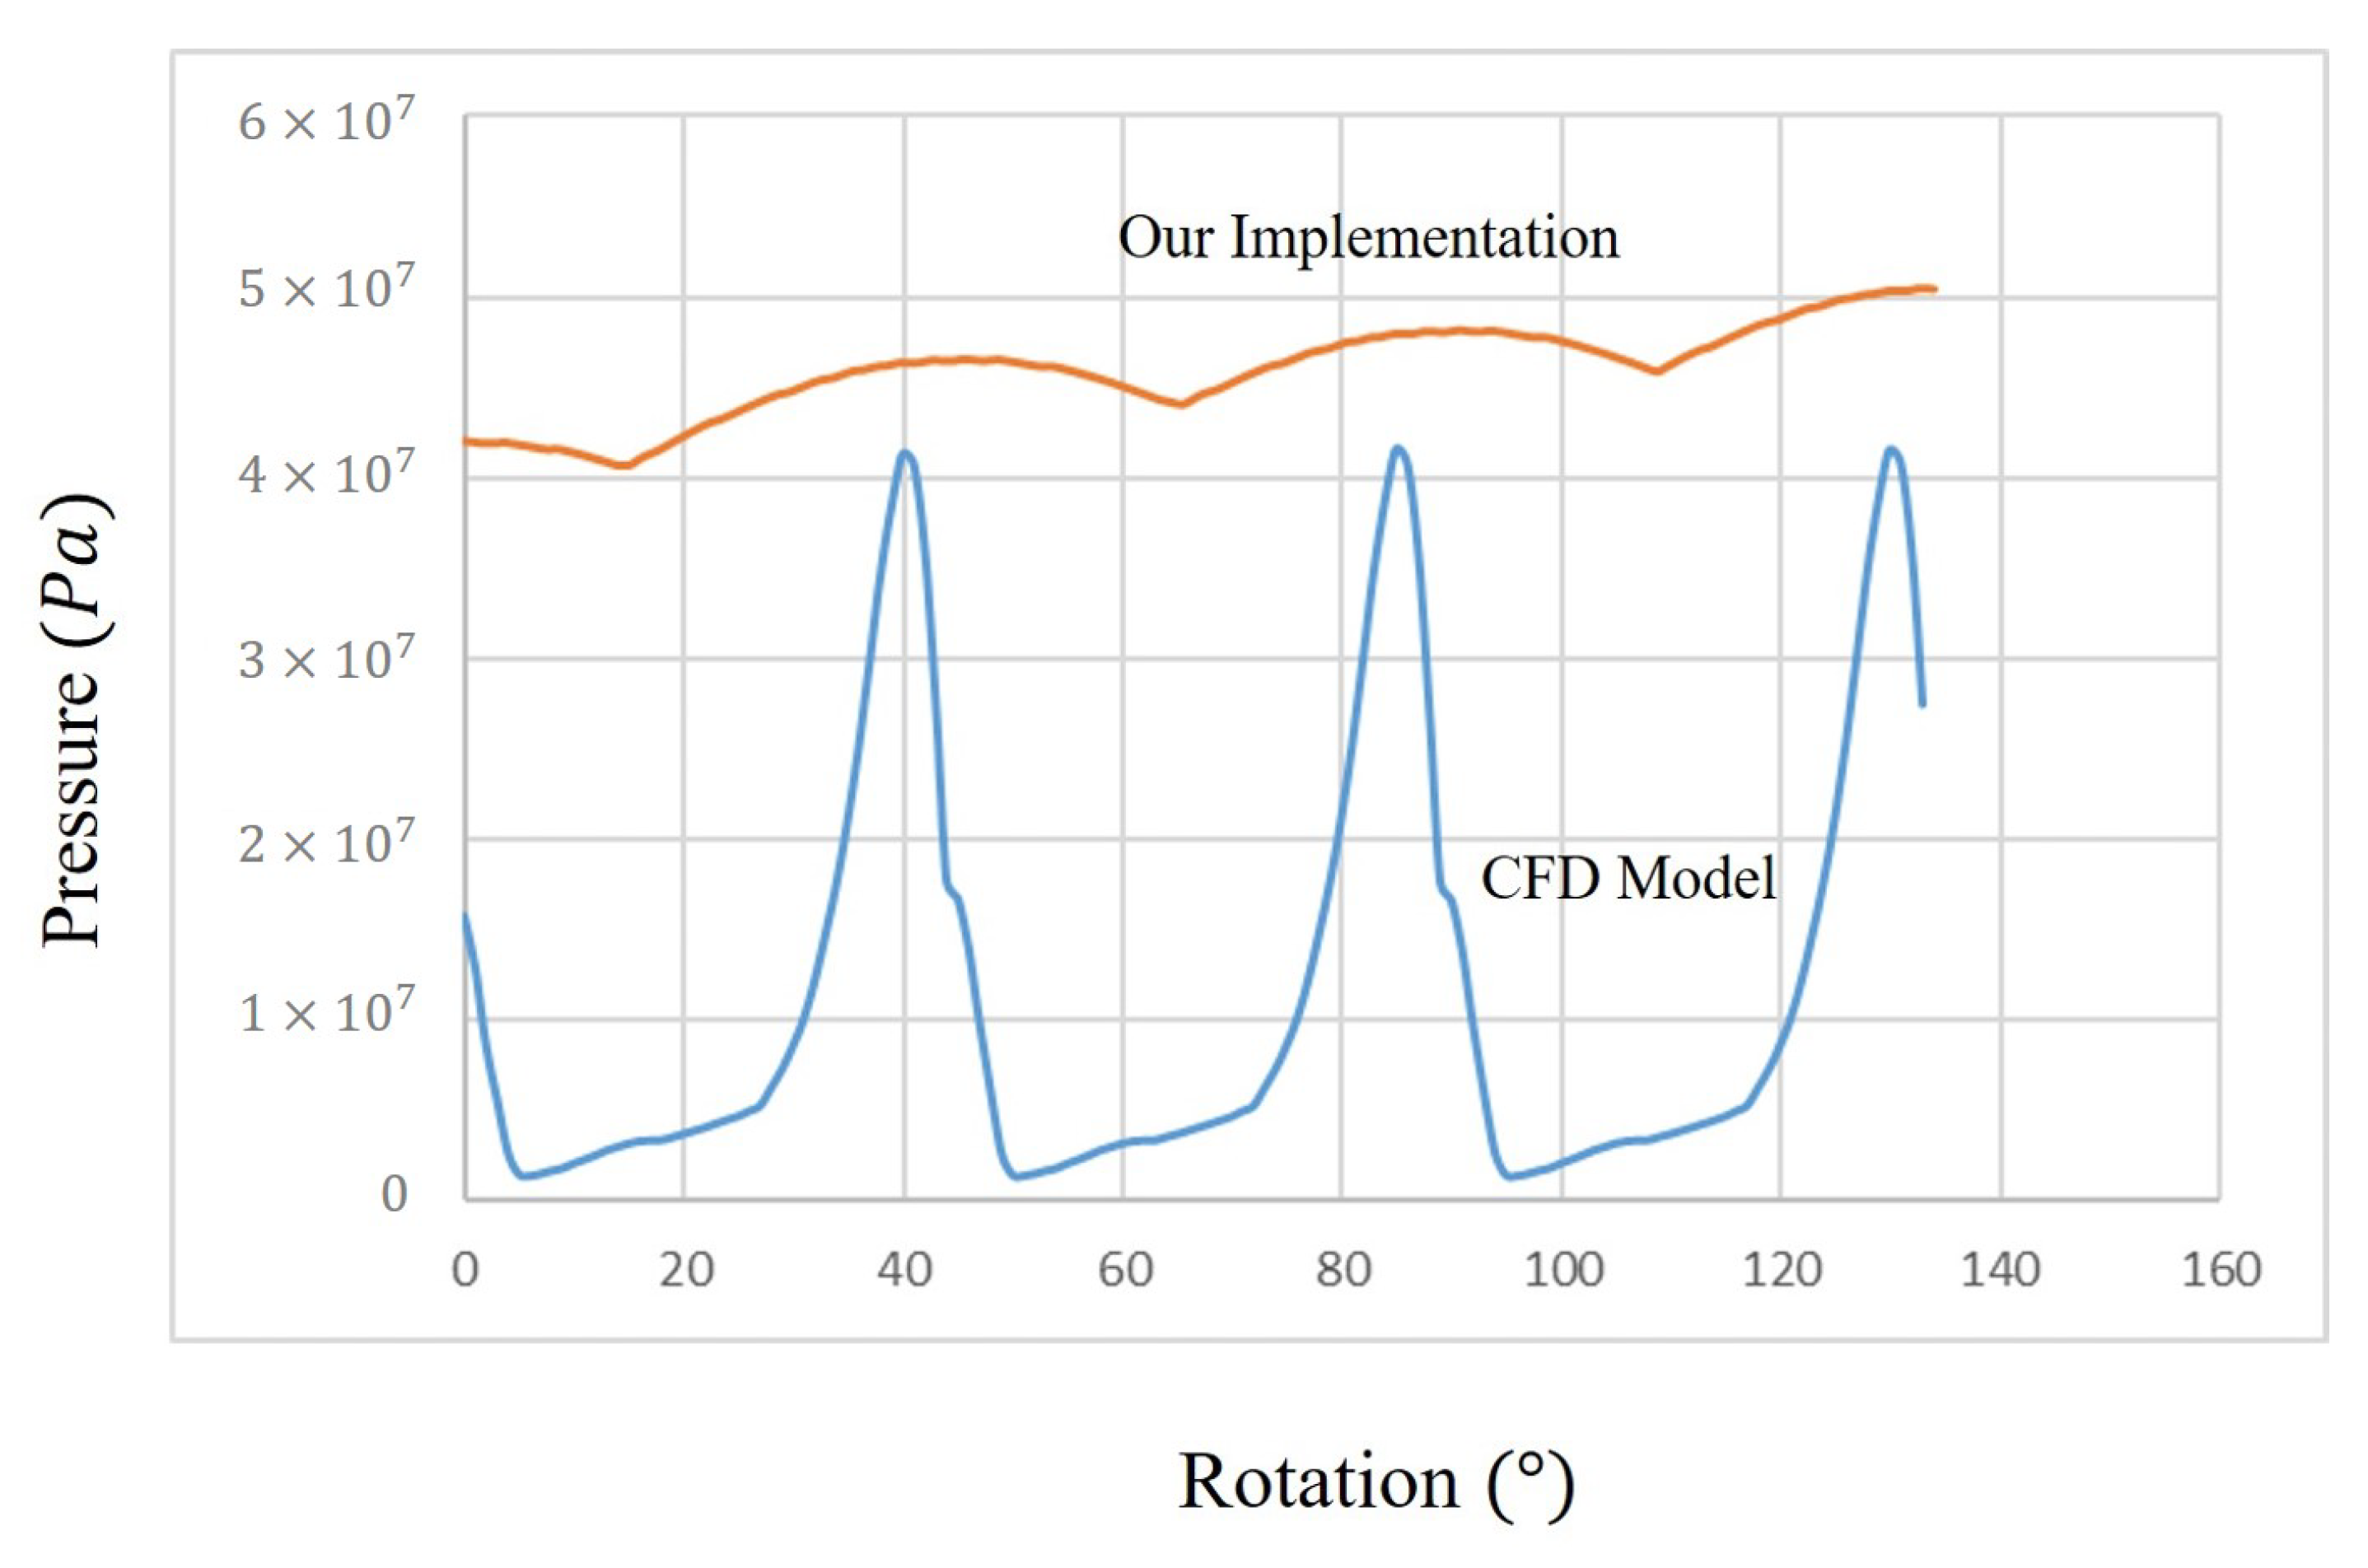
4. Results
5. Conclusions and Future Work
Author Contributions
Funding
Acknowledgments
Conflicts of Interest
Abbreviations
| LP | Lumped Parameter. |
| CFD | Computational Fluid Dynamics. |
| Pressure at chamber i. | |
| Area at chamber i. | |
| Volume at chamber i. | |
| Net flowrate at chamber i. | |
| Shared area between chamber i and output port. | |
| Shared area between chamber i and input port. | |
| Discharge coefficient. | |
| Maximum discharge coefficient. | |
| Effective bulk’s modulus of working fluid. | |
| Effective density of working fluid. | |
| Kinematic viscosity of working fluid. | |
| Dynamic viscosity of working fluid. | |
| Reynold’s number. | |
| Critical Reynold’s number. | |
| Hydraulic diameter. | |
| Pressure at input port. | |
| Pressure at output port. | |
| Angular speed of inner gear. |
References
- Gamez-Montero, P.J.; Codina, E.; Castilla, R. A review of gerotor technology in hydraulic machines. Energies 2019, 12, 2423. [Google Scholar] [CrossRef]
- Castilla, R.; Gamez-Montero, P.; Ertürk, N.; Vernet, A.; Coussirat, M.; Codina, E. Numerical simulation of turbulent flow in the suction chamber of a gearpump using deforming mesh and mesh replacement. Int. J. Mech. Sci. 2010, 52, 1334–1342. [Google Scholar] [CrossRef]
- Houzeaux, G.; Codina, R. A finite element method for the solution of rotary pumps. Comput. Fluids 2007, 36, 667–679. [Google Scholar] [CrossRef]
- Hsieh, C.F. Fluid and dynamics analyses of a gerotor pump using various span angle designs. J. Mech. Des. 2012, 134. [Google Scholar] [CrossRef]
- Bae, J.H.; Kwak, H.S.; San, S.; Kim, C. Design and CFD analysis of gerotor with multiple profiles (ellipse–involute–ellipse type and 3-ellipses type) using rotation and translation algorithm. Proc. Inst. Mech. Eng. Part C J. Mech. Eng. Sci. 2016, 230, 804–823. [Google Scholar] [CrossRef]
- Rundo, M.; Altare, G. Lumped Parameter and Three-Dimensional CFD Simulation of a Variable Displacement Vane Pump for Engine Lubrication. J. Fluids Eng. 2018, 140, 61–101. [Google Scholar] [CrossRef]
- Gamez-Montero, P.J.; Castilla, R.; del Campo, D.; Ertürk, N.; Raush, G.; Codina, E. Influence of the interteeth clearances on the flow ripple in a gerotor pump for engine lubrication. Proc. Inst. Mech. Eng. Part D J. Automob. Eng. 2012, 226, 930–942. [Google Scholar] [CrossRef]
- Pellegri, M.; Vacca, A.; Frosina, E.; Buono, D.; Senatore, A. Numerical analysis and experimental validation of Gerotor pumps: A comparison between a lumped parameter and a computational fluid dynamics-based approach. Proc. Inst. Mech. Eng. Part C J. Mech. Eng. Sci. 2017, 231, 4413–4430. [Google Scholar] [CrossRef]
- Pellegri, M.; Vacca, A.; Devendran, R.S.; Dautry, E.; Ginsberg, B. A Lumped parameter approach for gerotor pumps: Model Formulation and experimental validation. In Proceedings of the 2016 10th International Fluid Power Conference, Dresden, Germany, 8–10 March 2016; Technische Universitat Dresden: Dresden, Germany, 2016; Volume 1, pp. 465–476. [Google Scholar]
- Shah, Y.; Vacca, A.; Dabiri, S.; Frosina, E. A fast lumped parameter approach for the prediction of both aeration and cavitation in Gerotor pumps. Meccanica 2018, 53, 175–191. [Google Scholar] [CrossRef]
- Rundo, M. Models for flow rate simulation in gear pumps: A review. Energies 2017, 10, 1261. [Google Scholar] [CrossRef]
- Tao, F.; Zhang, H.; Liu, A.; Nee, A.Y. Digital twin in industry: State-of-the-art. IEEE Trans. Ind. Inform. 2018, 15, 2405–2415. [Google Scholar] [CrossRef]
- Pires, F.; Cachada, A.; Barbosa, J.; Moreira, A.P.; Leitão, P. Digital Twin in Industry 4.0: Technologies, Applications and Challenges. In Proceedings of the 2019 IEEE 17th International Conference on Industrial Informatics (INDIN), Espoo, Finland, 22–25 July 2019; IEEE: Piscataway, NJ, USA, 2019; Volume 1, pp. 721–726. [Google Scholar]
- Mejia, D.; Moreno, A.; Arbelaiz, A.; Posada, J.; Ruiz-Salguero, O.; Chopitea, R. Accelerated thermal simulation for three-dimensional interactive optimization of computer numeric control sheet metal laser cutting. J. Manuf. Sci. Eng. 2018, 140. [Google Scholar] [CrossRef]
- Mejia-Parra, D.; Arbelaiz, A.; Ruiz-Salguero, O.; Lalinde-Pulido, J.; Moreno, A.; Posada, J. Fast Simulation of Laser Heating Processes on Thin Metal Plates with FFT Using CPU/GPU Hardware. Appl. Sci. 2020, 10, 3281. [Google Scholar] [CrossRef]
- Gámez Montero, P.J. Caracterizacion Fluidodinamica de una Bomba Oleohidráulica de Engranajes Internos Generados por Perfiles Trocoidales; Universitat Politècnica de Catalunya: Barcelona, Spain, 2004. [Google Scholar]
- Kwon, S.M.; Kang, H.S.; Shin, J.H. Rotor profile design in a hypogerotor pump. J. Mech. Sci. Technol. 2009, 23, 3459–3470. [Google Scholar] [CrossRef]
- Kim, S.; Murrenhoff, H. Measurement of effective bulk modulus for hydraulic oil at low pressure. J. Fluids Eng. 2012, 134. [Google Scholar] [CrossRef]
- Simões, B.; Creus, C.; Carretero, M.d.P.; Guinea Ochaíta, A. Streamlining XR Technology Into Industrial Training and Maintenance Processes. In The 25th International Conference on 3D Web Technology; Association for Computing Machinery: New York, NY, USA, 2020. [Google Scholar] [CrossRef]
- Simões, B.; del Puy Carretero, M.; Santiago, J.M. Photorealism and Kinematics for Web-Based CAD Data. In The 25th International Conference on 3D Web Technology; Association for Computing Machinery: New York, NY, USA, 2020. [Google Scholar] [CrossRef]
- Castilla López, R.; Gámez Montero, P.J.; Raush Alviach, G.A.; Codina Macià, E. Three dimensional simulation of gerotor with deforming mesh by using OpenFOAM. In Proceedings of the Fluid Power Networks: Proceedings: 19th-21th March 2018: 11th International Fluid Power Conference, Aachen, Germany, 19–21 March 2018; pp. 260–271. [Google Scholar]


| Variable | Value | Units |
|---|---|---|
| Pressure at input port () | 1 | bar |
| Pressure at output port () | 4.5 | bar |
| Density of fluid at 1 atm () | 1005 | kg/m |
| Bulk modulus of fluid at 1 atm () | 1.4 | GPa |
| Angular speed of inner rotor () | 100 | rad/s |
| Dynamic viscosity () | 0.01 | Pa*s |
| Pressure in chambers at | 1 | bar |
| Task | CFD Time | Our Implementation Time |
|---|---|---|
| Pre-Processing of Geometry | 1 h | <5 min |
| Simulation | 9 h | <5 min |
Publisher’s Note: MDPI stays neutral with regard to jurisdictional claims in published maps and institutional affiliations. |
© 2021 by the authors. Licensee MDPI, Basel, Switzerland. This article is an open access article distributed under the terms and conditions of the Creative Commons Attribution (CC BY) license (http://creativecommons.org/licenses/by/4.0/).
Share and Cite
Pareja-Corcho, J.; Moreno, A.; Simoes, B.; Pedrera-Busselo, A.; San-Jose, E.; Ruiz-Salguero, O.; Posada, J. A Virtual Prototype for Fast Design and Visualization of Gerotor Pumps. Appl. Sci. 2021, 11, 1190. https://doi.org/10.3390/app11031190
Pareja-Corcho J, Moreno A, Simoes B, Pedrera-Busselo A, San-Jose E, Ruiz-Salguero O, Posada J. A Virtual Prototype for Fast Design and Visualization of Gerotor Pumps. Applied Sciences. 2021; 11(3):1190. https://doi.org/10.3390/app11031190
Chicago/Turabian StylePareja-Corcho, Juan, Aitor Moreno, Bruno Simoes, Asier Pedrera-Busselo, Ekain San-Jose, Oscar Ruiz-Salguero, and Jorge Posada. 2021. "A Virtual Prototype for Fast Design and Visualization of Gerotor Pumps" Applied Sciences 11, no. 3: 1190. https://doi.org/10.3390/app11031190
APA StylePareja-Corcho, J., Moreno, A., Simoes, B., Pedrera-Busselo, A., San-Jose, E., Ruiz-Salguero, O., & Posada, J. (2021). A Virtual Prototype for Fast Design and Visualization of Gerotor Pumps. Applied Sciences, 11(3), 1190. https://doi.org/10.3390/app11031190