Article

Electrochemical Characterization of Novel Polyantimonic-Acid-Based Proton Conductors for Low- and Intermediate-Temperature Fuel Cells

by
Olga Yu. Kurapova
1,*,
Pedro M. Faia
2,*,
Artem A. Zaripov
1,
Vasily V. Pazheltsev
1,
Artem A. Glukharev
1 and
Vladimir G. Konakov
3
1
Institute of Chemistry, Department of Physical Chemistry, Saint Petersburg State University, Universitetskya Nab. 7/9, 199034 St. Petersburg, Russia
2
Center of Mechanical Engineering, Materials and Processes, Electrical and Computer Engineering Department, Faculty of Sciences and Technology, University of Coimbra, Polo 2, Pinhal de Marrocos, 3030-290 Coimbra, Portugal
3
Institute of Chemistry, Peter the Great Saint Petersburg Polytechnic University, 29 Polytechnicheskaya Str., 195251 St. Petersburg, Russia
*
Authors to whom correspondence should be addressed.
Appl. Sci. 2021, 11(24), 11877; https://doi.org/10.3390/app112411877
Submission received: 18 November 2021 / Revised: 7 December 2021 / Accepted: 10 December 2021 / Published: 14 December 2021
(This article belongs to the Special Issue Technology and Application of Electrochemical Impedance Spectroscopy)

Abstract

:
The development of novel proton-conducting membrane materials for electrochemical power units, i.e., low temperature fuel cells (FCs), efficiently working up to 300 °C, is a critical problem related to the rapid shift to hydrogen energy. Polyantimonic acid (PAA) is characterized by high conductivity, sufficient thermal stability and can be regarded as a prospective proton-conducting material. However, the fabrication of bulk PAA-based membranes with high proton conductivity remains a challenging task. In the present work, for the first time, the authors report the investigation on proton conductivity of bulk PAA-based membranes in the temperature range 25–250 °C, both in dry air and in moisturized air. Using PAA powder and fluoroplastic as a binder, fully dense cylindrical membranes were formed by cold uniaxial pressing. The structures of the PAA-based membranes were investigated by SEM, EDX, XRD and Raman techniques. STA coupled with in situ thermo-XRD analysis revealed that the obtained membranes corresponded with Sb2O5·3H2O with pyrochlore structure, and that no phase transitions took place up to 330 °C. PAA-based membranes possess a high-grain component of conductivity, 5 × 10⁻² S/cm. Grain boundary conductivities of 90PAA and 80PAA membranes increase with relative humidity content and their values change non-linearly in the range 25–250 °C.

1. Introduction

The increasing need in clean energy resources is promoting research in the field of proton-conducting materials for low- and intermediate-temperature fuel cells (FCs) [1,2,3]. Membrane electrode assemblies (MEAs) play a key role in the overall fuel cell performance, because electrochemical reactions occur [4]. These consist of dense membranes (electrolytes) placed between porous electrodes. In cases where the electrolyte is a proton conductor, protons selectively penetrate the membrane bulk and move through towards the cathode where water and heat elaborate as a result of the reaction [5,6]. The type and geometry of the membrane should be carefully chosen, not only in accordance with the operation conditions of the fuel cell, but considering other parameters such as working temperature, fuel, moisture presence, catalysts, etc. [7,8]. The general requirements for electrolyte use as a membrane in electrochemical cells (such as fuel cells), electrochemical reactors and sensors are [9]: high conductivity in the required temperature range; fast proton transport; temperature and phase (structural) stability; absence of side reactions with anode and interconnect materials, i.e., chemical inertness; and high density of the membrane, making it impenetrable for the other components of a gas or fuel mixture.
Polymeric membranes are most commonly used for MEA fabrication in fuel cell technology [4,10,11]. Their main advantages are low price and easy processability. However, they possess low chemical and thermal stability, as well as high gas bubble adhesion, which can easily result in membrane behavior deterioration [12,13]. “Nafion” family membranes have been known since the 1960s, and because of their superior conductive properties and rather high perm selectivity, they started to be commercially used in several types of fuel cells [14,15,16]. However, they possess low conductivity at low water content, and low mechanical strength at high temperatures [14,17,18]. As discussed by Tang et al. [17], the problem affecting long-term stability of the FCs is the decrease in conductivity due to decomposition of the polymer membrane. Consequently, these factors have led to searches for other types of inorganic proton conductors, which are less expensive and can overcome the “Nafion” family disadvantages. Several inorganic compounds, including fluorite and perovskite-based materials [19,20], various cerates [21], some acid salts with general composition MmHn(AO4)(m+n)/2 (M = K, Rb, NH4, Cs; A = S, Se) and CsH2(RO4) (R = P, As) [22,23] have shown rapid proton conduction, up to 10−2–10−3 S/cm. Some ion exchangers such as Sb2O5∙nH2O, ZrO2∙nH2O or SnO2∙nH2O are also super proton conductors [24]. In addition, the development of new composite membranes based on inorganic proton conductors combined with an organic matrix [25,26,27,28] has become a trending target for researchers. Despite exhibiting high conductivity, most of the listed compounds undergo phase transitions, resulting in new phases with low conductivity, or lose their chemical stability upon temperature increases.
Polyantimonic acid (PAA, Sb2O5∙nH2O, where 2 < n < 6) is regarded as a potential proton-conducting electrolyte for low- and intermediate-temperature FCs. It is a well-studied crystalline inorganic ion-exchanger [29] which exhibits high proton conductivity up to 10−1 S/cm and good chemical and thermal stability up to 400 °C [24,28,30]. In addition, PAA is an insoluble, non-toxic compound. Phosphorus-substituted PAA is commercially used for Cs, Rb, Sr and Ba radionuclide fixation in the human body (polysurmin drug) [31]. The formula H(H2O)SbO3·0.5H2O is sometimes used to reflect the non-equivalence of the water molecules in the crystal structure [32].
In cubic pyrochlore structures of PAA, antimony oxide exists in the form of corner-sharing [SbO6/2] octahedra connected in the anion skeleton, carrying an excess of negative charge [32]. This charge is compensated by a H+ proton or by an oxonium ion, H3O+, or by any of the exchangeable cations (Na+, Sr2+, Ag+, etc.). The protons and water molecules can be situated at the center of the hexagonal windows or at the center of the holes formed in the anion skeleton. The charge transfer mechanism of PAA is believed to be the Grotthuss mechanism (free proton displacement) [33]. Here, protons are displaced along the hydrogen bonds from one water molecule (oxonium ion) to another, in certain crystallographic positions in the PAA structure windows (16(d) and holes 8(b)). However, the existing electrochemical data are controversial and do not fully confirm the suggested mechanism: consequently, the question remains open. Independently, Leysen et al. [34] and Belinskaya [32], have reported that the properties of PAA significantly depend on the preparation and aging methodologies. Over the years, studies have been undertaken to obtain information about the electrical and transport properties of PAA [12,27,33,34], all looking for increased: proton conductivity [27,35]; perm selectivity [29,34]; chemical structure organization, wide temperature working range, and decreased activation energy [36]. In recent studies conducted by Yaroshenko et al. [27,33], proton conductivity and dielectric losses in PAA and PAA-based membranes were investigated using impedance spectroscopy technique. They showed that the samples had high resistivity, close to dielectric (about 0.5 MΩ) behavior, because PAA powder was placed between the electrodes, and not in a bulk membrane.
Despite its advantages as a membrane material, PAA cannot be compacted into a bulk membrane without a binder. In the literature, studies of PAA-based membrane compaction using different polymers, such as polyvinyl alcohol (PVA) [27], polysulfone (PSF) [12,13,37], polytetrafluoroethylene, poly(vinylidene fluoride) [34,37], or polyacrylonitrile [38], can be found. Existing results on the proton transport and electrochemical data of such membranes are rather fragmentary and, sometimes, contradictory [27,30,34]. In all cases, except for PVA, only film-geometry membranes were obtained. In the films, there is no direct contact between PAA grains, and proton transport cannot be realized through the polyantimonic acid bulk. It certainly contributes to the existing data contradiction. In the study by Yaroshenko et al. [27], bulk PAA proton-conducting decorated membranes were fabricated using 80–100 wt.% of PVA as a binder. They found that in the membranes with PAA content lower than 10 wt.%, proton transport was realized through the PVA binder. In addition, and in the presence of moisture, even a low PVA content in the membrane contributed to the total conductivity of the bulk PAA membrane. A complex impedance investigation of transport properties and electrochemical properties could reveal the mechanisms of proton transport in PAA, and thus find consistency in the electrochemical data. For that, the effects of binder content and of the concentration of carrier ions on the electrical response should first be investigated. Thus, the goal of the present work was to investigate binder content and moisture influence on the structure and electrical properties, respectively, of bulk PAA-based membranes, fabricated using an inert binder. Amounts of 10 and 20 wt.% of the inert fluoroplastic binder were used to fabricate bulk PAA membranes and, simultaneously, to ensure the existence of direct contact between grains. An equivalent circuit model describing the material electrical behavior was developed.

2. Materials and Methods

2.1. PAA-Based Membrane Fabrication

Based on literature data, polyantimonic acid (PAA) powder was synthesized via the controlled hydrolysis of SbCl5 (Lenreactiv, St Petersburg, c.p.), in order to obtain a stable crystalline compound. According to [32], this route is beneficial compared with SbCl3 hydrolysis or the solid-state synthesis of sodium antimonate due to the control of stoichiometry and absence of Sb3+ admixture. The aqueous hydrolysis of antimony pentachloride was performed as follows. First, 0.125 mol. of antimony pentachloride (Lenreactiv, St Petersburg, c.p.) was dropwise added to 10 L of distilled water under intensive stirring. Hydrolysis of acidified antimony pentachloride solution by HCl took place according to the reaction sequences presented in Equations (1)–(3):
H [ SbCl 6 ] + H 2 O     H [ SbCl 5 OH ] + HCl
H [ SbCl 5 OH ] + H 2 O     H [ SbCl 4 ( OH ) 2 ] + HCl
H [ SbCl 5 OH ] + H 2 O     H [ Sb ( OH ) 6 ] + HCl
The precipitated product was kept under the mother solution at room temperature for no less than 7 days, in order to completely fulfil the crystallization and aging processes. The obtained precipitate was first filtered, followed by washing with distilled water, and finally dried at 60–80 °C for 24 h. The dried hydrolyzed product was then treated with HCl solution (Lenreactiv, St. Petersburg, Russia, c.p.) and washed with distilled water; this was continuously repeated until the negative qualitative reaction of chlorine ions was achieved. Finally, the obtained crystalline polyantimonic acid was dried at 100 °C until a constant and unchanged weight was obtained. The crystalline PAA particles could not be compacted without a binder due to their low ductility (high elasticity). Commercially available fluoroplastic (grade F-23, Russia, produced accordingly to the technical standard TY 6-05-906-63) was used as a chemically inert non-conductive binder. Two compositions were prepared, with PAA/binder ratios of 90:10 and 80:20 wt.%, respectively. A weighted amount of fluoroplastic was dissolved in acetone (Len reactive, c.p) and mechanically mixed with the PAA powder. Cylindrical membranes with a diameter of 30 mm and thickness of 5 mm were compacted from the obtained mixture via cold uniaxial pressing at room temperature. The compaction parameters (pressure and exposure time) were carefully optimized. After varying the applied pressure in the range 5–15 t/cm2, while varying the exposure time in the interval 5–15 min, the optimal determined parameters were 10 t/cm2 and 10 min, respectively. The obtained two sets of membranes with 10 and 20 wt.% binder were labelled as 90PAA and 80PAA, respectively.

2.2. Structure Characterization of Samples

Morphology of the samples was analyzed by scanning electron microscopy (Hitachi 3400-N, with accelerating voltage of 20 kV). The chemical composition of the samples was determined by X-ray energy-dispersive spectroscopy (Oxford Instruments INCAx-act X-ray microanalysis spectrometer). Thermal characteristics and temperatures of phase transitions were simultaneously investigated via thermal analysis in the temperature range of 20–370 °C (Derivatograph, MOM-3 Q-1500 D, in argon atmosphere, and a heating rate of 10 deg./min). Two parallel experiments were performed for each composition. Structural sample analysis was performed by means of in situ XRD (to obtain data on the evolution of PAA phase compositions) in the temperature range 20–300 °C with steps of 10 °C (diffractometer, Rigaku «Ultima IV», equipped with a high-temperature camera, Rigaku «SHT-1500», using cobalt Kα irradiation), and by a Raman spectroscopy technique (Triple Raman Spectrometer Horiba SENTERRA T64000, with a laser radiation wavelength of 488 nm). Raman spectra were collected at 2–3 points, both from the volume and surface of at least two samples at each temperature treatment step. Mercury porosimetry was used to determine the porosity distribution of the samples (AutoPore IV, model 9500, Micrometrics, in the range of 0.5 to 31.000 absolute psi, with a stem volume of 0.392). Apparent density of the membranes was measured by a hydrostatic weighing technique (scales RADWAG 220 c/xc, Poland). Sample specimens were weighed in air and in isopropyl alcohol, at least five times each. Relative sample densities were calculated using the crystallographic density data of Sb2O5∙nH2O taken from the PDF database (card 01-084-0303).

2.3. Electrical Response Measurements

Complex impedance spectroscopy, CIS (Agilent 4294A), was used in the frequency range of 40 Hz to 60 MHz to evaluate the electrical response of the samples to temperature and moisture changes, using a closed chamber with a volume of approximately 6.5 L. For that purpose, a pair of gold electrodes was printed through a mask onto the surface extremities of each membrane, using gold ink from the Gwent Group (Gold Polymer Electrode Paste C2041206P2) and heated afterwards up to 80 °C, for 60 min. Complex impedance data integrity validation was ensured using the Agilent equipment, because it has inbuilt Kramer–Krönig transformations. For each sample type, two specimens of each composition were characterized, for which three acquisition runs were performed in each measure, and the data displayed were always the mean values of the three runs for both specimens and for each measure.
Electrical response evaluations to temperature were performed in dry air, with temperatures varying between 25 and 250 °C. For moisture electrical response evaluations, the measurements were performed at room temperature by varying the relative humidity (RH), from dry air, i.e., 0% RH, to fully humidified air, 100% RH. The different values of RH were obtained by mixing water-saturated air in the chosen ratio, obtained by bubbling synthetic air through water in a bubbler, with dry synthetic air. The volumetric flow rates of both saturated wet and dry air were controlled by independent mass flow controllers, and then joined together in a mixer before passing tangentially over the surface of the sensors placed inside the test chamber. The temperature inside the chamber was electronically controlled with an accuracy greater than 1 °C and maintained at 25 °C (ambient temperature). All the electrical measurements were performed with the samples subjected to a 5 L/h flow rate of a given mixture and maintained for at least 90 min.
Electrical impedance was evaluated by applying an alternated current, AC, sinusoidal-current-shaped signal, and by measuring the obtained response, which was in an AC sinusoidal voltage signal containing its excitation frequency and harmonics. In addition, its usage, in place of a direct current signal, DC, avoids undesirable polarization phenomena. Electrical impedance measurements are normally performed using a small amplitude excitation signal in order to assure that the sample response is pseudo-linear. In a linear or pseudo-linear system, the AC response to a sinusoidal current signal will present the same frequency but will be phase-shifted. Generally, when a time-defined excitation current, I ( t ) = I D C + I 0 exp ( i ω t ) , is applied to the medium, the corresponding measured voltage will have the form V ( t ) = V D C + V 0 exp ( i ω t i ø ) . Therefore, from Ohm’s law, the overall impedance of the medium will be given by Z = V ( t ) I ( t ) = V 0 exp ( i ω t ) I 0 exp ( i ω t i ) , where ω stands for the angular frequency, I D C represents the continuous component of the current signal, I 0 is the maximum amplitude of the oscillating component of the current signal, V D C is the continuous component of the voltage signal, and V 0 is the maximum amplitude of the oscillating component of the voltage signal. However, and as stated above, the main benefits of using electrical impedance spectroscopy for the characterization of sample responses, arise while avoiding the appearance of polarization phenomena in the medium. Therefore, in the present study, the used excitation signal had no continuous component, and its respective voltage was measured as well: the latter could be confirmed by close inspection of the presented Nyquist plots, and consequently, the electrical equivalent circuit did not need to contain any element representative of any kind of DC component/contribution.

3. Results

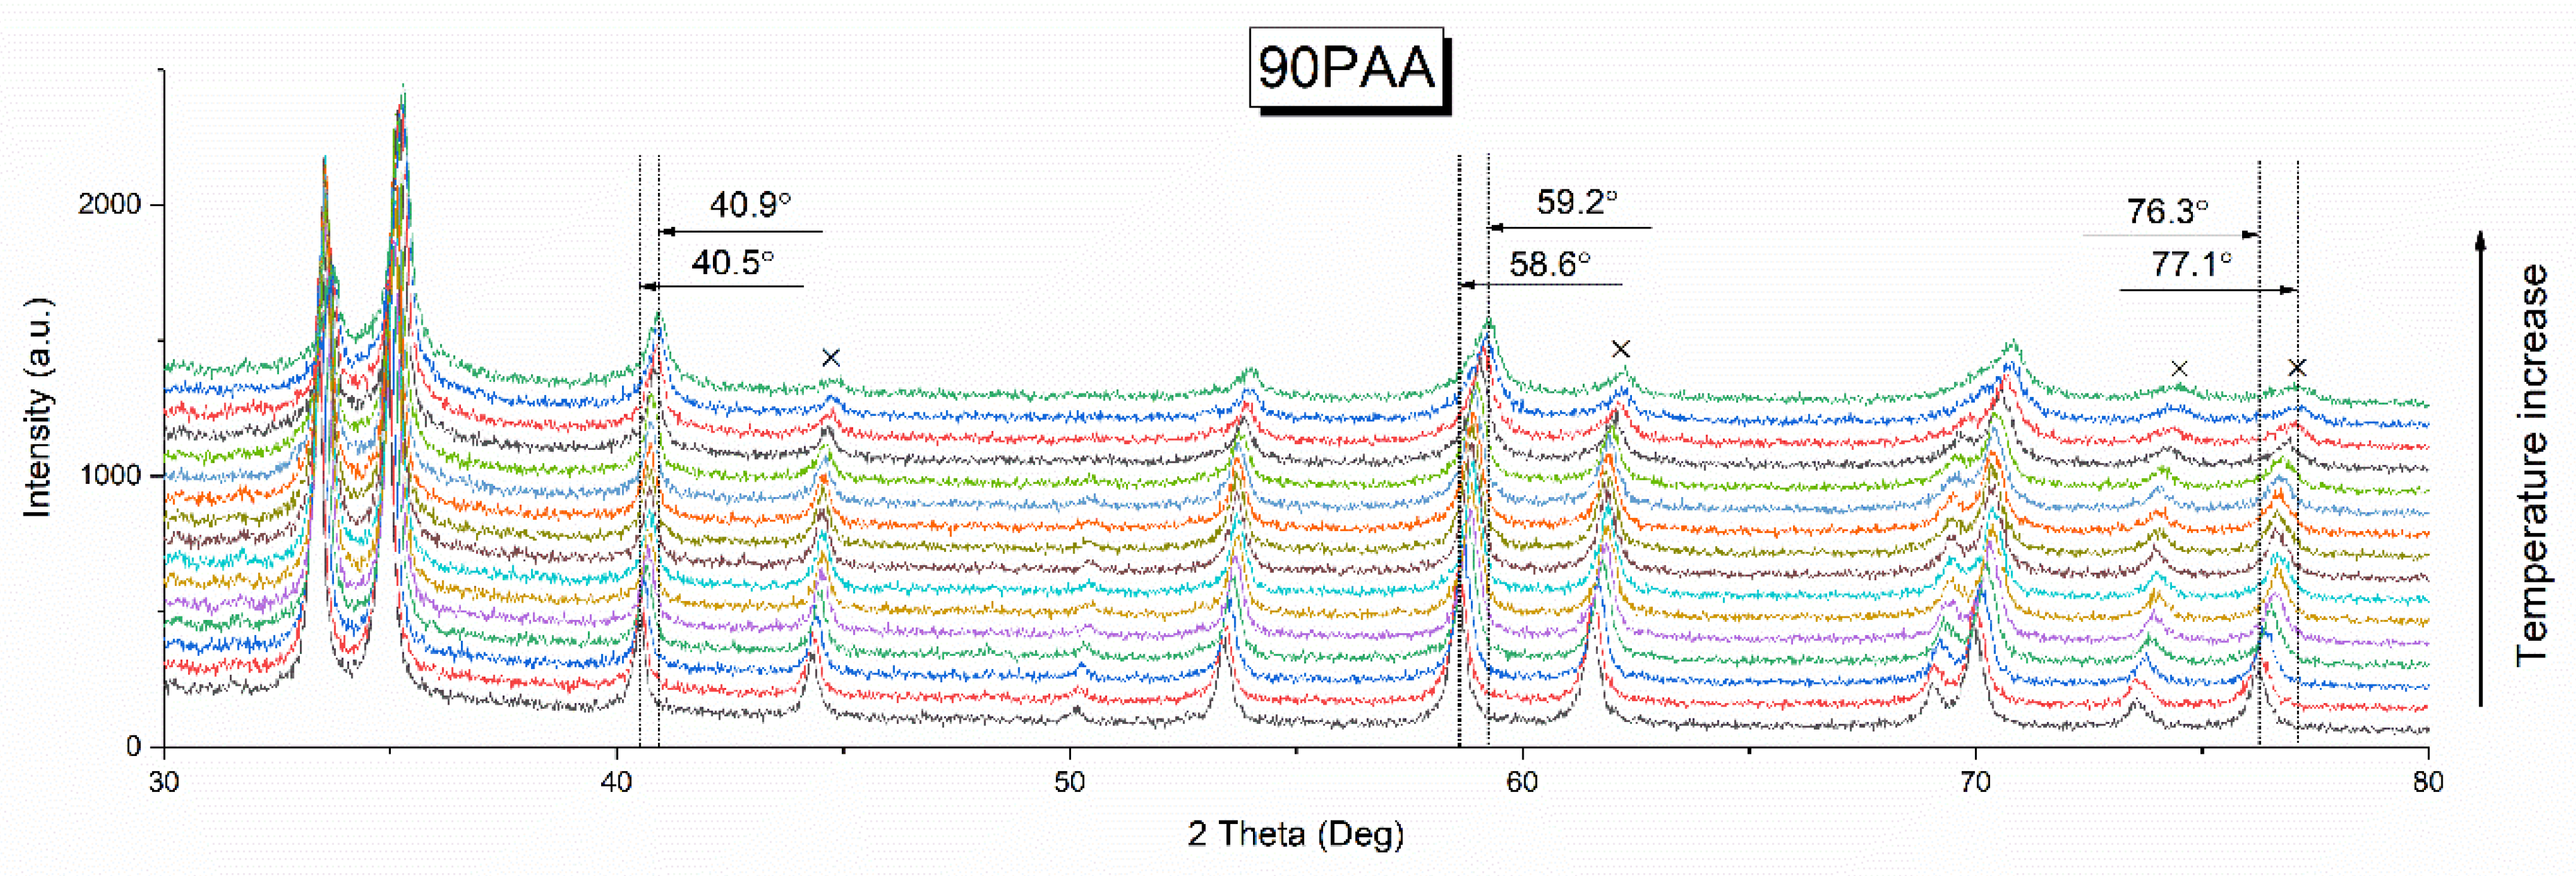
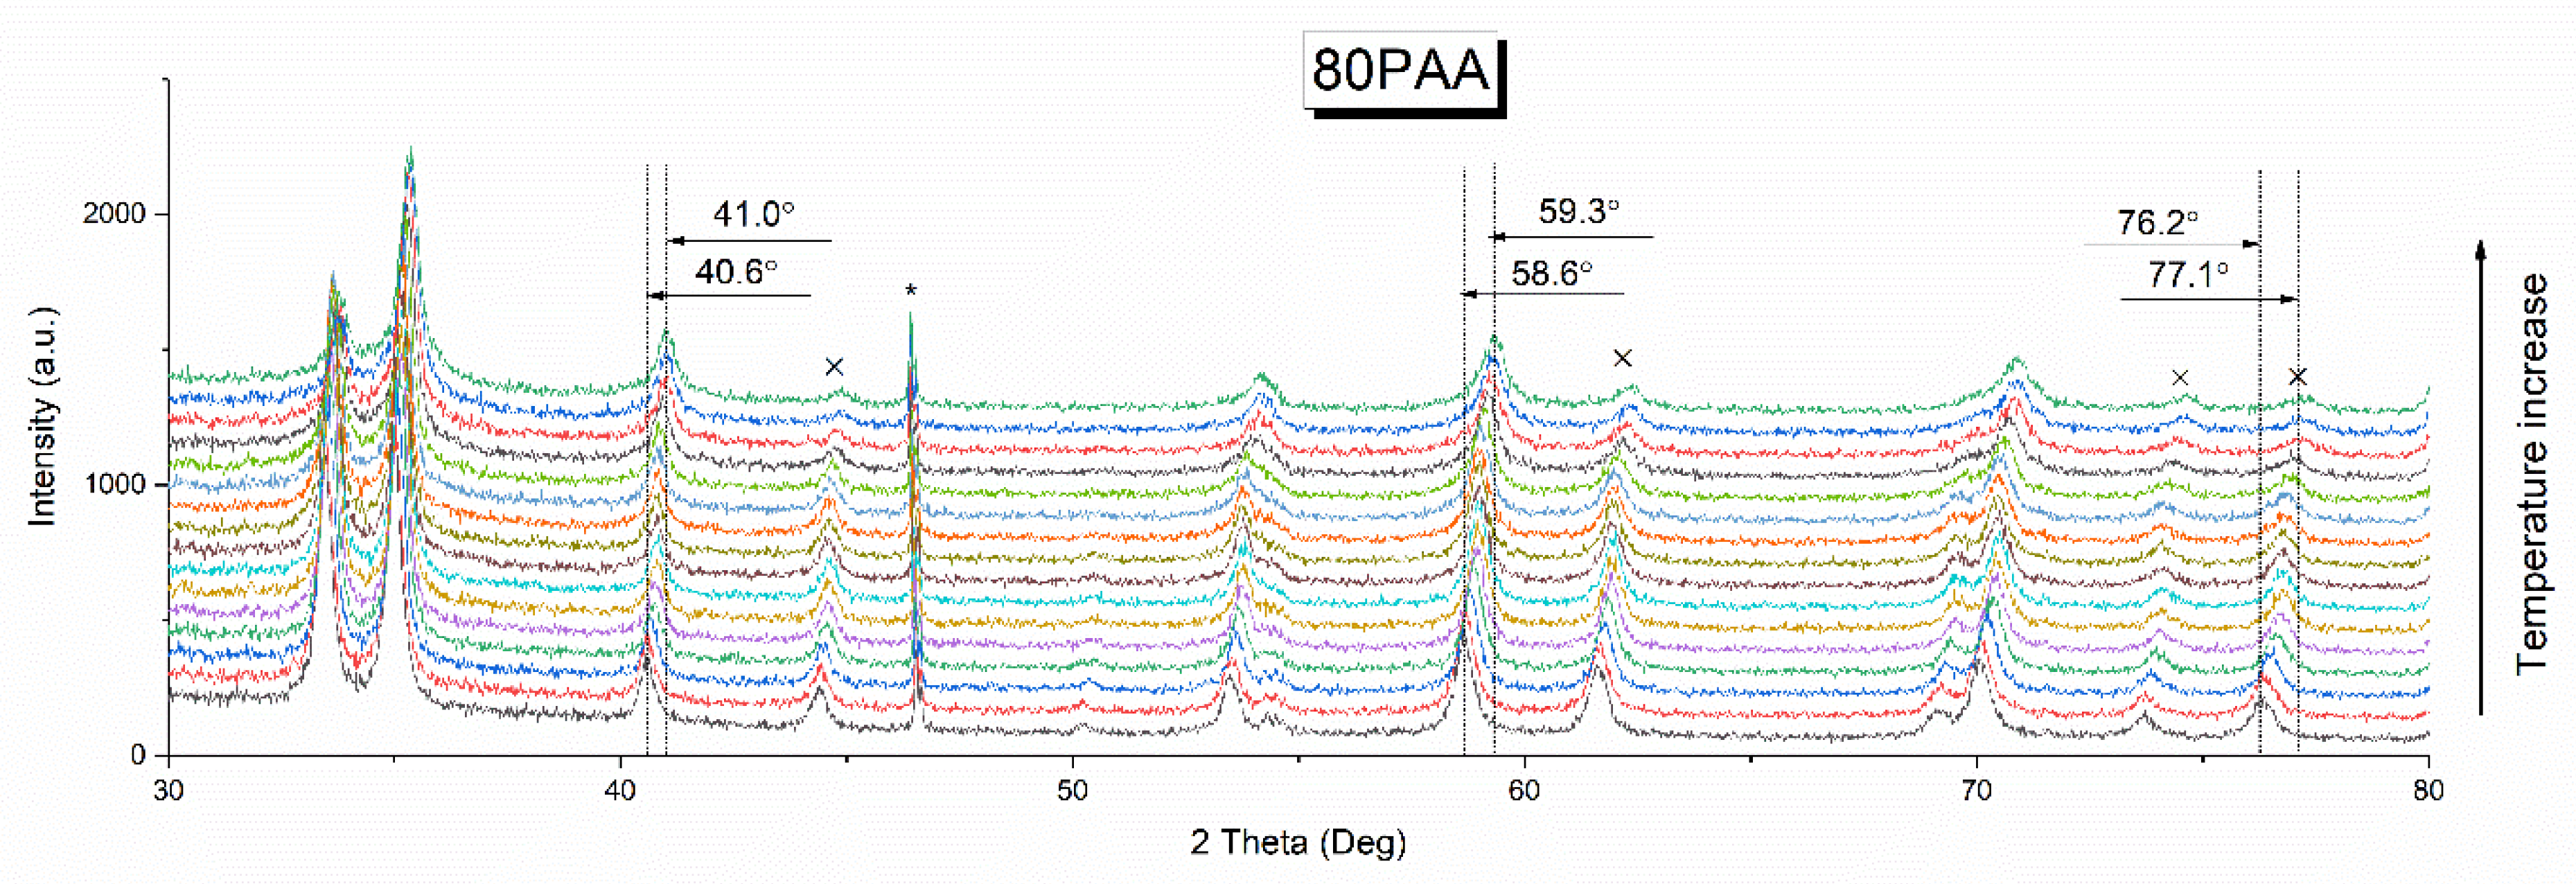
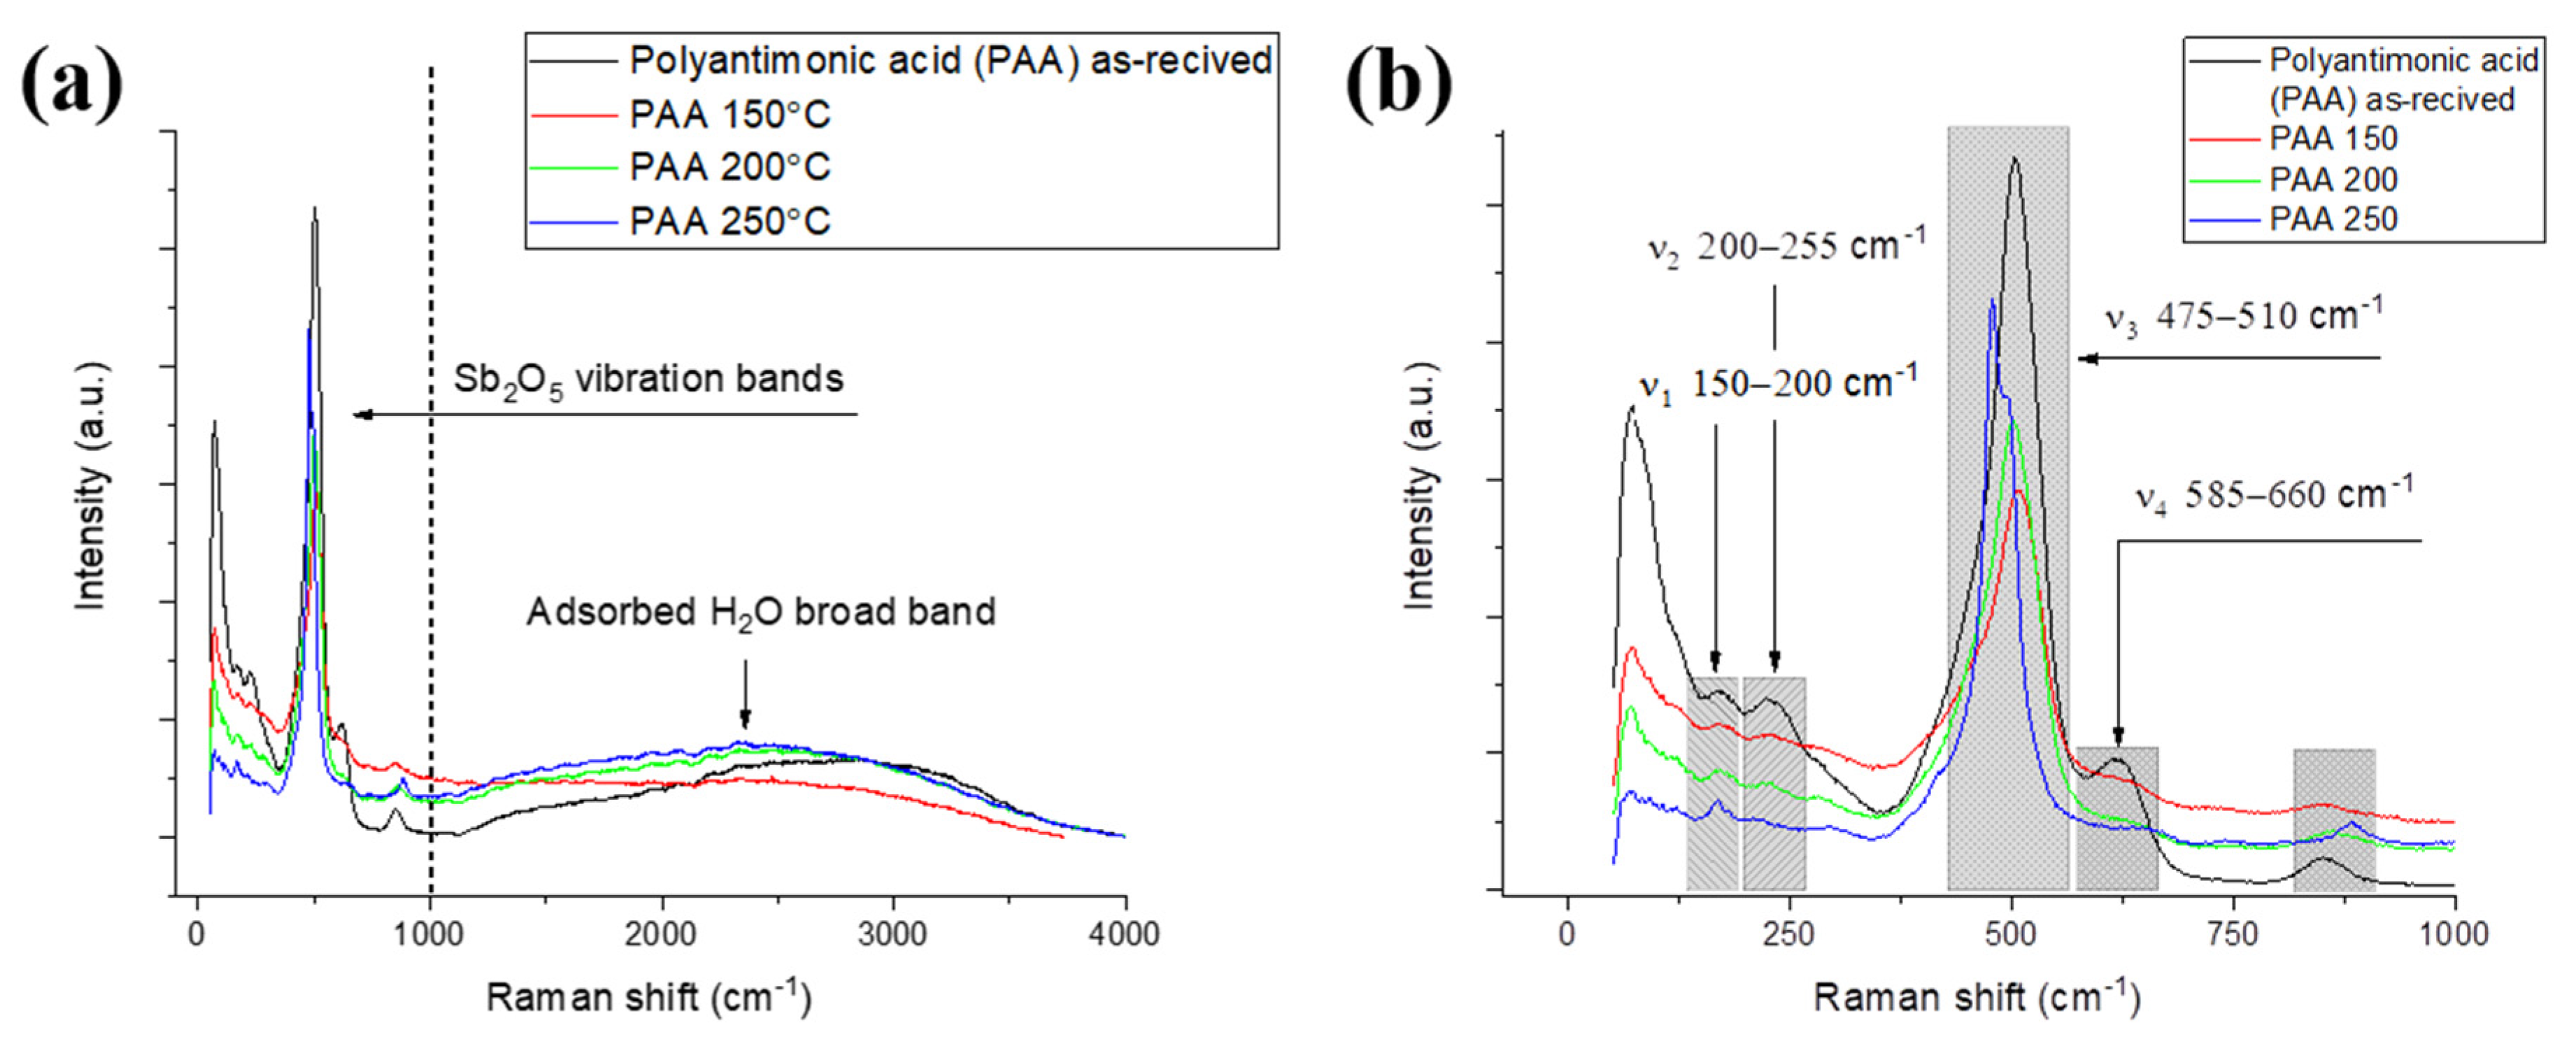
3.1. Effect of the Binder Concentration on the Thermal Evolution and Structure of Membranes

STA data obtained for PAA powder and powder with a binder in the range of 20–370 °C are shown in Figure 1.
Two endothermal effects at 57.1 and 126.3 °C, and one exothermal effect at 369.1 °C, are presented on the DTA curve of PAA powder without binder (100PAA) in Figure 1a. All of them are followed by mass losses according to the TG curves, as shown in Figure 1b. The endothermal effects can be attributed to adsorbed and structural water losses of polyantimonic acid, respectively. At temperatures higher than 350 °C, the reduction of Sb2O5 takes place and is accompanied by a profound exothermic effect on the DTA curve and by a considerable mass loss. Binder addition affects mostly the initial part of the curve (up to 100 °C). The first endothermal effect shifts from 57.1 to 100.5 °C. Additionally, on the DTA curves obtained for 90PAA and 80PAA samples, small but rather distinct endothermal effects are seen at ~190 and 232 °C. Their presence is likely due to the removal of fluoroplastic from the sample surface. An additional endothermic effect with the maximum at ~300 °C is present in the curve for the 80PAA sample. This may be attributed to fluoroplastic binder melting and the beginning of polymer degradation. At temperatures higher than 303 °C, the extended exothermic effect, related to binder burnout, is seen. The types and temperature effects are summarized in Table 1, together with mass losses according to TG data.
As can be seen from the comparison of STA and TG data, the mass losses of pure PAA in the region of 20–350 °C can be attributed to water losses. This assumption is in accordance with data in the literature on PAA thermolysis [39]. Based on mass losses of up to 350 °C, the composition of PAA after synthesis was calculated to be Sb2O5·2.92H2O. Roughly three water molecules are attributed per each Sb2O5 in the PAA structure. Based on experimental STA data and data from [39], the decomposition of hydrated antimony oxide takes place accordingly to a two-step schematic reaction sequence, described by Equations (4) and (5):
( 2.82 H 2 O ) Sb 2 O 5   0.1 H 2 O     ( 2.82 H 2 O ) Sb 2 O 5 + 0.1 H 2 O ,   T = 25 100 ° C
Sb 2 O 5   2.82 H 2 O     Sb 2 O 5 + 2.82 H 2 O ,   T = 100 250 ° C
Then, PAA powder and fluoroplastic binder were compacted into the bulk membranes. The relative densities of 90PAA and 80PAA membranes were calculated using mixture rule as 101.6% and 101.4%. Crystallographic density was taken for the calculation. The theoretical density was calculated using crystallographic density of Sb2O5∙3H2O from XRD data (PDF card 01-084-0303), whereas the fluoroplastic density data were obtained experimentally by a pycnometry technique. For both samples, the relative density slightly exceeded 100%. The differences observed may be due to changes in polymer density during compaction upon the membrane compaction. Literature data on fluoroplastic powder density varied significantly, from 1.6–2.2 g/cm3 [39,40,41]; the fluoroplastic could also contain some co-polymer, such as polystyrole or polyethylene, in the different ratios. Therefore, it can be stated that within the determined experimental relative density error, the chosen compaction conditions are suitable for obtaining fully dense membranes. Figure 2 shows typical SEM images of the surface and bulk of the 90PAA membrane obtained with the optimized parameters.
Overall, macroscopic defects such as large pores, cracks or voids are absent from the surface of the 90PAA membrane. As seen from Figure 2a, the membrane is composed of brighter and darker areas. According to EDX spectra (see Figure S1 in the Supplementary Material), brighter areas correspond to the PAA phase, whereas the darker areas correspond to fluoroplastic binder. Close packing of the spherical PAA particles, both on the surface and on the membrane bulk, can be observed in Figure 2b,d. The small cracks at the cross-section are the result of brittle fracture of the membrane during the sample preparation (Figure 2c). The binder filled up the voids between PAA particles, but its content was not sufficient to isolate individual particles or particle agglomerates, which allowed direct contact between them and enabled faster ion transport through the bulk membrane. Similar results were obtained for the 80PAA membrane.
In Figure 3, the logarithmic differential curves versus pore size distribution, for both 90PAA and 80PAA samples, are plotted. Regarding the overall pore volume, both binder content samples seemed to present quite similar pore volume, once the traces largely overlapped, only showing significant differences in the mesoporous region. Concerning pore size distribution, and consequent surface contact area, the 10% binder content sample exhibits a higher pore volume in the mesoporous region (pores which average size is lower than 0.1 µm), and consequently a slightly higher overall contact surface area. What is clear is that both samples have a quite significant number of pores in the mesoporous region, and this type of porosity is known to favor the appearance of diffusion mechanisms, which are typical ionic conductivity contributions to the overall electric conduction of the materials.
A set of in situ X-ray patterns obtained for 100PAA sample without the binder upon heating in the range of 30–330 °C is shown in Figure 4. All reflexes in the XRD pattern obtained at 30 °C correspond to a crystalline phase of hydrated polyantimonic acid, Sb2O5·nH2O, with n = 3–4. It had a pyrochlore-type structure with space group F d 3 ¯ m . No admixtures of other phases are observed. Heat treatment of the pure PAA sample induced a shift in the reflexes towards higher 2Θ angles. For all temperatures in the range 30 to 330 °C, no phase transformation took place. The intensity of several peaks in the XRD pattern, as were the cases of those found at 2Θ = 40.6, 45, 58.7, 63, 76.3°, decreased significantly up to 100 °C. In the range 100–250 °C, almost no changes in the position and intensity of the reflexes were observed.
For temperatures higher than 250 °C, further gradual decreases in the reflex intensity, and even in the background intensity, are seen (Figure 5). Reflex positions also shifted significantly towards higher 2Θ angles. The intensities ratio of main reflexes at 33 and 34.5° changed from ~1 to ~0.7.
Coupling the observed changes in XRD patterns before and after treatment (see Figure 4 and Figure 5) with STA data (Figure 1); one can conclude that up to 100 °C, water removal took place for some positions in the pyrochlore-type structure, which was responsible for the reflexes appearing in the XRD pattern. This process was accompanied by a slight unit cell shrinkage. Starting from 250 °C, further structural water removal from polyantimonic acid took place.
The in situ thermo-XRD patterns obtained for 90PAA and 80PAA powders in the range 30–330 °C are shown in Figure 6 and Figure 7. The introduction of a binder had no effect on phase compositions. The nature of reflex intensity changes found for the samples containing binder was almost identical to that observed for the 100PAA membrane (with no binder added). The shift in the reflex’s positions slightly decreased for the 90PAA membrane, from 0.8 to 0.4° for the reflex at 2Θ = 40.6°, i.e., the lattice parameter shrank slightly less for the 10 wt.% binder content sample. Further increases in binder content to 20 wt.% had no effect on the XRD patterns obtained.
Raman spectra of the PAA powder as received after synthesis and calcination at 150, 200 and 250 °C are presented in Figure 8.
All spectra obtained exhibit two distinct regions: signals at 0–1000 cm−1 are attributed to antimony oxide vibration bands, whereas signals at 1000–4000 cm−1 are ascribed to structural water bands (Figure 8a). The highest water band in the PAA spectrum after synthesis was located at around 3000 cm−1. Its position continuously shifted towards lower wave numbers with increased temperature, and reached 2400 cm−1 at 250 °C, being equal to the value calculated for the H3O+ ion [42].
The enlarged area at 0–1000 cm−1 for the PAA sample spectra, corresponding to antimony oxide, is presented in Figure 8b. The main features of the spectrum for PAA powder after synthesis are (i) the presence of a wide, intense band near 502 cm−1 and (ii) a very weak, broad shoulder at 620 cm−1, which is in accordance with previously reported data [43]. According to Nakamoto [44], any octahedral molecule XY6, such as [SbO6/2] octahedrons of PAA, has six normal vibration modes. Three of them are seen in the typical Raman spectra of antimony-based compounds, for example, in antimony (V) chloride [45]. However, the picture obtained for PAA differs significantly from the typical spectra for individual octahedron molecules, or crystalline Sb2O5 [46], Sb2O3 or Sb2O4 [43]. The observable wide peak at 502 cm−1 with a shoulder can be ascribed to the polymeric Sb–O network vibrations. Two additional broad weak bands, distinguishable at 150–200 cm−1 and 200–250 cm−1, are assigned to trace contents of the orthorhombic Sb2O3 (valentinite phase). The peaks at 0–400 cm−1, as well as the shoulder at 620 cm−1, almost disappear, indicating a gradual symmetry increase. The observed behavior is similar to that observed for other high-symmetry compounds, as is the case of BaZrO3 [47]. Additionally, the main band shifts at 478 cm−1 and the formation of an intense shoulder at 495 cm−1 are observed, all in accordance with the decrease in the lattice parameter with water loss, being found during the XRD analysis.

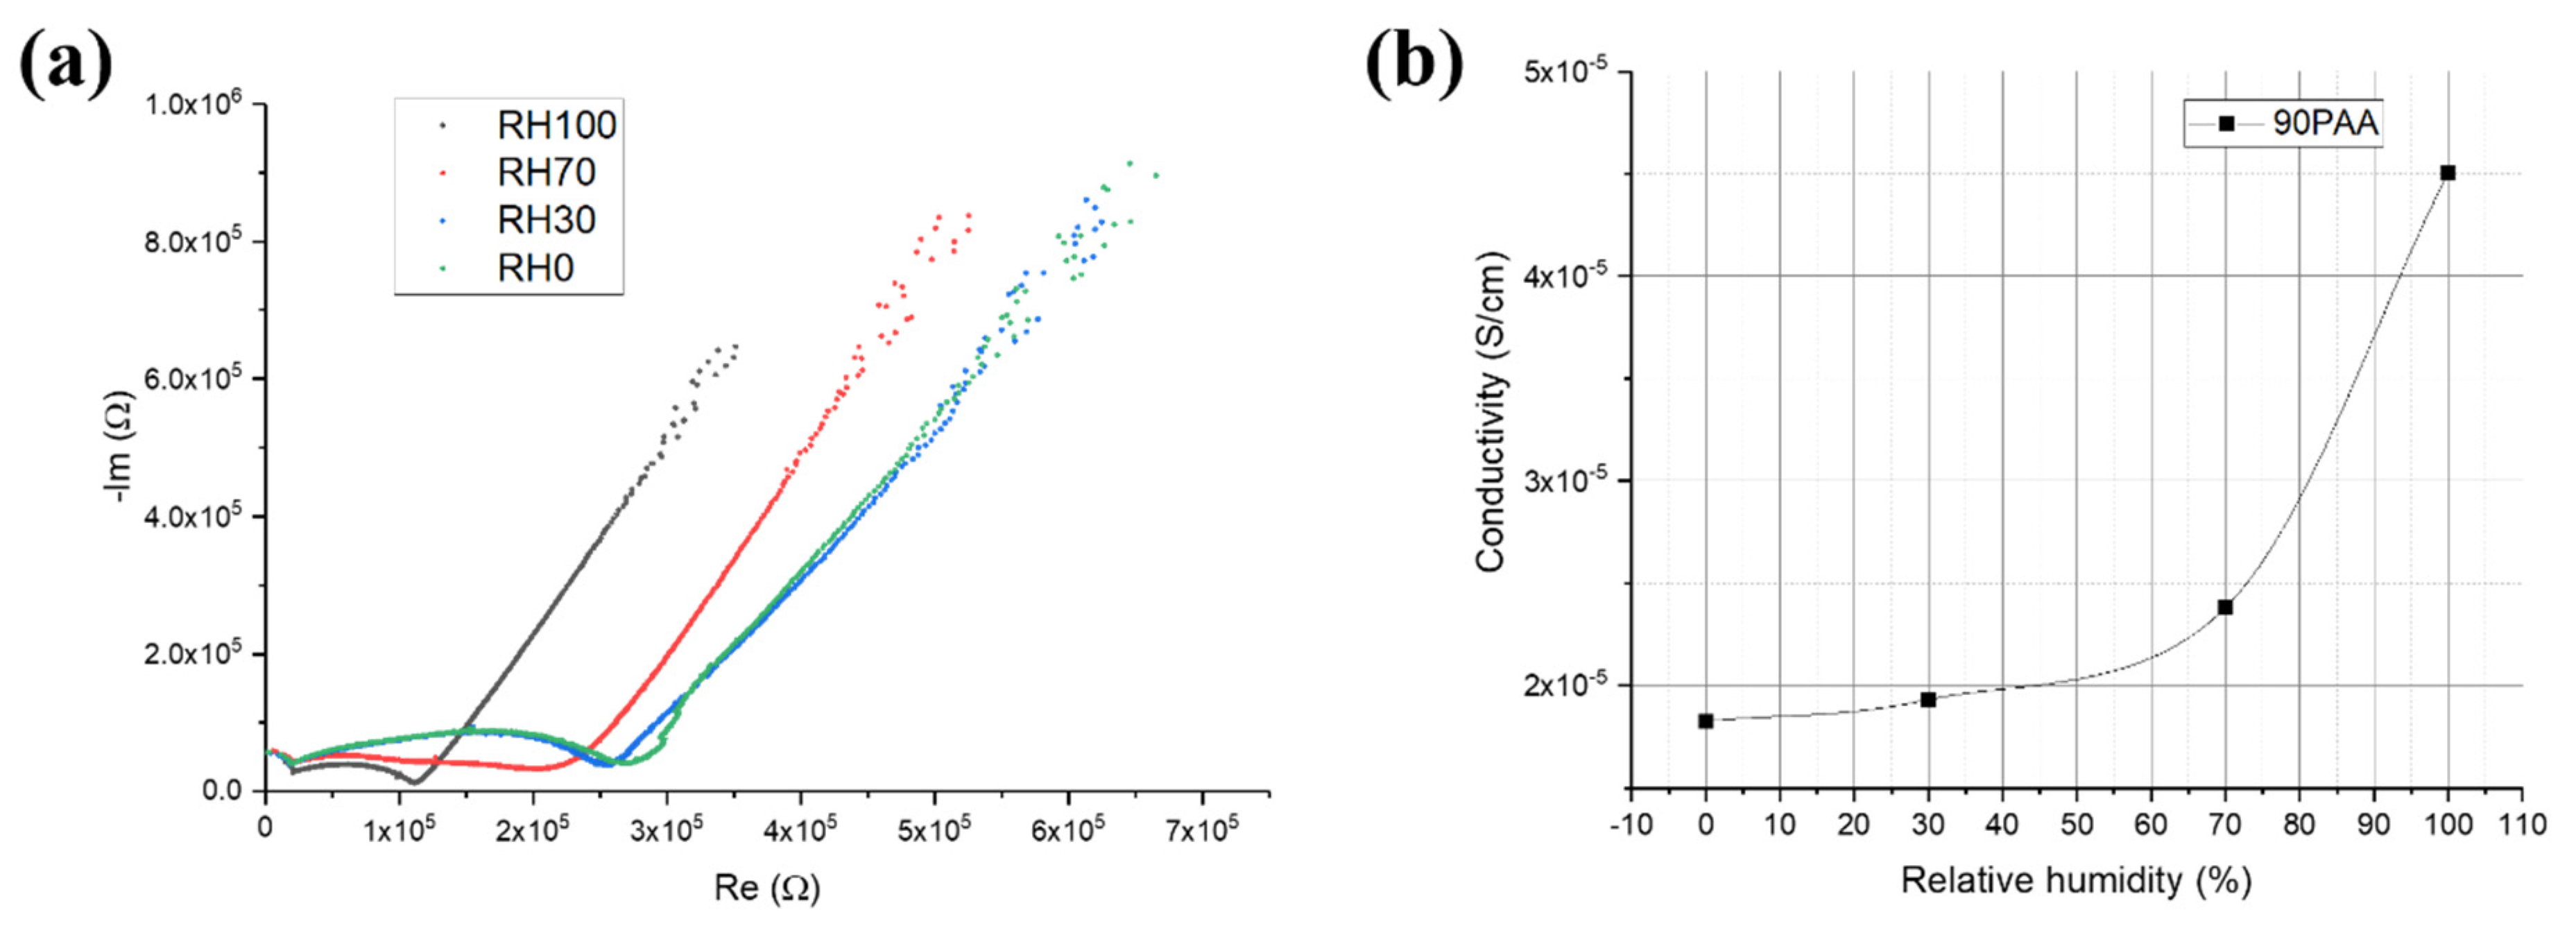
3.2. Moisture Influence on the Electrical Response

Moisture influence on the electrical conductivity of the membranes was evaluated and is displayed in Figure 9a, where Nyquist plots for different RH concentrations (varying from 0% to 100%) for the 90PAA sample are plotted. Impedance spectra obtained in the whole RH range exhibit two well-distinguished arcs, indicating grain and grain boundary conductivities according to the Bauerle circuit for polycrystalline materials [48]. The resistance of the grain component (at high frequencies) is less than 100 Ohm, indicating high bulk conductivity of the obtained membrane (~3 × 10⁻² S/cm). Moreover, it remained almost unchanged with the RH increase from 0% to 100%, whereas the resistance of grain boundaries for the 90PAA sample decreased significantly from ~3 × 10⁻⁵ to ~10−5 Ohm. Specific conductivities of the grain boundary component were calculated using the obtained data (Figure 9b). It can be seen that conductivity values varied significantly with RH concentration: indeed, they displayed an almost-exponential growth from 1.8 × 10⁻⁵ to 4.5 × 10⁻⁵ S/cm.

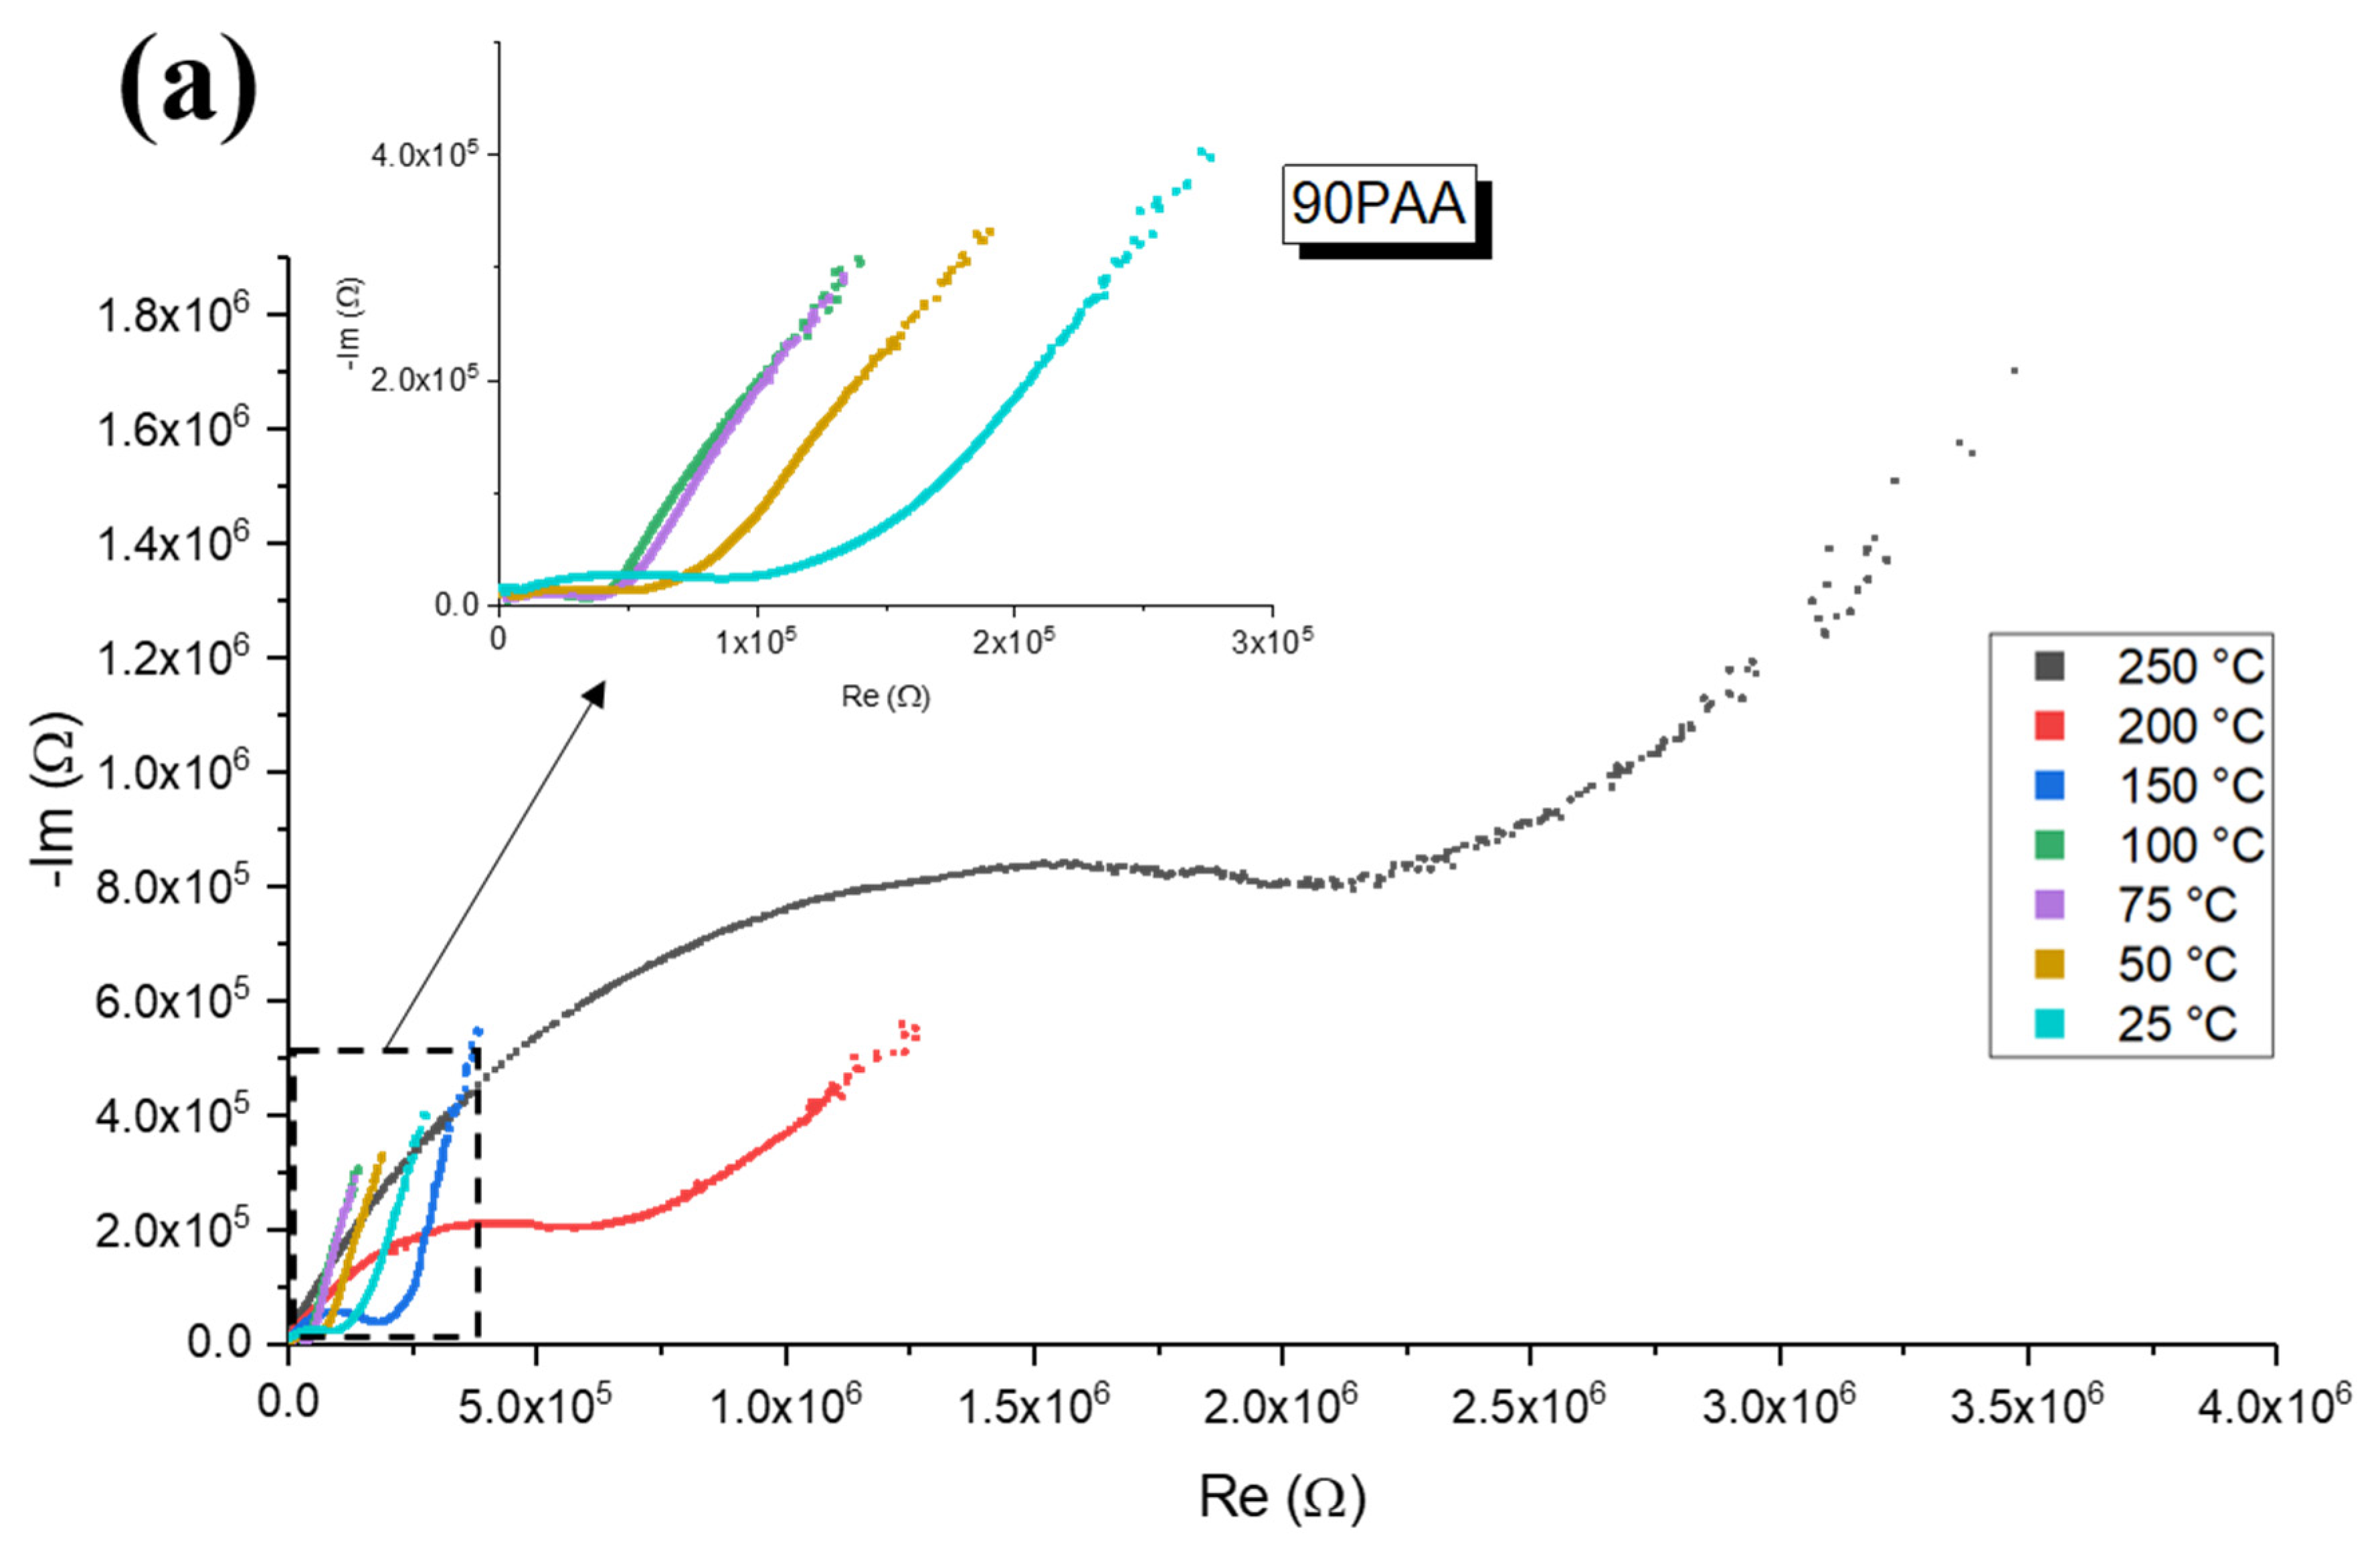
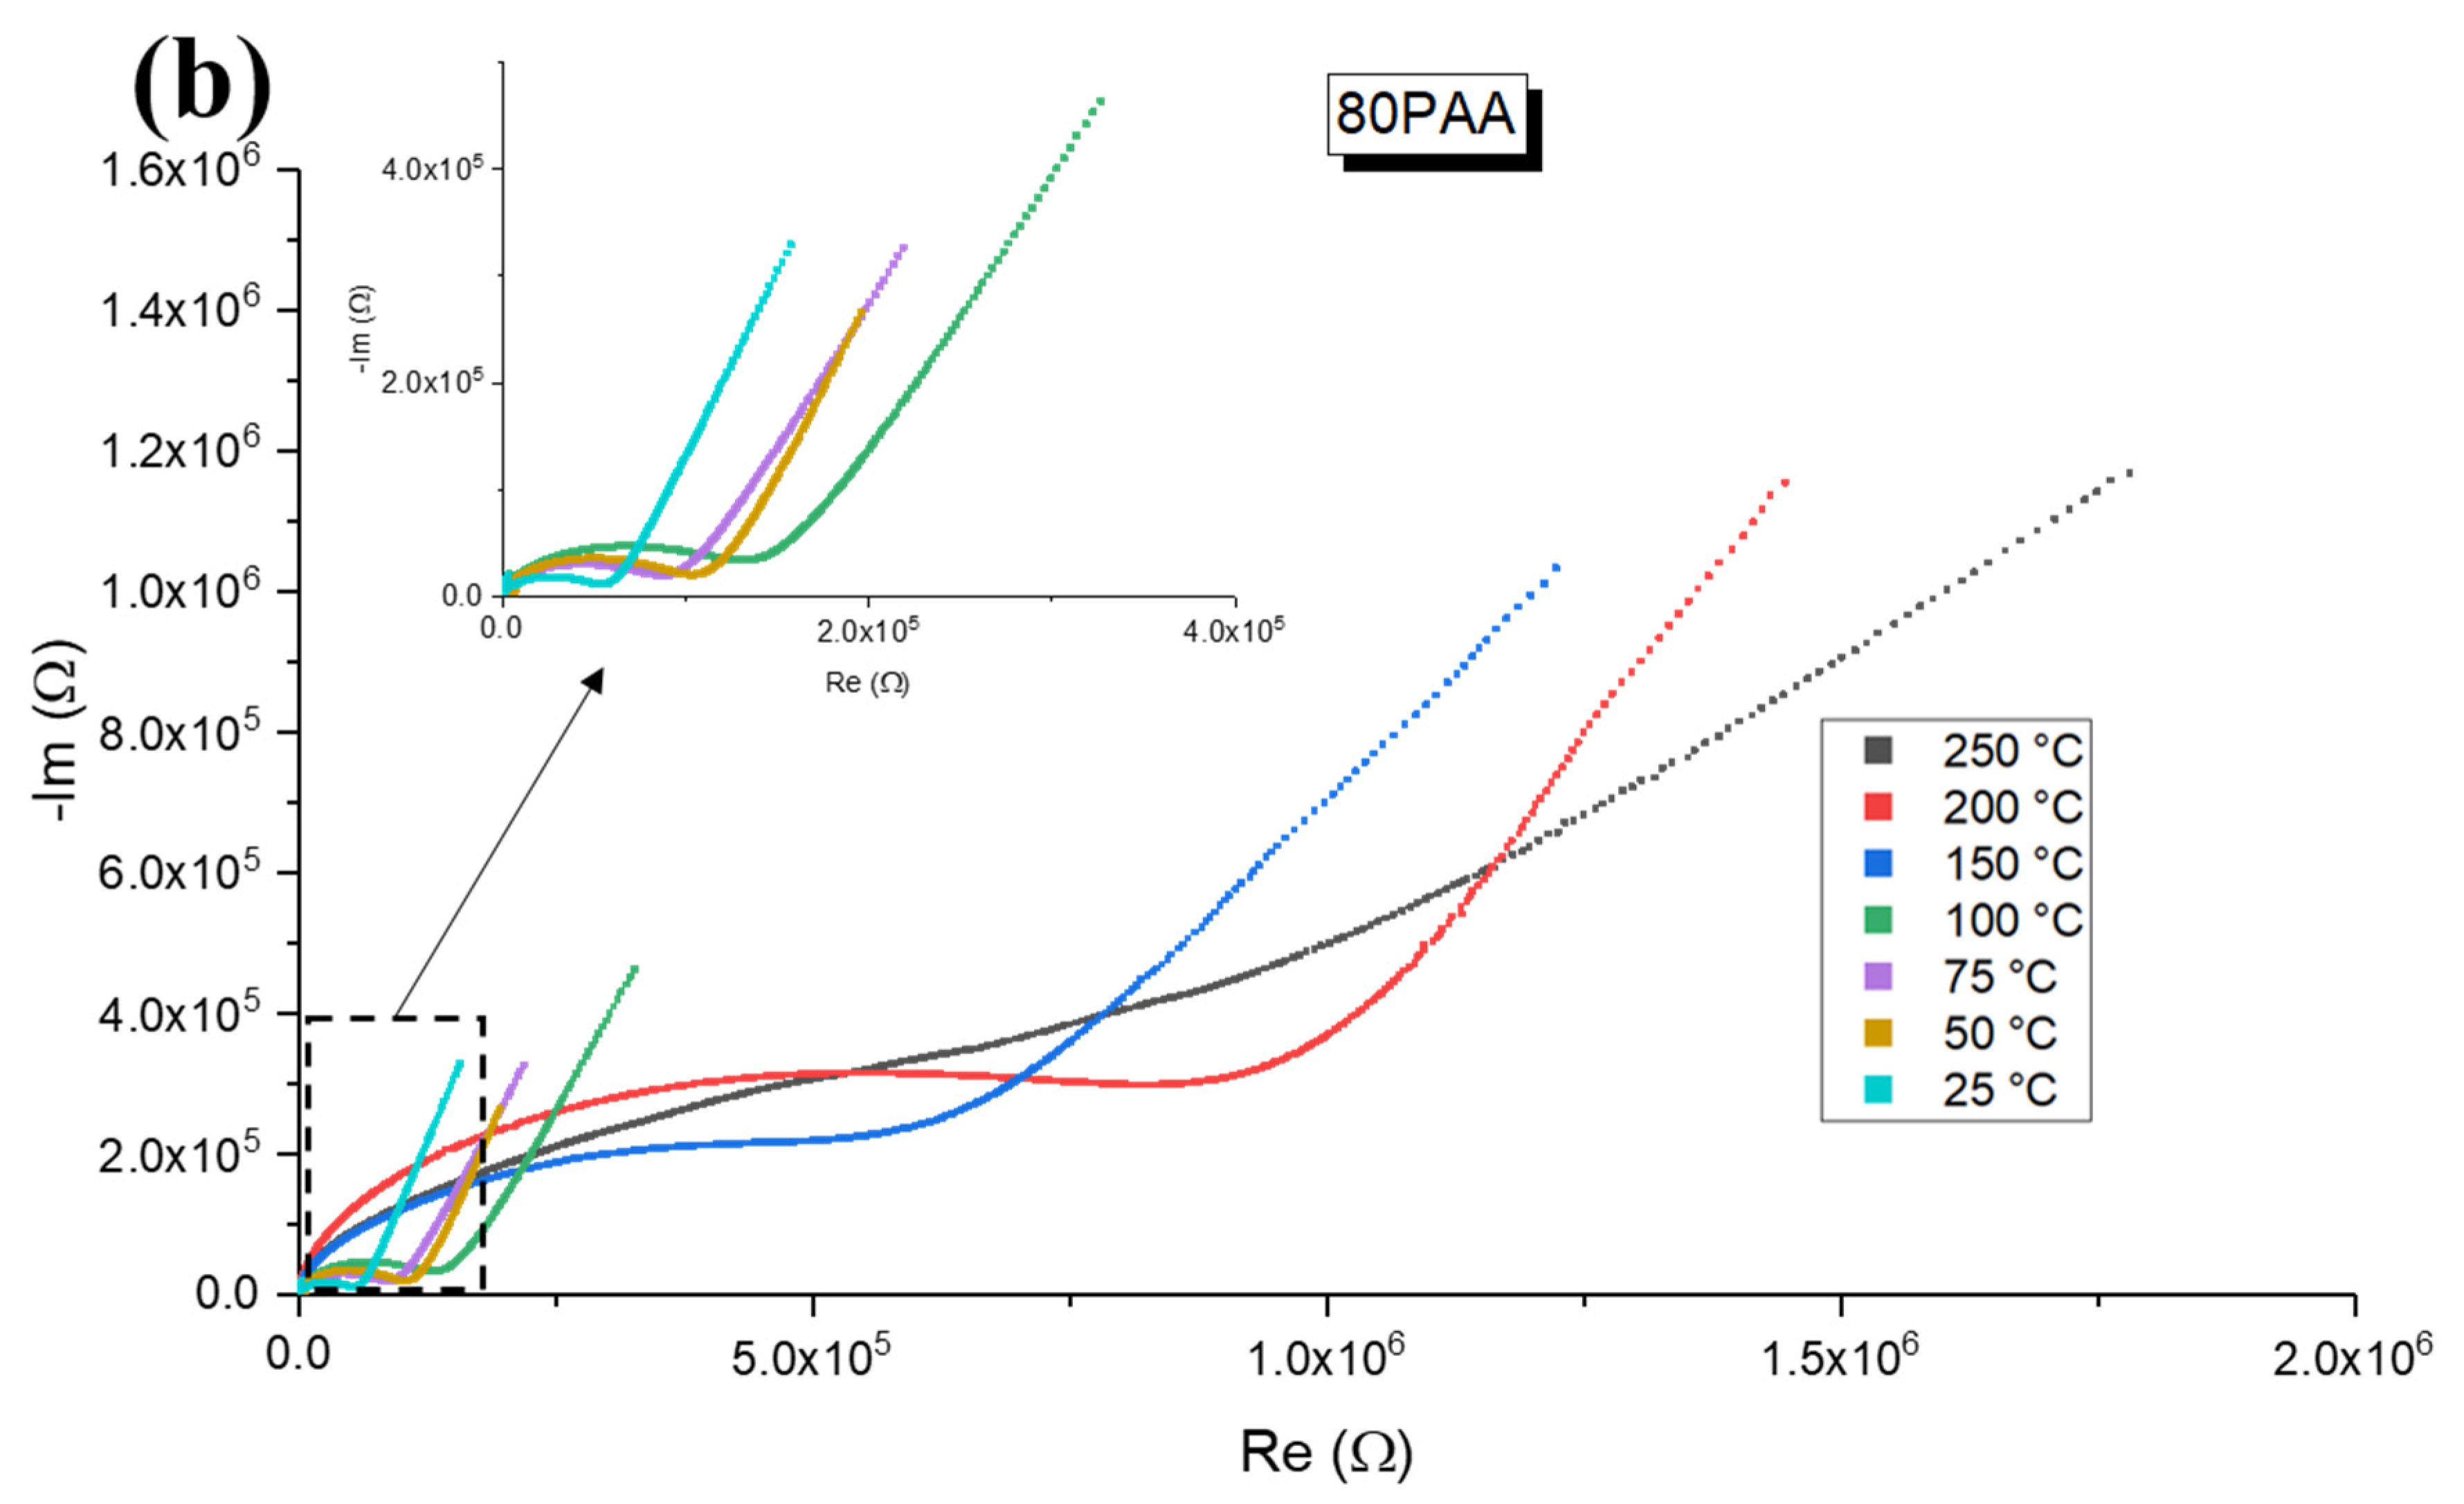
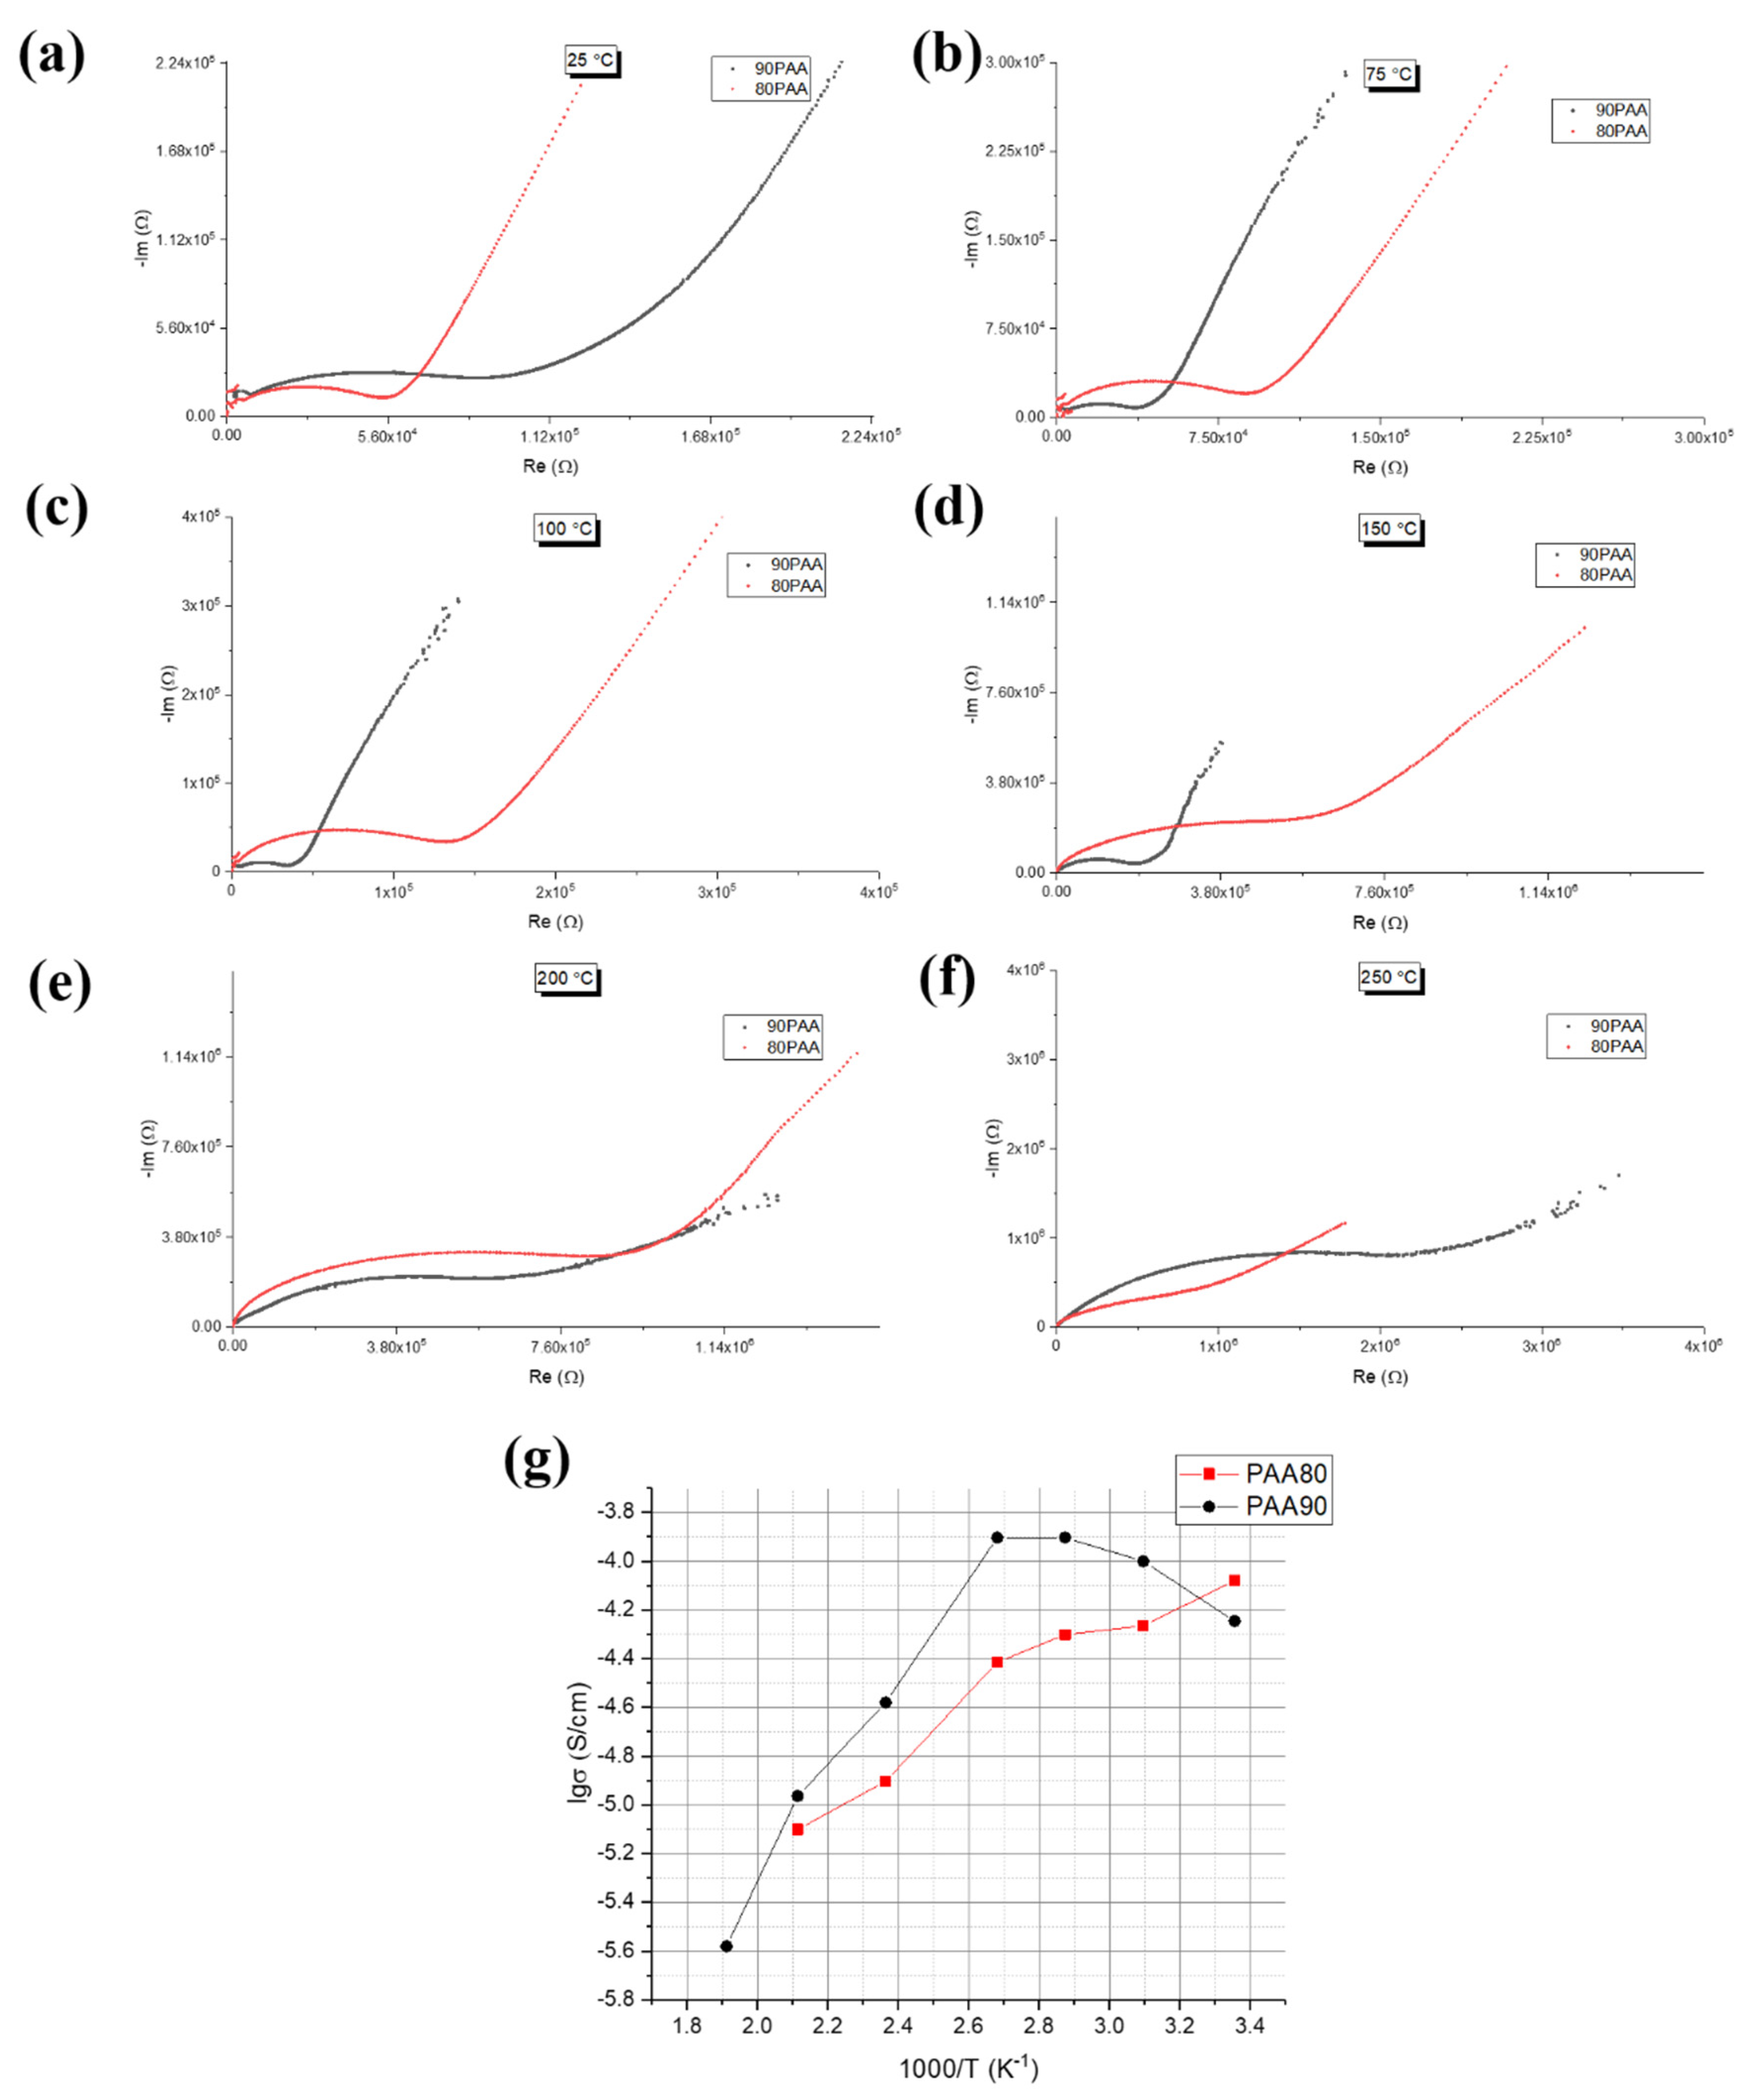
3.3. Influence of the Binder Concentration on the Electrical Response

In Figure 10, electrical responses of the 90PAA and 80PAA samples with temperature variation are plotted. For both images, to enable better evaluation of the electrical behavior of the samples for the lower tested temperatures, insets are included. By observing the images, it can be stated that both samples displayed significant ionic conductivity, confirmed by a Warburg-type contribution (the visible straight line for the lower frequencies of the plots: in the literature, other authors have also reported a similar behavior [27,33]). The impedance spectra of the 90PAA sample with 20 wt.% binder content also exhibit two well-distinguished arcs, attributed to the grain and grain boundary conductivities. However, as temperature rose from 25 up to 250 °C, two types of binder content samples did not exhibit the same behavior. Indeed, whereas the 80PAA sample with the higher binder content showed a continuous increase in the area under the spectra outlined over the entire temperature range, the 90PAA sample exhibited a mixed behavior; however, between 25 and 100 °C, the area under the Nyquist plot trace decreased, and above 100 °C, up to 250 °C, that same area increased. What is also common for both samples is that for temperature up to 100 °C, the area under the spectra plot exhibited smaller variations, when compared to those observed for temperatures above 100 °C.
The additional conclusion that can be reached by closed comparison between 80PAA and 90PAA is the increasing difference in the impedance area under the Nyquist plots as the temperature increased (Figure 11). Additionally, the dependence of the logarithm of the specific conductivities on the reversed temperature, obtained from impedance data, is shown in Figure 11g. At room temperature, the 80PAA sample exhibited slightly higher grain boundary conductivity than the 90PAA sample. For 90PAA, the increase in the temperature to 100 °C induced linear conductivity increases by about a one-half order of magnitude. Further temperature increases resulted in a sharp conductivity decrease from 1.2 × 10⁻⁴ to 2.5 × 10⁻⁶ S/cm. In contrast to 90PAA sample behavior, grain boundary conductivity values obtained for the 80PAA sample gradually decreased with a reversal temperature in the whole investigated temperature range.

4. Discussion

As follows from the STA, thermo-XRD and porosimetry results obtained for the 80PAA and 90PAA membranes, their structures are rather similar. The addition of the fluoroplastic binder mostly affected the size of the pores. Their mean size decreased from ~70 to 50 nm with the increase in binder content from 10 to 20 wt.%. According to the STA results, a 10 wt.% binder addition caused a shift in the maximum of the first endothermic effect from 57.1 to 100.5 °C, indicating the retention of 0.1 mol of non-specific adsorbed water in the PAA after synthesis, in agreement with the schematic reactions presented in Equations (4) and (5). Indeed, the presence of adsorbed water molecules contributed to the Raman signal (see Figure 8), where the individual water molecules had a number of overlapping O–H vibration bands at 3200–3600 cm−1, with the most intense at 3400 cm−1 [49]. At the same time, in the structure of Sb2O5·nH2O, water molecules could be found in cavities in the [SbO6/3] octahedron network. The vibration of ν(OH) with different lattice phonons originated from the interaction of the PAA protons with water molecules, located in the cavities, and the formation of H3O+ ions. The latter causes a shift in the band’s maximum, to lower wave numbers. This assumption is in agreement with data previously reported in the literature [42], where H2O5+ ions were shown to form in the structure of tetragonal PAA. This ion has more degrees of freedom; hence, its band maximum is present in the Raman spectra near typical values of 3400 cm−1. In accordance with the Raman analysis, the structure of polyantimonic acid differed from that observed for individual antimony oxides: in fact, Sb–O polymeric chains vibrations are dominant. In the highly symmetric pyrochlore structure of PAA, water molecules and protons are mainly present in the form of H3O+ ions, acting as ion carriers for proton transport in PAA membranes. Indeed, the water molecules accommodated in the anionic skeleton are responsible for high values of grain conductivity component (~5 × 10⁻² S/cm). Relative humidity increases result in grain boundary conductivity increases at room temperature due to increases in the ion carrier’s concentration.
The temperature increase induces non-linear changes in the grain boundary resistance, areas under the Nyquist plots and grain-boundary-specific conductivity values of the studied 90PAA and 80PAA samples. The grain conductivity remained almost unchanged with temperature. Temperature increases caused slight unit cell shrinkage and the length of Sb–O bonds decreased, accordingly with thermo-XRD and Raman spectroscopy data (see Figure 6, Figure 7 and Figure 8); thus, the PAA phase structure was almost unchanged. The differences in conductivity values of the 90PAA and 80PAA samples observed at 25 °C due to binder content increases are probably due to the lower mesoporosity and slightly more homogeneous microstructure of the 80PAA membrane after compaction. The step-by-step water removal is in accordance with the boundary conductivity changes displayed by the membranes with temperature.
The grain boundary conductivity of the 90PAA sample increased in the range 25–100 °C due to charge carrier mobility increases (oxonium ions, see Figure 10 and Figure 11). Above 100 °C, temperature increases resulted in an overall conductivity decrease, caused by stepwise water removal from the structure, following the reactions presented in Equations (4) and (5), and with the expectable decrease in the number of charge carriers at high temperature. In turn, for the 80PAA membrane, an almost-linear decrease in the specific conductivity in the entire investigated temperature range was observed. Higher amounts of binder (20 wt.%) seemed to block the ion carrier transport at temperatures lower than 100 °C. In turn, at higher temperatures, water molecules (oxonium ions) were retained in the PAA structure, thus eliminating sharp drops in grain conductivity.
It is known that impedance spectra illuminate the different electrical and polarization phenomena that occur in the materials. In general, for a given dataset, more than one equivalent circuit exists which gives a reasonable fitting. The choice between these circuits must be based both on simplicity and consistently with the known physical and chemical processes which take place in the system [48]. The proposed equivalent circuit model for evaluation/representation of the electrical response of the samples can be seen in Figure 12.
The initial values of the components in the proposed model were obtained using EIS spectra analyzer software, followed by manual fine tuning. In Figure 13, some of the fits performed using the proposed model are shown, whereas in Table 2, the fitted parameters for both samples in the temperature range between 25 and 200 °C are summarized. From the plotted fittings, the adequation of the studied and developed equivalent model can be confirmed: indeed, both the Nyquist and Bode fits showed an agreement with the obtained experimental data.
In detail, the proposed model is composed of: (1) a Warburg-type element, Warburgcofficient, allowing for representation of the strong ionic contribution present (the chosen Warburg element was a classic semi-infinite linear type). This contribution is mainly due to the transportation of charges along the binder surface and open pores. In addition, in the literature, other authors [27,33] have already reported the high ionic conductivity of polyantimonic-acid-based membranes, which concurs with the obtained experimental data, giving support to the addition of this contribution to the electrical equivalent circuit; (2) two constant phase elements, CPE1 and CPE2, with respective pairs of components are present, with charge diffusion contributions arising from the interface between electrodes and the material, and along sample surfaces due to water retention on the material surface and mesoporosity (for both referred diffusion mechanisms, the interfacial character of their impedance makes it partly capacitive as well resistive in nature): regarding the second diffusion contribution, in the literature are references not only to water retention occurring in the membrane structures, but also to the role this has on the ionic conductivity of the materials [16,50,51,52]. Following from the pore size distribution (Figure 3), diffusion contributions can also originate from significant mesoporosity, and diffusion can also occur along the pore surface and along the pores filled with water [53]; (3) one element is composed of a resistor in parallel with a capacitor, R//C (representing the bulky granular and grain boundaries contribution all together); (4) a geometric capacitance, CGEO, represents the geometric effect contributions of the electrode locations, which are placed on the extremities of the upper faces of the samples, and consequently, the measuring configuration exhibits a shape that has similarities to that of a capacitor with parallel plates, with the tested material in-between plates. In addition, the developed and presented equivalent circuit model also fits well with the observed effects of relative humidity on the electrical response of the samples.
From close inspection of the parameters shown in Table 2, we can conclude that: (1) For both samples, the dominant conduction mechanisms are ionic in nature, due to the presence of structural and adsorbed water. In addition, only a small contribution of electronic nature was found, with small impact on the overall impedance of the samples represented by a single R//C circuit, together accounting for grain and grain boundary contributions, which could not be uncoupled, together with a capacitor (CGEO), which represents the small geometric influence of the electrode placement; (2) One of the major differences between both types of samples is the Warburg contribution parameter, which changes by more than one order of magnitude, indicating the higher significance of diffusion parameters for the 80PAA sample.
In summary, the observed electrical conductivity changes in the 90PAA and 80PAA membranes are a consequence of the obtained and discussed structure: indeed, the proposed contributions and overall observed non-linear proton grain boundary conductivity temperature dependence of the samples are governed by changes in the ion carrier concentrations (H3O+) and their mobility during the adsorbed and structural water content changes in the PAA structure with temperature, following the reactions presented in Equations (4) and (5). The grain conductivity remained unchanged, being ~5 × 10⁻² S/cm for both binder contents. The results are supported not only by unit cell shrinkage and Sb–O bond length decreases according to XRD and Raman spectroscopy (i.e., holes and windows size decrease slightly in the anionic skeleton where ion carriers are accommodated), but also by literature previous reports [13,39,42], and previous studies by the authors [53,54,55]: together, this entirely underwrites the considered circuit model. Based on the presented membrane properties, the authors believe that they are undoubtedly strong candidates to be used in high-efficiency fuel cells in the near future. The authors’ next steps will be not only the incorporation of the present membranes in electrochemical devices and evaluation of their performance, but also to proceed with the fabrication of other PAA-based membranes and respective characterization, aiming to obtain materials which may present even better properties than those discussed here, and consequently, with better perspectives to be used in fuel cells, with even higher performance.

5. Conclusions

Via STA and XRD data, it was shown that PAA after synthesis exhibits a pyrochlore structure corresponding with Sb2O5·3H2O. Using Raman spectroscopy, it was demonstrated that in the structure of PAA, the Sb–O polymeric chain vibrations are dominant, and ion carriers are mainly present in the form of H3O+ ions. Using impedance spectroscopy, it was apparent that the membranes possess high grain conductivity, ~5 × 10⁻² S/cm, and that the grain boundary conductivity exponentially increases with relative humidity increases at room temperature. Through STA, thermo-XRD, Raman and impedance spectroscopy techniques. it was confirmed that the conductivity of the 90PAA and 80PAA membranes changed non-linearly with temperature in the range of 25–250 °C, due to the stepwise adsorption and structural water removal from the membranes, accompanied by unit cell shrinkage. The proposed equivalent circuit model fitted well with the experimental data, and included: (a) a Warburg-type contribution, due to mesoporosity charge diffusion and superficial binder conduction: (b) two constant phase elements, responsible for charge diffusion contributions arising from the interface between electrodes and the material, and along the sample grain surfaces; (c) a resistor in parallel with a capacitor and a geometric capacitance, representing grain, grain boundary, and geometric effect contributions due to the electrode’s placement. All mentioned contributions, except for the Warburg-type one, were all of an electronic nature but non-dominant.

Supplementary Materials

The following are available online at https://www.mdpi.com/article/10.3390/app112411877/s1, Figure S1: EDX spectra of 90PAA sample (a) bright area corresponding to antimony oxide; (b) dark area corresponding to fluoroplastic.

Author Contributions

Conceptualization, all authors contributed in equal parts; methodology, all authors contributed in equal parts; investigation, all authors contributed in equal parts; data curation, all authors contributed in equal parts; writing—original draft preparation, all authors contributed in equal parts; writing—review and editing, all authors contributed in equal parts; visualization, all authors contributed in equal parts. All authors have read and agreed to the published version of the manuscript.

Funding

This research received no external funding.

Institutional Review Board Statement

Not applicable.

Acknowledgments

This work was supported by the President’s grant for young scientists (research project 075-15-2021-370) and sponsored by national funds through FCT—Fundação para a Ciência e a Tecnologia, under the project UIDB/00285/2020. SEM and EDX data were obtained at the «GEOMODEL» center, in situ thermo-XRD analyses were performed at the Center for X-ray Diffraction Studies, and Raman spectroscopy data were obtained in the «Center for Optical and Laser Research» of SPBU Research park.

Conflicts of Interest

The authors declare no conflict of interest.

References

  1. Colomban, P. Proton conductors and their applications: A tentative historical overview of the early researches. Solid State Ion. 2019, 334, 125–144. [Google Scholar] [CrossRef]
  2. Abdelkareem, M.A.; Elsaid, K.; Wilberforce, T.; Kamil, M.; Sayed, E.T.; Olabi, A. Environmental aspects of fuel cells: A review. Sci. Total Environ. 2021, 752, 141803. [Google Scholar] [CrossRef] [PubMed]
  3. Mahato, N.; Banerjee, A.; Gupta, A.; Omar, S.; Balani, K. Progress in material selection for solid oxide fuel cell technology: A review. Prog. Mater. Sci. 2015, 72, 141–337. [Google Scholar] [CrossRef]
  4. Peighambardoust, S.J.; Rowshanzamir, S.; Amjadi, M. Review of the proton exchange membranes for fuel cell applications. Int. J. Hydrogen Energy 2010, 35, 9349–9384. [Google Scholar] [CrossRef]
  5. Norby, T. Proton Conduction in Solids: Bulk and Interfaces. MRS Bull. 2009, 34, 923–928. [Google Scholar] [CrossRef]
  6. Norby, T. Solid-state protonic conductors: Principles, properties, progress and prospects. Solid State Ion. 1999, 125, 1–11. [Google Scholar] [CrossRef]
  7. Yurko, Y.; Elbaz, L. The effect of membrane electrode assembly methods on the performance in fuel cells. Electrochim. Acta 2021, 389, 138676. [Google Scholar] [CrossRef]
  8. Chan, S.H.; Xia, Z.T. Polarization effects in electrolyte/electrode-supported solid oxide fuel cells. J. Appl. Electrochem. 2002, 32, 339–347. [Google Scholar] [CrossRef]
  9. Kreuer, K. On the development of proton conducting materials for technological applications. Solid State Ion. 1997, 97, 1–15. [Google Scholar] [CrossRef]
  10. Kreuer, K.D. On the development of proton conducting polymer membranes for hydrogen and methanol fuel cells. J. Memb. Sci. 2001, 185, 29–39. [Google Scholar] [CrossRef]
  11. Sun, X.; Simonsen, S.; Norby, T.; Chatzitakis, A. Composite Membranes for High Temperature PEM Fuel Cells and Electrolysers: A Critical Review. Membranes 2019, 9, 83. [Google Scholar] [CrossRef] [PubMed] [Green Version]
  12. Leysen, R.; Doyen, W.; Proost, R.; Vermeiren, P.; Adriansens, W.; Deknock, R. The use of Heterogeneous Membranes in Electrochemical Systems. In Synthetic Polymeric Membranes; Sedláček, B., Kahovec, J., Eds.; De Gruyter: Berlin, Germany, 1987; pp. 89–100. [Google Scholar]
  13. Leysen, R.; Doyen, W.; Vandenborre, H. On the Structure of Polyantimonic Acid-Polysulfone Membranes; Studiecentrum voor Kernenergie: Brussels, Belgium, 1985. [Google Scholar]
  14. Hickner, M.A.; Ghassemi, H.; Kim, Y.S.; Einsla, B.R.; McGrath, J.E. Alternative Polymer Systems for Proton Exchange Membranes (PEMs). Chem. Rev. 2004, 104, 4587–4612. [Google Scholar] [CrossRef] [PubMed]
  15. Weigelt, F.; Escorihuela, S.; Descalzo, A.; Tena, A.; Escolástico, S.; Shishatskiy, S.; Serra, J.M.; Brinkmann, T. Novel Polymeric Thin-Film Composite Membranes for High-Temperature Gas Separations. Membranes 2019, 9, 51. [Google Scholar] [CrossRef] [Green Version]
  16. Yu, J.; Pan, M.; Yuan, R. Nafion/Silicon oxide composite membrane for high temperature proton exchange membrane fuel cell. J. Wuhan Univ. Technol. Sci. Ed. 2007, 22, 478–481. [Google Scholar] [CrossRef]
  17. Tang, H.; Peikang, S.; Jiang, S.P.; Wang, F.; Pan, M. A degradation study of Nafion proton exchange membrane of PEM fuel cells. J. Power Sources 2007, 170, 85–92. [Google Scholar] [CrossRef]
  18. Mérida, W.; Harrington, D.A.; Le Canut, J.M.; McLean, G. Characterisation of proton exchange membrane fuel cell (PEMFC) failures via electrochemical impedance spectroscopy. J. Power Sources 2006, 161, 264–274. [Google Scholar] [CrossRef]
  19. Malavasi, L.; Fisher, C.A.J.; Islam, M.S. Oxide-ion and proton conducting electrolyte materials for clean energy applications: Structural and mechanistic features. Chem. Soc. Rev. 2010, 39, 4370–4387. [Google Scholar] [CrossRef]
  20. Slodczyk, A.; Colomban, P.; André, G.; Zaafrani, O.; Grasset, F.; Lacroix, O.; Sala, B. Structural modifications induced by free protons in proton conducting perovskite zirconate membrane. Solid State Ion. 2012, 225, 214–218. [Google Scholar] [CrossRef]
  21. Slodczyk, A.; Sharp, M.D.; Upasen, S.; Colomban, P.; Kilner, J.A. Combined bulk and surface analysis of the BaCe0.5Zr0.3Y0.16Zn0.04O3−δ (BCZYZ) ceramic proton-conducting electrolyte. Solid State Ion. 2014, 262, 870–874. [Google Scholar] [CrossRef]
  22. Baranov, A.; Grebenev, V.; Khodan, A.; Dolbinina, V.; Efremova, E. Optimization of superprotonic acid salts for fuel cell applications. Solid State Ion. 2005, 176, 2871–2874. [Google Scholar] [CrossRef]
  23. Ponomareva, V.G.; Lavrova, G.V. Effect of the excess protons on the electrotansport, structural and thermodynamic properties of CsH2PO4. Solid State Ion. 2017, 304, 90–95. [Google Scholar] [CrossRef]
  24. England, W.; Cross, M.; Hamnett, A.; Wiseman, P.; Goodenough, J. Fast proton conduction in inorganic ion-exchange compounds. Solid State Ion. 1980, 1, 231–249. [Google Scholar] [CrossRef]
  25. Zanchet, L.; da Trindade, L.G.; Trombetta, F.; Martins, A.D.; Martini, E.M.A.; Becker, M.R.; de Souza, M.O. Improving Nafion/zeolite nanocomposite with a SF-SO3 based ionic liquid for PEMFC application. Ionics 2021, 27, 2027–2036. [Google Scholar] [CrossRef]
  26. Shanmugam, S.; Ketpang, K.; Aziz, M.A.; Oh, K.; Lee, K.; Son, B.; Chanunpanich, N. Composite polymer electrolyte membrane decorated with porous titanium oxide nanotubes for fuel cell operating under low relative humidity. Electrochim. Acta 2021, 384, 138407. [Google Scholar] [CrossRef]
  27. Yaroshenko, F.A.; Burmistrov, V.A. Dielectric losses and proton conductivity of polyantimonic acid membranes. Russ. J. Electrochem. 2016, 52, 690–693. [Google Scholar] [CrossRef]
  28. Yaroslavtsev, A.B.; Dobrovolsky, Y.A.; Shaglaeva, N.S.; Frolova, L.A.; Gerasimova, E.V.; Sanginov, E.A. Nanostructured materials for low-temperature fuel cells. Russ. Chem. Rev. 2012, 81, 191–220. [Google Scholar] [CrossRef]
  29. Kovalenko, L.Y.; Burmistrov, V.A.; Lupitskaya, Y.A.; Yaroshenko, F.A.; Filonenko, E.M.; Bulaeva, E.A. Ion exchange of H+/Na+ in polyantimonic acid, doped with vanadium ions. Pure Appl. Chem. 2019, 92, 505–514. [Google Scholar] [CrossRef] [Green Version]
  30. Baetsle, L.H.; Huys, D. Structure and ion-exchange characteristics of polyantimonic acid. J. Inorg. Nucl. Chem. 1968, 30, 639–649. [Google Scholar] [CrossRef]
  31. Belinskaya, F.A.; Militsina, E.A.; Karmanova, L.A.; Grigorova, N.S. Antiradiation drugs on the basis of inorganic cationites. Vestn. St.-Peterbg. Univ. Seriya 4 Fiz. Khimiya 1992, 25, 36–41. [Google Scholar]
  32. Belinskaya, F.A.; Militsina, E.A. Inorganic Ion-exchange Materials Based on Insoluble Antimony(V) Compounds. Russ. Chem. Rev. 1980, 49, 933–952. [Google Scholar] [CrossRef]
  33. Yaroshenko, F.A.; Burmistrov, V.A. Proton conductivity of polyantimonic acid studied by impedance spectroscopy in the temperature range 370–480 K. Inorg. Mater. 2015, 51, 783–787. [Google Scholar] [CrossRef]
  34. Leysen, R.; Vandenborre, H. Synthesis and characterization of polyantimonic acid membranes. Mater. Res. Bull. 1980, 15, 437–450. [Google Scholar] [CrossRef]
  35. Yaroshenko, F.A.; Burmistrov, V.A. Dielectric relaxation and protonic conductivity of polyantimonic crystalline acid at low temperatures. Russ. J. Electrochem. 2015, 51, 391–396. [Google Scholar] [CrossRef]
  36. Yaroshenko, F.A.; Burmistrov, V.A. Synthesis of Hybrid Materials Based on MF-4SK Perfluorinated Sulfonated Cation-Exchange Membranes Modified with Polyantimonic Acid and Characterization of Their Proton Conductivity. Pet. Chem. 2018, 58, 770–773. [Google Scholar] [CrossRef]
  37. Leysen, R.; Vermeiren, P.; Baestle, L.; Spaepen, G.; Vanderborre, J.-B.H. Method of Preparing a Membrane Consisting of Polyantimonic Acid Powder and an Organic Binder. U.S. Patent 4253936, 3 March 1981. [Google Scholar]
  38. Ma, F.; Shi, W.; Meng, H.; Li, Z.; Zhou, W.; Zhang, L. Preparation, characterization and ion-exchange behavior of polyantimonic acid-polyacrylonitrile (PAA–PAN) composite beads for strontium(II). J. Radioanal. Nucl. Chem. 2016, 308, 155–163. [Google Scholar] [CrossRef]
  39. Kovalenko, L.Y.; Yaroshenko, F.A.; Burmistrov, V.A.; Isaeva, T.N.; Galimov, D.M. Thermolysis of Hydrated Antimony Pentoxide. Inorg. Mater. 2019, 55, 586–592. [Google Scholar] [CrossRef]
  40. Critchley, J.P.; Knight, G.J.; Wright, W.W. Fluorine-Containing Polymers. In Heat-Resistant Polymers; Springer US: Boston, MA, USA, 1983; pp. 87–123. [Google Scholar]
  41. Drobny, J.G. Technology of Fluoropolymers; CRC Press: Boca Raton, FL, USA, 2014; ISBN 9780429117251. [Google Scholar]
  42. Ostrovskii, D.; Valakh, M.; Karasiova, T.; Yaremko, A. The peculiarities of hydrogen bonds in raman spectra of solid superionic polyantimonic acids. Ferroelectrics 1997, 192, 93–99. [Google Scholar] [CrossRef]
  43. Cody, C.A.; DiCarlo, L.; Darlington, R.K. Vibrational and thermal study of antimony oxides. Inorg. Chem. 1979, 18, 1572–1576. [Google Scholar] [CrossRef]
  44. Nakamoto, K. Infrared and Raman Spectra of Inorganic and Coordination Compounds, 6th ed.; Wiley: Hoboken, NJ, USA, 2009; ISBN 978-0-471-74339-2. Available online: https://2lib.org/book/593471/6aaca8?id=593471&secret=6aaca8 (accessed on 22 April 2021).
  45. Burgard, M.; MacCordick, J. Isomorphism and spectral analogies in pairs of ionic and coordination complexes of SbCl5. Inorg. Nucl. Chem. Lett. 1970, 6, 599–602. [Google Scholar] [CrossRef]
  46. Janseen, M.; Pebler, J.; Dehsicke, K. 121Sb-Mosbauer-Spektrum und Schwingungsspektrum von Sb2O5. Z. Arnorg. Allg. Chem. 1982, 495, 120–126. [Google Scholar] [CrossRef]
  47. Dixit, A.; Majumder, S.B.; Dobal, P.S.; Katiyar, R.S.; Bhalla, A.S. Phase transition studies of sol–gel deposited barium zirconate titanate thin films. Thin Solid Film. 2004, 447–448, 284–288. [Google Scholar] [CrossRef]
  48. Bauerle, J.E. Study of solid electrolyte polarization by a complex admittance method. J. Phys. Chem. Solids 1969, 30, 2657–2670. [Google Scholar] [CrossRef]
  49. Peng, Z.; Huguet, P.; Deabate, S.; Morin, A.; Sutor, A.K. Depth-resolved micro-Raman spectroscopy of tri-layer PFSA membrane for PEM fuel cells: How to obtain reliable inner water contents. J. Raman Spectrosc. 2013, 44, 321–328. [Google Scholar] [CrossRef]
  50. Adjemian, K.T.; Lee, S.J.; Srinivasan, S.; Benziger, J.; Bocarsly, A.B. Silicon Oxide Nafion Composite Membranes for Proton-Exchange Membrane Fuel Cell Operation at 80–140°C. J. Electrochem. Soc. 2002, 149, A256. [Google Scholar] [CrossRef]
  51. Stoica, D.; Ogier, L.; Akrour, L.; Alloin, F.; Fauvarque, J.-F. Anionic membrane based on polyepichlorhydrin matrix for alkaline fuel cell: Synthesis, physical and electrochemical properties. Electrochim. Acta 2007, 53, 1596–1603. [Google Scholar] [CrossRef]
  52. Stoica, D.; Alloin, F.; Marais, S.; Langevin, D.; Chappey, C.; Judeinstein, P. Polyepichlorhydrin Membranes for Alkaline Fuel Cells: Sorption and Conduction Properties. J. Phys. Chem. B 2008, 112, 12338–12346. [Google Scholar] [CrossRef]
  53. Kumar, N.; Evaristo, M.; Trindade, B.; Faia, P. Humidity sensing properties of thin silicon-tin films prepared by magnetron sputtering. Sens. Actuators B Chem. 2020, 321, 128554. [Google Scholar] [CrossRef]
  54. Faia, P.M.; Libardi, J.; Barbosa, I.; Araújo, E.S.; de Oliveira, H.P. Preparation, Characterization, and Evaluation of Humidity-Dependent Electrical Properties of Undoped and Niobium Oxide-Doped TiO2: WO3 Mixed Powders. Adv. Mater. Sci. Eng. 2017, 2017, 1–9. [Google Scholar] [CrossRef] [Green Version]
  55. Faia, P.M.; Libardi, J. Response to humidity of TiO2: WO3 sensors doped with V2O5: Influence of fabrication route. Sens. Actuators B Chem. 2016, 236, 682–700. [Google Scholar] [CrossRef]
Figure 1. (a) DTA curves and (b) TG curves of 100PAA, 90PAA and 80PAA powders.
Applsci 11 11877 g001
Figure 2. SEM images of (a,b) surface and (c,d) the bulk of the 90PAA membrane.
Applsci 11 11877 g002
Figure 3. Pore size distribution in 90PAA and 80PAA samples.
Applsci 11 11877 g003
Figure 4. In situ X-ray patterns obtained for the 100PAA sample without the binder upon heating in the range 30–330 °C with steps of 10 °C.
Applsci 11 11877 g004
Figure 5. Comparison of XRD pattens for 100PAA, 90PAA and 80PAA before and after heat treatment.
Applsci 11 11877 g005
Figure 6. In situ X-ray patterns obtained for the 90PAA sample upon heating in the range 30–330 °C with steps of 10 °C.
Applsci 11 11877 g006
Figure 7. In situ X-ray patterns obtained for the 80PAA sample without the binder upon heating in the range 30–330 °C with steps of 10 °C.
Applsci 11 11877 g007
Figure 8. (a) Raman spectra of as-received PAA and after calcination at 150–250 °C; (b) detailed area of Sb2O5 vibration bands.
Applsci 11 11877 g008
Figure 9. (a) Electrical response of the 90PAA sample to RH at 25 °C (RH0, RH30, RH70 and RH100, representing relative humidity concentrations of 0%, 30%, 70% and 100%, respectively); (b) the dependence of the grain component of conductivity on the relative humidity content.
Applsci 11 11877 g009
Figure 10. Electrical response of the samples to temperature variation: (a) 10 wt.% binder content sample; (b) 20 wt.% binder content sample.
Applsci 11 11877 g010aApplsci 11 11877 g010b
Figure 11. Electrical response comparison between the 10 wt.% and 20 wt.% binder content samples with temperature variation: (a) 25 °C; (b) 75 °C; (c) 100 °C; (d) 150 °C; (e) 200 °C; (f) 250 °C; (g) the Arrhenius plots obtained for grain boundary components of conductivity of the 90PAA and 80PAA samples.
Applsci 11 11877 g011
Figure 12. Electrical response equivalent circuit model.
Applsci 11 11877 g012
Figure 13. Electrical response equivalent circuit model fits comprising the Nyquist (-m vs. Re plots) and both Bode plots (both Re and -Im vs. frequency) for each case: (ac) 10% binder content sample at 25 °C; (df) 10% binder content sample at 100 °C; (gi) 20% binder content sample at 25 °C; (jl) 20% binder content sample at 100 °C.
Applsci 11 11877 g013
Table 1. The types and temperatures of the effects according to the DTA curves and mass losses calculated from the TG curves of 100PAA, 90PAA and 80PAA samples.
Temperature, °CΔm, %
SampleEndo1-Endo2-Additional Endo EffectsExo-<300 °C
100PAA57.1126.3-36914.8
90PAA100.5123.8190
232
30314.7
80PAA-127166
211
30214.5
Table 2. Equivalent circuit fitted parameters.
RCCGEOQCPE1nCPE1QCPE2nCPE2Wcoeffi
10% bind., 25 °C1.56 × 1046.79 × 10−93.07 × 10−122.23 × 10−60.153642.33 × 10−80.883125.35 × 10−9
10% bind., 50 °C8.35 × 1052.45 × 10−84.85 × 10−123.97 × 10−60.136626.54 × 10−80.82294.97 × 10−9
10% bind., 75 °C1.23 × 1061.44 × 10−86.70 × 10−121.05 × 10−59.18 × 10−27.56 × 10−60.299893.87 × 10−9
10% bind., 100 °C5.13 × 1051.79 × 10−85.42 × 10−123.40 × 10−816.22 × 10−60.136783.72 × 10−9
10% bind., 150 °C6.72 × 1052.01 × 10−86.23 × 10−121.26 × 10−80.998991.57 × 10−61.20 × 10−13.56 × 10−9
10% bind., 200 °C6.31 × 1057.16 × 10−85.65 × 10−128.97 × 10−917.96 × 10−82.56 × 10−13.56 × 10⁻⁹
20% bind., 25 °C1.20 × 1044.31 × 10−113.94 × 10−128.80 × 10−68.31 × 10−21.27 × 10−80.845652.71 × 10−10
20% bind., 50 °C2.20 × 1045.31 × 10−113.94 × 10−124.80 × 10−68.41 × 10−21.37 × 10−80.865652.61 × 10−10
20% bind., 75 °C1.40 × 1048.31 × 10−113.94 × 10−125.00 × 10−68.41 × 10−21.47 × 10−80.825652.73 × 10−10
20% bind., 100 °C4.45 × 1043.01 × 10−114.14 × 10−124.00 × 10−68.91 × 10−21.20 × 10−80.805652.67 × 10−10
20% bind., 150 °C3.55 × 1051.51 × 10−114.01 × 10−128.17 × 10−79.21 × 10−24.04 × 10−90.735652.77 × 10−10
20% bind., 200 °C2.85 × 1052.51 × 10−114.01 × 10−126.27 × 10−71.61 × 10−15.04 × 10−90.715652.64 × 10−10
Publisher’s Note: MDPI stays neutral with regard to jurisdictional claims in published maps and institutional affiliations.

