1. Introduction
Piezoelectric materials are a type of smart material that may be employed as sensors (when a load is applied, it generates voltage) and actuators (when voltage applied it deforms). The intimate interaction of piezoelectric actuators and sensors in structural vibration attenuation makes the material distinct and smart. Piezoelectricity is the potential of a substance to produce electrical charges in response to mechanical strain. The opposite effect, deformation under the influence of an external electric field, is called the inverse piezoelectric effect. The direct effect enables piezoelectric materials to be used as sensors, and the converse effect enables them to be used as actuators. Piezoelectric ceramics, particularly lead-zirconate-titanate (PZT) variants, are the most commonly used piezoelectric materials. Piezoelectric materials have been used to actively suppress the vibration of civil structures, minimize the vibration of helicopter rotor blades, actively regulate the aero-elastic flutter of aircraft, and actively control the vibration of hard disk drives [
1,
2,
3].
The most common benefits of piezoelectric stacks are vibration attenuation, energy harvesting and linear micro/nano manipulation [
4,
5]. Essentially, several passive and active vibration damping strategies are commonly used to attenuate structural vibration. The suppression of vibration at vibration sources, during propagation and dissipation of vibration energy was a subcategory of passive damping methods [
6,
7]. Active vibration damping methods used the additional energy system to dampen unwanted vibration by generating interference vibration patterns that cancel unwanted coming vibrations [
8]. The superior dynamics of electrical actuators, particularly when using the piezoelectric theory, allow new fields of operation for noise and vibration control. The avoidance of noise and vibration is a significant challenge in the construction of helicopters and combustion engines [
9]. Comfort, safety, and sociability of the environment are important drivers of current successful system research programs. Piezoelectric patches were bounded on the structure to act as dampers [
10]. The complex vibration produced by actuating the stack consisting of two piezoelectric plates at different frequencies analyzed in this study enables further research into novel applications and methods for attenuating complex vibration using effective controlling systems.
A wafer of piezoelectric material sandwiched between two electrodes is the basic component of a piezoelectric stack actuator. The wafer is polarized uniaxially along its thickness before manufacture, and hence exhibits a substantial piezoelectric effect exclusively in this direction of polarization. A typical piezoelectric stack actuator is made by mechanically joining many wafer parts in series and electrically connecting the electrodes so that the wafers are in parallel. The correlation between the forces applied and the subsequent reaction of the piezoelectric material depends on a variety of parameters, such as the piezoelectric properties of the material, its size and shape, and the direction in which forces, or electrical fields, are applied relative to the axis of the material [
8]. Mechanical quantities, such as stress or strain, as well as electrical values, such as electric field, electric displacement (flux density), or polarization, are connected in crystals with piezoelectric characteristics. This is referred to as electromechanical coupling. When a force is applied to a piezoelectric material, the dielectric displacement induces a surface charge, resulting in the formation of an electric field. This field can be accessed as an electric voltage on attached electrodes [
11].
A single layer of piezoceramics is not capable of generating sufficient displacement for a satisfactory input voltage. To achieve higher displacement, a thicker plate, as well as an amplified electric field, is required. This issue can be fixed by stacking the plates’ layers together. Stack actuators consist of multiple layers of piezoceramics partitioned by electrodes. The layers are polarized around their thickness and axes of motion, so the strain of the piezoelectric material is dependent on the steady load of the axis [
12,
13]. Hundreds of individual piezoelectric layers separated by thin electrodes can be considered to compose the stack. Electrically, these layers are connected in parallel, allowing a lower voltage level to generate the necessary electric field. They are mechanically connected in a series configuration, which means that the elongation of each layer contributes to a greater displacement than a single element would. Stack actuators can be divided, according to the input voltage, into low-voltage and high-voltage actuators [
14]. The direct piezoelectric effect is appropriate for sensing applications. The usage of piezoelectric sensors in various studies was mostly for noise sensors, in which the vibration of sound at a given frequency is transformed into electrical impulses. Piezoelectric sensors outperform strain gauges in terms of signal-to-noise ratio and high-frequency noise rejection. Piezoelectric sensors are thus well suited for applications involving the measurement of low strain levels. They are small and easy to embed and require only a small amount of signal conditioning circuitry [
15,
16]. When geometric parameter findings of piezoelectric plates are performed, it is obvious that the maximum vibration amplitude (power generated) is highly reliant on the resonant frequency of the dominant mode, and the natural frequency changes when the geometry is modified. The influence of thickness, length, and width of the cantilever beam on the maximum resonant frequency was investigated in [
17,
18].
In [
19], the response of piezoelectric materials with varying parameters was investigated using both classical and non-classical modelling approaches. The purpose of the research was to enhance the plate’s displacement by examining various mechanical qualities. Additionally, the research established the consistency of classical and non-classical methods of displacement response for various geometrical parameters that affect the plate’s characteristics. This property is highly beneficial for designing mechatronics system. In this study, a novel approach was applied by composing a single stack with varied sizes of piezoelectric plates, modulating at different frequency spectrums, and evaluating the response. This enables users to actively dampen the complicated vibrations of the structure or system. The mathematical description built in this study for piezoelectric analysis combines a lamped parameter approach, a continuous mass approach, and the finite element method. More broadly, lumped parameter modelling entails the development of electrical and mechanical components that behave analogously to the device under consideration under specified conditions. Lumped parameter methods make use of assumptions and approximations to reduce computation time while maintaining high precision as long as the underlying assumptions are fulfilled. This enables the system’s response to be simulated and the relative value and trade-offs between many design parameters to be quantified. The model was synthesized in [
12] by integrating the mechanical and electrical domains.
FEM predicts practical results by discretizing the model into equal finite elements. In this study, the dynamic response of the plate was modeled using ANSYS software over a wide frequency band. The FEM method was used to obtain the thickness effect of the piezoelectric material over a wide frequency spectrum. The aim was to confirm the analytically solved piezoelectric material response through the simulation of finite element results. Dielectric constants are manipulated by either specifying orthotropic dielectric permittivity on the MP command (interpreted as permittivity at constant strain) or specifying terms of an anisotropic permittivity matrix on the TB command [
20]. Modal analysis is commonly used to define a structure’s dynamic properties in terms of natural frequencies. The motion of a linear system at a resonant frequency is represented by a normal mode of vibration (eigenfrequency). To characterize the thickness effects, three different thicknesses of piezoelectric plate (2 mm, 4 mm, and 8 mm) were used. Each plate’s first six modal frequencies were determined, and the harmonic response over the discovered modal frequency was simulated. The analytical and finite element methods provide useful information for the investigation of the influence of geometrical parameters of piezoelectric plates. Damping coefficient and spring constant parameters were estimated from the experimental findings using the simplex algorithm in order to achieve a realistic conclusion. The idea of studying the possibility of using variously modulated and diverse plates in a single stack shown in
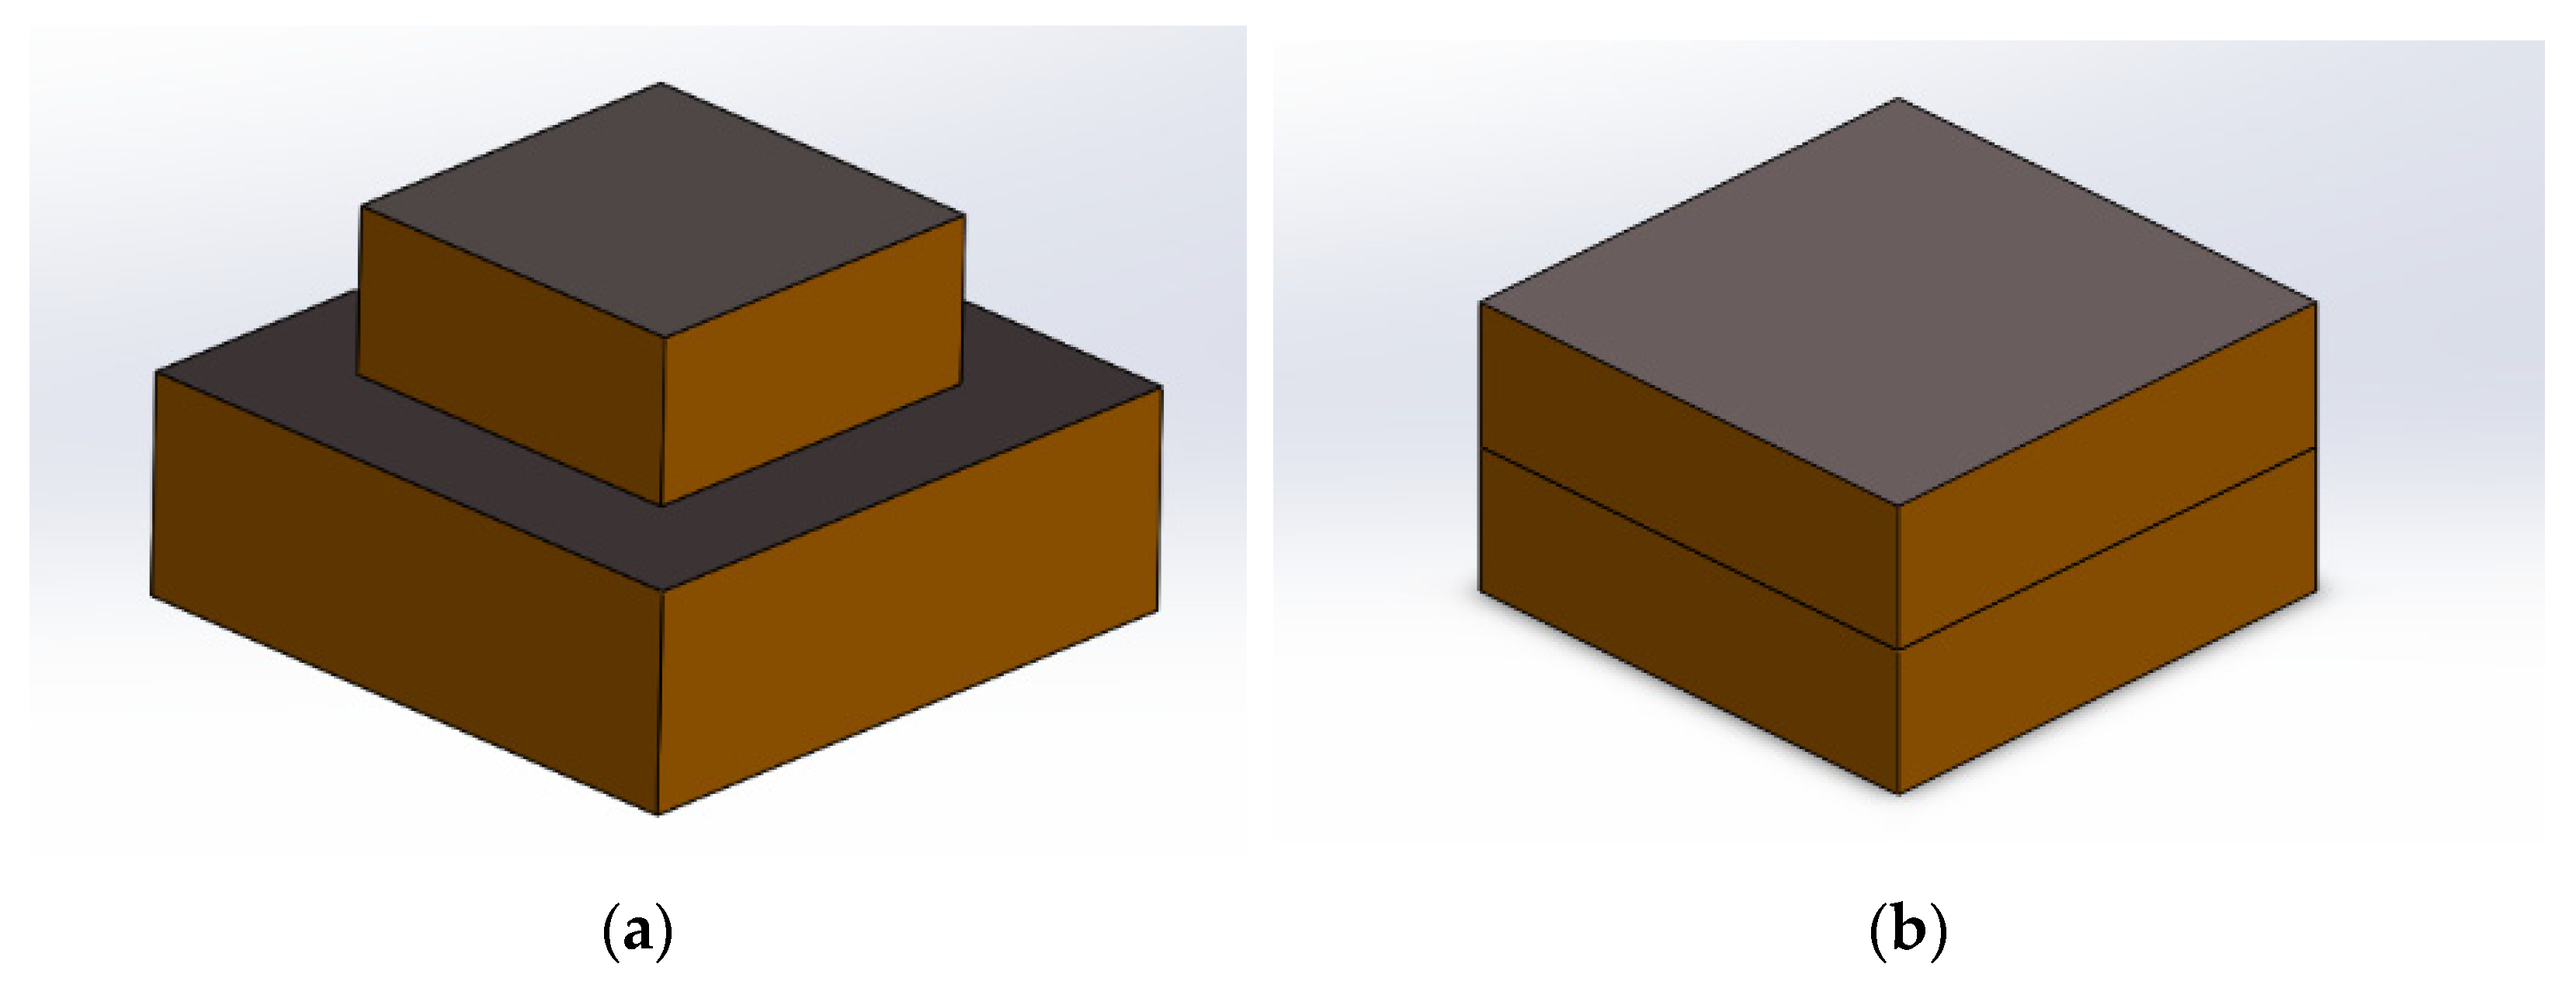
Figure 1 was accomplished along with the existing challenges and hurdles related to the suggested concept. From both dynamic model simulation and the experimental results, gluing the same piezoelectric plate creates greater displacement than gluing various sizes of piezoelectric plates.
2. Materials and Methods
The model was developed using identical and different sizes of piezoelectric plates glued together to form a piezoelectric stack. Of the two novel methods, the first method involves connecting two piezoelectric plates of the same size (
Figure 1b) (30 × 30 × 10 mm), while the second method involves testing the displacement after connecting piezoelectric plates of different sizes (
Figure 1a) (30 × 30 × 10 and 18 × 18 × 8 mm). The experiment was carried out in order to compare with the proposed mathematical model. Each plate was controlled by its own circuit, and the plates were separated in nonconductive material, assuming an ideal force transformation from one plate to another.
The IEE Ultrasonics, Ferroelectrics, and Frequency Control Society provided the most well acknowledged description of piezoelectric ceramic behavior in 1966 and updated it in 1987. This committee developed linearized constitutive relations characterizing the piezoelectric continuum, which served as the foundation for the piezoelectric behavior model that is now widely used. Piezoelectricity includes two sets of variables: mechanical (
, S) (stress, strain) and electrical (E, D) (electric field, electric induction). The generally recognized mathematical explanation based on the assumption of linearity is provided by IEEE-ANSIS standards [
21,
22]. As illustrated in
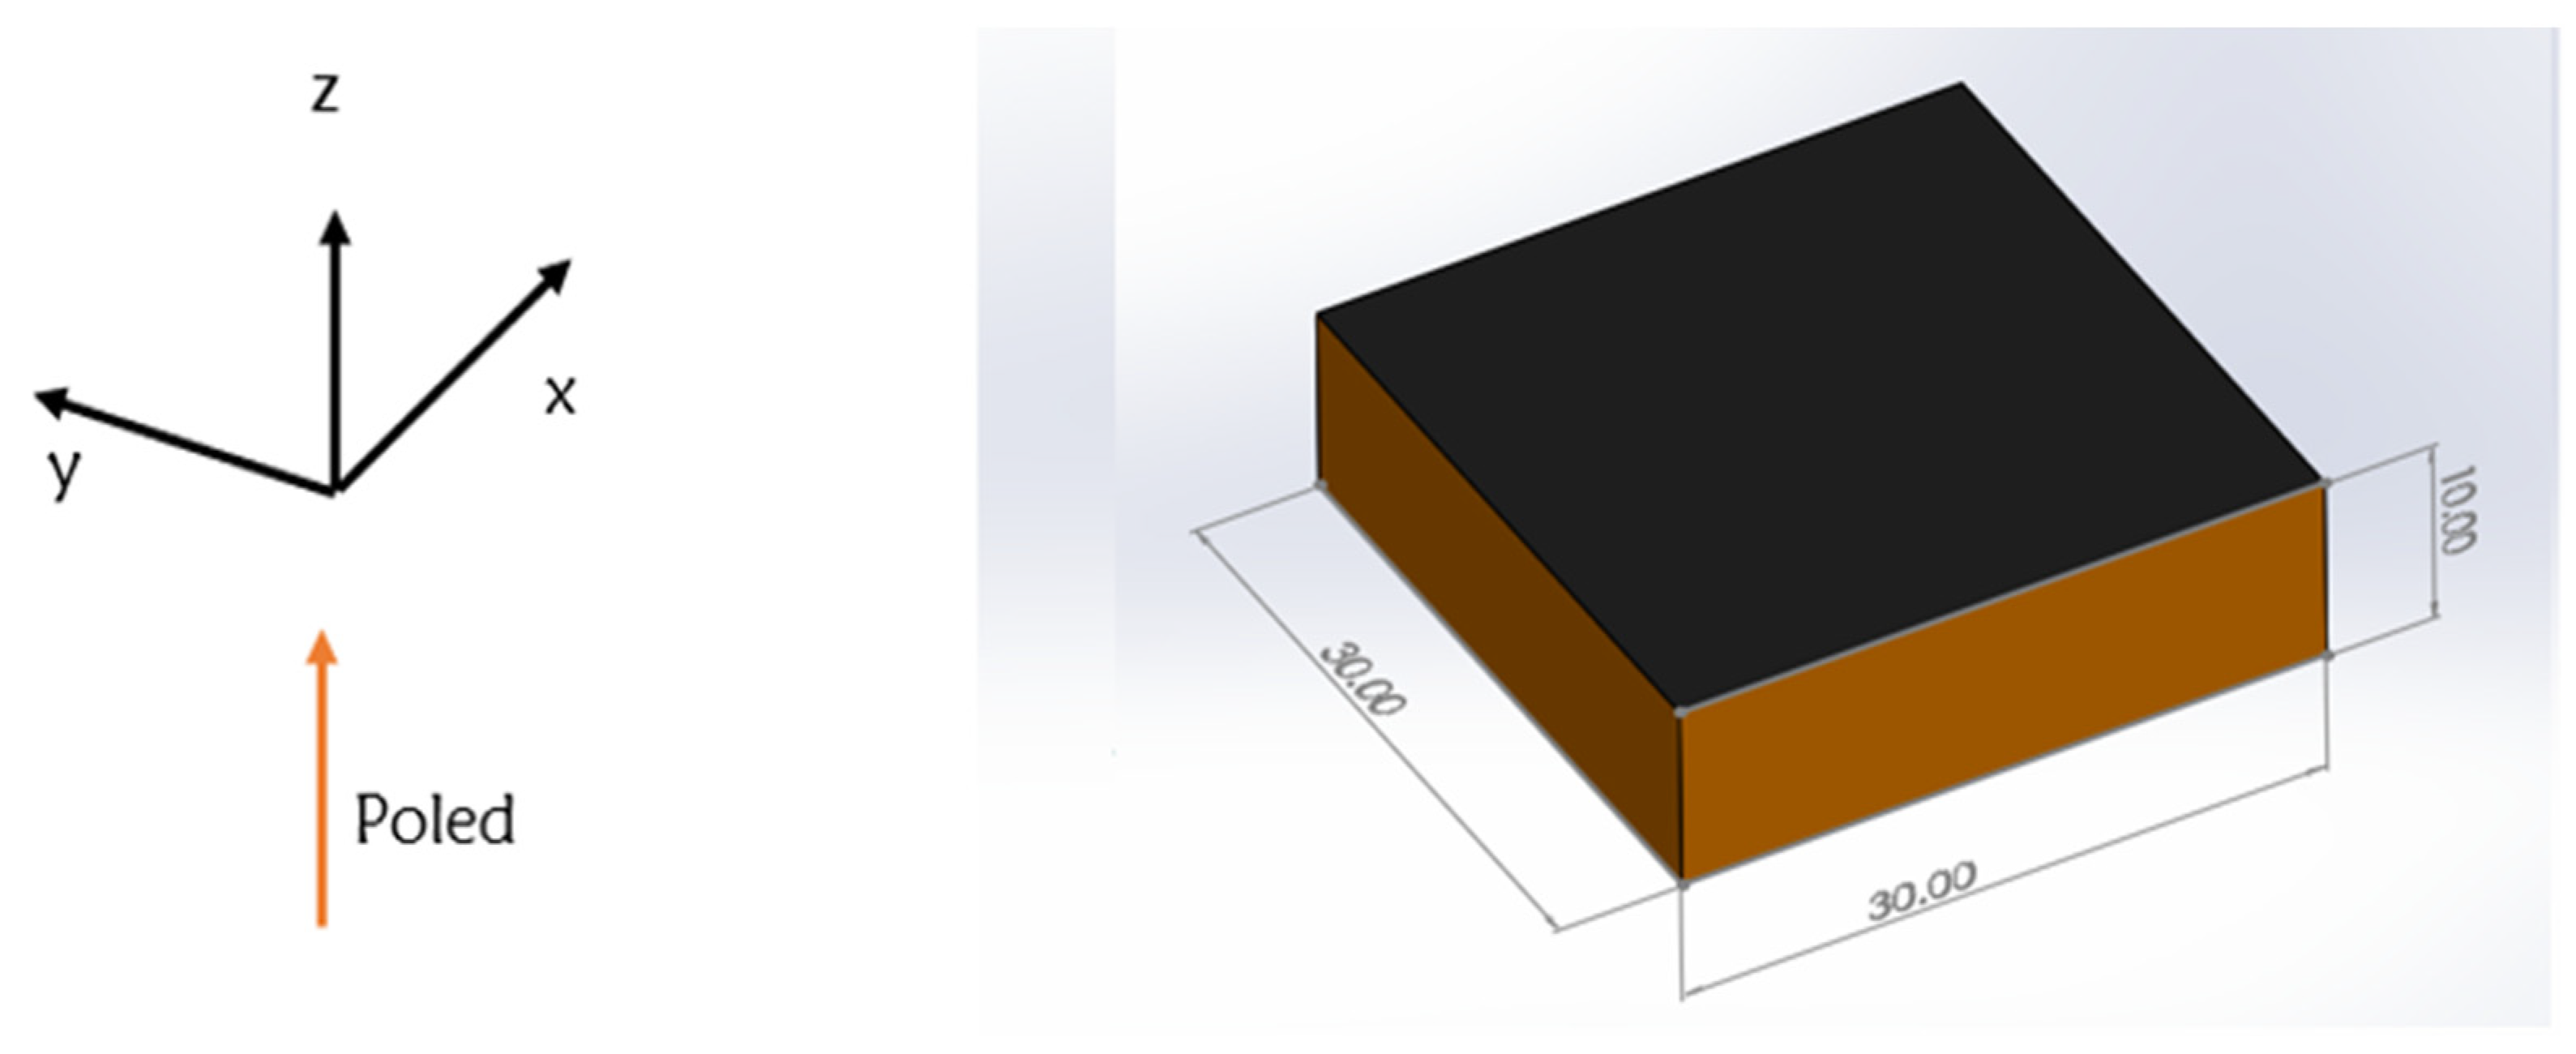
Figure 2, the assumptions made were that plate polarization is along the z direction and that the x-y planes are the electrode planes. The constitutive equation that governs piezoelectric plates is represented by Equation (1), and the equation demonstrates that the electric charge induced in the plate is directly related to the stress applied along the polarized axis.
where:
is a 6 × 6 symmetrical matrix called mechanical matrix of flexibility (compliance tensor), the superscript E in
indicates that either the electrical field is zero or it is a constant,
is the mechanical stress vector,
is the strain vector,
is a 3 × 3 symmetrical matrix called electric permittivity of the material, the superscript
in
indicates that either the stress is zero or it is a constant,
is a 3 × 6 matrix of piezoelectric coefficients, the superscript T refers to matrix transposition,
is the vector of the applied electric field, and
is the vector of electric displacement. Since
is the function of the electric field that depends on electric voltage and plate thickness, we may say that electric displacement is a function of the plate thickness.
The dynamic equation that describes the elongation vibration of the plate along the polarization axis (z) as shown in
Figure 2 is as follows:
The linear constitutive equations were calculated on a basis in which the assumed boundary conditions were taken into account. In Equation (2),
denotes the plate’s deformation along the polarization axis,
represents the plate’s thickness, and
denotes the plate’s density. The following equation represents the linear constitutive equation that can be used for boundary condition analysis.
The displacement computed in this work is for deformation along the thickness (the item will expand along the thickness) and the parameters and are the piezoelectric coefficient and the compliance along the thickness, respectively.
Substituting Equation (3) into Equation (2):
The following equation gives the sound velocity (
) of the piezoceramic based on the elastic property:
Substituting Equation (5) into Equation (4):
The general solution for this equation is given by:
where:
and
are the constants determined from the boundary condition by using the linear constituting equation that describes the electromechanical effects. Assuming that the lower face of piezoelectric stack is clamped to the rigid surface and the upper face deforms:
Substituting the boundary condition given in Equation (9) into the given solution in Equation (7)
The constants are easily determined as follows:
Then Equation (7) is simplified to:
To obtain
from the boundary condition, the simultaneous solution of the linear equation yields:
Solving for stress gives:
Substituting Equation (12) into Equation (11):
Substituting
into Equation (12):
Assuming that the voltage is applied on the upper face grounding the lower face,
Substituting the boundary condition, one can realize that:
where: (
) is the load applied to the upper surface, (
) is electric charge density collected at the upper electrode, (
) is electric field strength, (
) denotes the thickness of the plate, and (
) represents:
The electric charge density gathered at the upper surface as a result of the voltage and force (mostly clamping load) applied along the thickness of the plate is represented by Equation (15).
Equation (16) represents the displacement of the upper surface of the piezoelectric plate and the charge collected with respect to the plate’s thickness and the area of electrodes in the consideration of homogeneous mass distribution.
Mechanical equivalent electrical circuits have been demonstrated to be useful in the past and appear to be a good technique for modeling electromechanical systems, including smart structures with piezoelectric actuators. The correctness of the differential equations between the physical electromechanical device and the electrical system supports this technique. Mason’s approach is used to develop the equivalent electromechanical model [
23,
24].
Mason’s principle states:
In Equation (18),
denotes the velocity of the upper face,
denotes the electric current, and Z represents the impedance. As a recall, the harmonics consists of:
From Equations (16) and (17), one can find that:
the short-circuit device stiffness and
device capacity
Substituting Equation (19) into Mason’s equation:
In Equations (19) and (20) represents one dimensional analysis by clamping one face and analyzing the deformation and electric displacement on opposite face, the individual terms of the matrix represent the flexibility, admittance, and characteristics of the system.
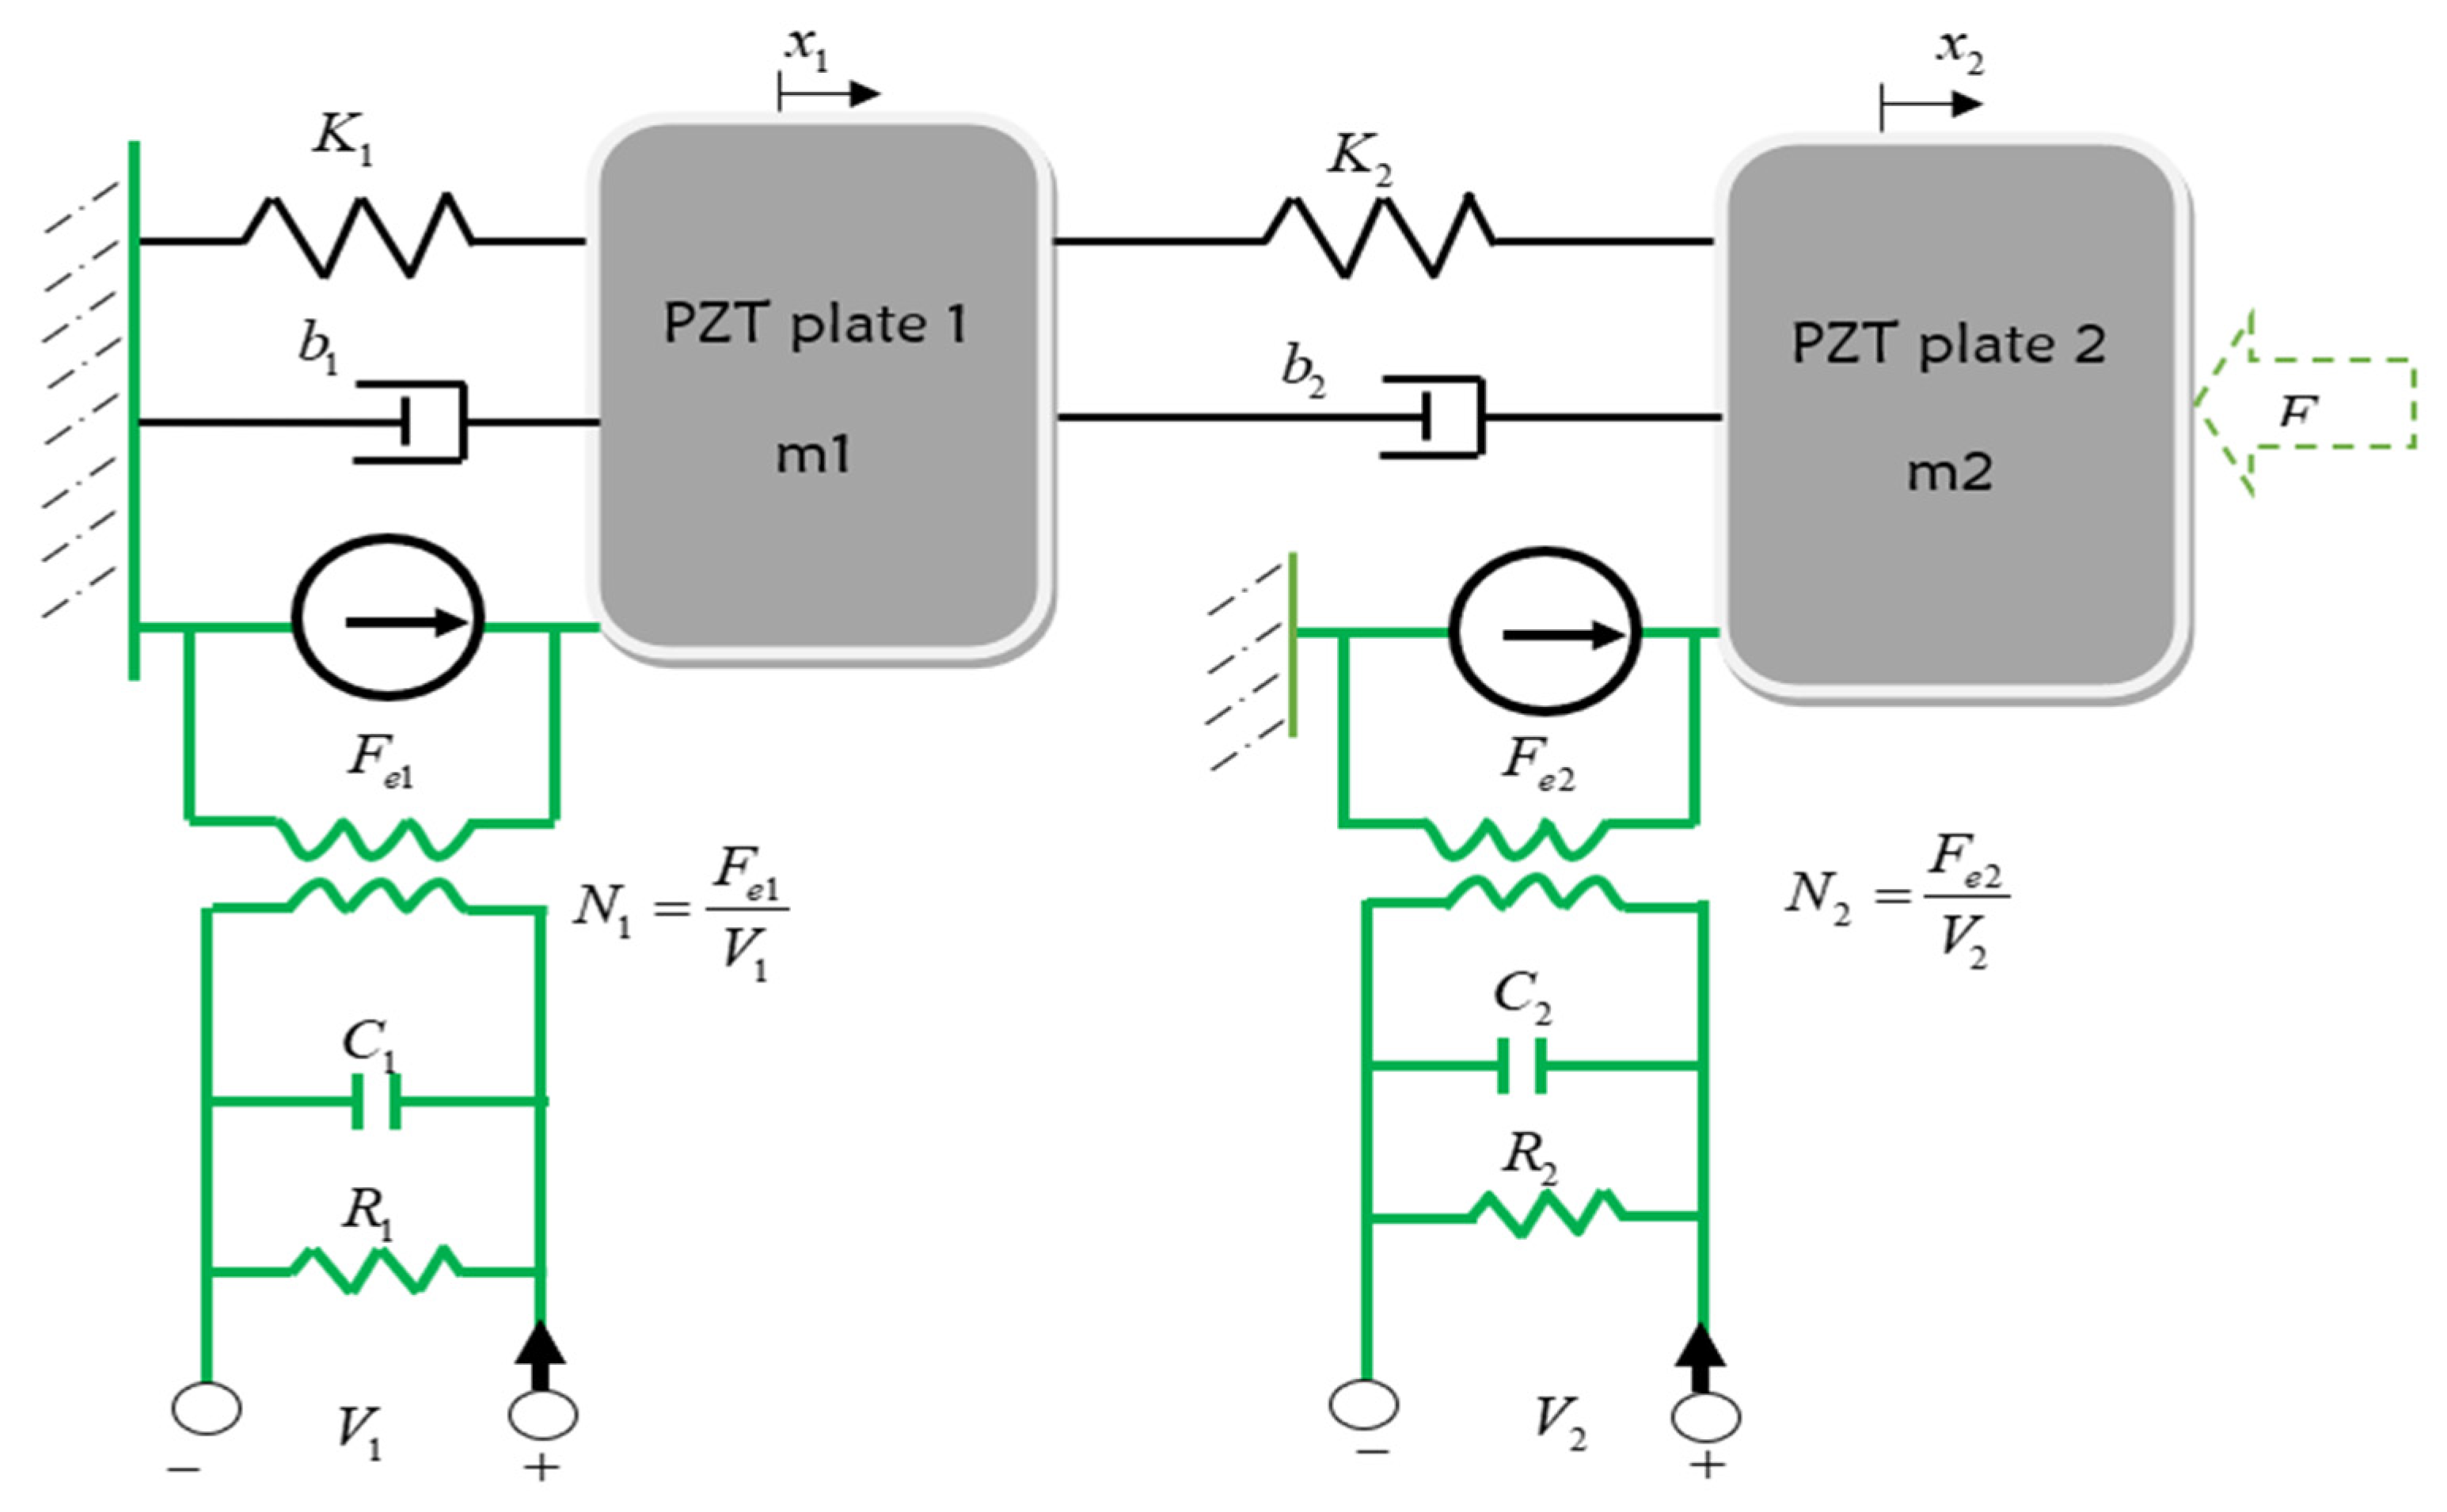
Piezoelectric stack modeling is more complicated than single-plate modeling. The primary purpose of this study was to develop a model composed of layered piezoelectric plates that gives a complicated vibration spectrum that is highly consistent with the experimental data. The model was designed to be a cascade model, with piezoelectric plates connected in series. Experiments were carried out on the composite model, with which the simulation model was compared, and a parameter was identified.
The more simplified equation that represents the cascade model of
Figure 3 is:
Piezoelectric property can be identified by measuring the input-output parameters and the resonant frequency. From the experimentally collected data of output displacement for the input actuation voltage, it is possible to identify creditable parameters of the systems for model-based control. The resonance behavior of suitably formed specimens subjected to a sinusoidally varying electric field can be used to calculate the property values of piezoelectric ceramic materials. As objects feature their own characteristic resonance frequency at which they tend to resonate, a piezoelectric ceramic can resonate naturally with a greater amplitude when excited at this resonant frequency. There is also anti-frequency, at which the body impedance is at its highest and the oscillation amplitude is at its lowest. To determine the individual parameters, experimental measurements were constructed for different frequencies of voltage and the displacements were calibrated. The goal was to explore the response of a stack of piezoelectric plates when each plate was actuated separately with a different frequency of voltage. The figure below depicts the setup used to measure the displacement of a piezoelectric plate driven at various frequencies in order to assess the response for a novel application. Different thicknesses and areas of the plate were explored.
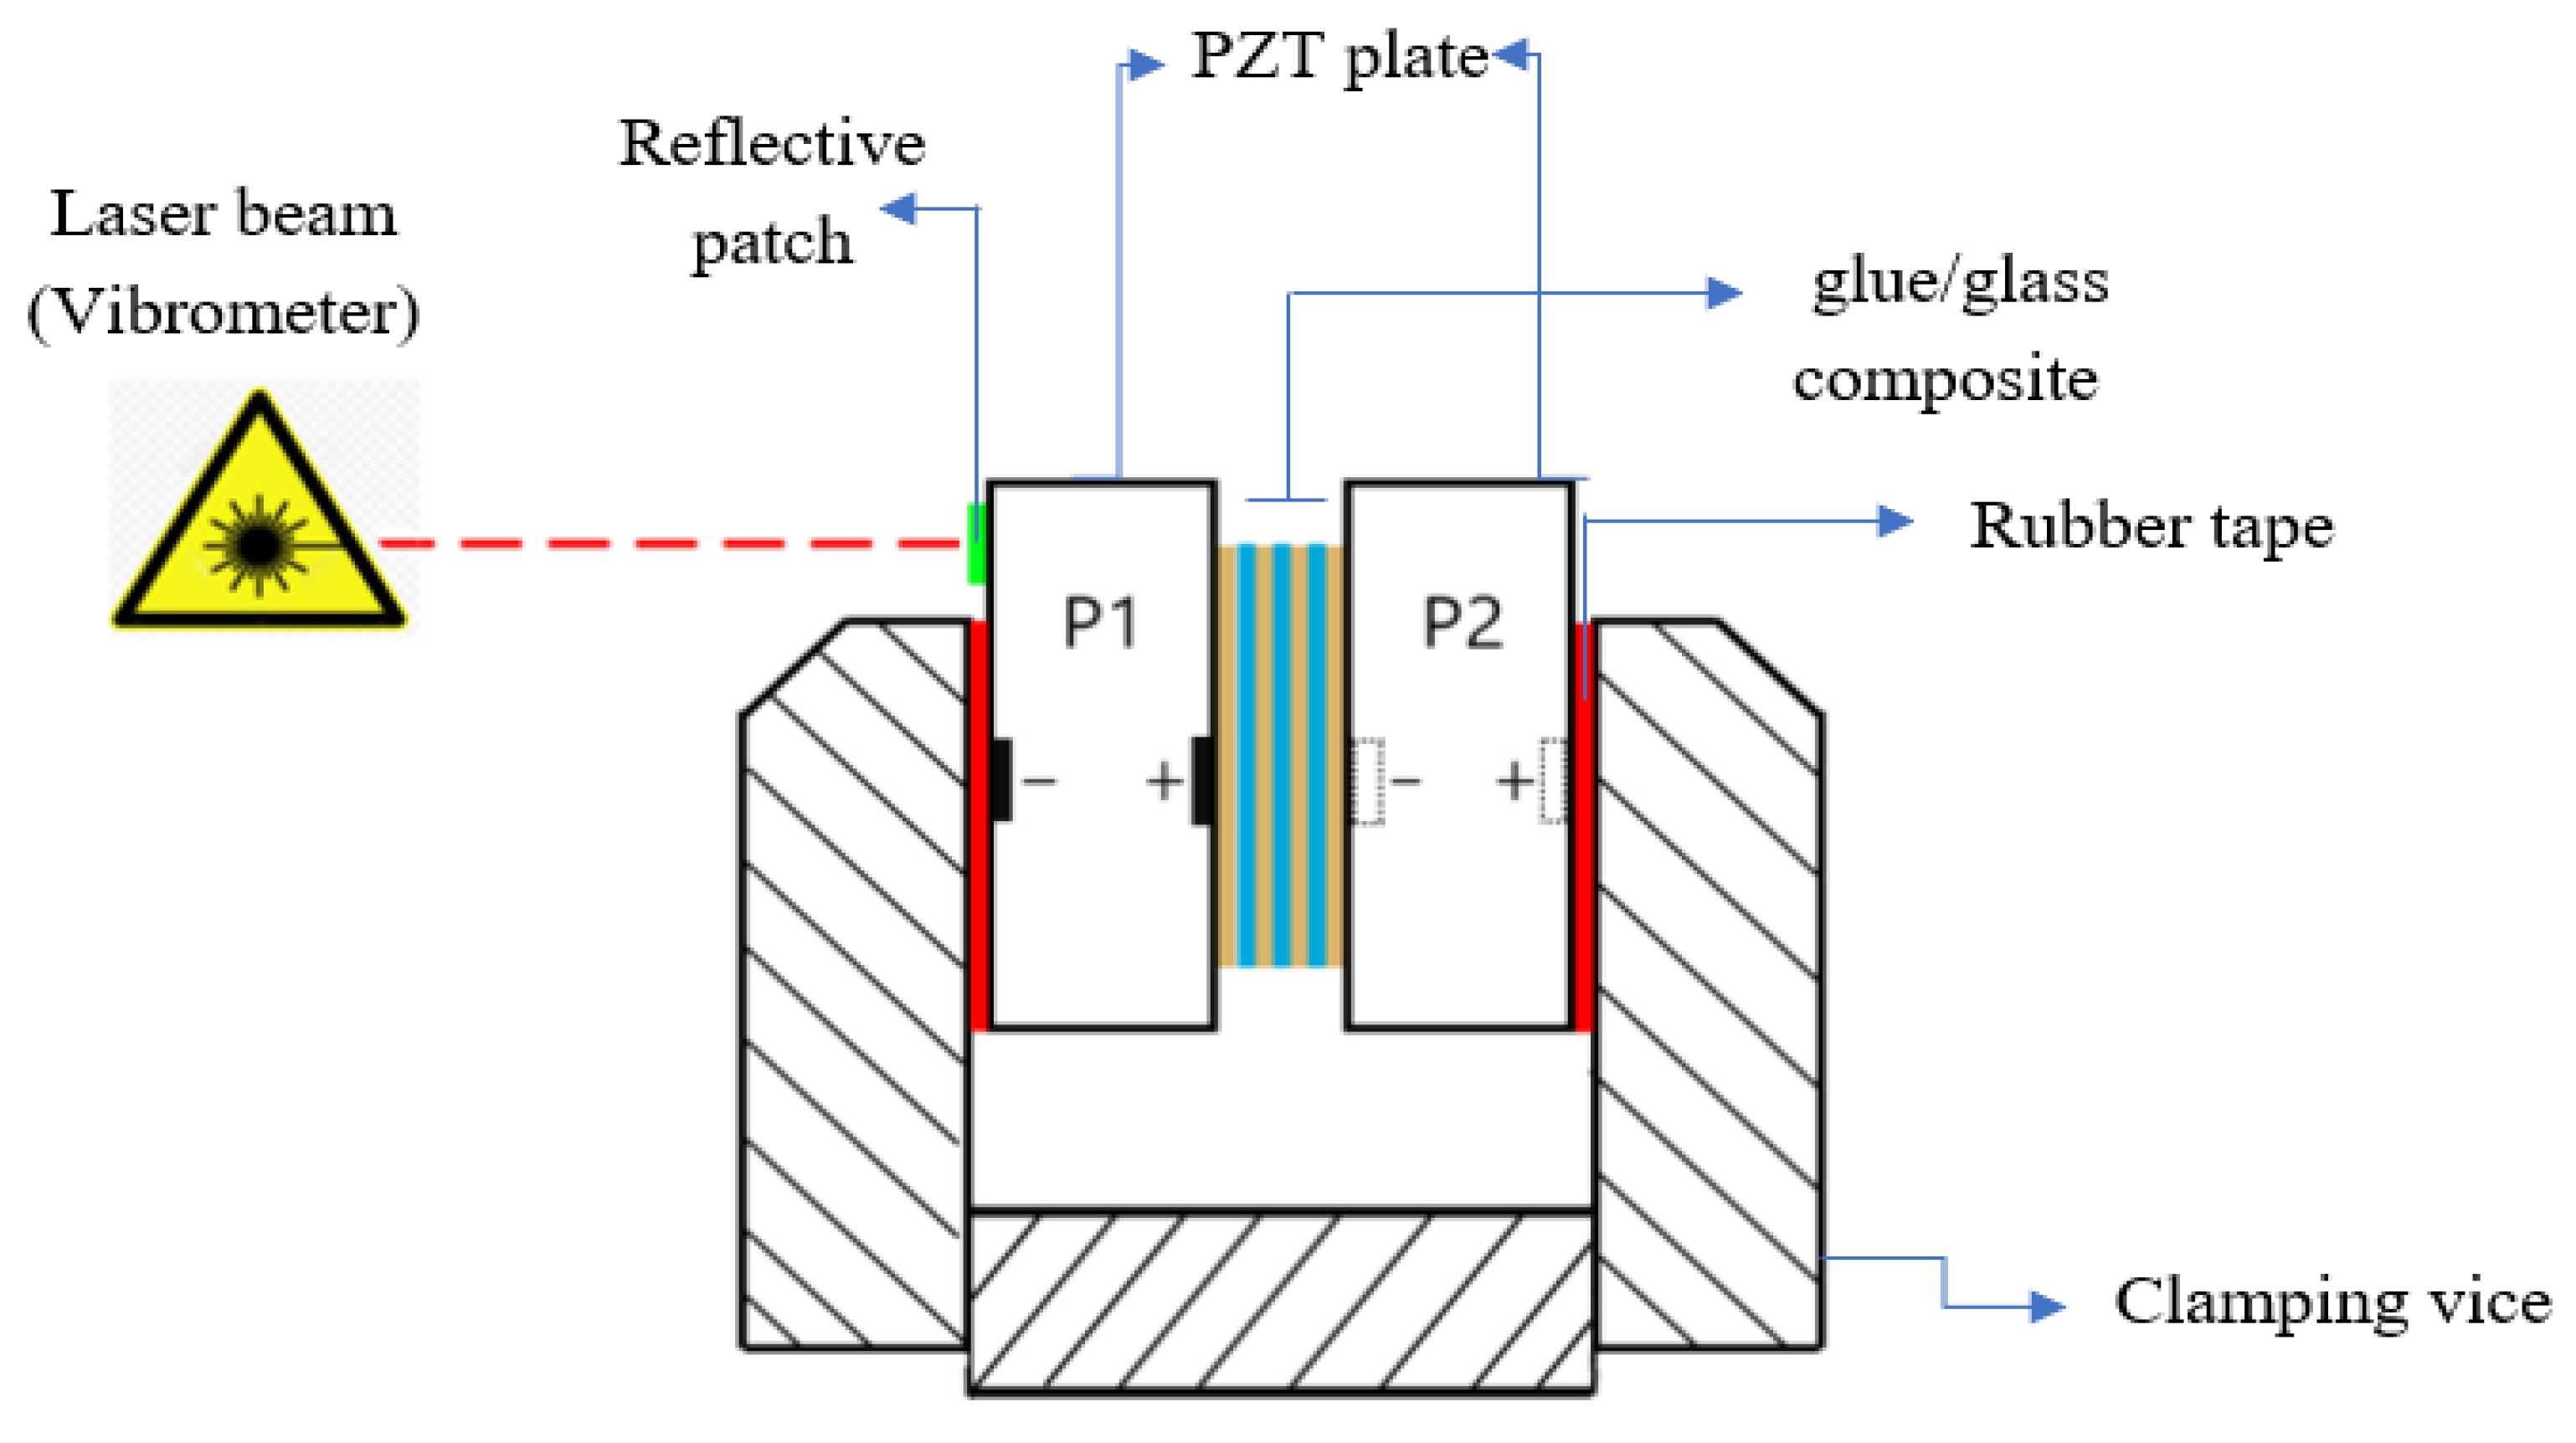
Ferroperm Piezoceramics, which include plates of various dimensions manufactured from a material named Pzt26, were used as a sample of piezoelectric plates for the investigation. In this measurement, as demonstrated in
Figure 4, two plates of the same and different sizes were placed together. The following are the dimensions of the plate used in this experiment:
The measured piezoelectric stack was held in place using a tiny vice. To electrically isolate the surfaces and allow more free propagation of vibrations generated by the piezoelectric stack, places of direct contact between the vice’s surfaces and the piezoelectric stack were lined with two layers of rubber tape. A vibrometer is a scientific tool that is used to measure the vibrations of a surface without touching it. The laser beam is focused at the surface of interest, and the amplitude and frequency of the vibrations are retrieved from the reflected laser beam frequency caused by the surface’s motion. A laser was carefully directed at one face of the stack to ensure that the reflected beam was pointing back at the vibrometer receiver. To achieve good reflection, a unique reflective strip (patch) was bonded to the plate’s surface near where the laser was pointed. This reflective patch works by reflecting light that strikes it. The vibrometer’s output terminal was connected to a Rigol DS1064B oscilloscope. After performing a series of measurements, the data were stored in a CSV file and exported to a computer using a USB stick. Two measurements were designed to assess the performance of a piezoelectric stack made up of two the same and different plate sizes. All the tests were performed with the actuation voltage set at 2 V on the source, which was amplified to 400 V. The measurements were calibrated for sinusoidal and triangular wave at different frequencies. To create the actuation voltage for both the tested piezoelectric plates, a waveform generator from Tabor Electronics was used. The study employed a model designated “WW5064.” It was capable of concurrently creating four distinct waveforms with a peak amplitude of 5 V and a maximum frequency of 20 Mhz. With respect to the experimental results, a simulation of the proposed model using parameters from the manufacturer data sheet was not practicable. The parameter considered in the model needed to be identified from the experimental findings in order to produce reliable results. It is important to account for piezoelectric physical properties such as strain, elasticity, and mass, as well as electrical properties, such as impedance or capacitance, in the case of the synthesized model. To take these properties into account, an analogous model was proposed in the mechanical domain.
The system characteristics, as well as the physical setup for model-based control design, must match the simulation results. In this paper, the parameter of damping coefficient and the spring constant were estimated from the experimental results of different frequency actuated stack displacement output as shown in
Table 1. A list of plate dimensions and constants from the manufacturer’s data sheet is provided in
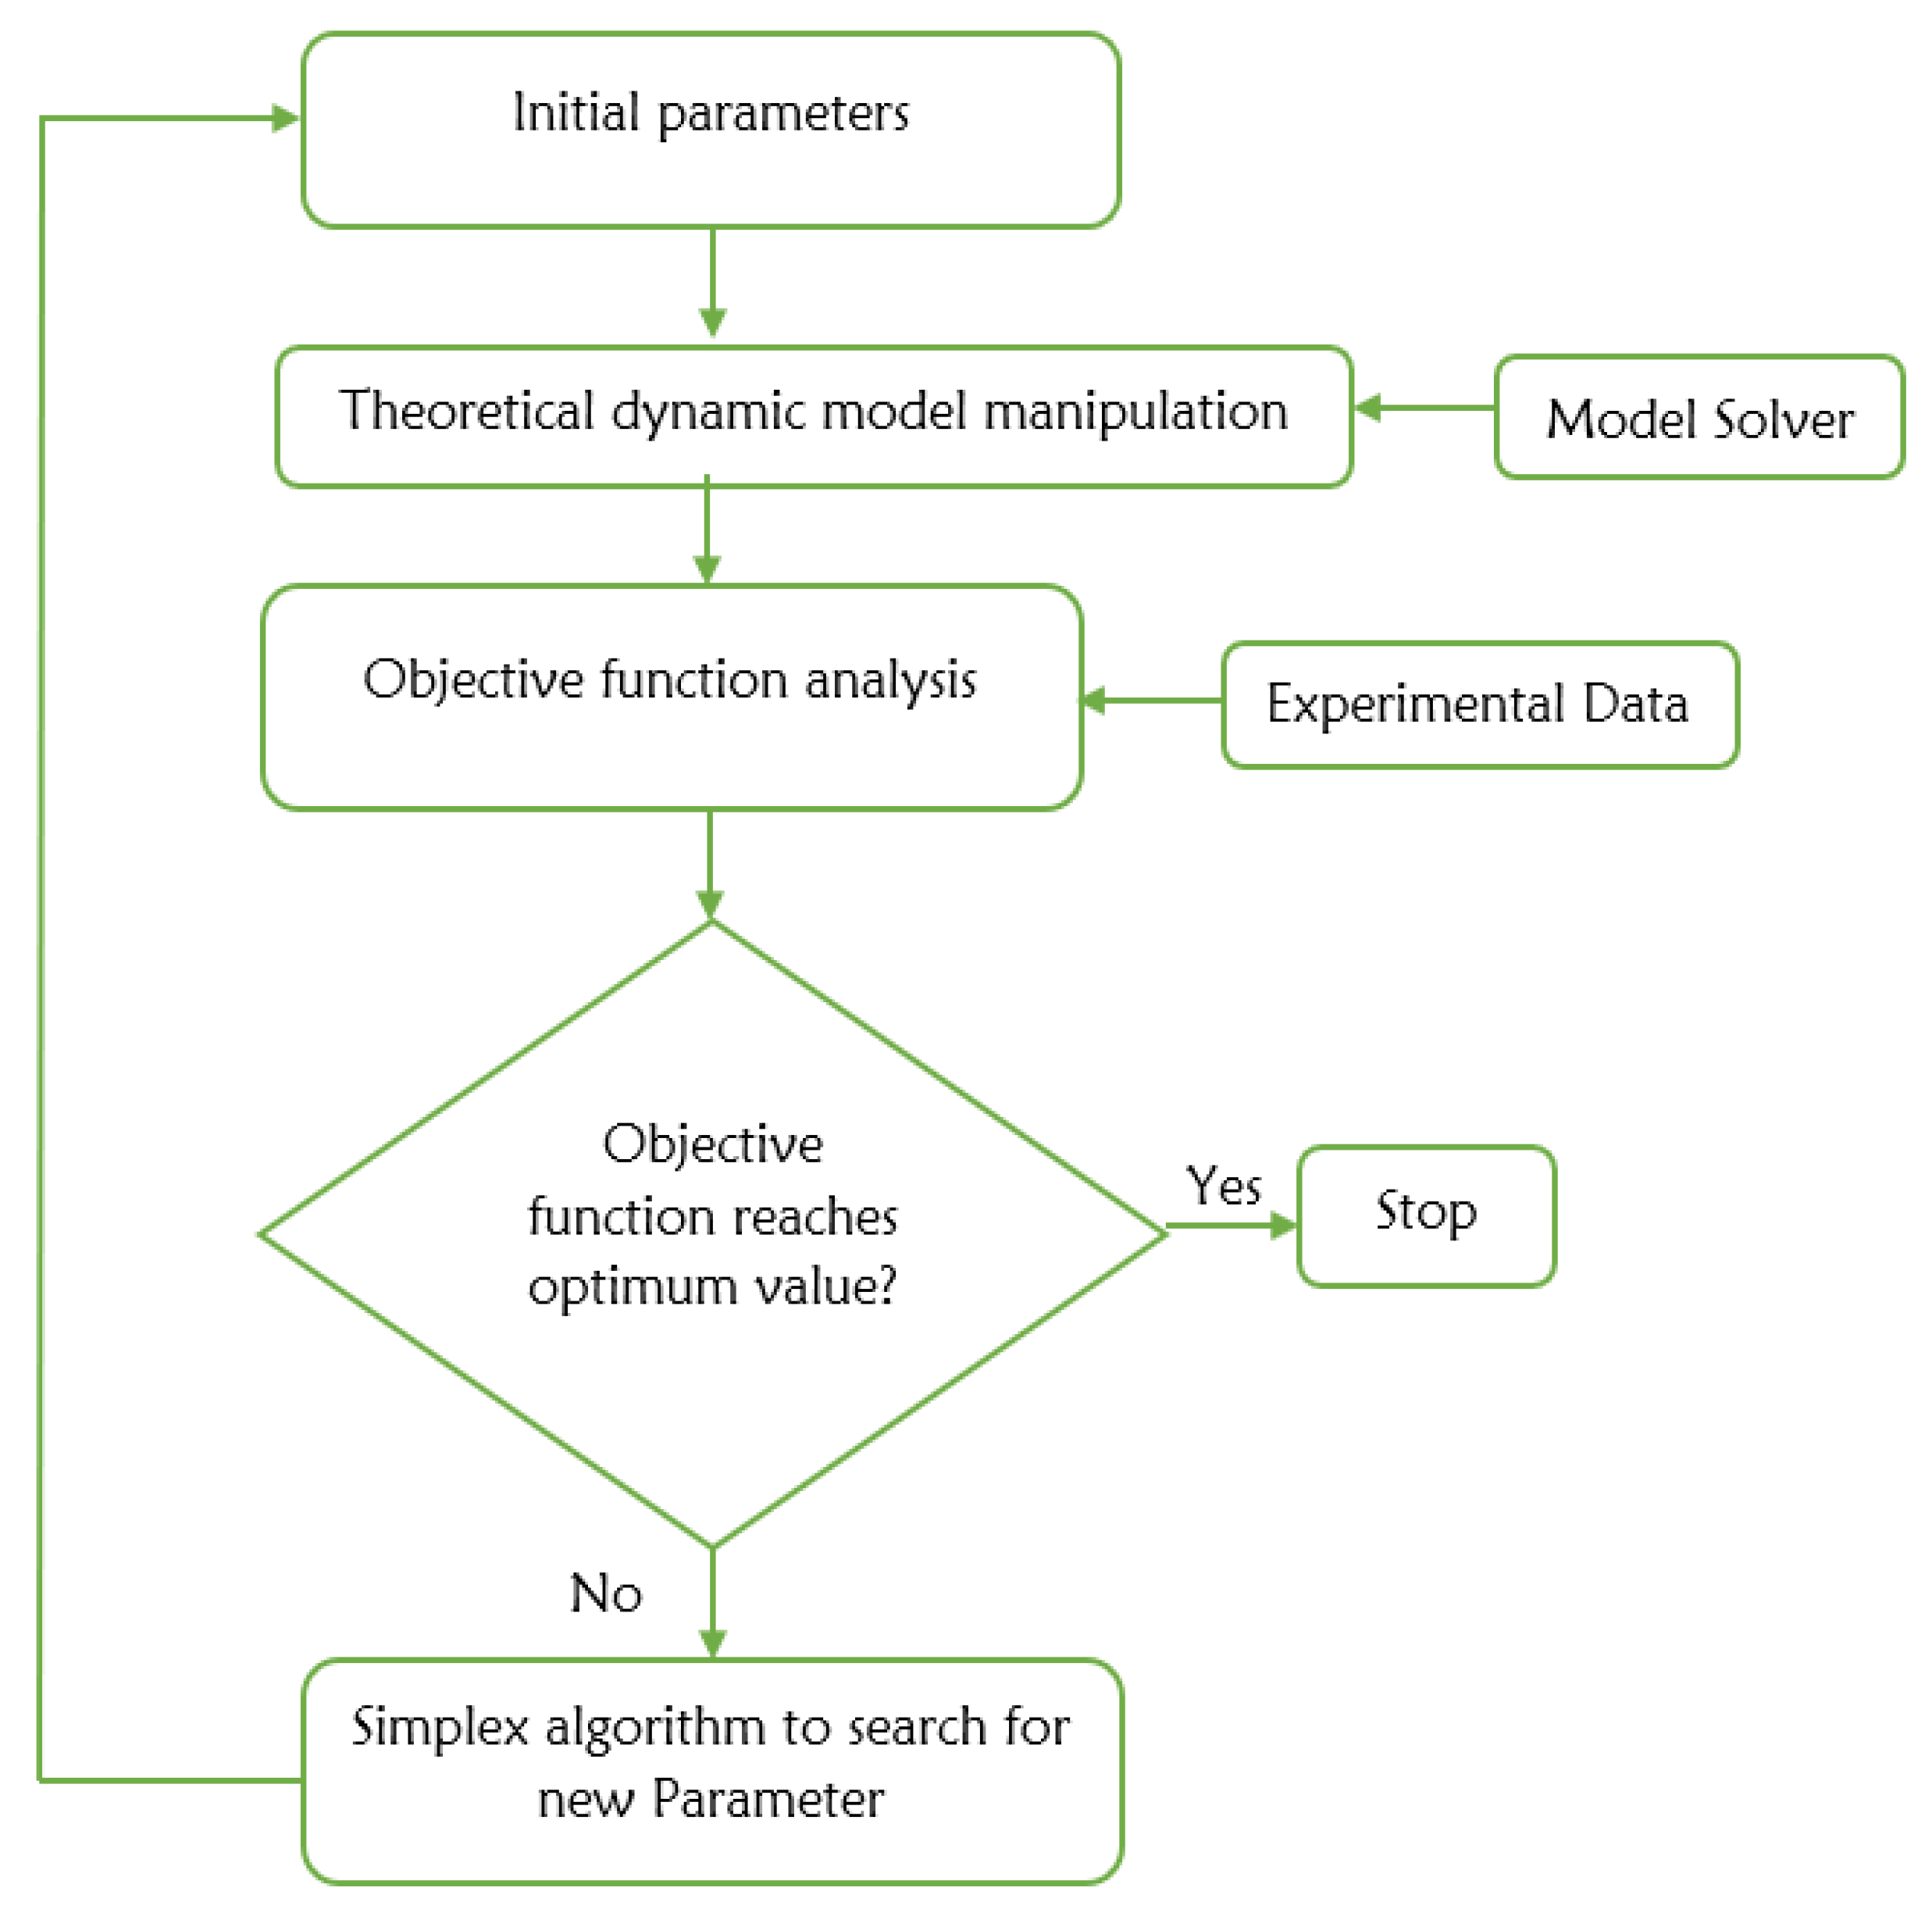
Table 2, which will be utilized to plot the plate characteristics graph in the following step. For the estimation of the experimental data, the Simplex algorithm, which is commercially available in the MATLAB toolbox, was run for 100 iterations, and the approaches of parameter identification using the described algorithm were briefly presented in
Figure 5. The bases for identifying damping coefficient and spring constants of the plate were from the time domain response of the displacement measurement of the experimental results. The data were collected at 0.000004 sampling time and different frequencies of voltage for each plate.
4. Discussion
The identified parameter was found to be the best fit for the plate operated at the same frequency. The damping coefficient and the spring constants were the parameters identified as being used for stack modelling. The manufacturer’s data sheet was used to determine the remaining parameters. The complex vibration generated by the upper and lower plates of single stack at different frequencies fit with the theoretical model, with a slightly higher percentage error than the same frequency actuated. Because the triggering voltage was somewhat lower than the transducers’ resonance frequency, the response of displacement and frequency was supposed to be linear.
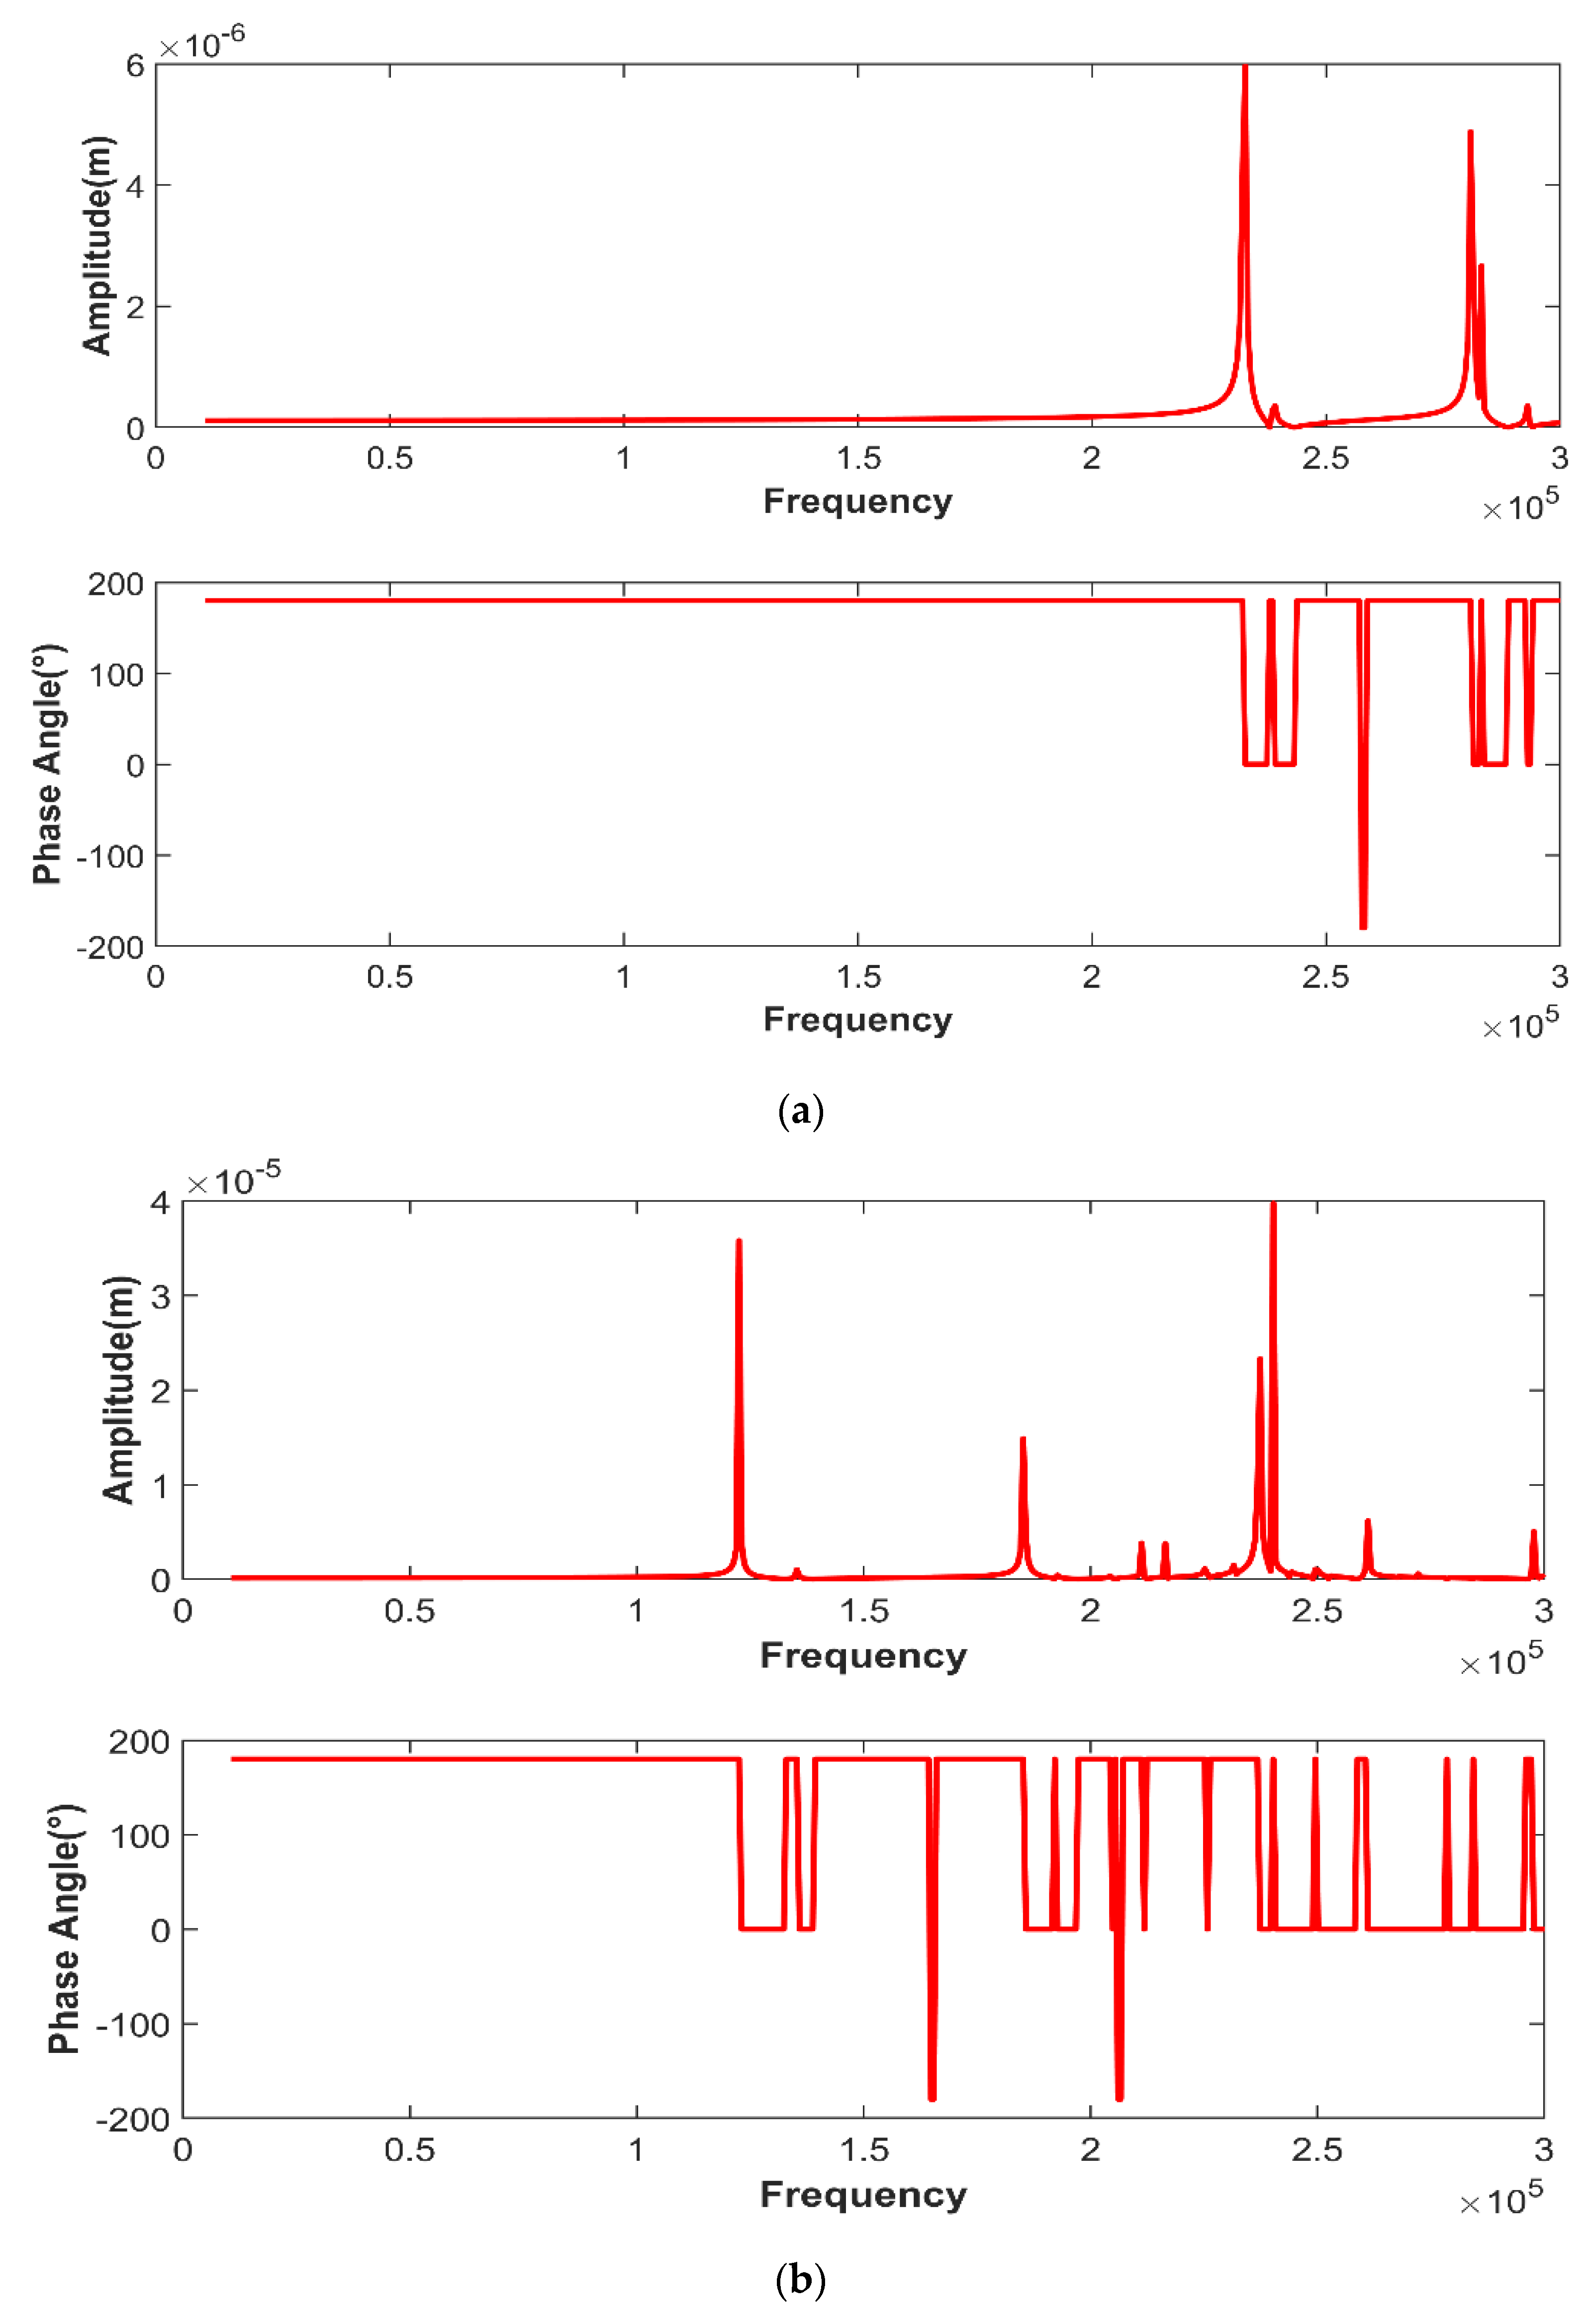
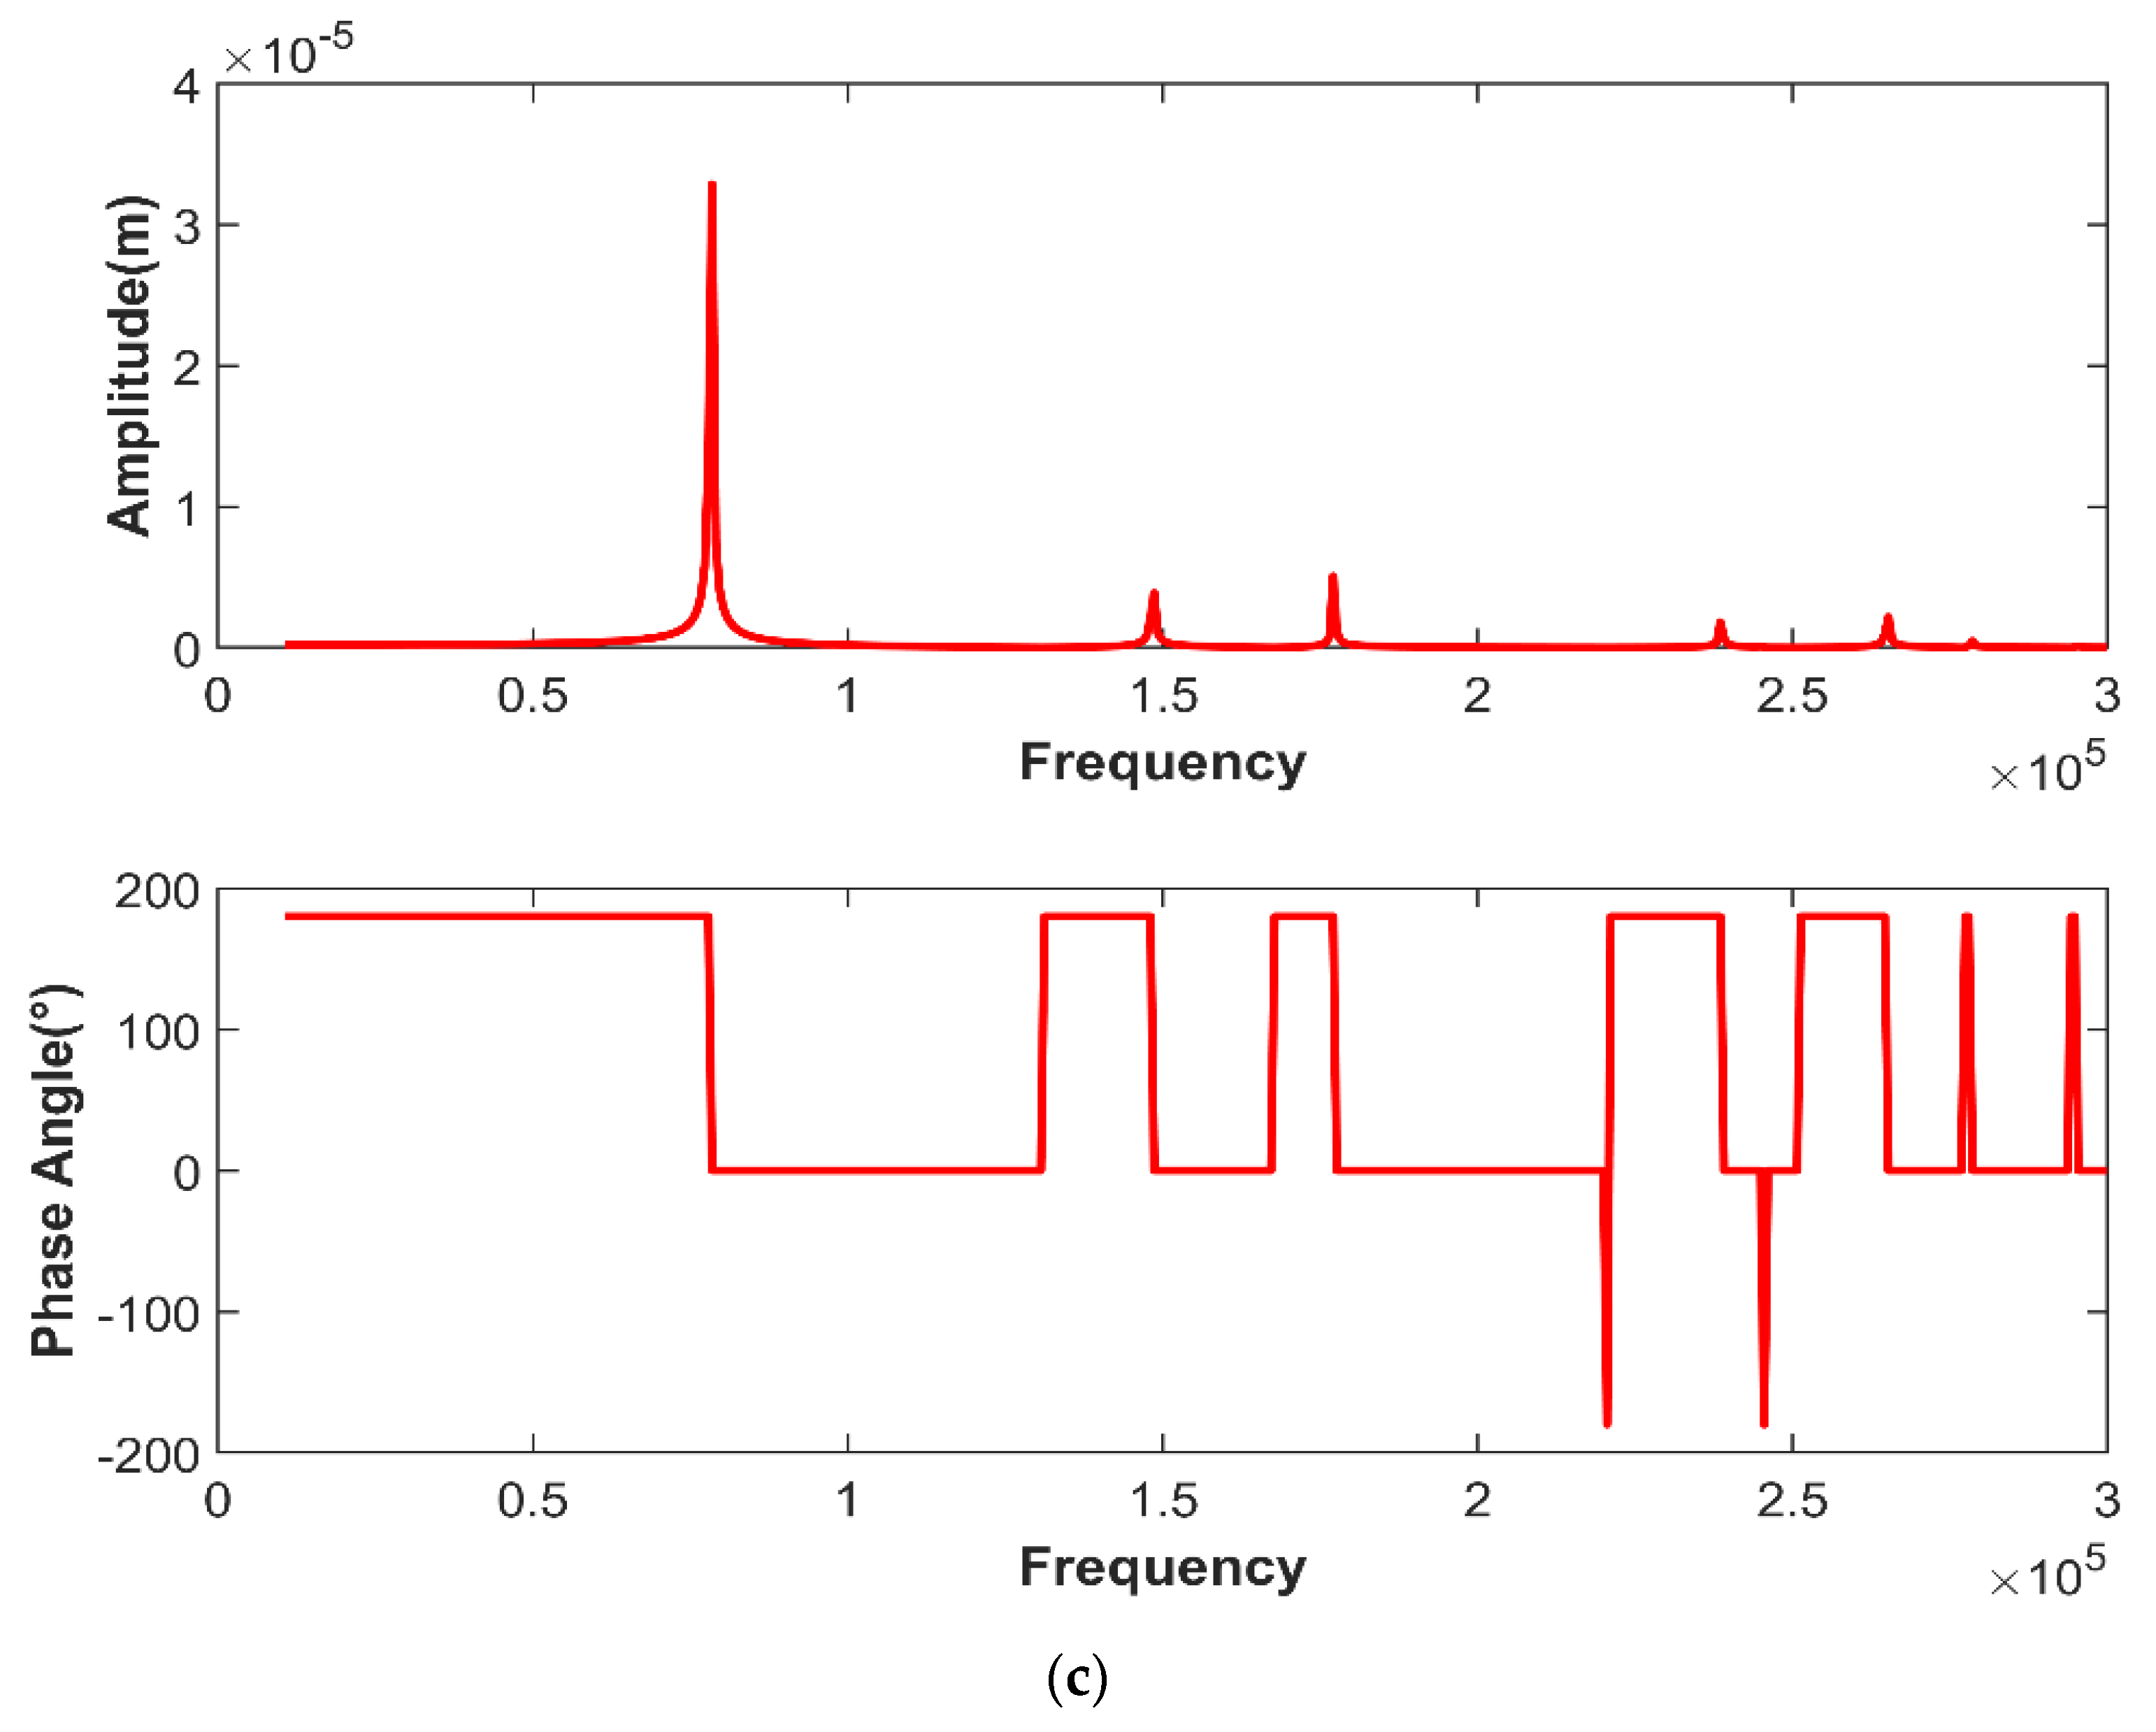
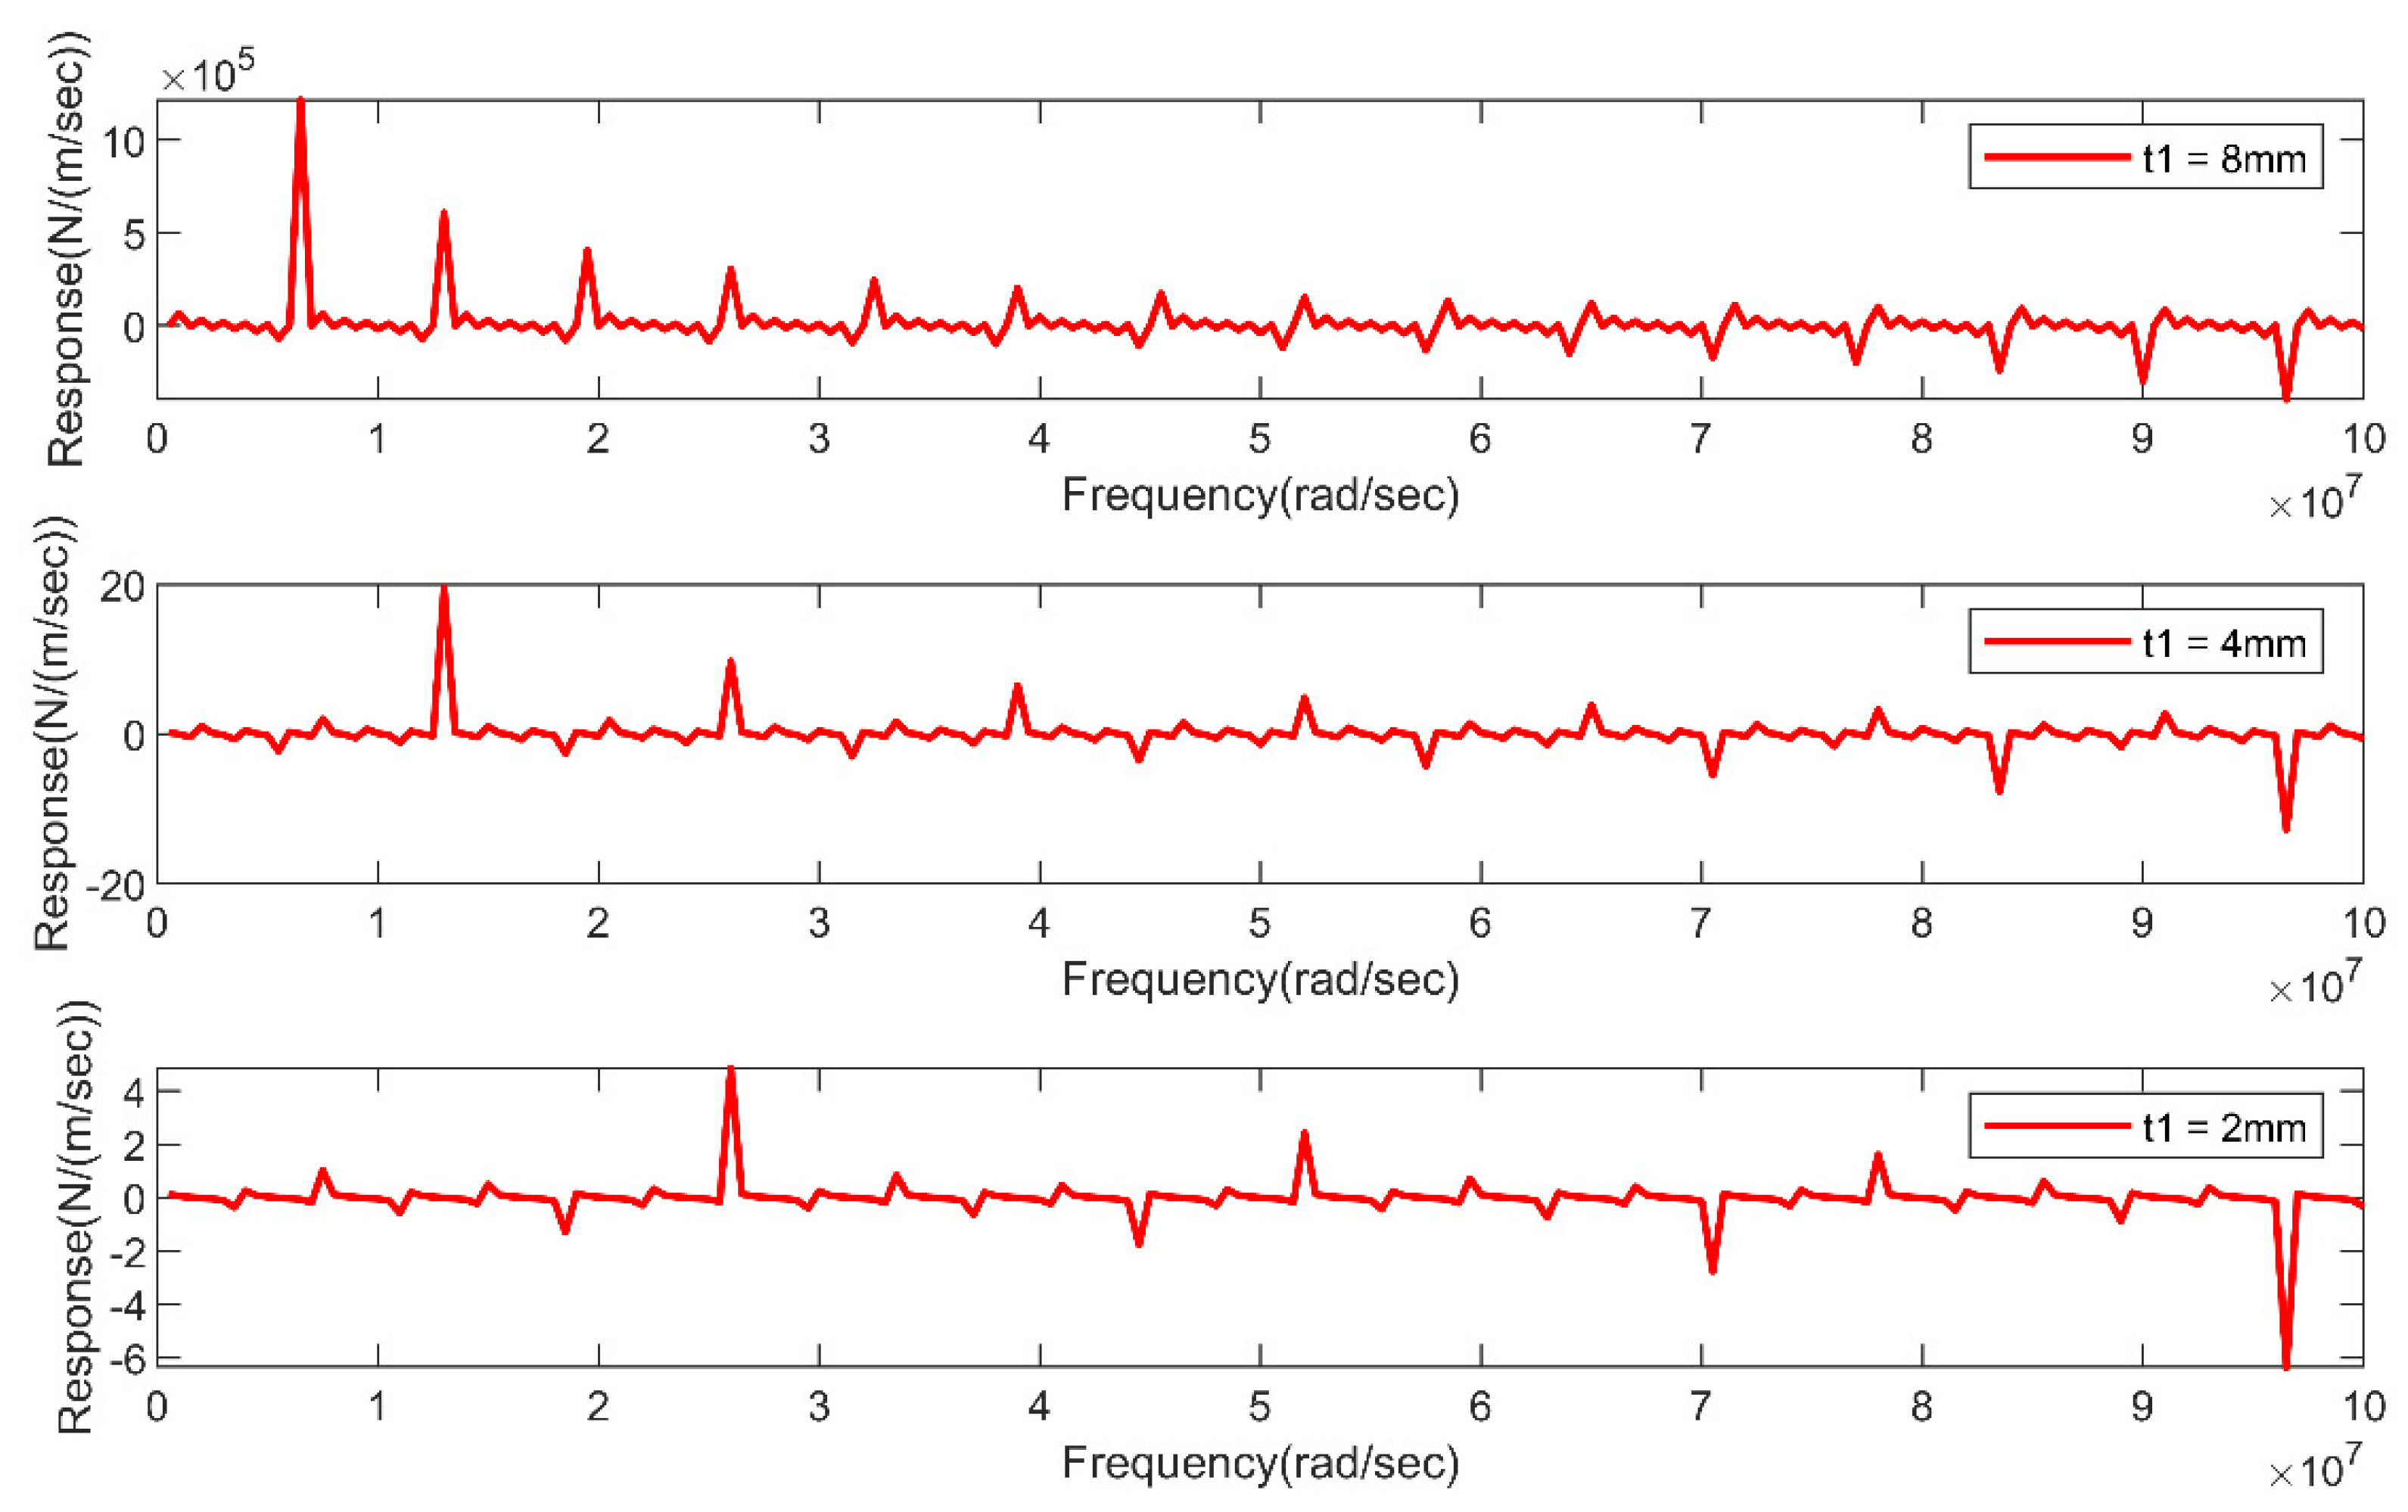
Figure 6a–c depicts the response of the output displacement over the input voltage in the given wide variety of frequency. On the graph, the sensitivity of the material to the frequency is depicted and, according to the results, the thicker PZT plate responded at the lower frequency and more damping efficiency at that frequency. The displacement response was also higher for the thicker PZT plate, which could be practically predictable.
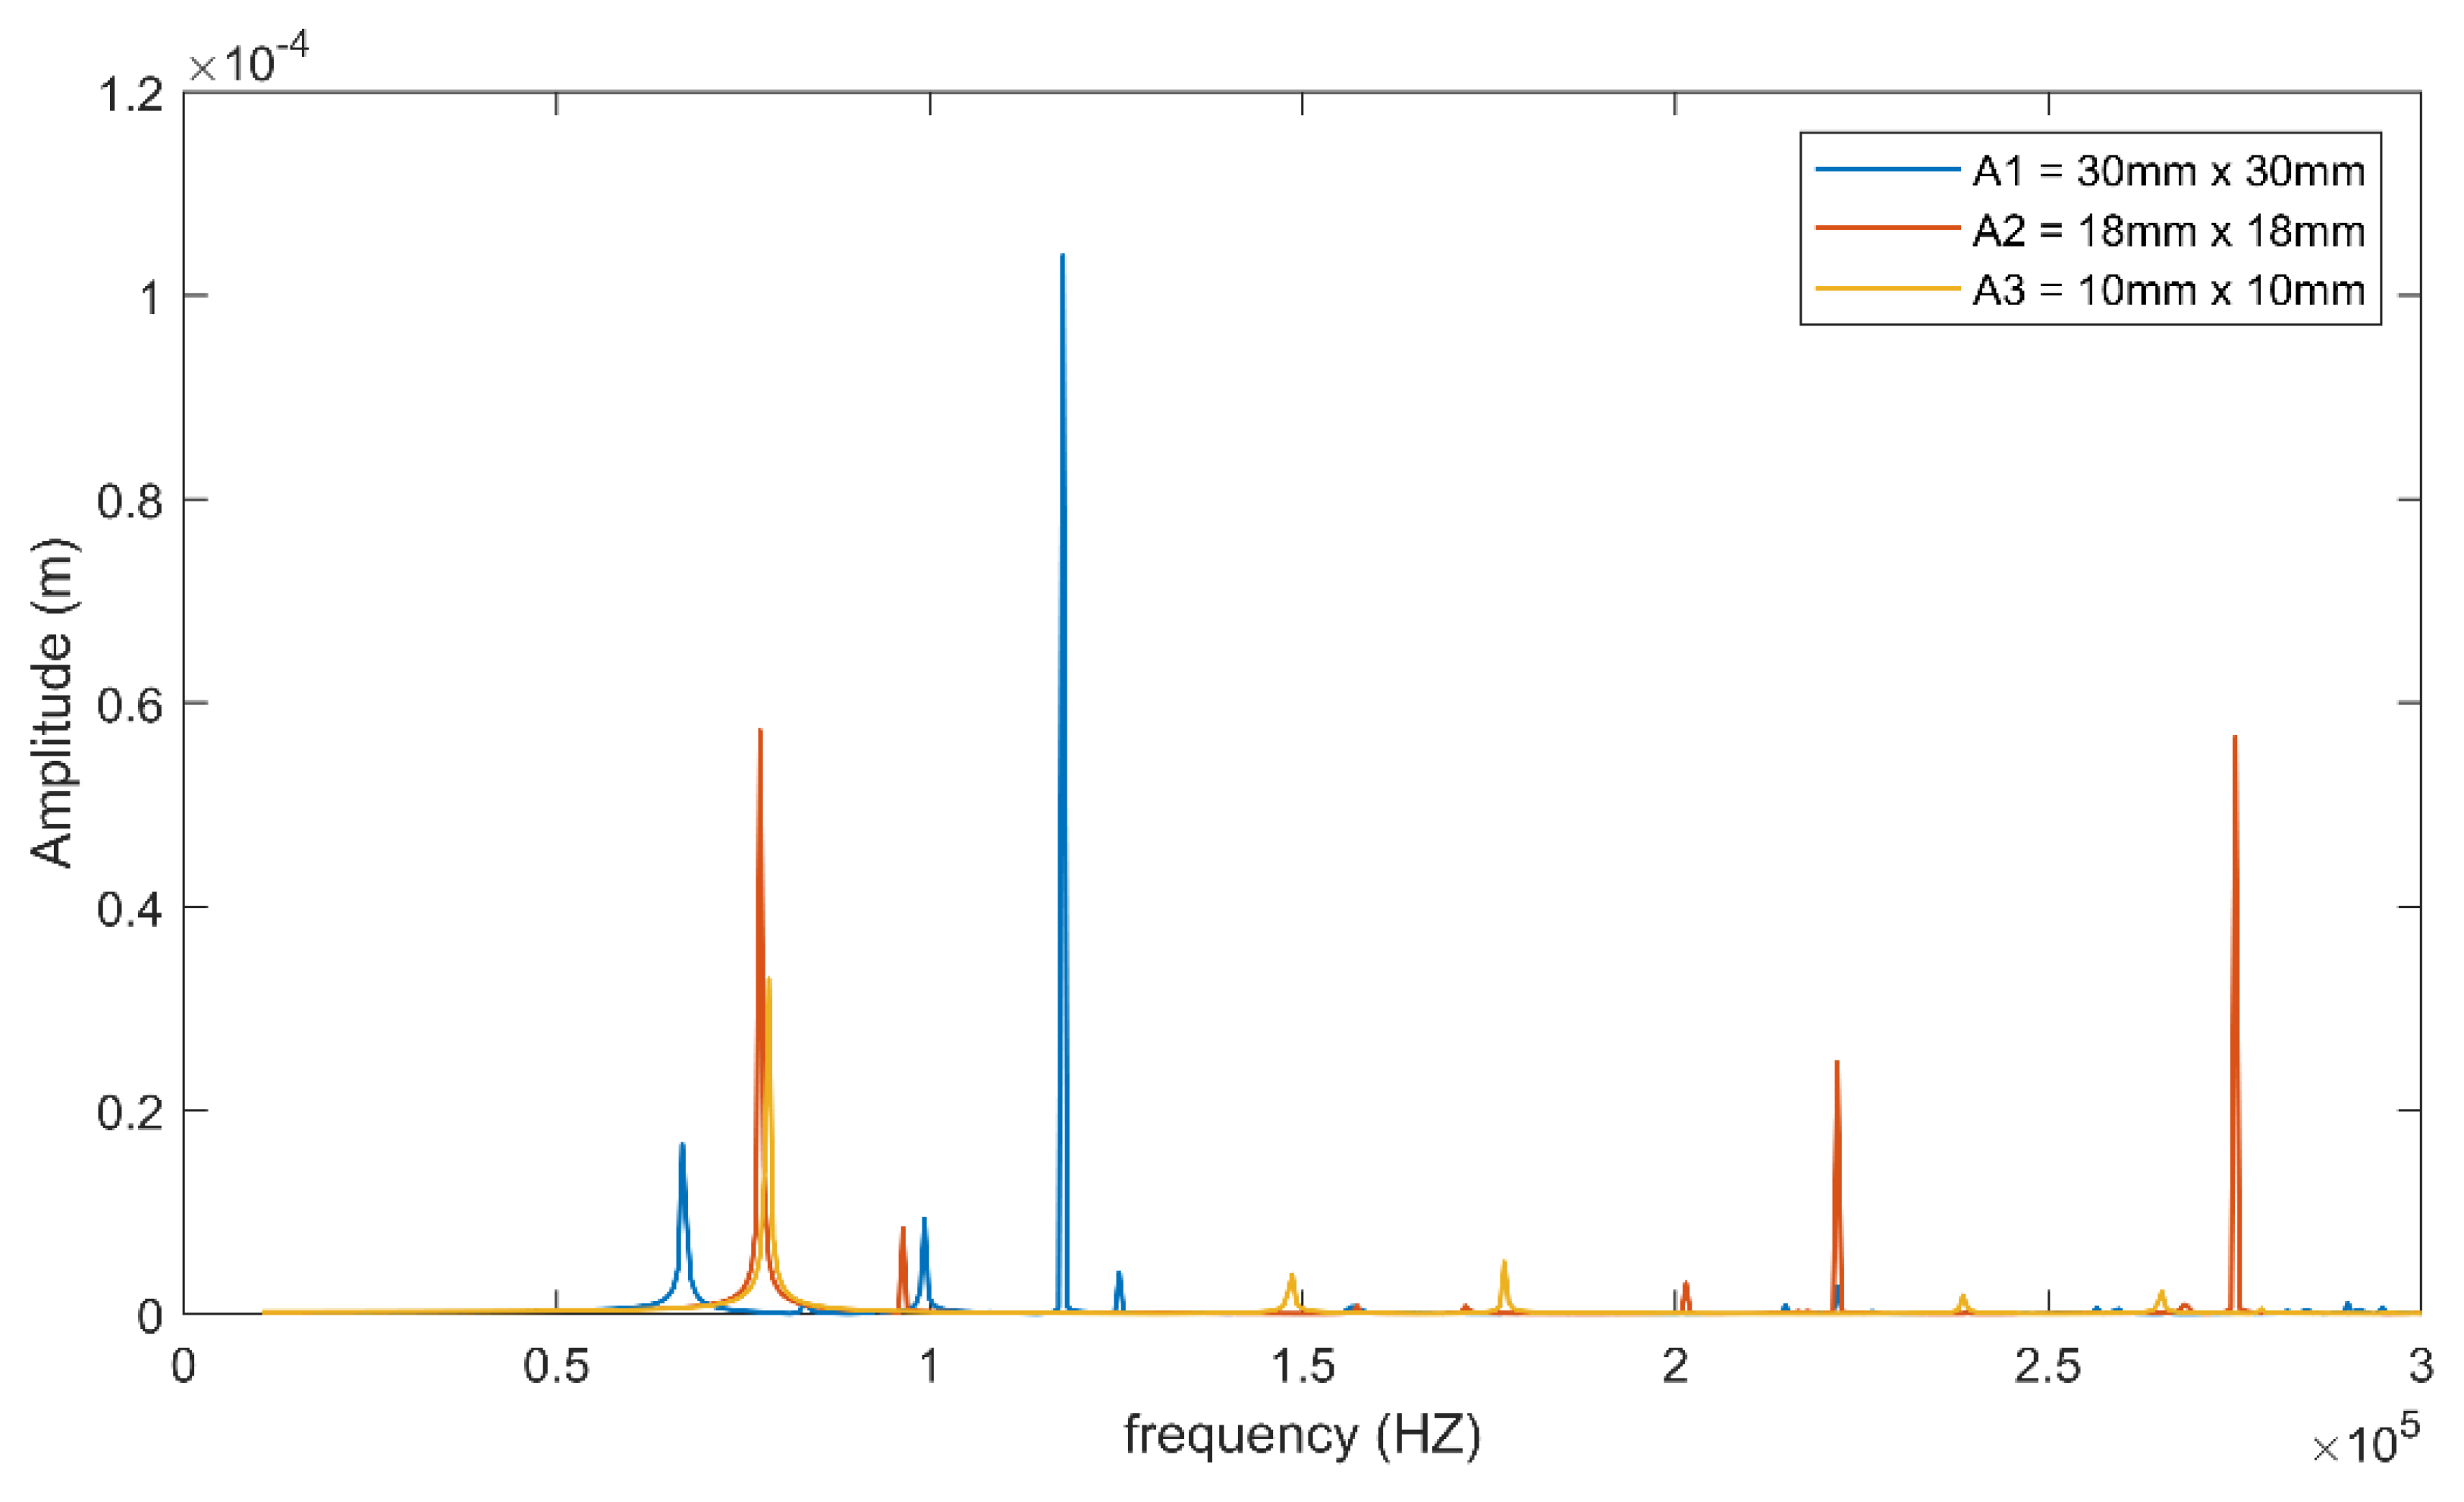
Figure 7 illustrates the influence of numerous cross-sectional areas on a constant plate thickness. It was observed that the area determined the elongation rather than the sensitivity. The smaller the area, the greater the displacement response with respect to the applied load. Because the applied load (voltage) was parallel to the thickness axis, the plate resonance frequency was essentially dependent on the thickness. The analytical solution of the plate’s impedance response over a large frequency range is shown in
Figure 8. The analytical solution verifies that the plate’s response was identical to the simulation result in
Figure 6. The resonant frequency of a plate is affected by its thickness. In [
19], the characteristics of a piezoelectric plate were determined and described using both a non-classical and a classical method. The conclusion of the basic dynamic equation solved and simulated in this study was largely consistent with the results of the non-classical approach.
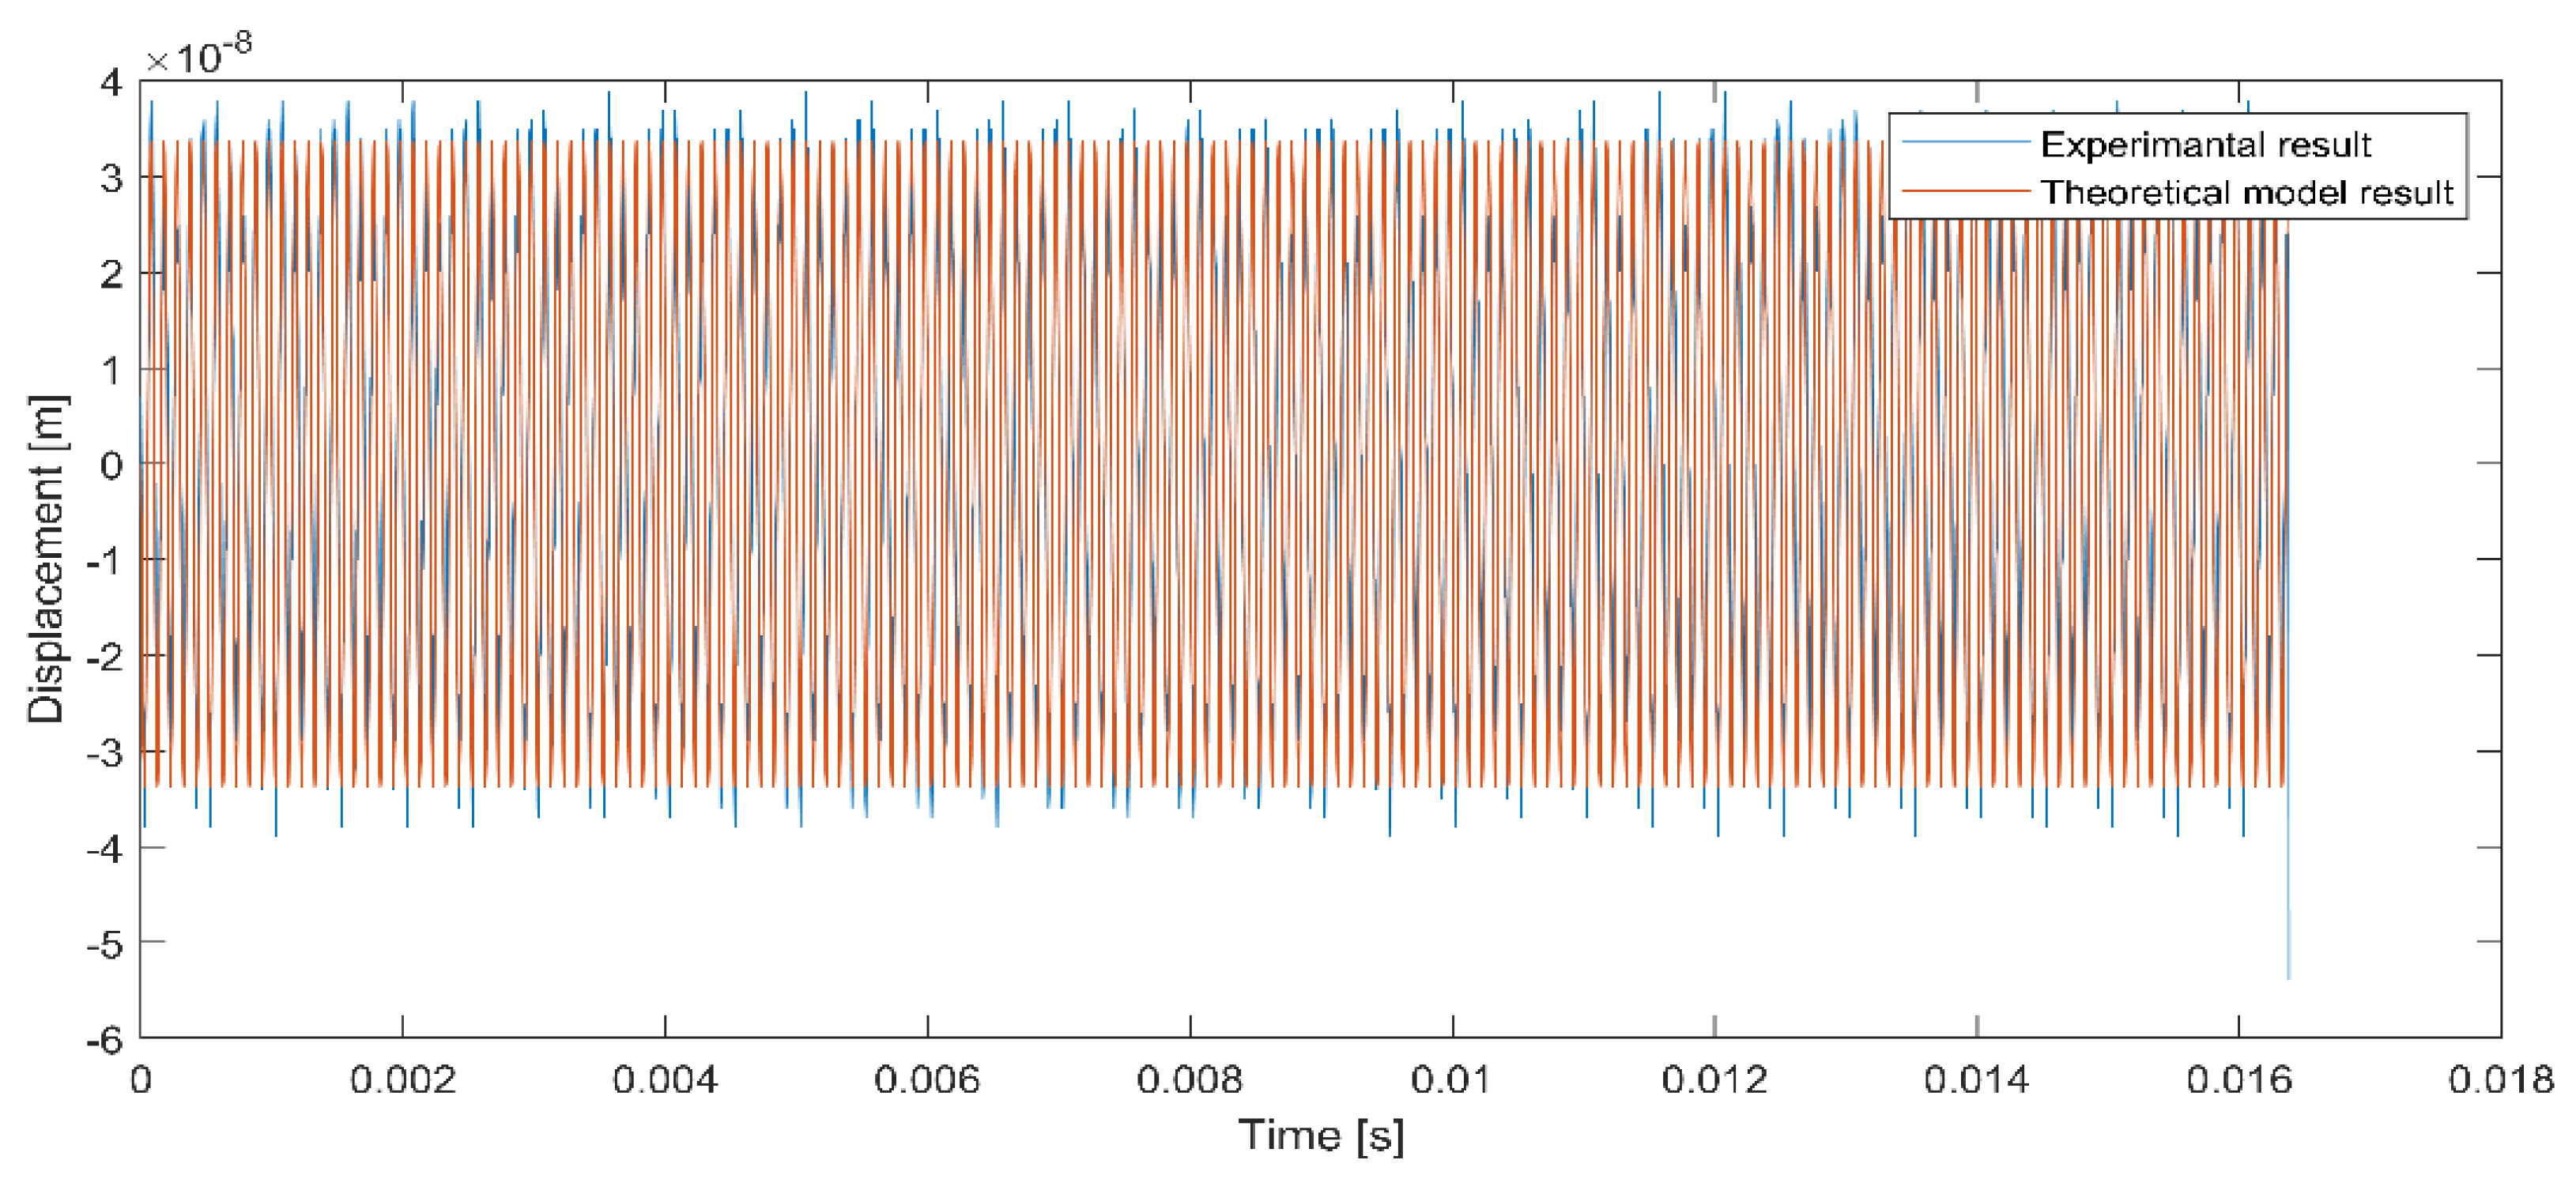
The model, which was operated at the same frequency spectrum, agreed with the experimental data with a margin of error of 7.14% as depicted in
Figure 9. The model operated at different frequency spectra, on the other hand, agreed with the experimental data, with a slightly larger percentage of inaccuracy. As a result, because the margin of error is tolerated, it is possible to characterize the model based on the mathematical modelling results.
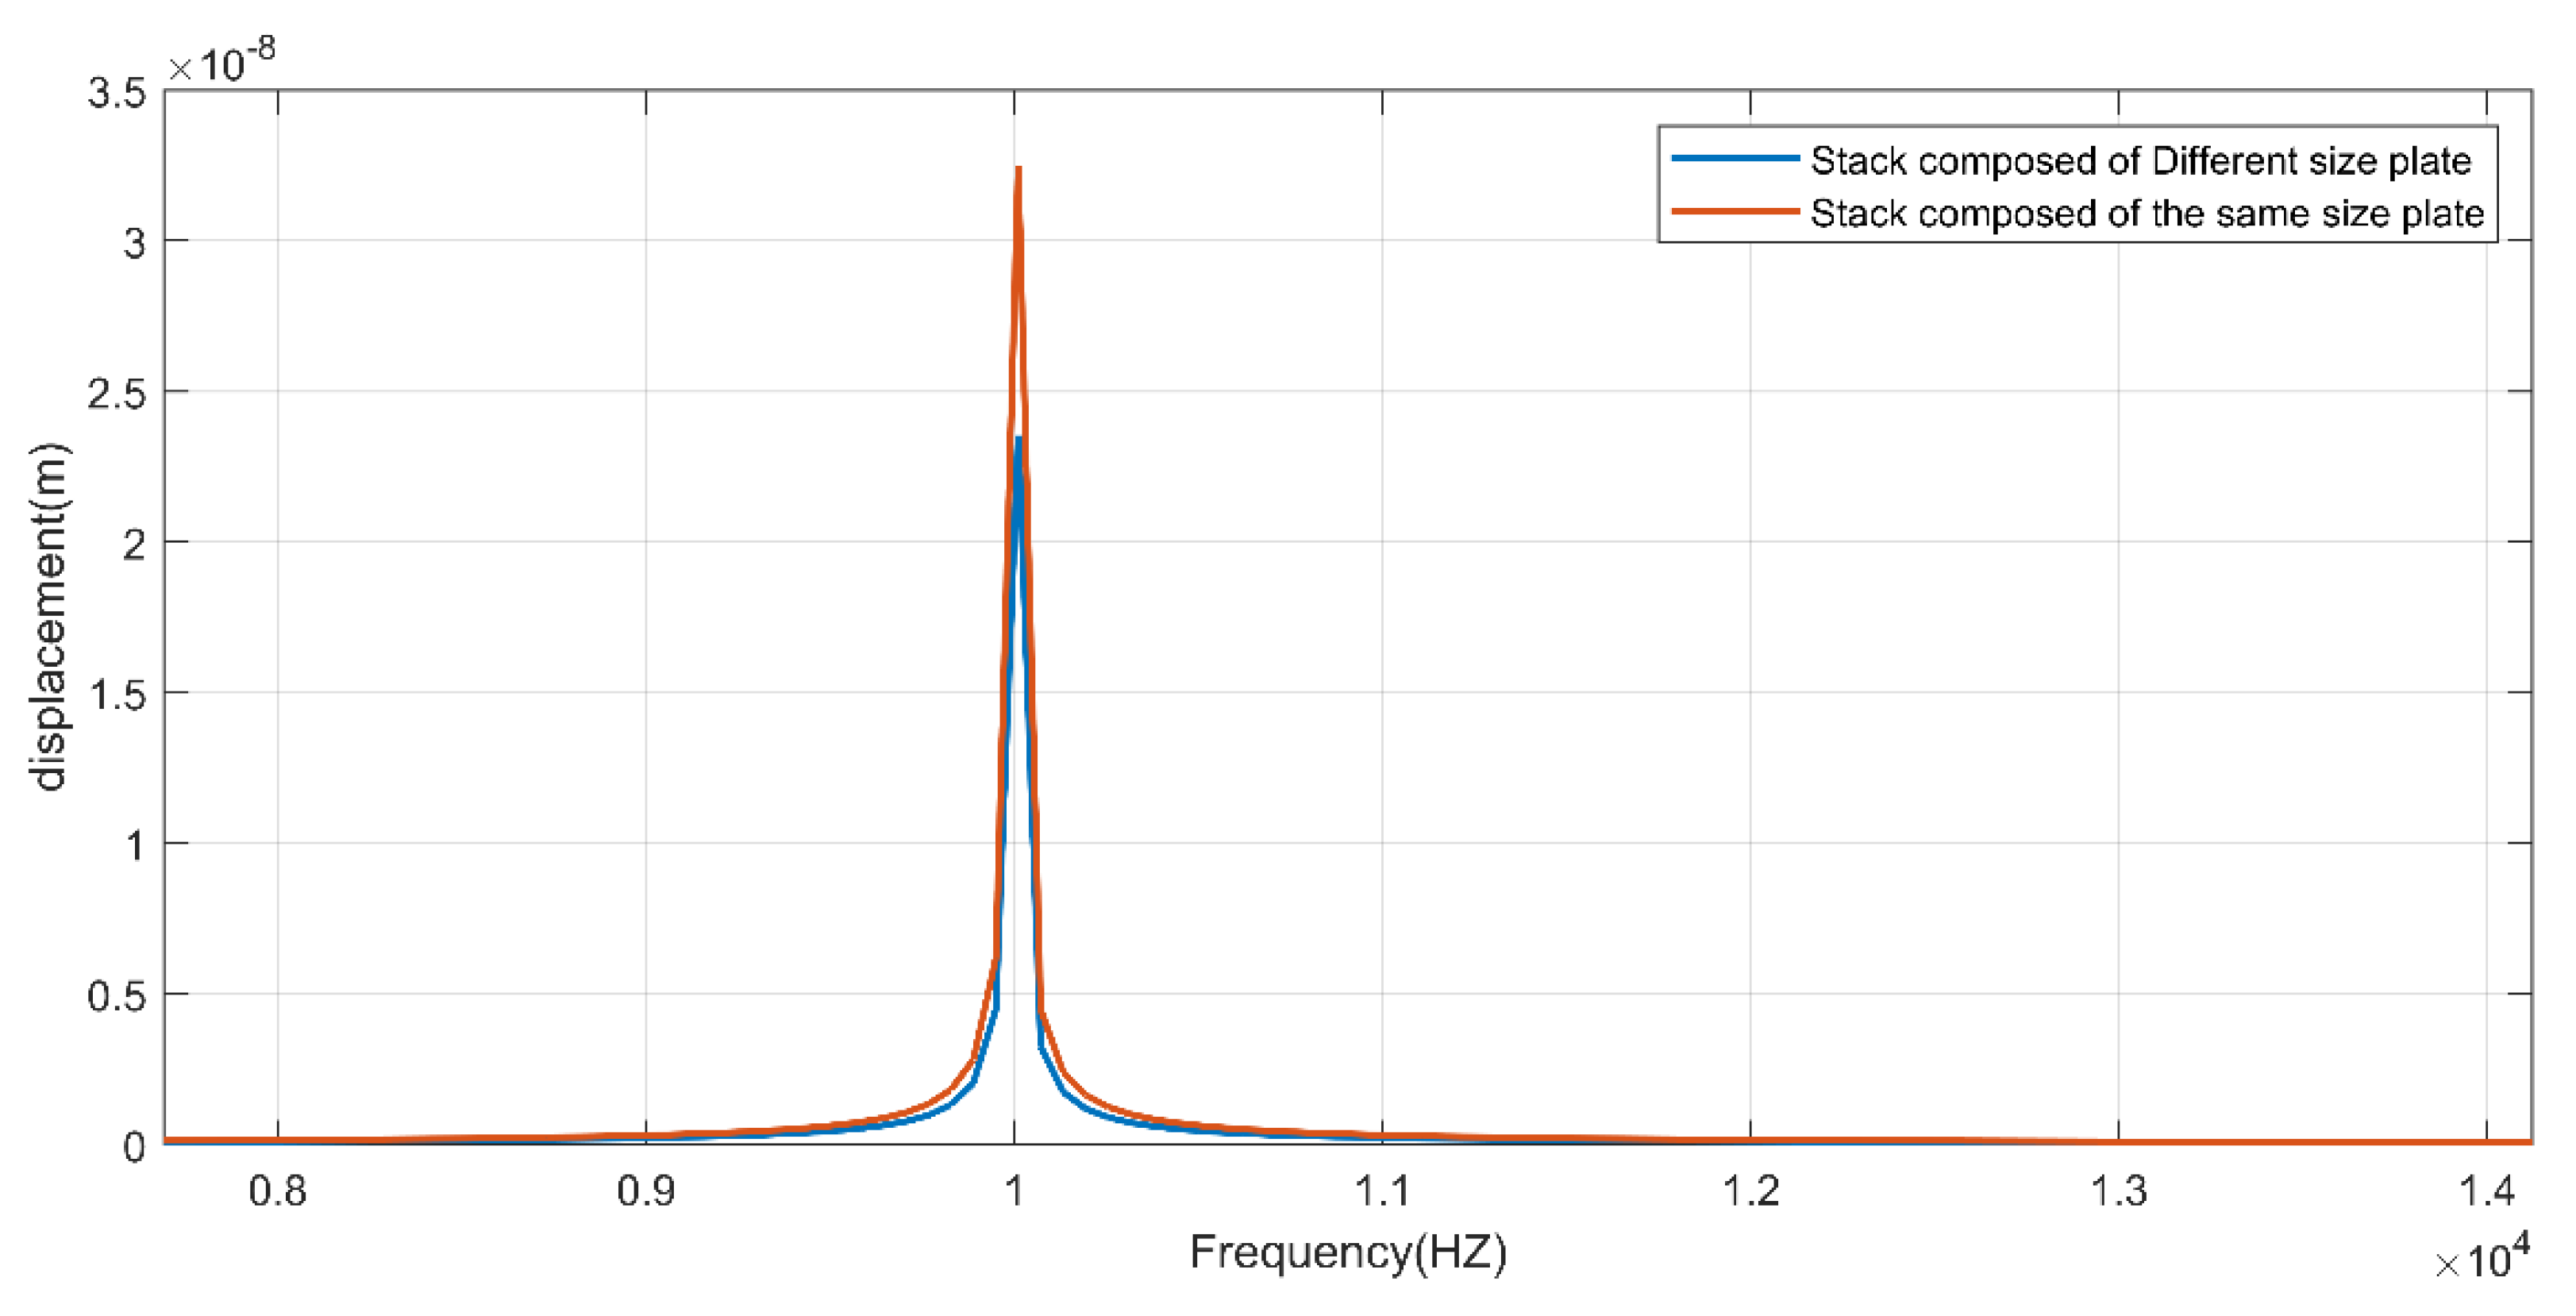
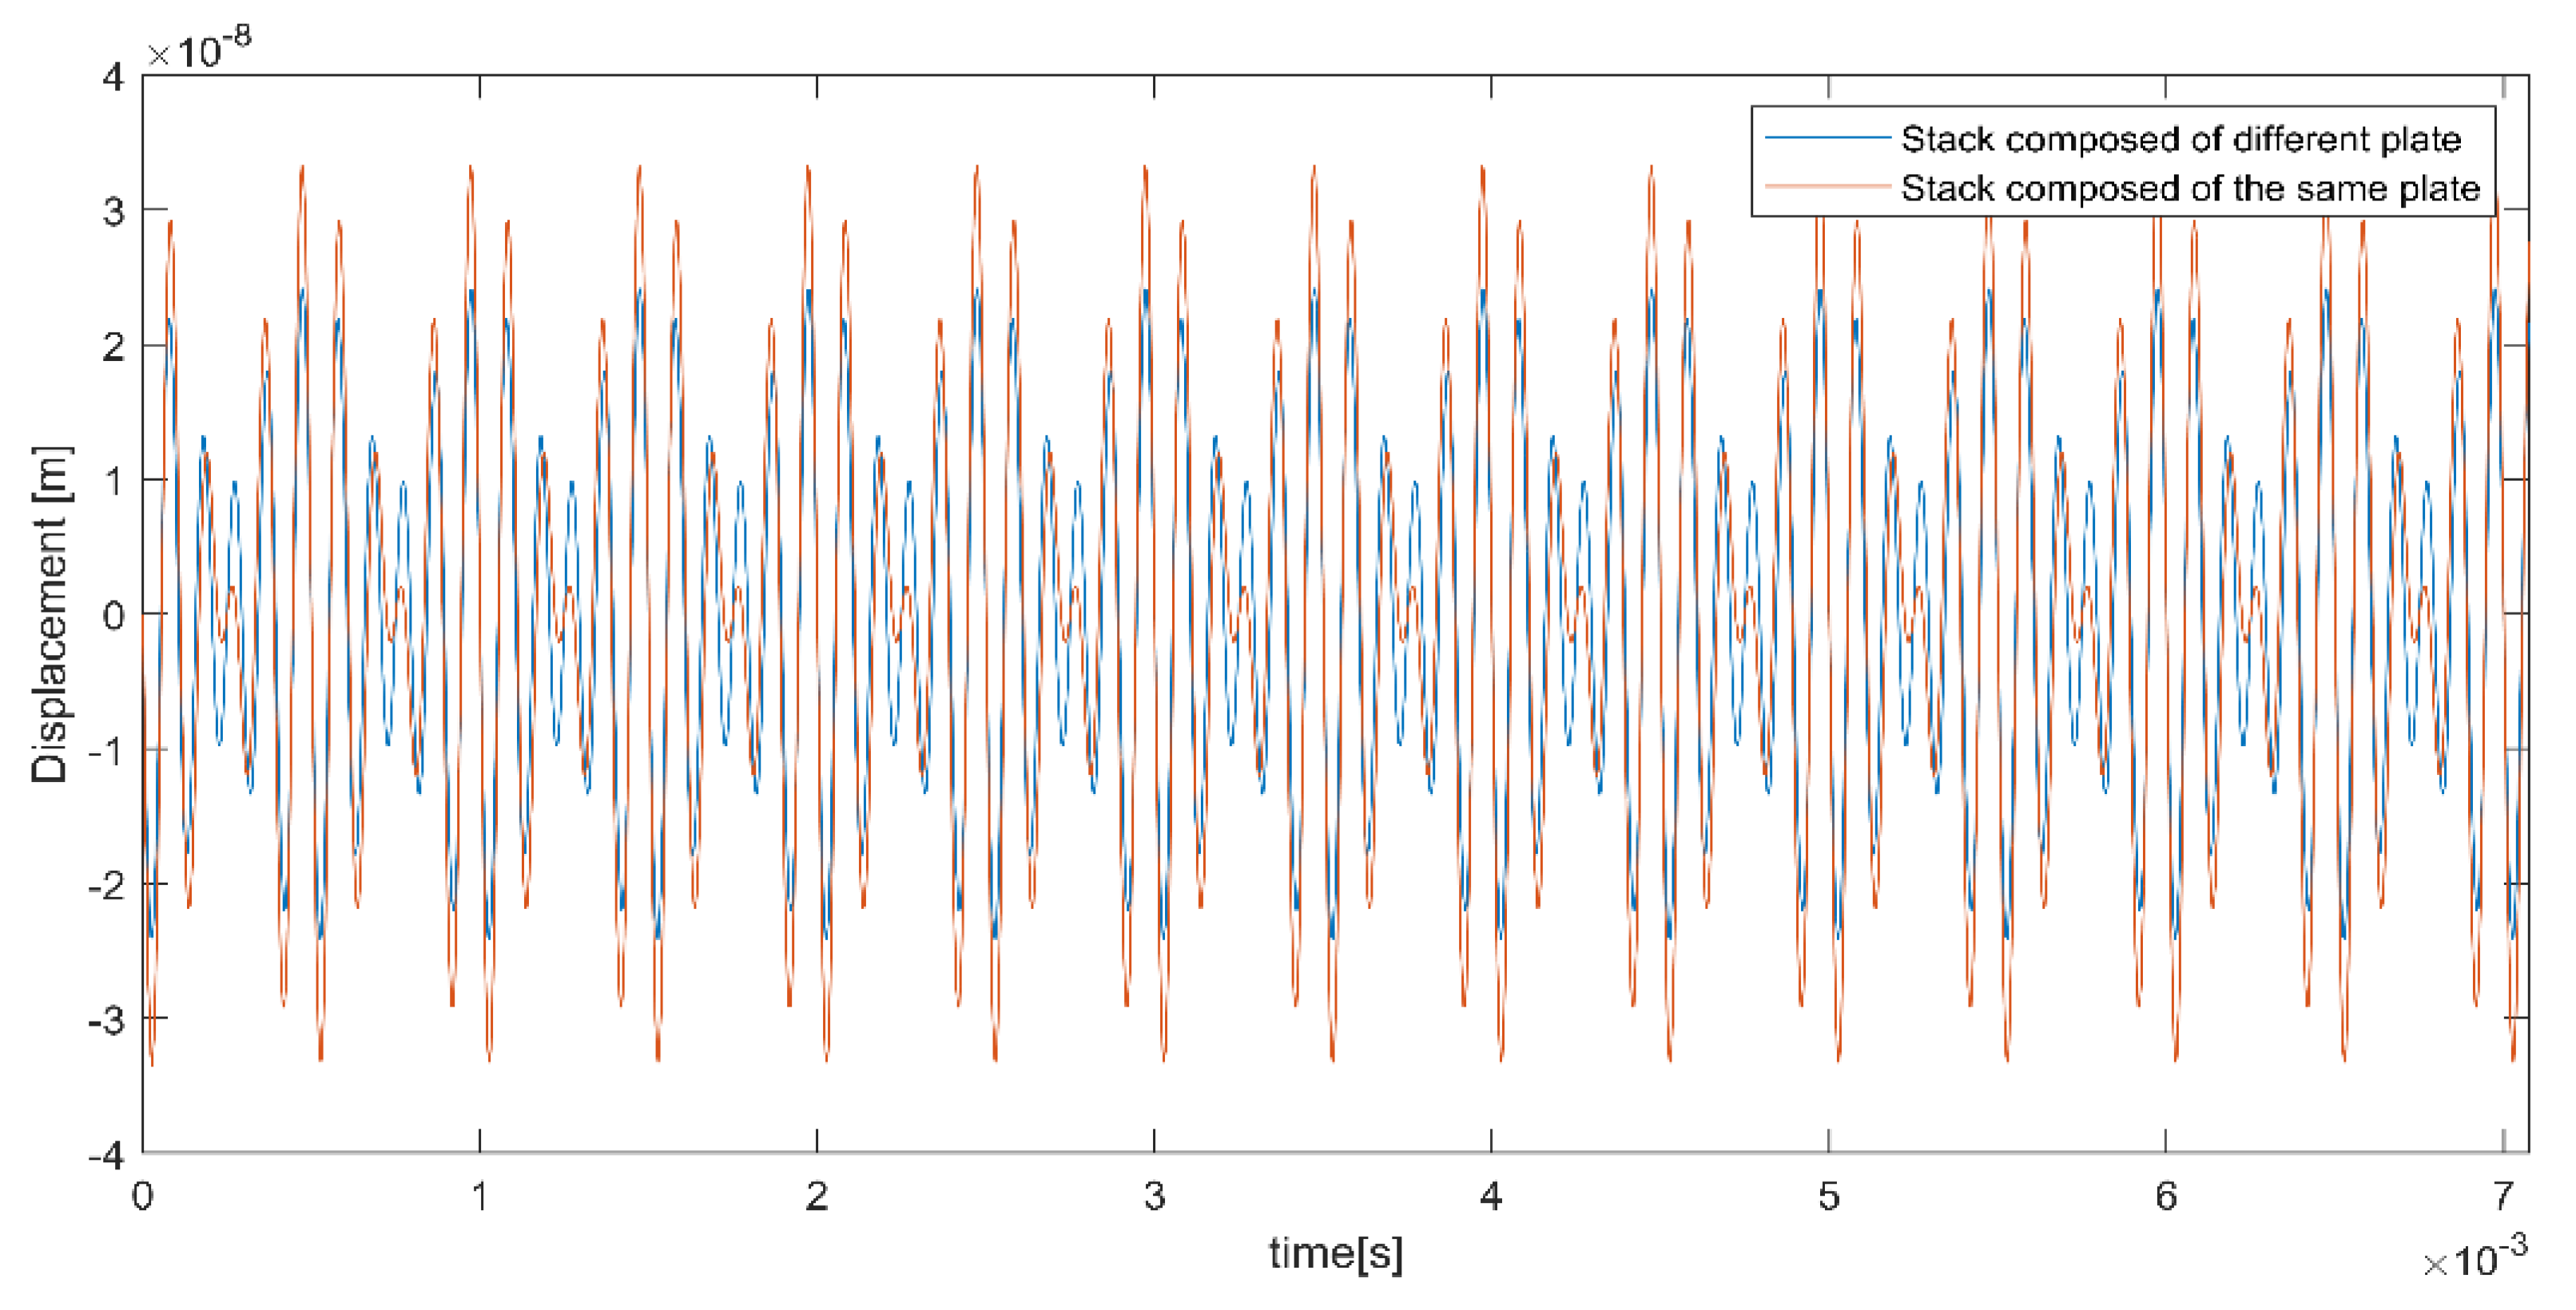
As the maximum displacement, the upper plate displacement of the piezoelectric stack was calibrated for the sinusoidal voltage inputs of each plate in the single stack. The maximum displacement from the same plate stack was 0.035 micrometer, while the maximum displacement from different plates stack was 0.025 micrometer, confirming that same-sized plates in piezoelectric stacks produce greater displacement than differently sized plates as shown in
Figure 10. This was due to the fact that the electrode area exposed to the electrical field in the same size plate was greater than in the different size plate.
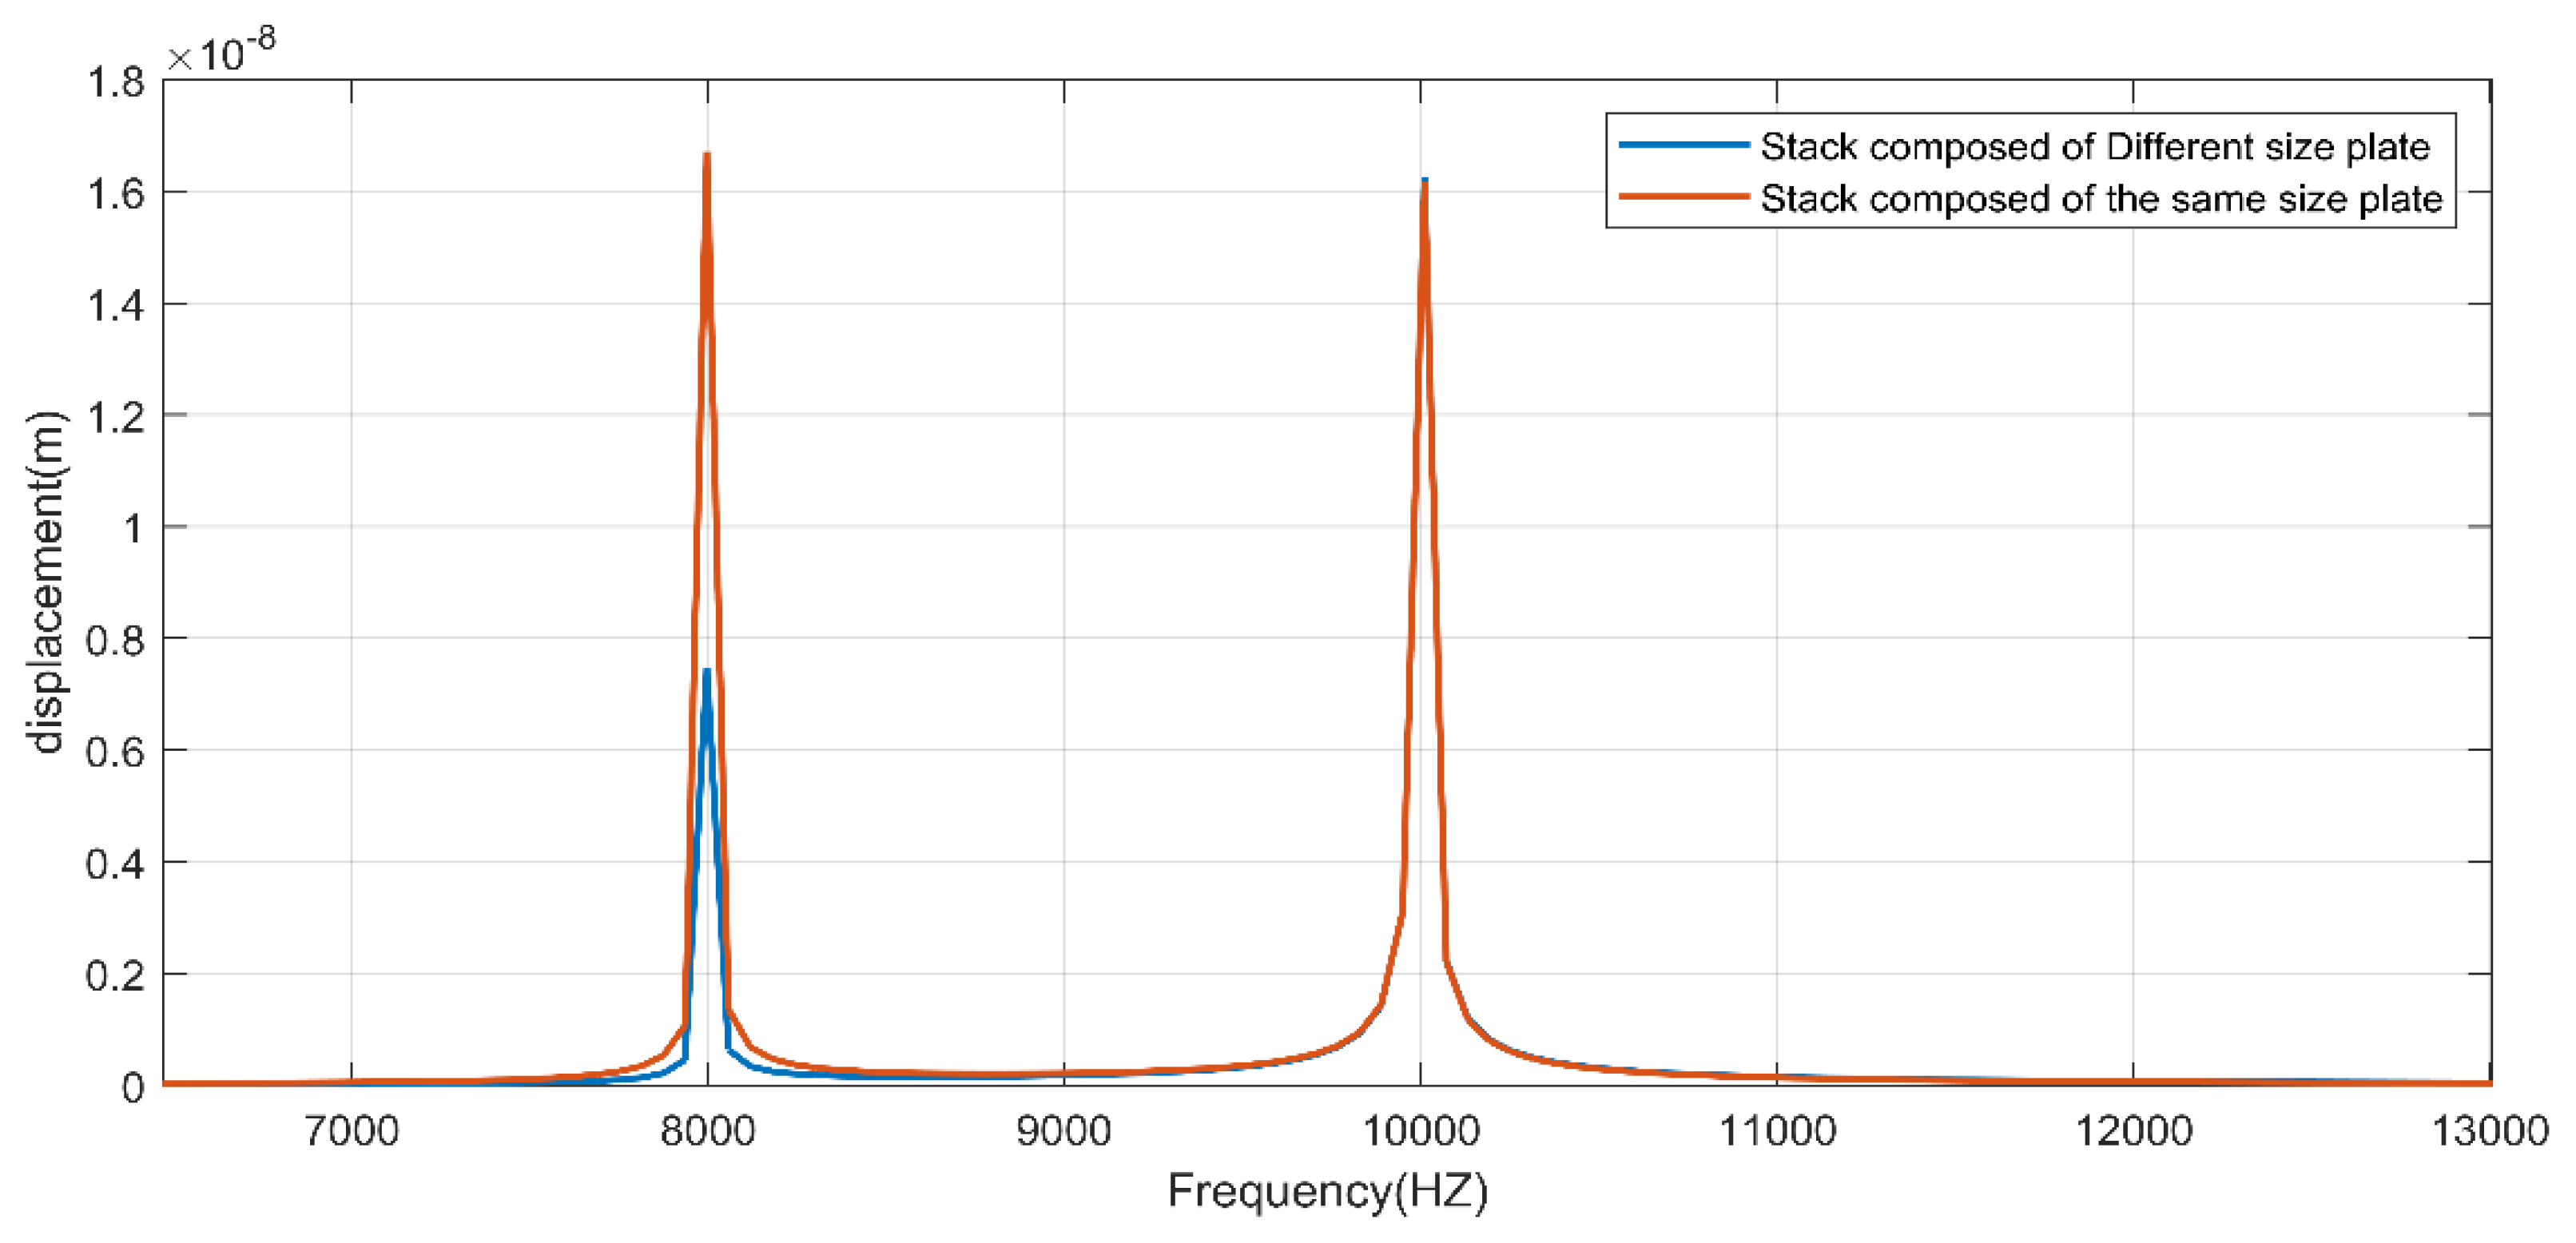
Figure 11 and
Figure 12 shows a frequency and time domain comparison of a stack made up of the same and different size plates actuated at 10kHz and 8kHz frequencies for each plate in the stack, confirming that the same size plate produces more displacement than a differently composed stack. However, at 10kHz, the displacement is about the same for both stacks. As a result, the displacement created by two plates of the same size was greater than the displacement produced by a plate of a different size when the size of the largest region of the different size plate was equal to the size of one of the same-sized plates.
Comparison of different- and the same-sized piezo plates.


