Article

Nonlinear Analyses of Porous Functionally Graded Sandwich Piezoelectric Nano-Energy Harvesters under Compressive Axial Loading

1
Jiangxi Key Laboratory of Micro Aeroengine, School of Aircraft Engineering, Nanchang Hangkong University, Nanchang 330063, China
2
School of Science, Harbin Institute of Technology, Harbin 150001, China
3
School of Engineering, Western Sydney University, Penrith, NSW 2751, Australia
*
Author to whom correspondence should be addressed.
Appl. Sci. 2021, 11(24), 11787; https://doi.org/10.3390/app112411787
Submission received: 8 November 2021 / Revised: 2 December 2021 / Accepted: 6 December 2021 / Published: 11 December 2021
(This article belongs to the Special Issue Nonlinear Vibrations)

Abstract

:
In this study, a sandwich piezoelectric nano-energy harvester model under compressive axial loading with a core layer fabricated of functionally graded (FG) porous material is presented based on the nonlocal strain gradient theory (NSGT). The von Karman type geometric nonlinearity and the axial loading were considered. The electromechanical governing equations were obtained using Hamilton’s principle. The nonlinear vibration frequencies, root mean square (RMS) voltage output and static buckling were obtained using the Galerkin method. The effects of different types of porous distribution, porosity coefficients, length scale parameters, nonlocal parameters, flexoelectricity, excitation frequencies, lumped mass and axial loads on the natural frequency and voltage output of nanobeams were investigated. Results show that the porous distributions, porosity coefficient of porous materials, the excitation frequencies and the axial load have a large effect on the natural frequency and voltage output of the sandwiched piezoelectric nanobeams. When the NSGT is considered, the critical buckling load depends on the values of the nonlocal parameters and strain gradient constants. In addition, the electromechanical conversion efficiency of the post-buckling process is significantly higher than that of the pre-buckling process. The flexoelectric effect can significantly increase the RMS voltage output of the energy harvester.

1. Introduction

With the continuous development of advanced manufacturing technology, people have made a variety of electronic devices such as telephone watches, wireless headphones, and microelectronic systems. At present, most electronic devices need external batteries to provide power for normal operation. However, the energy supply cycle is limited and the battery needs to be replaced regularly. The extensive use and replacement of batteries have brought a series of problems such as environmental pollution. To find a way to overcome the difficulty, researchers have tried to harvest energy from the surrounding environment to replace the demand for batteries. For example, converting energy such as electromagnetic [1], piezoelectric [2], and electrostatic [3] into electrical energy. Piezoelectric energy harvesters are widely used because of their high energy density, no magnetic interference, and easy processing, miniaturization, and integration in structure. At present, many researchers have studied piezoelectric energy harvesters. For instance, Erturk and Inman [4,5] conducted theoretical and experimental studies on the electromechanical responses of cantilevered unimorph and bimorph piezoelectric energy harvesters based on the Euler–Bernoulli beam theory. An exact analytical solution for a cantilevered piezoelectric energy harvester was proposed, and the modal electromechanical coupling and the dependence of the electrical output on the locations of the electrode were discussed. Wang and Wang [6] developed an analytical model of a nanoscale unimorph piezoelectric energy harvester containing the flexoelectric effect. An analytical model of a piezoelectric cantilevered energy harvester by through-width delamination was proposed by Zeng et al. [7]. Stamatellou et al. [8] experimentally investigated the performance of a film-type piezoelectric energy harvester under simultaneous pneumatic and base excitation. Wang and Wang [9] investigated the energy harvesting performance of a piezoelectric circular nanomembrane under human blood pressure with surface effects.
In recent decades, a lot of research has been performed on piezoelectric energy harvesters. In most studies, the proposed piezoelectric energy harvesters are linear, and work only in a limited excitation frequency spectrum. In order to obtain a wider operating frequency band for the piezoelectric energy harvester, researchers try to consider the nonlinearity in the study of piezoelectric energy harvesters. At present, the research on the nonlinearity of piezoelectric energy harvesters has made great progress. For instance, Costa et al. [10] studied the nonlinear dynamical parameters of the bistable vibration of a piezoelectric energy harvester. Farokhi et al. [11] studied the nonlinear electromechanical behavior of a constrained bimorph piezoelectric energy harvester by using a coupled multi-modal fully nonlinear model. It is not difficult to find that considering the nonlinearity cannot only improve the calculation accuracy but also improve the harvesting energy efficiency of energy harvester.
In addition, researchers also found that the broadband behavior of piezoelectric energy harvester can be achieved by applying axial loads to a fixed beam. For example, Masna and Daqaq [12] established an electromechanical model of a clammed single-deformation piezoelectric energy harvester subjected to transverse excitation and static axial load, and made a comprehensive discussion of the energy harvesting of the loaded beam using an axial load. Their results show that the axial load can achieve tunable characteristics and power enhancement. Chen and Yan [13] proposed a nonlinear electromechanical model of an energy harvester based on an axial pre-loaded piezoelectric beam, and combined the flexoelectric effect, which can be operated in pre-buckling (monostable) and post-buckling (bistable) configurations. Varelis and Saravanos [14] proposed a theoretical framework for analyzing the response of piezoelectric actuators and sensor composite laminates pre- and post-buckling. Based on the Euler–Bernoulli beam theory, Zhang et al. [15] investigated the free transverse vibration and buckling characteristics of a double beam system under compressive axial loads. The free buckling and vibration of a set of parallel Timoshenko beams under the axial load was studied by Foroozandeh et al. [16]. In this study, a nonlinear and axial load are considered while analyzing the vibration and bending properties of the sandwich piezoelectric nanobeam.
Piezoelectric materials have received increasing attention because of their excellent electromechanical coupling properties, and are widely used in the field of energy harvesting. When there is mechanical energy in the environment where piezoelectric materials are located, such as wind energy, noise, mechanical vibration, these mechanical energies can cause the deformation of piezoelectric materials. Because of the piezoelectric effect, the voltage potential is generated on the surface of piezoelectric nanomaterials, so the transformation of mechanical energy to electrical energy is realized. It is worth noting that at micro- and nanoscale, the electromechanical properties of piezoelectric nanomaterials and nanostructures are significantly different from those of macroscopic piezoelectric materials. It provides guidance for the development of a piezoelectric micro energy harvester.
Piezoelectric materials show a significant flexoelectric effect when the size is at nanoscale. The flexoelectricity is the electromechanical coupling effect present in a dielectric, which is similar to piezoelectricity. It not only exhibits the polarization response and strain gradient, but also exhibits the electromechanical coupling effect [17]. The flexoelectricity is the basic property of dielectric materials, which not only exists in piezoelectric materials, but also almost exists in all dielectrics. It is noteworthy that the electricity caused by the flexoelectric effect is much larger compared with the piezoelectric effect of nanomaterials. Therefore, the flexoelectric effect is usually considered when studying nanostructures [18,19,20,21,22]. Zeng et al. [18] studied the vibration of piezoelectric sandwich nanobeams based on the theory of nonlocal strain gradients and discussed the flexoelectric effect in detail. Fan et al. [23] modeled the beam as a laminated beam and investigated the effect of flexoelectric layer stiffness on the dynamic response of the structure. Moura et al. [24] investigated the combined piezoelectric and flexoelectric effects in the resonant dynamics of nanocantilever beams. Since the effect of pliability generated in piezoelectric nanostructures cannot be ignored, this study takes into account the flexoelectric effect while analyzing the vibration of functionally graded sandwich piezoelectric nanobeams.
The sandwich structure has excellent properties such as high stiffness and light weight, so it is widely used in engineering fields, such as biomedicine, architecture, automotive and aerospace. The sandwich structure is a composite structure formed by connecting two thin surface layers and one core layer. The porous material is a kind of lightweight material that widely exists in nature, such as metal foams. The porous material has the advantages of high strength and low density, and is often used as energy absorption, noise reduction, flame retardant, heat insulation [25,26,27,28], and is therefore widely used in the automotive industry, aerospace, and other fields. The composite structure with porous materials as the core layer of the sandwich structure is called the sandwich porous structure. Generally, the sandwich porous structure cannot only ensure enough stiffness, but also reduce the quality of the whole structure. In recent years, various theoretical and experimental studies have been conducted on the static and dynamic properties of sandwich porous beams and plates to meet various needs [29,30,31,32]. The functionally graded (FG) porous materials are a hot research topic for new advanced composites [33,34,35]. The internal pores of FG porous materials show gradient distribution in a certain direction. FG porous materials can be varied by local density to obtain the desired natural frequency range of the structure [25]. Previous researchers have focused on studying the dynamic analysis, static bending, and buckling of FG porous plate and beam structures. For example, Zine et al. [36] investigated the bending response of FG porous plates based on the cubic shear deformation theory. Based on two-variable shear deformation and modified coupled stress theory, Sadoughifar et al. [37] investigated the nonlinear bending of FG porous thick circular/annular nano-plates using a generalized differential quadrature method (GDQM). Based on the Timoshenko beam theory, Chen et al. [38] analyzed the static buckling and elastic buckling of shear deformable FG porous beams. In the above study, it can be found that porous beams or porous plates exhibit better mechanical properties than ordinary beams or plates of the same mass.
The structure size [39] exhibits non-negligible scale effects when it is at the micro- and nanoscale. Although researchers have performed a great deal of work using classical continuum mechanics, their application on the nanoscale is questionable. Because in classical continuum mechanics, small-scale effects such as surface effects, lattice spacing, van der Waals forces, chemical bonding, and electric forces are neglected. However, both experimental and atomic simulation results show that at the nanoscale, these small-scale effects cannot be ignored [40]. This is because at small sizes, the lattice spacing between atoms becomes important and the interior of the material is no longer homogenized into a continuum [41]. Therefore, for the scale effects of micro- and nanoscale structures, non-classical continuum theories have been proposed by previous authors to evaluate the mechanical properties of micro- and nanostructures, such as surface elasticity theory [42,43,44], strain gradient elasticity theory [45,46,47,48], and nonlocal elasticity theory [49,50]. In the last decade, numerous researchers [51,52,53] have studied a large number of size dependencies on micro- and nanostructures based on the nonlocal elasticity theory and strain-gradient elasticity theory. These studies have shown that nonlocal theory can only capture the stiffness-softening effect and the strain gradient theory can only capture the stiffness-hardening effect. Recently, researchers have combined the nonlocal elasticity theory and the strain gradient elasticity theory together to propose a new theory, namely, the nonlocal strain gradient theory (NSGT) [54]. The NSGT combines the advantages of both theories so that not only the strain-gradient stress field but also the non-local stress field can be investigated. In addition, the NSGT is able to describe both the stiffness-hardening and stiffness-softening effects. Based on the NSGT, a large number of researchers have investigated the size-dependent bending, buckling, wave propagation, and vibration of FG micro- and nanoscale structures [18,55,56,57]. For example, Zeng et al. [18] investigated the free vibration of piezoelectric sandwich nanobeams with flexoelectricity based on the NSGT. Sahmani et al. [57] analyzed the size-dependent nonlinear axial postbuckling properties of functionally graded porous micro/nanoplates enhanced by graphene platelets based on the NSGT. Sharifi et al. [58] analyzed the functional gradient piezoelectric nanoplate vibration using the NSGT. Yademellat et al. [19] performed a nonlinear electromechanical analysis of micro/nanobeams based on the NSGT taking into account the flexoelectric and piezoelectric effects.
Generally, the objects attached to the beam and plate belong to the subsystem of the whole system, and the subsystem is usually simplified as a lumped (or concentrated) mass in the calculation. In engineering practice, researchers often encounter vibration problems occurring in beam-like structures with lumped masses attached to them, such as automobiles, spacecraft, etc., [59,60,61]. From previous studies, it is found that the rotational inertia of the lumped mass has a significant effect on the dynamic characteristics of mass loaded beams, especially for higher order vibration modes [62,63,64]. In addition, ignoring the effect of concentrated mass may overestimate the natural frequency and may lead to incorrect system response. Therefore, it is important to consider the effect of the lumped mass. Considering the lumped mass not only improves the calculation accuracy of the system frequency, but also increases the efficiency of the captured energy of the piezoelectric energy harvester [65]. For example, Wang [59] performed a free vibration analysis on a lumped mass uniform beam containing translational and rotational inertia. Sun et al. [66] studied the mechanism of the effect of lumped mass on the flutter characteristics of structures, and the optimal ranges for the weight and location of the lumped mass are provided.
Therefore, in this work, we propose a piezoelectric and flexoelectric energy harvester based on the NSGT for FG porous material sandwich nanobeams under axial compressive loading. According to the amplitude of axial load, the energy harvester can work in prebuckling state or postbuckling state. The work is organized as follows. In Section 2, the basic equations are derived. An energy harvester model sandwich piezoelectric beam composed of FG porous material was developed, in which the FG layer is considered with three porosities. The von Karman type nonlinear vibration behavior was considered. Then the nonlinear electromechanical coupling control equation was obtained using the Hamiltonian principle. In Section 3, the static buckling, natural frequency, and output voltage are solved using the Galerkin method. In Section 4, the model is validated and the effects of different types of distribution, porosity coefficients, length scale parameters, nonlocal parameters, excitation frequency, and axial loads on the vibration frequency and output voltage of the nanobeam are discussed. In Section 5, the main results of this paper are summarized, and some conclusions are drawn.

2. Mathematical Formulation

Shown in Figure 1 is the sketch of a piezoelectric energy harvester with a simply supported nanobeam settled on a base. The beam is composed of three layers, i.e., a core layer manufactured of functionally graded porous materials, and two piezoelectric layers attached perfectly on the core layer and no slip between layers. The adhesive thickness of the bonding interface is neglected. The elastic constant of the piezoelectric layer and core layer are denoted as C 11 p  and C 11 c ( z ) , respectively. The mass density of the piezoelectric layer and core layer are denoted as ρ p and ρ c , respectively. The height of two piezoelectric layers is h p , and of the core layer is h c . The length and the width of three layers are the same, which is denoted as L , b , respectively. The height of the entire beam is h t = 2 h p + h c . There is a lumped mass m s attached on the midspan of the nanobeam to improve the energy capture efficiency of the energy harvester. A compressive load is applied axially on the nanobeam. The base is applied a displacement excitation w b ( t ) = W 0 cos ( ω t ) . The two piezoelectric layers are connected in series in circuit, and connected to an external resistor R .
The core layer is manufactured of functionally graded porous materials. In this study, three typical porosity distributions are considered [38,67,68]. The elastic properties and mass density are described by Equation (1) for distribution 1, Equation (2) for distribution 2, and Equation (3) for distribution 3.
{ C 11 c ( z ) = C max ( 1 χ 0 α ) ρ c ( z ) = ρ max 1 χ 0 α
{ C 11 c ( z ) = C max ( 1 χ 0 cos π z h c ) ρ c ( z ) = ρ max ( 1 χ m cos π z h c )
{ C 11 c ( z ) = C max [ 1 χ 0 cos ( π z 2 h c + π 4 ) ] ρ c ( z ) = ρ max [ 1 χ m cos ( π z 2 h c + π 4 ) ]
where C max ( ρ max ) and C min ( ρ min ) are the maximum value and minimum value of elastic constant (mass density) for porosity distributions, respectively. χ 0 and χ m represent the porosity coefficients which are expressed as χ 0 = 1 C min / C max and χ m = 1 ρ min / ρ max , respectively. The relationship between χ 0 and χ m is expressed as χ m = 1 1 χ 0 for the open-cell model [68]. A diagrammatic sketch of those three distributions is shown in Figure 2. For the convenience of comparing discussion, the total mass of the entire beam with those three types of distributions is assumed to be equal, which provides α = 1 χ 0 1 χ 0 ( 2 π 1 χ 0 2 π + 1 ) 2 .
The approximate process of the governing equations and boundary conditions of the model obtained is shown in Figure 3.
Based on the Euler–Bernoulli beam assumption, the displacement field of the beam are:
u 0 ( x , z , t ) = u ( x , t ) z w ( x , t ) x
w 0 ( x , z , t ) = w ( x , t ) + w b ( t )
Considering the von Karman geometric nonlinearity, the strain fields can be expressed as:
ε x x = u x + 1 2 ( w x ) 2 z 2 w x 2
It is assumed that the electric field only exists in the thickness direction which is expressed as E Z = V / h p for both piezoelectric layers. Considering the NSGT with flexoelectric effect, the constitutive equations for the nanobeam are written as [18]:
[ 1 ( e 0 a ) 2 2 ] t x x = C 11 ( 1 l 2 2 ) ε x x e 311 E z
[ 1 ( e 0 a ) 2 2 ] σ x x z = μ 3113 E z
[ 1 ( e 0 a ) 2 2 ] D z = a 33 E z + e 311 ε x x + μ 3113 ε x x , z
where e 0 a and l are the nonlocal parameter and the strain gradient constant, respectively. e 311 , μ 3113 and a 33 are the piezoelectric coefficient, the electric field-strain gradient coupling coefficient and the dielectric constant, respectively. D z is the electric displacement.
The variation in the electric entropy can be calculated as [18]:
V H d Ω = V ( t x x δ ε x x + t x z δ ε x z D z δ E z + σ x x z δ ε x x , z ) d Ω
By substituting Equation (6) into Equation (10), and performing the calculation, one obtains:
δ V H d Ω = V ( t x x δ ε x x D z δ E z + σ x x z δ ε x x , z ) d Ω = 0 L ( N x x δ u x + N x x w x δ w x M x x δ 2 w x 2 G x x δ 2 w x 2 + B x x h p δ V ) d x = 0 L { N x x , x δ u + B x x h p δ V [ x ( N x x w x ) + M x x , x x + G x x , x x ] δ w } d x
where
N x x = b h t / 2 h t / 2 t x x d z ,   M x x = b h t / 2 h t / 2 z t x x d z , G x x = b h t / 2 h t / 2 σ x x z d z ,   B x x = b h t / 2 h t / 2 D z d z
By combining Equation (12) with Equations (7)–(9), one has:
[ 1 ( e 0 a ) 2 2 ] N x x = b A 11 ( 1 l 2 2 ) [ u x + 1 2 ( w x ) 2 ] + 2 b e 311 V [ 1 ( e 0 a ) 2 2 ] M x x = b B 11 ( 1 l 2 2 ) 2 w x 2 [ 1 ( e 0 a ) 2 2 ] G x x = 2 b μ 3113 V [ 1 ( e 0 a ) 2 2 ] B x x = 2 b a 33 V + 2 b h p { e 311 [ u x + 1 2 ( w x ) 2 ] μ 3113 2 w x 2 }
where A 11 = h t / 2 h t / 2 C 11 d z , B 11 = h t / 2 h t / 2 z 2 C 11 d z .
Neglecting the rotational inertia of the beam, the total kinetic energy of the beam is written as:
T = 1 2 V ρ ( z ) [ u ˙ 2 + ( w ˙ + w ˙ b ) 2 ] d Ω + 1 2 m s [ w ˙ ( L / 2 ) + w ˙ b ] 2 = 1 2 0 L I 0 [ u ˙ 2 + w ˙ 2 + w ˙ b 2 + 2 w ˙ w ˙ b ] d x + 1 2 m s [ w ˙ ( L / 2 ) + w ˙ b ] 2
where I 0 = b h t / 2 h t / 2 ρ ( z ) d z .
The variation in the total work performed by the compressive axial load P , damping force and the electric charge output Q ( t ) is expressed as:
δ W = P 0 L δ [ u x + 1 2 ( w x ) 2 ] d x 0 L c v w ˙ δ w d x + 2 Q ( t ) δ V ( t )
where c v is the viscous damping coefficient. The Hamilton principle is utilized as:
δ t 1 t 2 ( T V H d Ω + W ) d t = 0
By substituting Equations (11)–(15) into Equation (16), and performing the calculation, one obtains:
t 1 t 2 0 L { ( N x x , x I 0 u ¨ P x ) δ u B x x h p δ V [ I 0 w ¨ I 0 w ¨ b m s L ϒ ( x L 2 ) ( w ¨ + w ¨ b ) + [ x ( N x x w x ) + M x x , x x + G x x , x x ] x ( P w x ) c v w ˙ ] δ w } d x d t + 2 t 1 t 2 Q ( t ) δ V ( t ) d t = 0
where ϒ ( x x 0 ) is defined as:
{ ϒ ( x x 0 ) = { 0 , x x 0 , x = x 0 0 L ϒ ( x x 0 ) d x = 1
The two piezoelectric layers are connected in series in the circuit. Therefore, the current in the circuit is calculated as i ( t ) = 2 V R = Q ˙ ( t ) . Then, the nonlinear electromechanical coupling equations can be obtained as:
N x x , x P , x = I 0 u ¨
G x x , x x ( P w x ) , x + x ( N x x w x ) + M x x , x x = [ I 0 + m s L ϒ ( x L 2 ) ] ( w ¨ + w ¨ b ) + c v w ˙
4 V R 0 L B ˙ x x h p d x = 0
By substituting Equation (13), into Equations (19)–(21), the nonlinear electromechanical coupling equations are rewritten as:
b A 11 ( 1 l 2 2 ) x [ u x + 1 2 ( w x ) 2 ] = I 0 [ 1 ( e 0 a ) 2 2 ] u ¨
P [ 1 ( e 0 a ) 2 2 ] 2 w x 2 b B 11 ( 1 l 2 2 ) 4 w x 4 + x { ( b A 11 ( 1 l 2 2 ) [ u x + 1 2 ( w x ) 2 ] + 2 b e 311 V ) w x } = [ I 0 + m s L ϒ ( x L 2 ) ] [ 1 ( e 0 a ) 2 2 ] ( w ¨ + w ¨ b ) + c v [ 1 ( e 0 a ) 2 2 ] w ˙
b L a 33 h p V ˙ + 2 V R 0 L { b [ e 311 ( u ˙ x + w x w ˙ x ) μ 3113 2 w ˙ x 2 ] } d x = 0
For the simply supported boundary, the lateral displacements and the moments at both ends of the beam are 0, i.e.,
w ( 0 ) = w ( L ) = 2 w ( 0 ) x 2 = 2 w ( L ) x 2 = 0
In the axial direction, the compressive load P equals to the inner force N x x at both ends, i.e.:
{ b A 11 ( 1 l 2 2 ) [ u x + 1 2 ( w x ) 2 ] + 2 b e 311 V P } δ u = 0
at x = 0 and x = L .
Compared with the lateral vibration, the axial vibration of a slender beam is less important witch can be neglected, i.e., u ¨ = 0 . As a result, from Equation (22) the following is obtained:
x [ u x + 1 2 ( w x ) 2 ] = 0
Combining with the boundary condition Equation (26) with Equation (27), one obtains:
u x + 1 2 ( w x ) 2 = 1 2 L 0 L ( w x ) 2 d x
With consideration of Equation (28), the nonlinear electromechanical coupling equations can be deduced as:
P [ 1 ( e 0 a ) 2 2 ] 2 w x 2 b B 11 ( 1 l 2 2 ) 4 w x 4 + ( b A 11 2 L 0 L ( w x ) 2 d x + 2 b e 311 V ) 2 w x 2 = [ I 0 + m s L ϒ ( x L 2 ) ] [ 1 ( e 0 a ) 2 2 ] ( w ¨ + w ¨ b ) + c v [ 1 ( e 0 a ) 2 2 ] w ˙
b L a 33 h p V ˙ + 2 V R b 0 L ( e 311 L 0 L w x w ˙ x d x μ 3113 2 w ˙ x 2 ) d x = 0

3. Solution Procedure

3.1. Static Buckling Analyses

The static buckling solution can be obtained by dropping the damping terms and time-related terms. Equation (29) is reduced as:
P [ 1 ( e 0 a ) 2 2 ] 2 w x 2 b B 11 ( 1 l 2 2 ) 4 w x 4 + b A 11 2 L 2 w x 2 0 L ( w x ) 2 d x = 0
The lateral displacement is assumed in the form
w = W s sin ( π x L )
Equation (31) can be written as Γ ( 2 w x 2 , 4 w x 4 , w x ) = 0 , where Γ ( 2 w x 2 , 4 w x 4 , w x ) equals the left hand side of Equation (31). Then the Galerkin method is applied as:
0 L Γ ( 2 w x 2 , 4 w x 4 , w x ) sin ( π x L ) d x = 0
By substituting Equation (32) into Equation (33) and applying the integration, one obtains:
P [ L 2 + ( e 0 a ) 2 π 2 ] π 2 b B 11 ( l 2 π 2 + L 2 L 2 ) π 2 b L 2 A 11 4 W s 2 = 0
In the prebuckling process the lateral displacement is zero. Solving the expression of P in Equation (34) with W s = 0 , the Eigen critical buckling force is obtained as:
P c r = π 2 b B 11 L 2 π 2 l 2 + L 2 π 2 ( e 0 a ) 2 + L 2
In Equation (35), B 11 is related to the porosity distribution, and whose expression is defined before, which can be solved as:
B 11 = h t / 2 h t / 2 z 2 C 11 d z = { h t 3 12 C max ( 1 χ 0 α )   ,   for   distribution   1 h t 3 12 C max [ 1 6 h c π h t χ 0 sin ( π h t 2 h c ) ]   ,   for   distribution   2 h t 3 12 C max [ 1 ( 6 2 h c π h t 96 2 h c 2 h t ) χ 0 sin ( π h t 4 h c ) ]   ,   for   distribution   3
In the postbuckling process, the maximum vertical displacement can be obtained by solving the expression of Ws in Equation (34), i.e.:
W s = 2 L 2 P ( π 2 ( e 0 a ) 2 + L 2 ) π 2 b B 11 ( π 2 l 2 + L 2 ) L 2 b A 11
where B 11 is shown in Equation (36), and the other porosity related coefficient A 11 is calculated as:
A 11 = h t / 2 h t / 2 C 11 d z = { h t C max ( 1 χ 0 α ) ,   for   distribution   1 h t C max [ 1 2 h c π h t χ 0 sin ( π h t 2 h c ) ] ,   for   distribution   2 h t C max [ 1 2 2 h c π h t χ 0 sin ( π h t 4 h c ) ] ,   for   distribution   3

3.2. Natural Frequency Analysis

Firstly, the free vibration analysis is performed to obtain the natural frequency of the structure. Setting the base excitation w b , damping coefficient c v and voltage potential V to be zero, neglecting the nonlinear terms, and assuming harmonic excitation, the lateral displacement is assumed in the form at the prebuckling state:
w = W ( t ) sin ( π x L ) ,   prebuckling
By substituting Equation (39) into Equation (29), applying the Galerkin method, one obtains:
L 2 π 2 P [ L 2 + ( e 0 a ) 2 π 2 ] W e j ω n t + π 4 b B 11 ( L 2 + l 2 π 2 ) W e j ω n t + L 4 { I 0 [ L 2 + ( e 0 a ) 2 π 2 ] + 4 m s L π } ( j ω n ) 2 W e j ω n t = 0
Equation (40) can be written as:
W ¨ + ω p r e 2 W = 0
where ω p r e is so-called linear natural frequency at prebuckling state and:
ω pre = π 5 b B 11 ( π 2 l 2 + L 2 ) π 3 L 2 P [ π 2 ( e 0 a ) 2 + L 2 ] L 4 { π I 0 [ π 2 ( e 0 a ) 2 + L 2 ] + 4 L m s } ,   prebuckling
It is seen in Equation (42) that the natural frequency is related to the compressive load P.
When the beam is buckled, the lateral displacement is in the from:
w = W s sin ( π x L ) + W ( t ) e j ω n t sin ( π x L ) ,   postbuckling
where W s sin ( π x L ) is the static vertical displacement, and the expression of Ws is provided in Equation (37) By substituting Equation (43) into Equation (29), neglecting the nonlinear terms, and applying the Galerkin method, one obtains:
L 2 π 2 P [ L 2 + ( e 0 a ) 2 π 2 ] W e j ω n t π 4 b B 11 ( L 2 + l 2 π 2 ) W e j ω n t + L 4 2 { I 0 [ L 2 + ( e 0 a ) 2 π 2 ] + 4 m s L π } ( j ω n ) 2 W e j ω n t = 0
Equation (44) can be written as:
W ¨ + ω p o s t 2 W = 0
where ω p o s t is the natural frequency at postbuckling state and:
ω post = 2 π 3 L 2 P ( π 2 ( e 0 a ) 2 + L 2 ) π 5 b B 11 ( π 2 l 2 + L 2 ) L 4 [ π I 0 ( π 2 ( e 0 a ) 2 + L 2 ) + 4 L m s ] ,   postbuckling
In Equation (46) the porosity related coefficient B 11 is shown in Equation (36), and the other porosity related coefficient I 0 is calculated as:
I 0 = b h t / 2 h t / 2 ρ ( z ) d z = { b h t ρ max 1 χ 0 α   ,   for   distribution   1 b h t ρ max [ 1 2 h c π h t χ m sin ( π h t 2 h c ) ]   ,   for   distribution   2 b h t ρ max [ 1 2 2 h c π h t χ m sin ( π h t 4 h c ) ]   ,   for   distribution   3

3.3. Electromechanical Responses

When the base excitation is applied ( w b = W b cos ( ω t ) ), the vibration response is assumed to be of the following form:
w = W ( t ) sin ( π x L )
By substituting Equation (48) in Equations (29) and (30), and applying the Galerkin method, one obtains:
α 2 W 3 + α V V W + ω n 2 W + c ¯ v W ˙ + W ¨ = W ¯ b ω 2 cos ω t
c ¯ p V ˙ + V e ¯ 311 W W ˙ μ ¯ 3113 W ˙ = 0
where ω n 2 is defined in Equation (42), and:
c ¯ v = π c v ( π 2 ( e 0 a ) 2 + L 2 ) π I 0 ( π 2 ( e 0 a ) 2 + L 2 ) + 4 L m s , α V = 2 π 3 b e 311 π I 0 ( π 2 ( e 0 a ) 2 + L 2 ) + 4 L m s W ¯ b = 4 L ( I 0 L + m s ) π I 0 ( π 2 ( e 0 a ) 2 + L 2 ) + 4 L m s W b , c ¯ p = a 33 b L R 2 h p μ ¯ 3113 = π b R L μ 3113 , e ¯ 311 = π 2 b R 4 L e 311
The harmonic balance method is used to solve Equations (49) and (50). Setting:
W ( t ) = W s + h t ( a 1 cos ω t + b 1 sin ω t )
V ( t ) = c 1 cos ω t + d 1 sin ω t + c 2 cos 2 ω t + d 2 sin 2 ω t
where W s is the static displacement by buckling. When the beam is in the state of pre-buckling ( P < P c r ), W s is zero, and when the beam is in the state of postbuckling ( P P c r ), W s is calculated by Equation (37). Substituting Equations (52) and (53) into Equations (49) and (50), the coefficients for cos ω t and sin ω t should be balance. Then the differential equations are converted to a series of nonlinear algebraic equations such as:
3 4 α 2 b 1 h t 3 a 1 2 + 1 2 h t α v a 1 d 2 + 3 4 h t 3 α 2 b 1 3 c ¯ v h t ω a 1 1 2 h t α v c 2 b 1 + h t ( ω n 2 ω 2 ) b 1 + 3 α 2 h t W s 2 b 1 + W s α v d 1 = 0
3 4 α 2 h t 2 a 1 3 + h t ( 3 4 α 2 h t 2 b 1 2 + ω n 2 ω 2 ) a 1 + c ¯ v ω b 1 W ¯ b ω + 1 2 c 2 h t α v a 1 + 3 α 2 h t W s 2 a 1 + 1 2 h t α v b 1 d 2 + W s α v c 1 = 0
h t ω μ ¯ 3113 a 1 + e ¯ 311 h t ω W s a 1 ω c ¯ p c 1 + d 1 = 0
e ¯ 311 h t ω W s b 1 h t μ ¯ 3113 ω b 1 + c 1 + c ¯ p ω d 1 = 0
1 2 e ¯ 311 h t 2 ω ( a 1 2 b 1 2 ) 2 c ¯ p ω c 2 + d 2 = 0
e ¯ 311 h t 2 ω a 1 b 1 + c 2 + 2 c ¯ p ω d 2 = 0
in which, a 1 , b 1 , c 1 , d 1 , c 2 , and d 2 can be solved numerically.
The generated voltage is the alternating voltage, which is described as a function of time. In order to evaluate the energy capture efficiency conveniently, the root mean square (RMS) voltage V r m s is introduced as follows:
V r m s = 1 T V 0 T V [ V ( t ) ] 2 d t
where T V is the period of the alternating voltage. The RMS voltage is the square root of the mean over one cycle of the square of the instantaneous voltage. In fact, the RMS voltage is equal to the value of the direct current that would produce the same average power dissipation in a resistive load [69].

4. Results and Discussion

Firstly, the validation of the present model is validated. In Table 1, the natural frequencies ( ( ω n L 2 / h t ) 12 ρ max / C max ) with consideration of the nonlocal strain gradient are compared with those in Ref. [70]. For comparison purposes, the electric constants and mass densities of the core layer and piezoelectric layers are assumed to be the same, and the piezoelectricity and flexoelectricity are neglected. The lumped mass is set as zero, and the axially load is released. The length and the thickness of the beam are assumed to be L = 50 nm and ht = 1 nm, respectively. Results show good agreements with Ref. [70]. In addition, in Table 1, it can be seen that the results obtained in the present study are slightly higher than those in Ref. [70] by 0.019%. The reason why the results in the present study are slightly higher than those in Ref. [70], is that the rotational inertia is neglected in the present study, which is considered in Ref. [70].
In Figure 4, the dimensionless natural frequency ( ( ω n L 2 / h t ) 12 ρ max / C max ) with the dimensionless axial load ( P L 2 / ( π 2 b B 11 ) ) are compared with those in Ref. [13]. The material properties are E = 126 G P a , e 311 = 6.5 C / m 2 , μ 3113 = 1.0 × 10 7 C / m , a 33 = 1.8 × 10 8 C / ( V m ) . Results show good agreements with Ref. [13]. It seems that the natural frequency decreases with the increase in the compressive load P at the prebuckling state and reaches zero when P = P c r , and increases with the increase in the compressive load P at the postbuckling state. A similar phenomenon is also found in the experimental work [71].
In the text bellow, for the convenience of discussion, some values of material constants and geometric dimensions are provided (unless otherwise specified). The material constants of the piezoelectric material are c 11 p = 126 G P a , ρ p = 7800 k g / m 3 , e 311 = 6.5 C / m 2 , μ 3113 = 0.1 μ C / m , and a 33 = 1.3 × 10 8 C / ( V m ) . The maximum elastic constant of the core layer is C max = 200 G P a , the maximum mass density of the core layer is ρ max = 8700 k g / m 3 . The geometric dimension of the beam is fixed to be L : b : h t : h p = 100 : 10 : 1 : 0.1 . The nonlocal parameter is set as e 0 a = 0.1 L , the strain gradient constant is l = 0.2 L .
In Figure 5, effects of the lumped mass on the natural frequency ( ( ω n L 2 / h t ) 12 ρ max / C max ) for distribution 1 are displayed. The porosity is κ 0 = 0 (uniform distribution without porosity), and the nonlocal parameter and strain gradient constant are e 0 a = 0.1 L , and l = 0.2 L . It seems that at both the prebuckling state and postbuckling state, the lumped mass decreases the natural frequency. In this case, when m s = 0.1 I 0 L , m s = 0.5 I 0 L , and m s = I 0 L , the natural frequencies are reduced to 94.7 % , 79.6 % and 68.1 % of those without lumped mass, respectively.
In Figure 6, effects of the nonlocal parameter and strain gradient constant on the natural frequency ( ( ω n L 2 / h t ) 12 ρ max / C max ) and buckling load for distribution 1 are displayed. The porosity is κ 0 (uniform distribution without porosity). It seems that at the prebuckling state, the resonance frequency decreases because the natural frequency decreases as the axial load increases; this is opposite at the postbuckling state. When the nonlocal strain gradient is considered, the critical buckling load is dependent on the values of the nonlocal parameter e 0 a and strain gradient constant l . The nonlocal parameter e 0 a diminishes the critical buckling load, while the strain gradient constant l enlarges the critical buckling load. It is because the nonlocal strain gradient theory can explain both the strengthening and weakening of the size-effect of the structure. Whether the overall effect of the nonlocal strain gradient strengthening or weakening is related to the relative quantity between the nonlocal parameter e 0 a and the strain gradient constant l . On the other hand, the nonlocal strain gradient shows the opposite effect on the natural frequency at the prebuckling and postbuckling state. The nonlocal parameter e 0 a decreases the natural frequency at the prebuckling state, while it increases the natural frequency at the postbuckling state. The strain gradient constant l increases the natural frequency at the prebuckling state, while it decreases the natural frequency at the postbuckling state.
Shown in Figure 7 are the dimensionless amplitude ( W max / W 0 ) -excitation frequency ( ( ω n L 2 / h t ) 12 ρ max / C max ) curves for different axial loads at the prebuckling state ( P   P c r , m s = 0 , R = 1 k Ω , W 0 = 0.01 h t , κ 0 = 0 for distribution 1). It seems that at the prebuckling state, the dimensionless amplitude increases to a peak value and then decreases with the increase in dimensionless excitation frequency. Moreover, when P = 0.2 P c r , P = 0.4 P c r , P = 0.6 P c r , P = 0.8 P c r and P = P c r , the maximum dimensionless amplitude decreases by 10.4%, 22.4%, 36.9%, 55.0% and 91.1%, respectively, compared with that of without axial load. The resonance amplitude also decreases as the axial load increases. When the axial load equals the buckling load P c r , the resonance phenomenon cannot be observed because the natural frequency of the structure decreases to zero as the structure is critically buckled. In such the case, the dimensionless amplitude increases from 0 to 1 as the excitation frequency increases.
Shown in Figure 8 are the dimensionless root mean square voltage ( a 33 e 311 V r m s W max ) -excitation frequency ( ω n L 2 / h t 12 ρ max / C max ) curves for different axial loads at the prebuckling state ( P P c r , m s = 0 , R = 1 k Ω , W 0 = 0.01 h t , κ 0 = 0 for distribution 1). It seems that the root mean square voltage output increases to a peak and then decreases as the excitation frequency increases in the prebuckling procedure. The peak value is acquired when the excitation frequency is close to the natural frequency of the structure. Further, as the axial load increases, the peak value decreases. When the axial load is equal to the buckling load, the RMS voltage output increases as the excitation frequency increases, and the value of the RMS voltage remains at a low level.
Shown in Figure 9 are the dimensionless vibrational amplitude ( ( W W s ) max / W 0 ) -excitation frequency ( ( ω n L 2 / h t ) 12 ρ max / C max ) curves for different axial loads at the postbuckling state ( P P c r , m s = 0 , R = 1 k Ω , W 0 = 0.01 h t , κ 0 = 0 for distribution 1). It is worth noting that the vibrational amplitude only calculates the vibrational component of the beam, and displacement due to the axial load ( W s ) is taken off in Figure 9, because it would not produce an electric field from this part of the displacement. In contrast with the curves at the prebuckling state (shown in Figure 7), the resonance frequency increases as the axial load increases due to the decreases in the natural frequency as the axial load increases at postbuckling state. Further, the resonance amplitude increases as the axial load increases, which is different from the results at the prebuckling state. Furthermore, the value of the dimensionless resonance vibration amplitude at postbuckling state is larger than those at prebuckling state when the same excitation is applied.
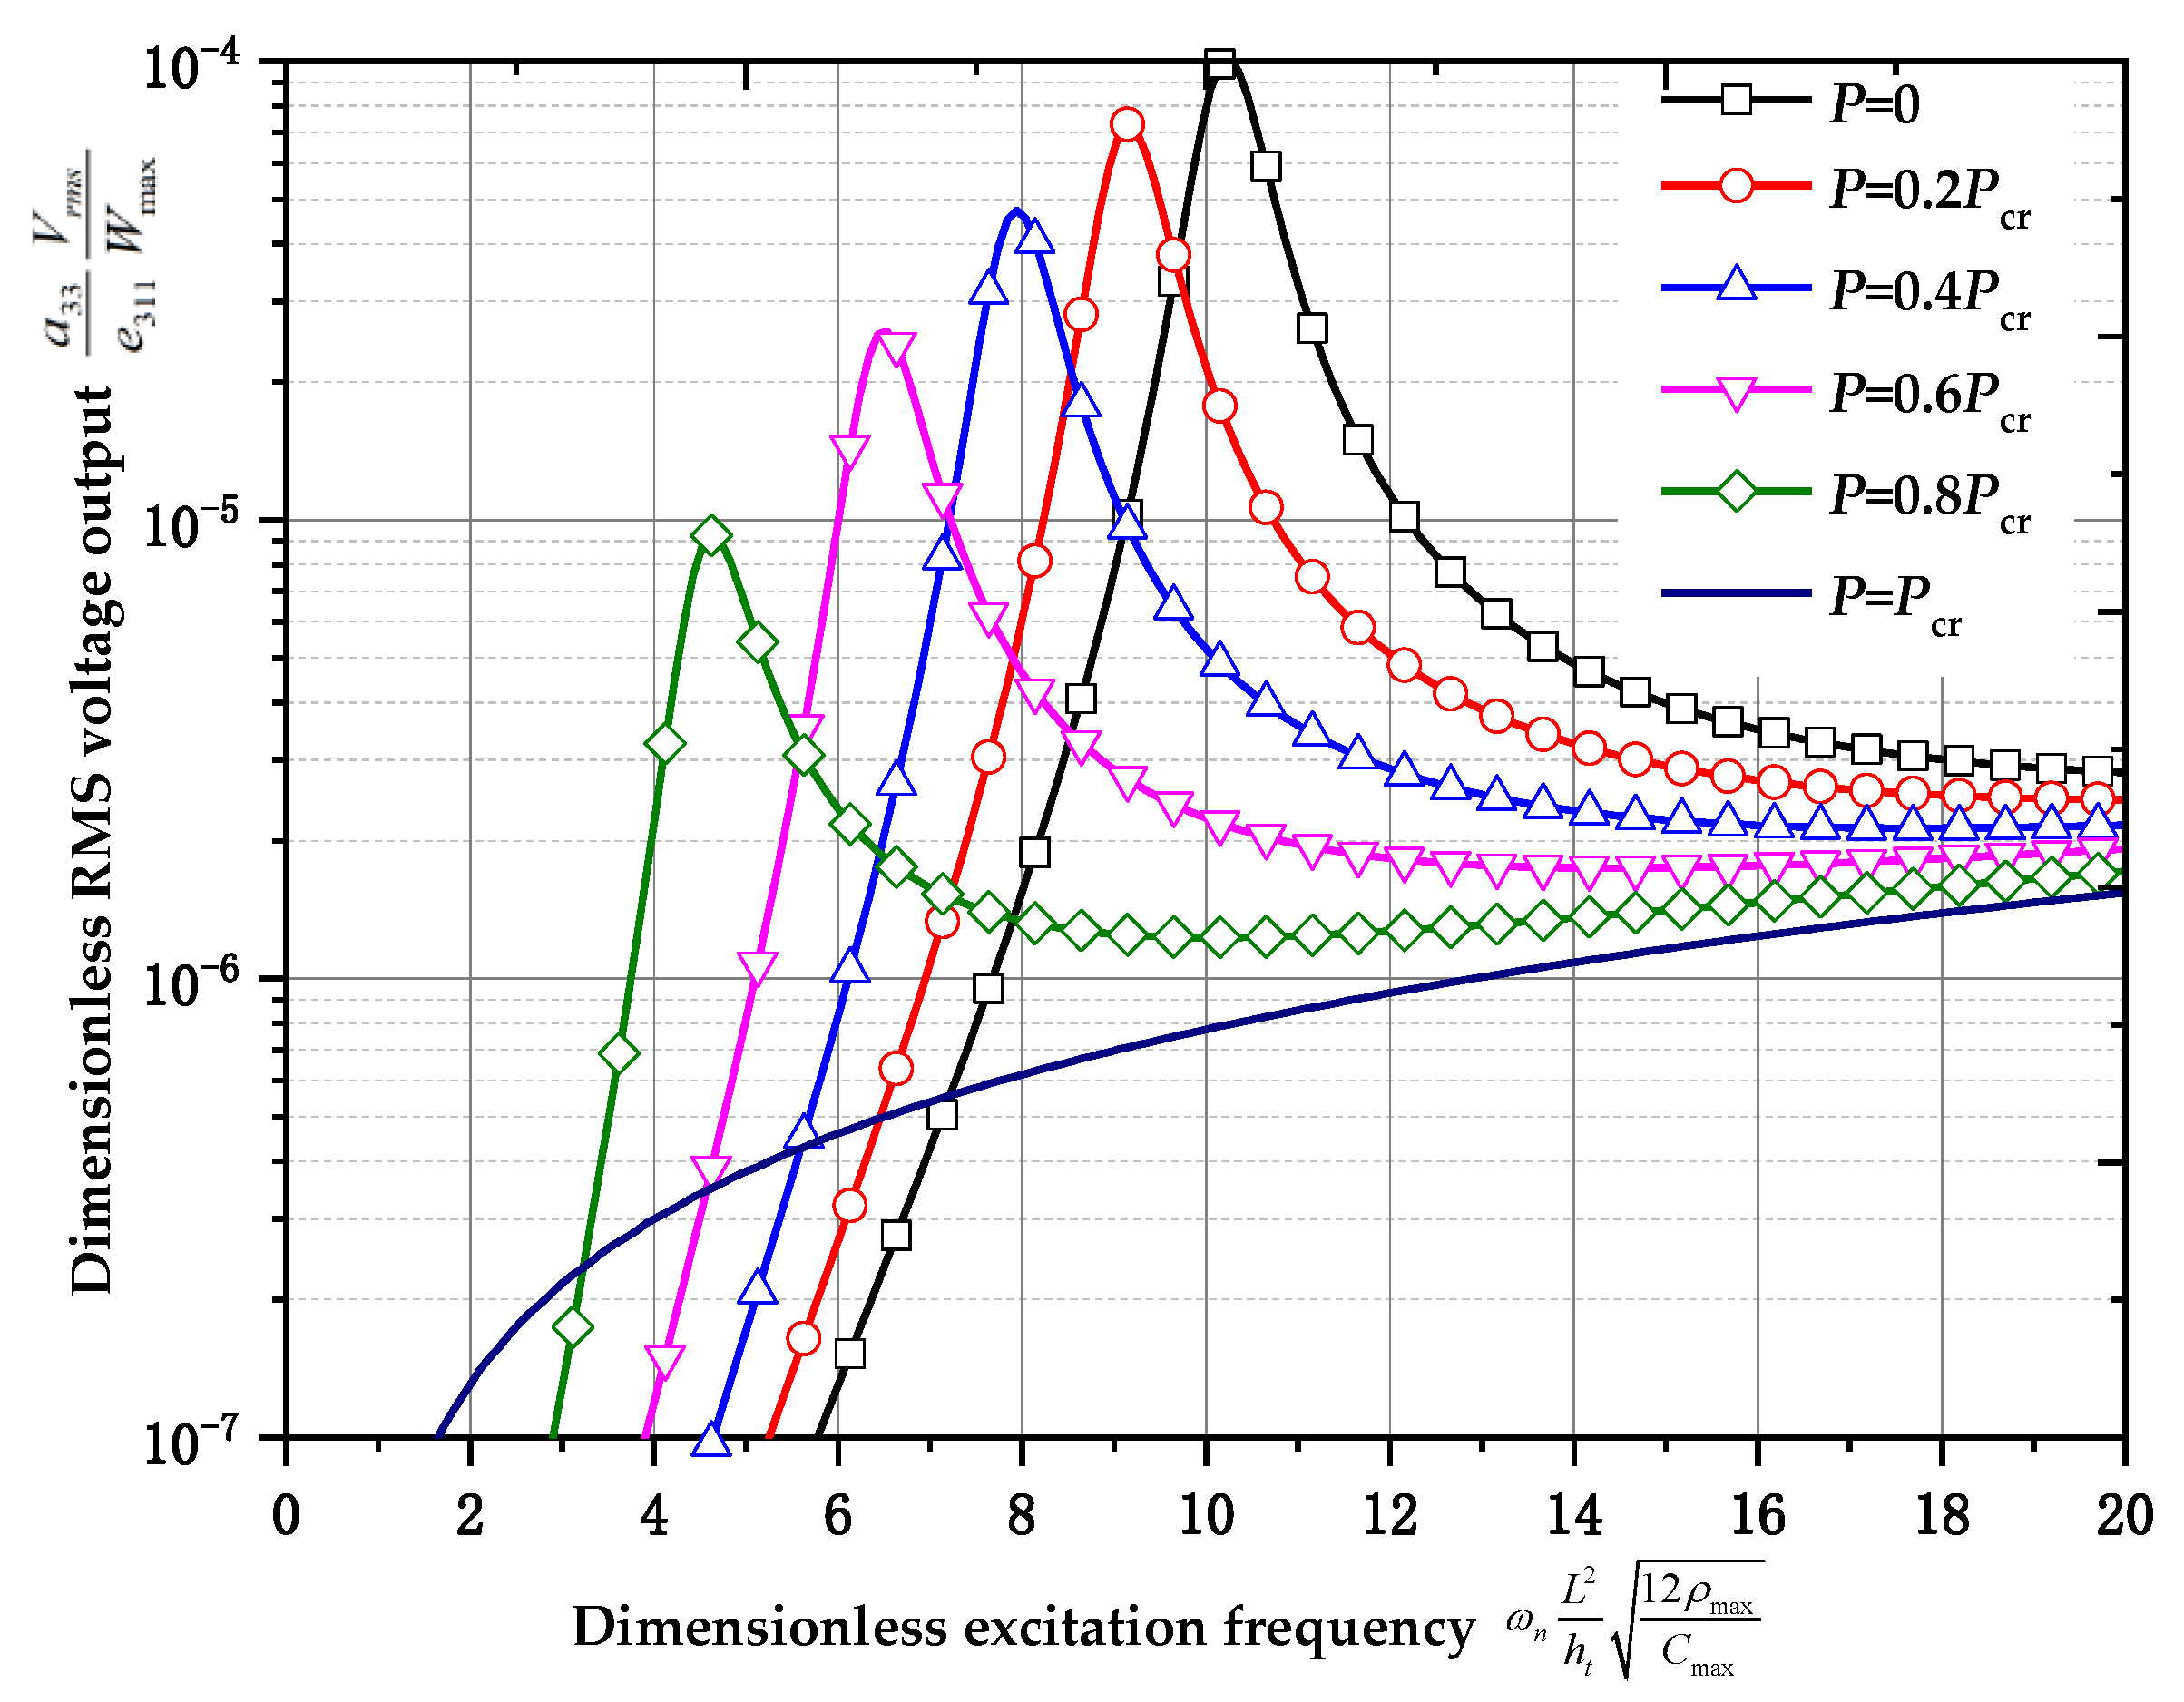
Shown in Figure 10 are the dimensionless root mean square voltage ( a 33 e 311 V r m s W max )-excitation frequency ( ( ω n L 2 / h t ) 12 ρ max / C max ) curves for different axial loads at the postbuckling state ( P P c r , m s = 0 , R = 1 k Ω , W 0 = 0.01 h t , κ 0 = 0 for distribution 1). As the excitation frequency is close to the natural frequency of the structure, the root mean square voltage reaches a peak. As the axial load increases, the peak value increases, which is different from the postbuckling procedure shown in Figure 8. Further, the peak value of the root mean square voltage output for postbuckling procedure is remarkably larger than that for the prebuckling procedure. It provides a new idea to improve the mechanical electrical conversion efficiency of the structure. The mechanical electrical conversion efficiency in the postbuckling procedure is higher than that in the prebuckling procedure.
Shown in Figure 11 are the dimensionless resonance amplitude ( W max / W 0 )-axial load ( 12 L 2 P π 2 b C max h t 3 ) curves for different distributions of the core layer ( m s = 0.5 I 0 L , W 0 = 0.01 h t , κ 0 = 0.5 , R = 1 k Ω ). The resonance amplitude is acquired when the excitation frequency matches the natural frequency of the structure. It seems that when the axial load is zero, the resonance amplitude shows no difference for three types of distribution. In the prebuckling procedure, as the axial load increases, the resonance amplitude decreases, and the difference between the three types of distribution increases. Distribution 2 has the largest resonance amplitude, and distribution 1 has the smallest resonance amplitude among these three types of distribution. In the postbuckling procedure, as the axial load increases, the resonance amplitude increases. Distribution 1 has the largest resonance amplitude, and distribution 2 has the smallest resonance amplitude among these three types of distribution.
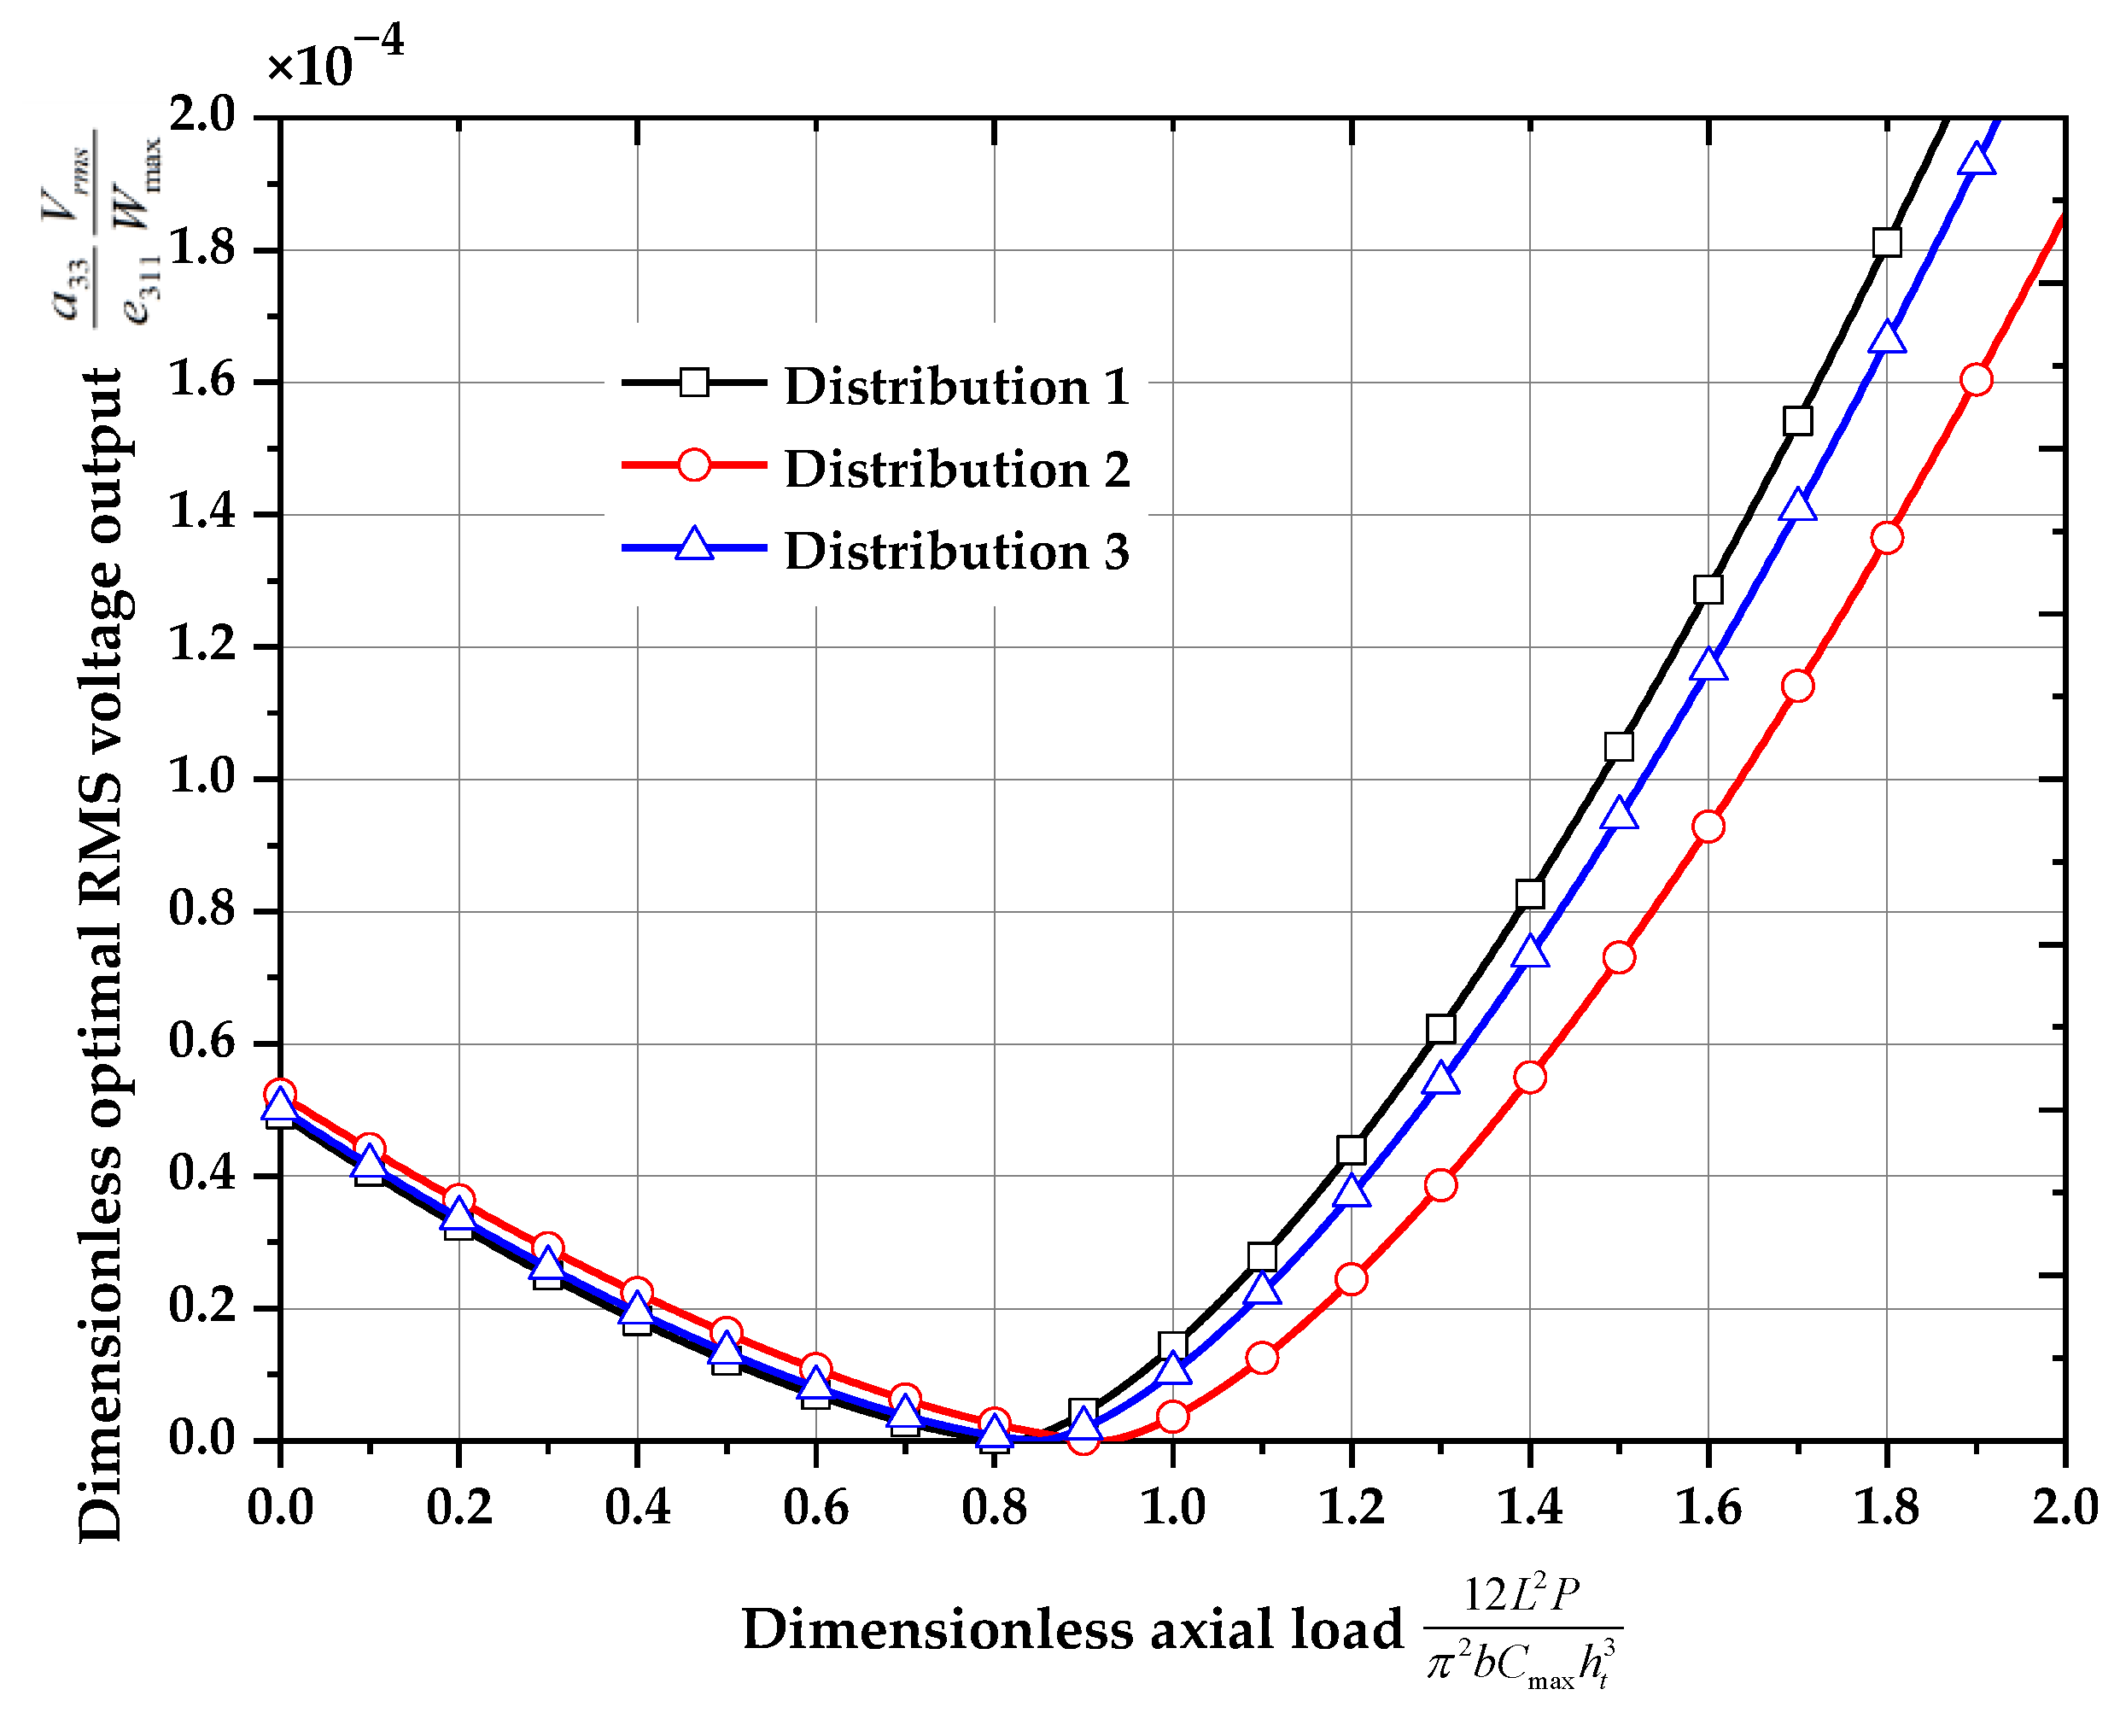
Shown in Figure 12 are the dimensionless optimal root mean square voltage output ( a 33 e 311 V r m s W max )-axial load ( 12 L 2 P π 2 b C max h t 3 ) curves for different distributions of the core layer ( P P c r , m s = 0 . 5 I 0 L , W 0 = 0.01 h t , κ 0 = 0.5 , R = 1 k Ω ). In the prebuckling procedure, it can be seen that the optimal RMS voltage decreases as the axial load increases, and there is little difference between the optimal RMS voltage of distribution 1 and distribution 3, and distribution 2 has the largest optimal RMS voltage. In the postbuckling procedure, as the axial load increases, the optimal RMS voltage increases. Distribution 1 has the largest optimal RMS voltage, and distribution 2 has the smallest optimal RMS voltage among these three type distributions.
Shown in Figure 13 are the dimensionless natural frequency ( ( ω n L 2 / h t ) 12 ρ max / C max )– porosity coefficient ( κ 0 ) curves for different distributions of the core layer ( m s = 0 . 5 I 0 L , W 0 = 0.01 h t , R = 1 k Ω , P = 0 ). The influence of the porosity coefficient of the sandwich layer on the vibration frequency of the composite beam is also significant. In the figure, for the same value of the porosity coefficient ( κ 0 ), the mass of the three types of distribution is equal. It can be found that the vibration frequencies of distribution 1 and distribution 3 decrease rapidly with the increase in the porosity coefficient, while the decrease in the vibration frequency of distribution 2 is not obvious. In addition, for the same porosity coefficient, the vibration frequency of distribution 2 is the largest, the vibration frequency of distribution 3 is the second largest, and the vibration frequency of distribution 1 is the smallest.
The dimensionless optimal root mean square voltage output ( a 33 e 311 V r m s W max ) – porosity coefficients ( κ 0 ) curves for different distributions of the core layer are shown in Figure 14 ( m s = 0 . 5 I 0 L , W 0 = 0.01 h t , R = 1 k Ω , P = 0 ). The influence of the porosity coefficient of the sandwich layer on the root mean square voltage output of the composite beam is also significant. In the figure, the mass of three types of distribution is assumed to be equal. It can be seen from the figure that the optimal RMS voltage output for the three type distributions decreases rapidly with the increasing porosity coefficient. Besides, for the same porosity coefficient, distribution 2 has the largest optimal RMS voltage output, distribution 3 has the second largest optimal RMS voltage output, and distribution 1 has the smallest optimal RMS voltage output among the three types of distribution.
Shown in Figure 15 are the dimensionless amplitude ( W max / W 0 ) – excitation amplitude ( W 0 ) curves for linear/nonlinear vibration and different porosity coefficients ( κ 0 ) ( m s = 0 , R = 1 k Ω , P = 0 for distribution 1). It can be found that the dimensionless amplitude of nonlinear vibration decreases as the excitation amplitude increases, while the dimensionless amplitude of the linear vibration does not change with the excitation amplitude. This is because the stiffness of the structure increases when considering nonlinear vibrations. In addition, for the same excitation amplitude, the larger the porosity coefficient, the larger the dimensionless amplitude.
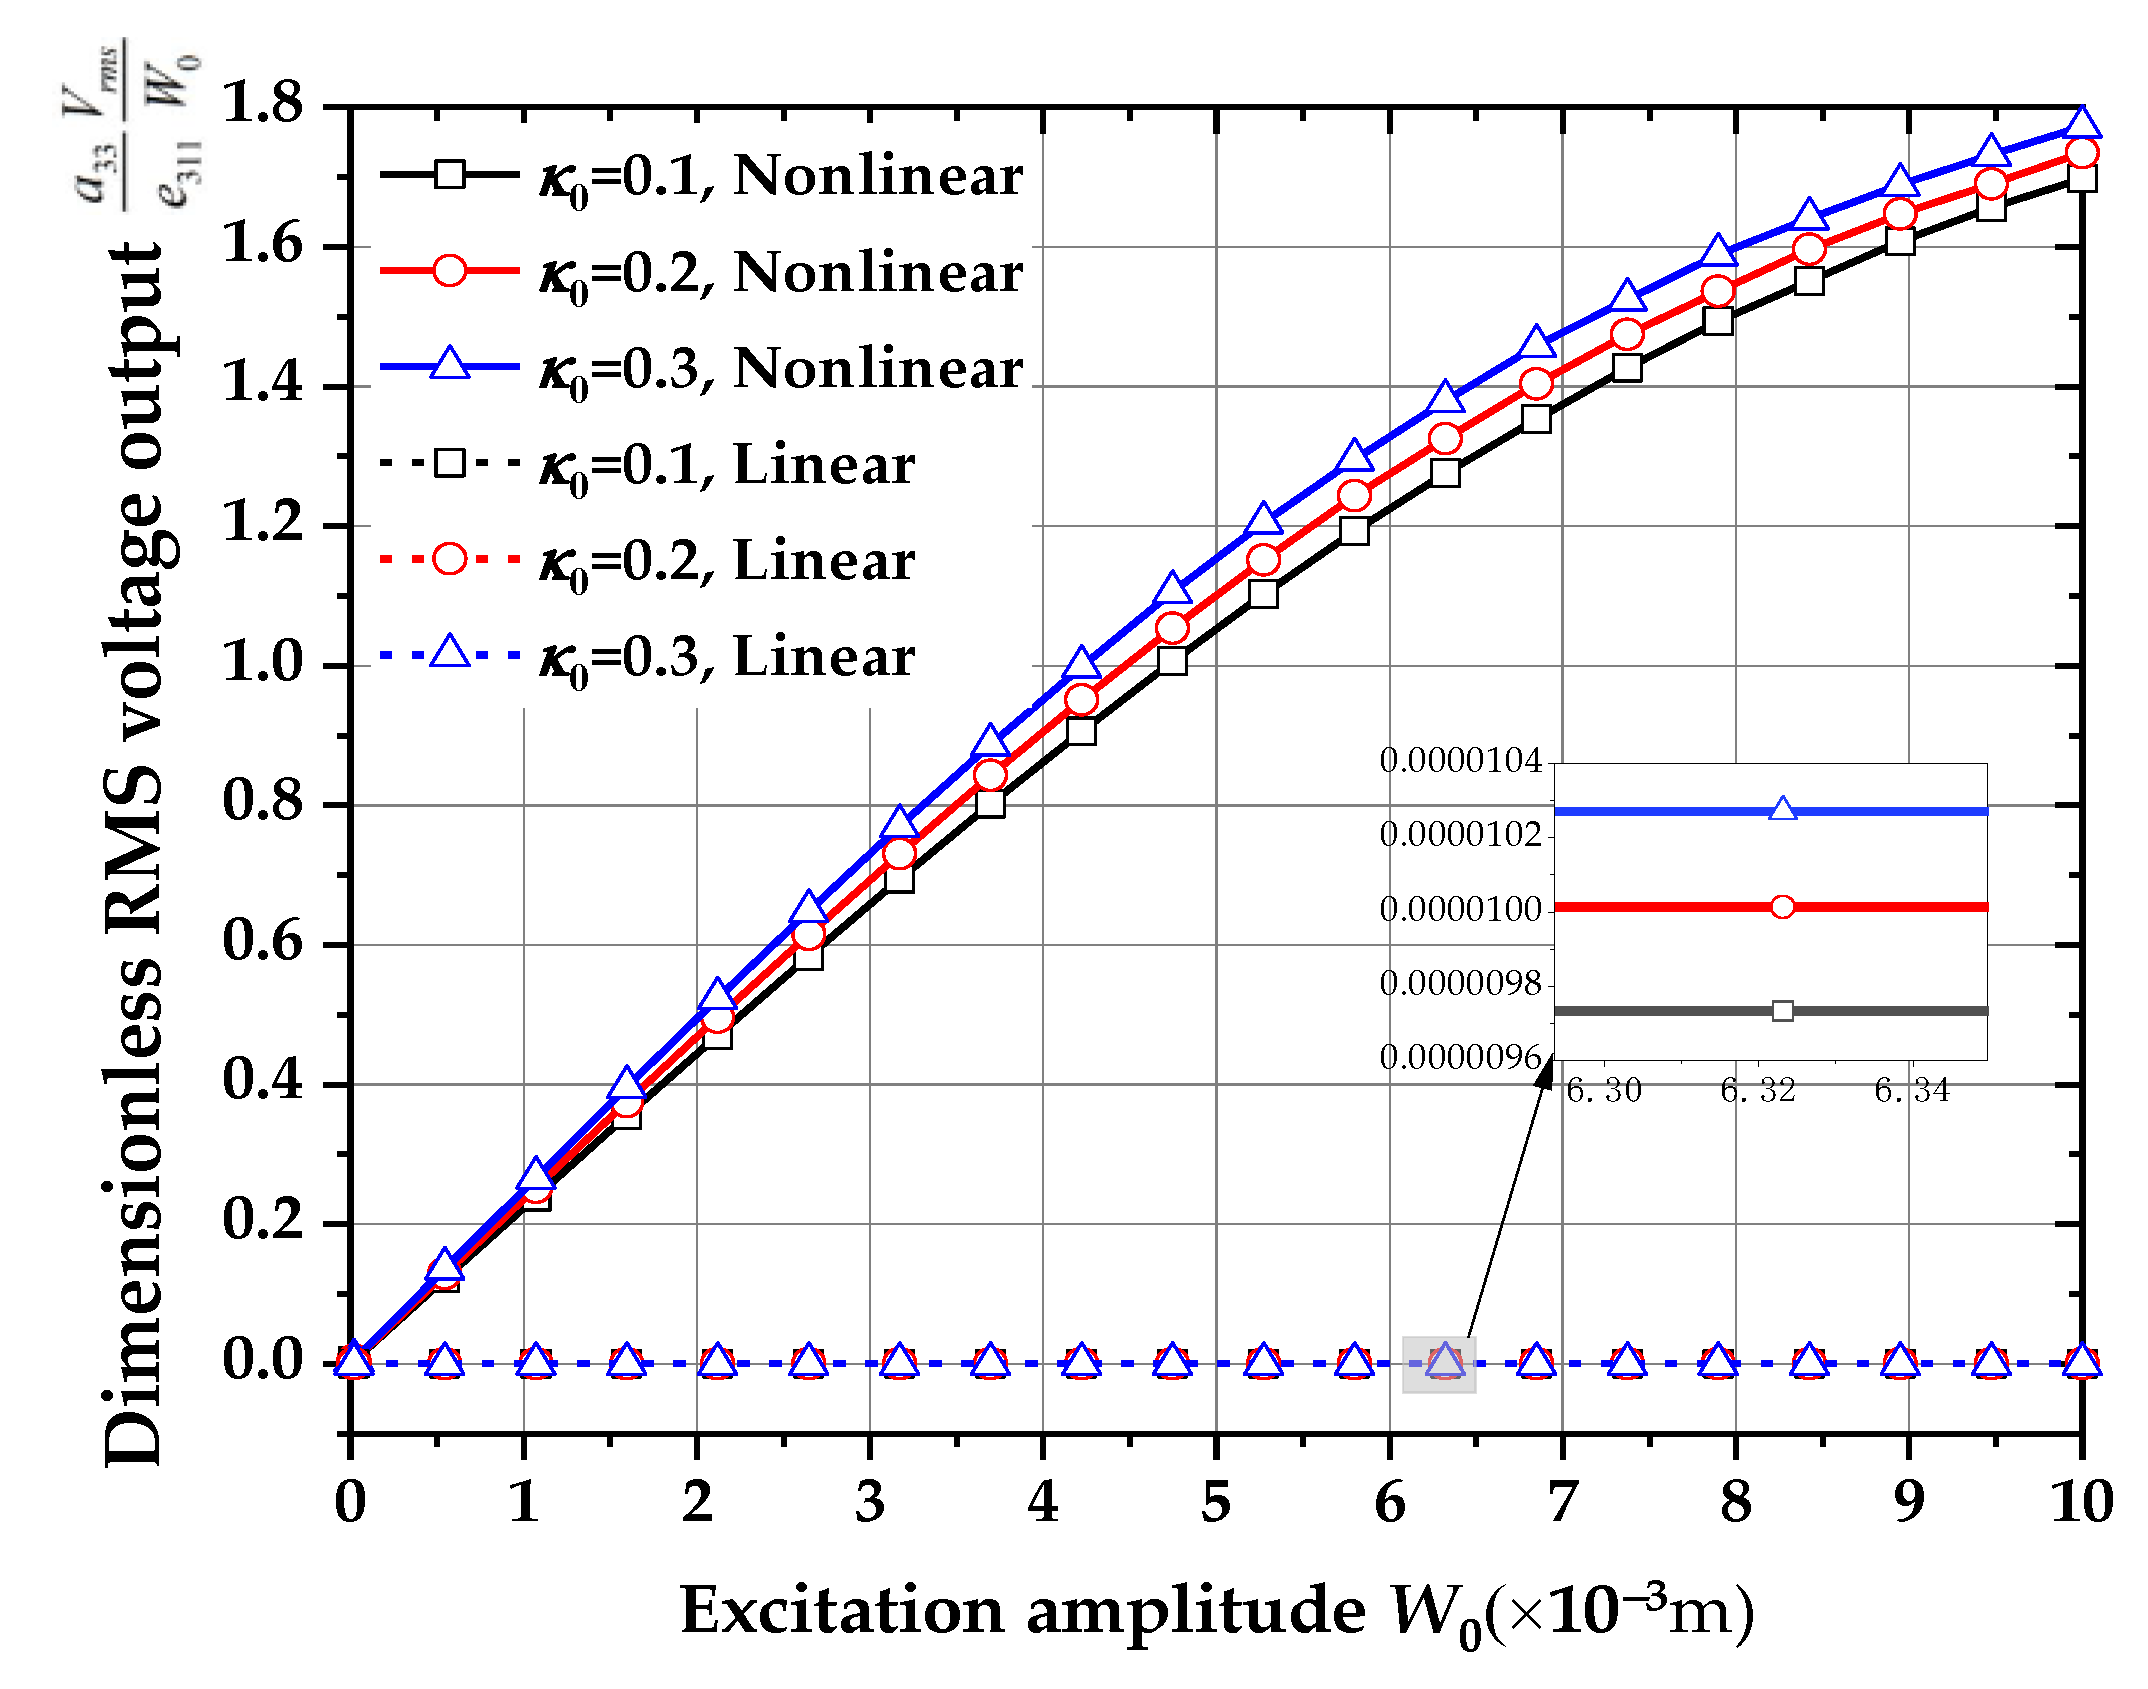
Shown in Figure 16 are the dimensionless RMS voltage output ( a 33 e 311 V r m s W max ) – excitation amplitude ( W 0 ) curves for linear/non-linear vibration and different porosity coefficients ( κ 0 ) ( m s = 0 , R = 1 k Ω , P = 0 for distribution 1). It can be seen that the RMS voltage output of nonlinear vibration increases with the increase in the excitation amplitude, while the RMS voltage output of linear vibration does not vary with the excitation amplitude. This indicates that considering nonlinear vibration can enhance the mechanical electrical conversion efficiency.
It is assumed that the ratio of the thickness of the piezoelectric layer to the total thickness of the beam h p / h t is assumed to remain constant. Therefore, as the total thickness of the beam increases, so does the thickness the piezoelectric layer, the RMS voltage output is proportional to the total thickness of the beam. In order to study the size-dependency of the flexoelectric effect on the performance of energy harvesters. The dimensionless RMS voltage output is processed, so that when the PE is considered only, the dimensionless RMS voltage output is kept constant with the variation on the total thickness of the beam. Figure 17 shows the effect of the total beam thickness on the dimensionless root mean square voltage output with or without considering the flexoelectric effect (FE) ( m s = 0 , P = 0 , R = 1 k Ω , κ 0 = 0.5 , W 0 = 0.01 h t for distribution 1). It can be seen that the dimensionless RMS voltage output is independent of the total beam thickness when only piezoelectric effect (PE) is considered. While the dimensionless RMS voltage output decreases with the increase in the total beam thickness when the piezoelectric and flexoelectric effects are considered simultaneously, which indicates that the flexoelectricity has a significant effect on the performance of the small-scale energy harvester. When the structure size is smaller, the flexoelectric effect is more pronounced.
Figure 18 shows the effect of the ratio of the piezoelectric layer thickness to the total beam thickness on the dimensionless root mean square voltage output ( h t = 3 × 10 4 m , m s = 0 , P = 0 , R = 1 k Ω , κ 0 = 0.5 , W 0 = 0.01 h t for distribution 1). It can be seen that the RMS voltage output increases with the increase in the thickness ratio of the beam, and when the thickness ratio increases to a certain value, the RMS voltage output changes very little. This is because the total beam thickness is certain, and the thickness of the piezoelectric layer no longer changes when the thickness of the piezoelectric layer increases to a value comparable with the total beam thickness. In addition, under the same conditions, the RMS voltage output considering both piezoelectricity and flexoelectricity is greater than the RMS voltage output considering only piezoelectricity.

5. Conclusions

In this study, the nonlinear electromechanical behavior of the piezoelectric energy harvester model of FG porous sandwich nanobeams under compressive axial loading is investigated based on the NSGT. The porosity distribution of three different types of FG layers for the Euler–Bernoulli beam theory is discussed. The effects of different types of porosity distributions, porosity coefficients, length scale parameters, nonlocal parameters, flexoelectricity, excitation frequencies, lumped mass and axial loads on the vibration frequency, and voltage output of nanobeams are investigated. The results show that:
The porous distribution, the porosity coefficient of porous materials, the excitation frequencies and the axial load have a large effect on the vibration frequency and voltage output of the sandwiched piezoelectric nanobeams. The axial load and excitation frequency also have an effect on the vibration amplitude of the beam. In the critical buckling state, the vibration amplitude of the beam decreases by nearly 91.1% compared with one without the axial load. The lumped mass reduces the natural frequency of the structure. When the lumped mass equals the mass of the beam, the natural frequency decreases by 32.8%. When the NSGT are considered, the critical buckling load depends on the values of the nonlocal parameters and the strain gradient constant. In addition, the peak value of the RMS voltage output of the postbuckling process is significantly larger than that of the prebuckling process, which provides a new idea to improve the mechanical electrical conversion efficiency of the structure. Furthermore, the size-dependence of the flexoelectric effect on the performance of the energy harvester is demonstrated, indicating that the flexoelectric effect can significantly increase the RMS voltage output of the energy harvester. The results have some reference value for the design and application of piezoelectric energy harvesters.

Author Contributions

Conceptualization, formal analysis, investigation, methodology, project administration, supervision, writing—original draft and writing—review and editing, S.Z.; formal analysis, investigation, methodology, software and writing—review and editing, Z.P.; and conceptualization, methodology, project administration and validation, K.W.; conceptualization, project administration and supervision, B.W.; project administration, software, supervision and validation, J.W.; writing—original draft, T.L. All authors have read and agreed to the published version of the manuscript.

Funding

This research is supported by the National Natural Science Foundation of China under Grants 51965041, 51975266, and 11972137, the Foundation of Jiangxi Educational Committee under Grant GJJ190522 and the Jiangxi Provincial Natural Science Foundation under Grant 20202BAB211005.

Institutional Review Board Statement

Not applicable.

Informed Consent Statement

Not applicable.

Data Availability Statement

Not applicable.

Conflicts of Interest

The authors declared no potential conflict of interest with respect to the research, authorship, and/or publication of this article.

References

  1. Glynne-Jones, P.; Tudor, M.J.; Beeby, S.P.; White, N.M. An electromagnetic, vibration-powered generator for intelligent sensor systems. Sens. Actuators. A Phys. 2004, 110, 344–349. [Google Scholar] [CrossRef] [Green Version]
  2. Anton, S.R.; Sodano, H.A. A review of power harvesting using piezoelectric materials (2003–2006). Smart. Mater. Struct. 2007, 16, 1–21. [Google Scholar] [CrossRef]
  3. Mitcheson, P.D.; Miao, P.; Stark, B.H.; Yeatman, E.M.; Holmes, A.S.; Green, T.C. MEMS electrostatic micropower generator for low frequency operation. Sens. Actuators. A Phys. 2004, 115, 523–529. [Google Scholar] [CrossRef] [Green Version]
  4. Erturk, A.; Inman, D.J. A distributed parameter electromechanical model for cantilevered piezoelectric energy harvesters. J. Vib. Acoust. 2008, 130, 55018. [Google Scholar] [CrossRef]
  5. Erturk, A.; Inman, D.J. An experimentally validated bimorph cantilever model for piezoelectric energy harvesting from base excitations. Smart. Mater. Struct. 2009, 18, 25009. [Google Scholar] [CrossRef]
  6. Wang, K.F.; Wang, B.L. An analytical model for nanoscale unimorph piezoelectric energy harvesters with flexoelectric effect. Compos. Struct. 2016, 153, 253–261. [Google Scholar] [CrossRef]
  7. Zeng, S.; Zhang, C.; Wang, K.; Wang, B.; Sun, L. Analysis of delamination of unimorph cantilever piezoelectric energy harvesters. J. Intell. Mater. Syst. Struct. 2018, 29, 1875–1883. [Google Scholar] [CrossRef]
  8. Stamatellou, A.-M.; Kalfas, A.I. Piezoelectric energy harvesting experiments under combined aerodynamic and base excitation. J. Intell. Mater. Syst. Struct. 2021, 32, 169–181. [Google Scholar] [CrossRef]
  9. Wang, K.F.; Wang, B.L. Surface effects on the energy-generating performance of piezoelectric circular nanomembrane energy harvesters under pressure loading. EPL 2014, 108. [Google Scholar] [CrossRef]
  10. Costa, L.G.; da Silva Monteiro, L.L.; Calas Lopes Pacheco, P.M.; Savi, M.A. A parametric analysis of the nonlinear dynamics of bistable vibration-based piezoelectric energy harvesters. J. Intell. Mater. Syst. Struct. 2021, 32, 699–723. [Google Scholar] [CrossRef]
  11. Farokhi, H.; Ghayesh, M.H. A constrained broadband nonlinear energy harvester. Energy. Convers. Manag. 2019, 197, 111828. [Google Scholar] [CrossRef]
  12. Masana, R.; Daqaq, M.F. Electromechanical modeling and nonlinear analysis of axially loaded energy harvesters. J. Vib. Acoust. 2011, 133, 11007. [Google Scholar] [CrossRef]
  13. Chen, Y.; Yan, Z. Nonlinear analysis of axially loaded piezoelectric energy harvesters with flexoelectricity. Int. J. Mech. Sci. 2020, 173, 105473. [Google Scholar] [CrossRef]
  14. Varelis, D.; Saravanos, D.A. Coupled buckling and postbuckling analysis of active laminated piezoelectric composite plates. Int. J. Solids. Struct. 2004, 41, 1519–1538. [Google Scholar] [CrossRef]
  15. Zhang, Y.Q.; Lu, Y.; Wang, S.L.; Liu, X. Vibration and buckling of a double-beam system under compressive axial loading. J. Sound. Vib. 2008, 318, 341–352. [Google Scholar] [CrossRef]
  16. Foroozandeh, S.; Ariaei, A. Vibration and buckling of a multiple-Timoshenko beam system joined by intermediate elastic connections under compressive axial loading. Arch. Appl. Mech. 2018, 88, 1041–1057. [Google Scholar] [CrossRef]
  17. Tagantsev, A.K. Piezoelectricity and flexoelectricity in crystalline dielectrics. Phys. Rev. B Condens. Matter. 1986, 34, 5883–5889. [Google Scholar] [CrossRef]
  18. Zeng, S.; Wang, K.; Wang, B.; Wu, J. Vibration analysis of piezoelectric sandwich nanobeam with flexoelectricity based on nonlocal strain gradient theory. Appl. Math. Mech. Engl. 2020, 41, 859–880. [Google Scholar] [CrossRef]
  19. Yademellat, H.; Ansari, R.; Darvizeh, A.; Torabi, J.; Zabihi, A. Nonlinear electromechanical analysis of micro/nanobeams based on the nonlocal strain gradient theory tuned by flexoelectric and piezoelectric effects. Mech. Based. Design. Struct. Mach. 2020, 1–20. [Google Scholar] [CrossRef]
  20. Majdoub, M.S.; Sharma, P.; Cagin, T. Enhanced size-dependent piezoelectricity and elasticity in nanostructures due to the flexoelectric effect. Phys. Rev. B. 2008, 77, 125424. [Google Scholar] [CrossRef] [Green Version]
  21. Su, Y.; Lin, X.; Huang, R.; Zhou, Z. Analytical Electromechanical Modeling of Nanoscale Flexoelectric Energy Harvesting. Appl. Sci. 2019, 9, 2273. [Google Scholar] [CrossRef] [Green Version]
  22. Wang, K.F.; Wang, B.L. Energy gathering performance of micro/nanoscale circular energy harvesters based on flexoelectric effect. Energy 2018, 149, 597–606. [Google Scholar] [CrossRef]
  23. Fan, M.; Tzou, H. Vibration control with the converse flexoelectric effect on the laminated beams. J. Intell. Mater. Syst. Struct. 2019, 30, 2556–2566. [Google Scholar] [CrossRef]
  24. Moura, A.G.; Erturk, A. Combined piezoelectric and flexoelectric effects in resonant dynamics of nanocantilevers. J. Intell. Mater. Syst. Struct. 2018, 29, 3949–3959. [Google Scholar] [CrossRef]
  25. Zeng, S.; Wang, B.L.; Wang, K.F. Nonlinear vibration of piezoelectric sandwich nanoplates with functionally graded porous core with consideration of flexoelectric effect. Compos. Struct. 2019, 207, 340–351. [Google Scholar] [CrossRef]
  26. Lind-Nordgren, E.; Goransson, P. Optimising open porous foam for acoustical and vibrational performance. J. Sound. Vib. 2010, 329, 753–767. [Google Scholar] [CrossRef]
  27. Ramamurty, U.; Paul, A. Variability in mechanical properties of a metal foam. Acta. Mater. 2004, 52, 869–876. [Google Scholar] [CrossRef]
  28. Wang, Y.; Zhao, K.; Lu, X.-Y.; Song, Y.-B.; Bennett, G.J. Bio-Inspired Aerodynamic Noise Control: A Bibliographic Review. Appl. Sci. 2019, 9, 2224. [Google Scholar] [CrossRef] [Green Version]
  29. Crupi, V.; Montanini, R. Aluminium foam sandwiches collapse modes under static and dynamic three-point bending. Int. J. Impact. Eng. 2007, 34, 509–521. [Google Scholar] [CrossRef]
  30. Hou, W.H.; Zhu, F.; Lu, G.X.; Fang, D.N. Ballistic impact experiments of metallic sandwich panels with aluminium foam core. Int. J. Impact. Eng. 2010, 37, 1045–1055. [Google Scholar] [CrossRef]
  31. Magnucka-Blandzi, E. Dynamic Stability and Static Stress State of a Sandwich Beam with a Metal Foam Core Using Three Modified Timoshenko Hypotheses. Mech. Adv. Mater. Struct. 2011, 18, 147–158. [Google Scholar] [CrossRef]
  32. Qin, Q.H.; Zheng, X.Y.; Zhang, J.X.; Yuan, C.; Wang, T.J. Dynamic response of square sandwich plates with a metal foam core subjected to low-velocity impact. Int. J. Impact. Eng. 2018, 111, 222–235. [Google Scholar] [CrossRef]
  33. Sahmani, S.; Fattahi, A.M.; Ahmed, N.A. Surface elastic shell model for nonlinear primary resonant dynamics of FG porous nanoshells incorporating modal interactions. Int. J. Mech. Sci. 2020, 165, 16. [Google Scholar] [CrossRef]
  34. Sahmani, S.; Madyira, D.M. Nonlocal strain gradient nonlinear primary resonance of micro/nano-beams made of GPL reinforced FG porous nanocomposite materials. Mech. Based. Design. Struct. Mach. 2021, 49, 553–580. [Google Scholar] [CrossRef]
  35. Fan, T. Energy harvesting from a nanopiezoelectric/piezomagnetic sandwich beam with porous properties. J. Sandw. Struct. Mater. 2021, 23, 3280–3302. [Google Scholar] [CrossRef]
  36. Zine, A.; Bousahla, A.A.; Bourada, F.; Benrahou, K.H.; Tounsi, A.; Bedia, E.A.A.; Mahmoud, S.R. Bending analysis of functionally graded porous plates via a refined shear deformation theory. Comput. Concrete. 2020, 26, 63–74. [Google Scholar] [CrossRef]
  37. Sadoughifar, A.; Farhatnia, F.; Izadinia, M.; Talaeitaba, S.B. Nonlinear bending analysis of porous FG thick annular/circular nanoplate based on modified couple stress and two-variable shear deformation theory using GDQM. Steel. Compos. Struct. 2019, 33, 307–318. [Google Scholar] [CrossRef]
  38. Chen, D.; Yang, J.; Kitipornchai, S. Elastic buckling and static bending of shear deformable functionally graded porous beam. Compos. Struct. 2015, 133, 54–61. [Google Scholar] [CrossRef] [Green Version]
  39. Wang, K.F.; Zeng, S.; Wang, B.L. Large amplitude free vibration of electrically actuated nanobeams with surface energy and thermal effects. Int. J. Mech. Sci. 2017, 131, 227–233. [Google Scholar] [CrossRef]
  40. Behera, L.; Chakraverty, S. Recent Researches on Nonlocal Elasticity Theory in the Vibration of Carbon Nanotubes Using Beam Models: A Review. Arch. Comput. Methods. Eng. 2017, 24, 481–494. [Google Scholar] [CrossRef]
  41. Arash, B.; Wang, Q. A review on the application of nonlocal elastic models in modeling of carbon nanotubes and graphenes. Comp. Mater. Sci. 2012, 51, 303–313. [Google Scholar] [CrossRef]
  42. Gurtin, M.E.; Murdoch, A. A continuum theory of elastic material surfaces. Arch. Ration. Mech. Anal. 1975, 57, 291–323. [Google Scholar] [CrossRef]
  43. Gurtin, M.E.; Murdoch, A. Surface stress in solids. Int. J. Solids. Struct. 1978, 14, 431–440. [Google Scholar] [CrossRef]
  44. Wang, K.F.; Wang, B.; Zhang, C. Surface energy and thermal stress effect on nonlinear vibration of electrostatically actuated circular micro-/nanoplates based on modified couple stress theory. Acta. Mech. 2017, 228, 129–140. [Google Scholar] [CrossRef]
  45. Mindlin, R.D. Second gradient of strain and surface tension in linear elasticity. Int. J. Solids. Struct. 1965, 1, 417–438. [Google Scholar] [CrossRef]
  46. Mindlin, R.D. Micro-structure in linear elasticity. Arch. Ration. Mech. Anal. 1964, 1, 16. [Google Scholar] [CrossRef]
  47. Aifantis, E.C. On the role of gradients in the localization of deformation and fracture. Int. J. Eng. Sci. 1992, 30, 1279–1299. [Google Scholar] [CrossRef]
  48. Lam, D.C.C.; Yang, F.; Chong, A.C.M.; Wang, J.; Tong, P. Experiments and theory in strain gradient elasticity. J. Mech. Phys. Solids. 2003, 51, 1477–1508. [Google Scholar] [CrossRef]
  49. Eringen, A.C. Nonlocal Polar Elastic Continua. Int. J. Eng. Sci. 1972, 10, 1–16. [Google Scholar] [CrossRef]
  50. Eringen, A.C. On differential equations of nonlocal elasticity and solutions of screw dislocation and surface waves. J. Appl. Phys. 1983, 54, 4703–4710. [Google Scholar] [CrossRef]
  51. Eltaher, M.A.; Khater, M.E.; Emam, S.A. A review on nonlocal elastic models for bending, buckling, vibrations, and wave propagation of nanoscale beams. Appl. Math. Model. 2016, 40, 4109–4128. [Google Scholar] [CrossRef]
  52. Ghayesh, M.H.; Farajpour, A. A review on the mechanics of functionally graded nanoscale and microscale structures. Int. J. Eng. Sci. 2019, 137, 8–36. [Google Scholar] [CrossRef]
  53. Thai, H.T.; Vo, T.P.; Nguyen, T.K.; Kim, S.E. A review of continuum mechanics models for size-dependent analysis of beams and plates. Compos. Struct. 2017, 177, 196–219. [Google Scholar] [CrossRef]
  54. Lim, C.W.; Zhang, G.; Reddy, J.N. A higher-order nonlocal elasticity and strain gradient theory and its applications in wave propagation. J. Mech. Phys. Solids. 2015, 78, 298–313. [Google Scholar] [CrossRef]
  55. Sahmani, S.; Fattahi, A.M.; Ahmed, N.A. Analytical treatment on the nonlocal strain gradient vibrational response of postbuckled functionally graded porous micro-/nanoplates reinforced with GPL. Eng. Comput. 2020, 36, 1559–1578. [Google Scholar] [CrossRef]
  56. Lu, L.; Guo, X.; Zhao, J. A unified size-dependent plate model based on nonlocal strain gradient theory including surface effects. Appl. Math. Model. 2019, 68, 583–602. [Google Scholar] [CrossRef]
  57. Sahmani, S.; Aghdam, M.M.; Rabczuk, T. A unified nonlocal strain gradient plate model for nonlinear axial instability of functionally graded porous micro/nano-plates reinforced with graphene platelets. Mater. Res. Express. 2018, 5, 045048. [Google Scholar] [CrossRef]
  58. Sharifi, Z.; Khordad, R.; Gharaati, A.; Forozani, G. An analytical study of vibration in functionally graded piezoelectric nanoplates: Nonlocal strain gradient theory. Appl. Math. Mech Engl. 2019, 40, 1723–1740. [Google Scholar] [CrossRef] [Green Version]
  59. Wang, D. Vibration and Sensitivity Analysis of a Beam With a Lumped Mass of Translational and Rotary Inertias. J. Vib. Acoust. 2012, 134, 034502. [Google Scholar] [CrossRef]
  60. Xu, H.-B.; Zhang, C.-W.; Li, H.; Tan, P.; Ou, J.-P.; Zhou, F.-L. Active mass driver control system for suppressing wind-induced vibration of the Canton Tower. Smart. Struct. Syst. 2014, 13, 281–303. [Google Scholar] [CrossRef]
  61. Xu, H.; Zhang, C.; Li, H.; Ou, J. Real-time hybrid simulation approach for performance validation of structural active control systems: A linear motor actuator based active mass driver case study. Struct. Control. Health Monit. 2014, 21, 574–589. [Google Scholar] [CrossRef]
  62. Swaminadham, M.; Michael, A. A note on frequencies of a beam with a heavy tip mass. J. Sound. Vib. 1979, 66, 144–147. [Google Scholar] [CrossRef]
  63. Chang, C.H. Free Vibration of a Simply Supported Beam Carrying a Rigid Mass at the Middle. J. Sound. Vib. 2000, 4, 733–744. [Google Scholar] [CrossRef]
  64. Low, K.H. A comparative study of the eigenvalue solutions for mass-loaded beams under classical boundary conditions. Int. J. Mech. Sci. 2001, 43, 237–244. [Google Scholar] [CrossRef]
  65. Liu, H.; Xu, T.; Huang, Z.; Chen, D. Parametric design for a piezoelectric cantilever carrying oscillators to harvest multi-frequency vibration energy. Int. J. Appl. Elect. Mech. 2013, 41, 389–405. [Google Scholar] [CrossRef]
  66. Sun, Y.; Song, Z.; Ma, W.; Li, F. Influence mechanism of lumped masses on the flutter behavior of structures. Aerosp. Sci. Technol. 2021, 111, 106524. [Google Scholar] [CrossRef]
  67. Chen, D.; Yang, J.; Kitipornchai, S. Free and forced vibrations of shear deformable functionally graded porous beams. Int. J. Mech. Sci. 2016, 108, 14–22. [Google Scholar] [CrossRef] [Green Version]
  68. Chen, D.; Kitipornchai, S.; Yang, J. Nonlinear free vibration of shear deformable sandwich beam with a functionally graded porous core. Thin. Wall. Struct. 2016, 107, 39–48. [Google Scholar] [CrossRef]
  69. Heavey, P.; Whitney, C. RMS measuring principles in the application of protective relaying and metering. 57 Ann. C Prot. Rel. En. 2004, pp, 469–489. [Google Scholar] [CrossRef]
  70. Lu, L.; Guo, X.; Zhao, J. Size-dependent vibration analysis of nanobeams based on the nonlocal strain gradient theory. Int. J. Eng. Sci. 2017, 116, 12–24. [Google Scholar] [CrossRef]
  71. Masana, R.; Daqaq, M.F. Relative performance of a vibratory energy harvester in mono- and bi-stable potentials. J. Sound. Vib. 2011, 330, 6036–6052. [Google Scholar] [CrossRef]
Figure 1. Sketch of a piezoelectric energy harvester with a simply supported nanobeam settled on base.
Applsci 11 11787 g001
Figure 2. Material constants of three typical distributions.
Applsci 11 11787 g002
Figure 3. Mathematical modeling process diagram.
Applsci 11 11787 g003
Figure 4. Variation of the dimensionless natural frequency ( ( ω n L 2 / h t ) 12 ρ max / C max ) with the dimensionless axial load ( P L 2 / ( π 2 b B 11 ) ) compared with Ref. [71].
Applsci 11 11787 g004
Figure 5. Effect of the lumped mass on the natural frequency ( ( ω n L 2 / h t ) 12 ρ max / C max ) for distribution 1 ( κ 0 = 0 , e 0 a = 0.1 h t , l = 0.2 h t , m s = 0 ).
Applsci 11 11787 g005
Figure 6. Effects of the nonlocal parameter and strain gradient constant on the natural frequency ( ( ω n L 2 / h t ) 12 ρ max / C max ) and buckling load for distribution 1 ( κ 0 = 0 , m s = 0 ).
Applsci 11 11787 g006
Figure 7. Dimensionless amplitude-excitation frequency curves for different axial load at prebuckling state ( P P c r , m s = 0 , R = 1 k Ω , κ 0 = 0 for distribution 1).
Applsci 11 11787 g007
Figure 8. Dimensionless root mean square voltage output-excitation frequency curves for different axial loads at prebuckling state ( P P c r , m s = 0 , R = 1 k Ω , W 0 = 0.01 h t , κ 0 = 0 for distribution 1).
Applsci 11 11787 g008
Figure 9. Dimensionless vibration amplitude-excitation frequency curves for different axial load at postbuckling state ( P P c r , m s = 0 , R = 1 k Ω , W 0 = 0.01 h t , κ 0 = 0 for distribution 1).
Applsci 11 11787 g009
Figure 10. Dimensionless root mean square voltage output-excitation frequency curves for different axial load at postbuckling state ( P P c r , m s = 0 , R = 1 k Ω , W 0 = 0.01 h t , κ 0 = 0 for distribution 1).
Applsci 11 11787 g010
Figure 11. Dimensionless resonance amplitude ( W max / W 0 ) – axial load ( 12 L 2 P π 2 b C max h t 3 ) curves ( m s = 0.5 I 0 L , W 0 = 0.01 h t , κ 0 = 0.5 , R = 1 k Ω ).
Applsci 11 11787 g011
Figure 12. Dimensionless optimal root mean square voltage output ( a 33 e 311 V r m s W max )-axial load ( 12 L 2 P π 2 b C max h t 3 ) curves ( m s = 0 . 5 I 0 L , W 0 = 0.01 h t , κ 0 = 0.5 , R = 1 k Ω ).
Applsci 11 11787 g012
Figure 13. Dimensionless natural frequency ( ( ω n L 2 / h t ) 12 ρ max / C max )-Porosity coefficient ( κ 0 ) curves ( m s = 0 . 5 I 0 L , W 0 = 0.01 h t , R = 1 k Ω , P = 0 ).
Applsci 11 11787 g013
Figure 14. Dimensionless optimal root mean square voltage output ( a 33 e 311 V r m s W max ) – porosity coefficients ( κ 0 ) curves ( m s = 0 . 5 I 0 L , W 0 = 0.01 h t , R = 1 k Ω , P = 0 ).
Applsci 11 11787 g014
Figure 15. Dimensionless amplitude ( W max / W 0 ) – excitation amplitude ( W 0 ) curves for linear/non-linear vibration and different porosity coefficients ( κ 0 ) ( m s = 0 , R = 1 k Ω , P = 0 for distribution 1).
Applsci 11 11787 g015
Figure 16. Dimensionless root mean square voltage output ( a 33 e 311 V r m s W max ) – excitation amplitude ( W 0 ) curves for linear/nonlinear vibration and different porosity coefficients ( κ 0 ) ( m s = 0 , R = 1 k Ω , P = 0 for distribution 1).
Applsci 11 11787 g016
Figure 17. Effect of the total beam thickness on the dimensionless RMS voltage output with or without considering the flexoelectric effect ( m s = 0 , P = 0 , R = 1 k Ω , κ 0 = 0.5 , W 0 = 0.01 h t for distribution 1).
Applsci 11 11787 g017
Figure 18. Effect of the ratio of the piezoelectric layer thickness to the total beam thickness on the dimensionless RMS voltage output ( h t = 3 × 10 4 m , m s = 0 , P = 0 , R = 1 k Ω , κ 0 = 0.5 , W 0   = 0.01 h t for distribution 1).
Applsci 11 11787 g018
Table 1. Comparison of the natural frequencies ( ( ω n L 2 / h t ) 12 ρ max / C max ) with available date with consideration of nonlocal strain gradient ( L = 50 nm, h t = 1 nm).
e 0 a   ( nm ) l = 0l = 0.5hL = h
0Lu et al. [70]9.86809.87289.8874
Present9.86999.87479.8893
0.5Lu et al. [70]9.86319.86809.8826
Present9.86509.86999.8844
1.0Lu et al. [70]9.84869.85349.8680
Present9.85049.85539.8699
1.5Lu et al. [70]9.82449.82939.8438
Present9.82639.83129.8457
2.0Lu et al. [70]9.79109.79589.8103
Present9.79289.79779.8121
Publisher’s Note: MDPI stays neutral with regard to jurisdictional claims in published maps and institutional affiliations.

