Abstract
In order to suppress the cavitation of an airfoil under random operating conditions, a deformable covering was constructed in the cavitation prone area of the NACA0012 airfoil. By sensing the pressure difference between the inner and outer sides of the airfoil, the covering of the airfoil can be changed adaptively to meet the requirement of suppressing random cavitation of the airfoil. The simulation results show that the cavitation influence range of the airfoil with a shape memory alloy covering can be reduced by more than 70%, and the cavitation is well reduced and suppressed. Moreover, the backflow near the wall of the airfoil was reduced under random working conditions. When the maximum bulge deformation of the covering was between 3–6 mm, the airfoil produced a cavitation range only on the covering surface of the airfoil, and there was no cavitation erosion on other parts. This method with locally variable airfoil to suppress cavitation provides a good reference value for other hydraulic machinery to suppress cavitation.
1. Introduction
Cavitation flow is a complex multiphase turbulence, including phase transition, flow separation and multi-scale vortex structure. Cavitation often occurs at the low-pressure surface of a flow passage component (such as the suction surface of a pump or the lifting surface of marine propeller [1,2,3]). It is the main cause of performance deterioration, vibration, noise, and even surface erosion of underwater equipment [4,5,6].
In recent years, with the rapid development of computers, a numerical simulation method has provided important assistance for complex experiments, which has become the key technology for researchers to use to analyze flow fields. CFD technology has become very common to study the inherent laws and mechanism of fluid movement. V Ryzhenkov [7] analyzed the time-averaged velocity field and fluctuations of annular jet flow, which proved that the re-circulation region was accompanied by low-frequency oscillations. Wei Zhang [8] carried out numerical simulation of hydrofoil flow; he used a finite mass transfer model of cavitation to capture the condensation shock wave, and the three-dimensional process of the shock wave could be clearly observed in the simulation. Bhatt and Mahesh [9] used compressible large eddy simulation (LES) to simulate cavitation on the same geometry of Ganesh et al. [10]. They found that the results were in good agreement with the experimental results, which confirmed the existence of bubble shock propagation and the effect of compressibility. Ku Garam [11] developed a numerical method to research the tip vortex cavitation and flow noise.
In terms of cavitation inhibition, many scholars inhibit cavitation by adding inducers [12], modifying blade shape, size [13,14], and other special methods, such as blade gap jet [15,16,17], protruding modification [18,19], microtexture surface modification [20], and so on. In addition, scholars have obtained quantitative data about cavitation and turbulence through experiments and high-speed camera observations [21,22,23,24,25]. For example, Jun-ye Li [26] researched the effects of the outlet pressure, the operating temperature, and the installation angle of the two cages on the cavitation and found out the best method to suppress cavitation. Shin Suyong [27] researched the physical characteristics of cavitation initiation, the rotational motion of the tip vortex cavitation flow, and the characteristics of induced noise during vortex development. Choi [28] observed the whole process of cavitation flow, vortex cavitation, tip leakage vortex cavitation, and void formation in a turbine pump inducer. On the basis of the study of blade shape control, and referring to the blade control technology studied by predecessors, a novel NACA airfoil with a covering is proposed to improve the cavitation performance. This new cavitation method can effectively block the re-entry jet to improve the flow field around the cover, and it restrain the development of the low-pressure area. Additionally, it is a good reference for other hydraulic machinery to suppress cavitation.
2. Physical and Mathematical Model
2.1. Geometrical Model and Mesh
Figure 1 shows the modified covering airfoil based on NACA0012. The covering is made of Fe-Mn-Si shape memory alloy, which is set at a cavitation-prone position. Additionally, the constant pressure fluid () is passed into the covering. Under normal working conditions, the internal and external pressure difference does not deform the memory metal within a certain range. However, cavitation of the airfoil occurs under abnormal operating conditions, and under the condition of increasing pressure difference between the inner and outer sides, the center of the memory alloy covering will deform and eventually form an eggshell bulge and cavitation will suppressed by impeding backflow [29].
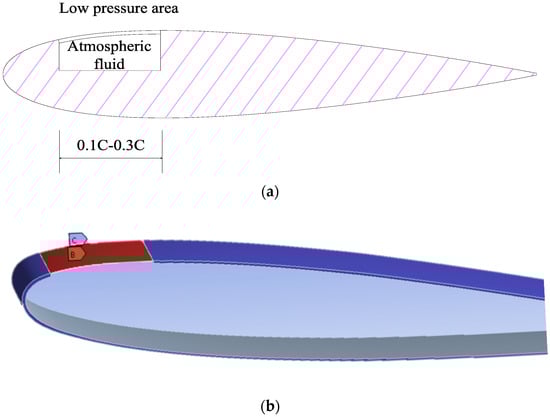
Figure 1.
Schematic diagram of improved covering airfoil. (a) The cross-sectional view of the airfoil and the variable area of the airfoil. (b) 3D diagram of a variable airfoil.
According to the literature and the research results of other experts and scholars on multiphase flow models, the Euler–Euler model allows the simulation of multiple independent and interacting phases; that is, the interaction between the cavitation bubble and the liquid can be simulated more accurately. Therefore, the Euler model is adopted as a multiphase flow model for simulation in this manuscript.
2.2. Cavitation Model and Turbulence Model
In view of the research results [30,31], for the commonly used Smagorinsky model of the LES method and the standard SST model based on the RANS method, the cavitation model of the viscosity-modified SST model can accurately predict the cavitation shedding frequency and simulates the return jet at the wake of the hydrofoil (which is the main cause of cavitation shedding). For the turbulence model, it is necessary to calculate the dense boundary layer with high Reynolds number, and the k-ε turbulence model is suitable for this kind of working condition. Therefore, the SST cavitation model and the k-ε turbulence model are used for numerical simulation. The vaporization rate and liquefaction rate derived from the Rayleigh–Plesset equation in the Schnerr–Sauer model are shown in Formulas (1) and (2), respectively, and the volume fraction of gas phase () is shown in Formula (3).
Furthermore, we modify the turbulent viscosity coefficient in the SST k-ε model, and its expression is shown in Formulas (4)–(6).
In the above formula, RB is the bubble radius; is the density of gas nuclei; are local pressure and saturated vapor pressure, respectively; , , are mixed phase density, liquid phase density and gas phase density, respectively; is turbulent viscosity; and and are turbulent kinetic energy and dissipation rate.
3. Settings for Calculation
3.1. Flow Field Calculation Settings
In most of the simulation studies by experts and scholars, the 2D flow mode is mostly used in the researches of NACA airfoils. Compared with 3D simulations, the computational resources required are much lower and the calculation time can be saved. However, there is a significant difference between 2D and 3D simulations for most flow conditions [32]. In the real world, there are also some special turbulences such as flow around a cylinder, a three-dimensional vortex, and so on. There are significant inherent differences between 2D and 3D simulation predictions. After comprehensive consideration, this simulation is based on Ansys 2020R2 for 3D modeling, and the SST cavitation model and k-ε turbulence model are used to simulate the flow field.
The calculation domain is shown in Figure 2. The airfoil is located at the center of the upper and lower boundaries, with the head of the airfoil being 3C away from the inlet edge. The upper and lower boundaries are 2.5C, respectively, and the outlet edge is 6C away from the trailing edge. The geometric parameters of airfoil are chord length C = 1 m and incoming flow angle . The cavitation number is a common standard to measure the severity of airfoil cavitation, and it is also commonly used to identify different cavitation conditions.
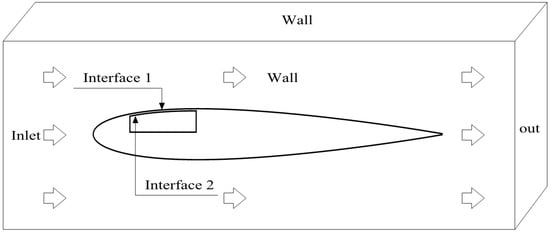
Figure 2.
NACA airfoil calculation domain diagram.
The quality and quantity of the mesh have a significant influence on the calculation results, so the structured mesh was used in the hydrofoil calculation domain, and the mesh around the foil was encrypted. In addition, we carried out a grid-independent analysis and evaluated the cavitation number of airfoils according to Formula (7). The results are shown in Table 1.

Table 1.
Mesh independence test.
In the formula, is the inlet pressure, saturated vapor pressure = 3540 Pa, is the velocity of incoming flow at infinity. Therefore, when the boundary conditions are not changed, the cavitation number will not change, and it is used to evaluate the mesh independence.
It can be seen from Table 1 that the difference between the cavitation number and the number from Case A2 to Case A4 is less than 0.2%. Considering the time limitation, the Case A2 mesh is chosen for simulation.
3.2. Solid Field Calculation Setting
The fluid–structure coupling surface is set on the front and back of the covering, and the flow field data is introduced into the solid field by pressure (as shown Figure 3). Because the Fe-Mn-Si metal is a metallic material with memory properties, it is necessary to define the material properties in Ansys2020R2. Considering the need for a certain amount of tensile strength and ductility, silicone rubber is used as the base material because it has similar properties, and some parameters are modified: elastic modulus , Poisson’s ratio , and tensile strength . In addition, because the memory metal has good toughness and does not fold easily, the airfoil tail was rounded. Additionally, the maximum deformation of the covering can be changed by the internal and external pressure of the covering and the thickness of the covering, when the pressure difference is 100 Mpa and the thickness is 1 mm as the basic parameter of deformation, the deformation of the memory metal is shown in Figure 3. Then, the internal pressure is adjusted to produce airfoil with different degrees of bulge. The airfoil models with different degrees of bulge were derived and calculated for the same operating conditions and compared with the original flow field.
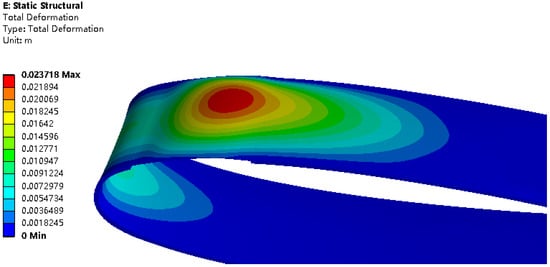
Figure 3.
Adaptive change nephogram of airfoil structure in cavitation area.
4. Results and Discussion
4.1. Cavitation Nephogram Discussion
Figure 4a shows the cavitation nephogram of original airfoil, and Figure 4b,d shows the cavitation nephogram of the airfoil with convexity of 1 mm, 3 mm, and 6 mm, respectively. The cavitation bubbles of the original airfoil are tight against the upper surface and extend in the direction of the oncoming flow, which accounts for about 2/3 of the chord length of the airfoil, and the upper surface of the airfoil is heavily cavitated. Compared with the original airfoil, it is found that the cavitation range of airfoil with maximum variable of 1 mm is obviously reduced, the main body of the cavitation area is inverted trapezoid, and there is partial vortex cavitation at the edge of the airfoil, which is mainly caused by the initial protrusion of the covering in the middle of the deformation. The cavitation area of airfoil with convex degree of 3 mm is further reduced to about 1/4 of the upper surface. The cavitation deviation caused by the height difference still exists, but it decreases with the increase of convex degree. As for the airfoil with a maximum variable of 6 mm, cavitation occurs only at the raised position of the covering, and cavitation and the low-pressure area are no longer generated elsewhere on the upper surface. Moreover, the cavitation scale of the covering is significantly reduced, which indicates that the bulge of the covering plays an effective role in inhibiting the development of cavitation.
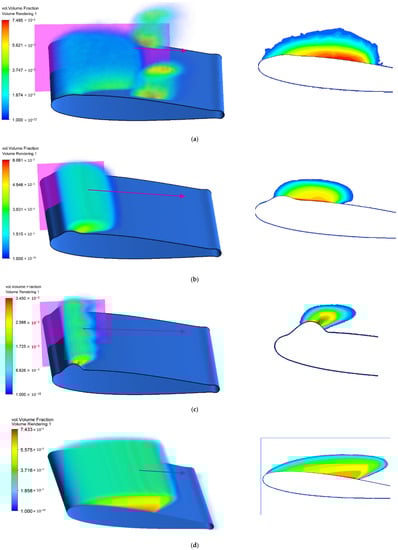
Figure 4.
Effect of local deformation on airfoil cavitation suppression. (a) Cavitation nephogram of airfoil with maximum variable of 1 mm. (b) Cavitation nephogram of airfoil with maximum variable of 3 mm. (c) Cavitation nephogram of airfoil with maximum variable of 6 mm. (d) Cavitation nephogram of original airfoil.
4.2. Pressure Graph Discussion
The pressure in the flow field of the airfoil directly determines the cavitation characteristics of the airfoil. In this section, the coordinates and pressure points of one hundred points on the upper surface are taken and compared. Figure 5 shows the pressure curves for upper surface of the original airfoil and the airfoil with different protuberances. The low-pressure area of the original airfoil starts from 0.03C (at the head of the airfoil) to 0.6C (in the middle of the airfoil). This part of the low-pressure area is the cause of cavitation generation and development. Additionally, it is consistent with the cavitation nephogram. The total length of the low-pressure area of the airfoil with a maximum variable of 3 mm is about 0.4C, which is 30% smaller than that of the control group. Additionally, the pressure curve produces some fluctuations at 0.05C, which are caused by the sheet cavitation in front of the bulge. After the degree of convexity of the covering from 1 mm to 3 mm, it obstructs the flow and forms a small high-pressure zone at 0.1C, and the total length of the low-pressure area is about 0.25C, which is about 61% less than the control group. For the airfoil with maximum variable of 6 mm, the fluctuations still exists at 0.05C, but due to the increase in the bulge, the pressure does not reach the critical pressure of cavitation, so the sheet cavitation before the bulge no longer occurs. It can be observed from the figure that the low pressure area is distributed in 0.1–0.2C, the cavitation range is reduced by more than 80%, and it is completely within the covering range, so the cavitation is far away from the wall and the cavitation collapse will not cause erosion damage to the near wall of the airfoil.
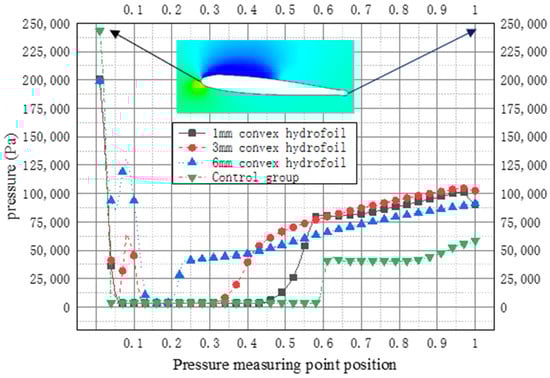
Figure 5.
Pressure graph.
4.3. Flow Field and Re-Entrant Jet Discussion
The re-entrant jet is similar to the reflux in boundary layer separation. According to the experimental determination of reference [23], it was found that the frequency of the re-entrant jet was essentially the same as the volume change frequency of cavitation, which caused the cavitation bubbles at the back of the cavitation area to burst and collapse, eventually forming cloud cavitation. Therefore, this section analyzes the flow field and the return jet, which intercepted the velocity vector diagram of the original airfoil and the airfoil with different protruding degrees on the upper surface of the zonal 1.5C section, as shown in Figure 6a. It is obvious that there is a re-entrant jet in the original airfoil, which leads to the cavitation shedding and cloud cavitation phenomena. It can be seen that the re-entry jet is still present on the upper surface of the airfoil with a maximum variable of 1 mm. In addition, the three-dimensional flow field at 0.05C of the airfoil with the degree of bulge of 1 mm is found to be intensified, and due to the bulge in the middle, the thickness of the bulge on both sides is slightly lower than the sides, the fluid in the middle will flow to both sides, and the flow on both sides will be greater than the flow rate in the middle. This causes the fluid on both sides to flow to the middle and continuously develop to the front of the airfoil and eventually form a vortex (as shown in Figure 6b); the vortex cavitation at the edge of the airfoil (show in Figure 4a) is also caused by this phenomenon.
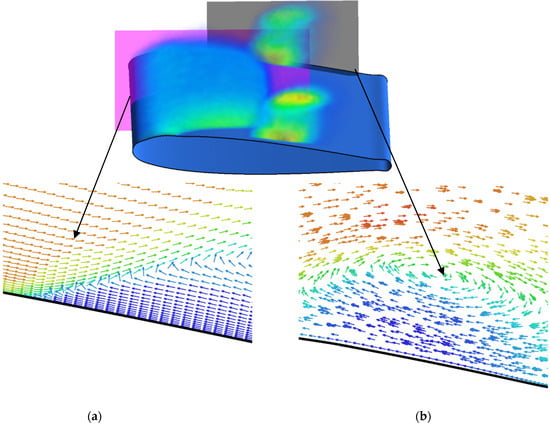
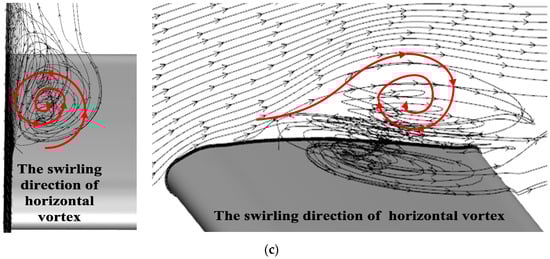
Figure 6.
Flow field on the upper surface of airfoil with maximum variable of 1 mm. (a) Velocity vector diagram of airfoil with maximum variable of 1 mm at the z = 1.5C section. (b) Velocity vector diagram of airfoil with maximum variable of 1 mm at the z = 0.05C section. (c) Streamline diagram.
With the increase in the degree of bulge, the re-entrant jet decreases gradually, and when the degree of bulge is 3 mm, the high-speed fluid is blocked, and there is no reverse flow phenomenon (as shown in Figure 7a). When the degree of bulge reaches 6 mm, reverse flow is found again near the bulge (as shown in Figure 7b). This is due to the fact that the high-speed water flow in front of the bulge is mostly blocked, and the backflow is completely blocked by the bulge, so cavitation does not occur.
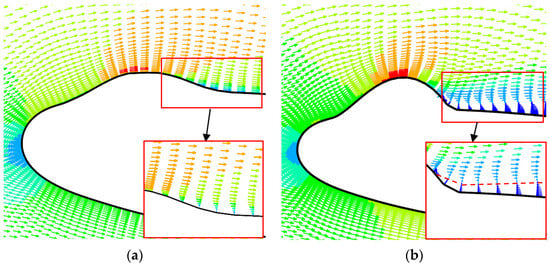
Figure 7.
Velocity vector diagram on the upper surface of airfoil. (a) Velocity vector diagram of airfoil with maximum variable of 3 mm at the z = 1.5C section. (b) Velocity vector diagram of airfoil with maximum variable of 6 mm at the z = 1.5C section.
To sum up, from the point of view of cavitation suppression, the blocking effect of memory metal covering on the development of cavitation is significant. However, the design purpose of airfoil is to provide lift, so considering cavitation alone will lead to the increase in airfoil resistance, and the lift-drag ratio and cavitation resistance should be considered to ensure the mechanical properties of the airfoil. The maximum bulge deformation of the covering is controlled between 3 and 6 mm by adjusting the internal fluid pressure and thickness, which can hinder the development of cavitation under abnormal operating conditions, and it reduce the erosion damage to the wall by cavitation, and it ensures that the normal operation of machinery does not produce negative effects such as vibration and noise. After operating conditions are improved, the memory metal is restored by heating and other methods to ensure the normal operation of machinery.
5. Conclusions
(1) The NACA airfoil with deformable covering effectively hinders the re-entrant jet, and it improves the flow field around the covering and suppresses the development of the low-pressure area.
(2) With the increase in the deformation degree of the deformable airfoil, the cavitation occurrence area is concentrated to the surface of the covering, and the influence range of different degrees of deformation on the cavitation is reduced by 30% to 80%, and the degree of cavitation is reduced by 70%, indicating that this method effectively suppresses the development of cavitation.
(3) The optimal maximum deformation of the deformable covering is between 3 mm and 6 mm, which can hinder the development of cavitation and reduce the erosion of cavitation on the wall under abnormal working conditions, ensuring that the normal operation of machinery does not produce negative effects such as vibration and noise.
Author Contributions
Conceptualization, W.S. and Z.X.; methodology, Z.S.; software, Z.S.; validation, W.S., Z.X. and Y.Y.; formal analysis, Q.Z.; investigation, Q.Z.; resources, W.S.; data curation, L.T.; writing—original draft preparation, Z.S.; writing—review and editing, Z.S.; visualization, Q.Z.; supervision, Z.X.; project administration, L.T.; funding acquisition, W.S. All authors have read and agreed to the published version of the manuscript.
Funding
This research was funded by the National Key Research and Development Project of China (no. 2019YFB 2005300), National High-Tech Ship Scientific Research Project of China (no. MIIT [2019] 360), National Natural Science Foundation of China (No. 51979138), National Natural Science Foundation of China (No. 52109106), General project of natural science research in colleges and universities of Jiangsu Province (No. 19KJB470029), and Jiangsu Water Conservancy Science and Technology Project (No. 2019038).
Data Availability Statement
Data on the analysis and reporting results during the study can be obtained by contacting the authors.
Conflicts of Interest
The authors declare no conflict of interest.
References
- Lin, P.; Hu, D.; Lin, Z.J.; Liu, M.Q.; Tang, C.L.; Wang, S. The mechanism of joint effects of axial-flow pump cavitation and sediment wear. Adv. Mech. Eng. 2020, 12, 1687814020923066. [Google Scholar] [CrossRef]
- Xie, Z.; Shi, W.; Zheng, Y.; Tan, L.; Tian, Q.; Cao, Y.; Ge, X. Simulation investigation on impact damage characteristics of metal plate by cavitating bubble micro-jet water hammer. Eng. Fail. Anal. 2020, 115, 783–793. [Google Scholar] [CrossRef]
- Wang, G.; Wu, Q.; Huang, B. Dynamics of cavitation–structure interaction. Acta Mech. Sin. 2017, 33, 685–708. [Google Scholar] [CrossRef]
- Shi, Z.; Xie, Z.; Shi, W.; Zhang, Q.; Tan, L. Numerical Investigation on Cavitation Suppression of Microchannel over a NACA0012 Hydrofoil. Shock. Vib. 2021, 2021. [Google Scholar] [CrossRef]
- Huang, B.; Zhao, Y.; Wang, G. Large Eddy Simulation of turbulent vortex-cavitation interactions in transient sheet/cloud cavitating flows. Comput. Fluids 2014, 92, 113–124. [Google Scholar] [CrossRef]
- Xie, Z.; Shi, W.; Tian, Q.; Zheng, Y.; Tan, L. Fatigue Life Assessment and Damage Investigation of Centrifugal Pump Runner. Eng. Fail. Anal. 2021, 124, 105256. [Google Scholar] [CrossRef]
- Ryzhenkov, V.; Mullyadzhanov, R. Direct numerical simulations of the turbulent annular jet with different diameter ratio. J. Phys. Conf. Ser. 2018, 1105, 403–414. [Google Scholar] [CrossRef]
- Zhang, W.; Zhu, B.; Wang, Y.; Xu, H. Numerical simulation of condensation shock in partial cavitating flow on a hydrofoil. J. Hydrodyn. 2020, 32, 128–136. [Google Scholar] [CrossRef]
- Bhatt, M.; Mahesh, K. Numerical investigation of partial cavitation regimes over a wedge using large eddy simulation. Int. J. Multiph. Flow 2020, 122, 103155. [Google Scholar] [CrossRef]
- Ganesh, H.; Mäkiharju, S.A.; Ceccio, S.L. Bubbly shock propagation as a mechanism for sheet-to-cloud transition of partial cavities. J. Fluid Mech. 2016, 802, 37–78. [Google Scholar] [CrossRef]
- Ku, G.; Cheong, C.; Seol, H. Numerical Investigation of Tip-Vortex Cavitation Noise of an Elliptic Wing Using Coupled Eulerian-Lagrangian Approaches. Appl. Sci. 2020, 10, 5897. [Google Scholar] [CrossRef]
- Huan, Y.Y.; Liu, Y.Y.; Li, X.J.; Zhu, Z.C.; Qu, J.T.; Zhe, L.; Han, A.D. Experimental and numerical investigations of cavitation evolution in a high-speed centrifugal pump with inducer. J. Hydrodyn. 2021, 33, 140–149. [Google Scholar] [CrossRef]
- Zhao, W. Elementary analysis of centrifugal pump impeller destruction due to cavitation and sand abrasion. J. Gansu Univ. Technol. 2000, 1, 58–62. (In Chinese) [Google Scholar]
- Yang, C.; Suo, Y.; Zhu, W.; Jiang, Z.; Lao, D. Numerical Investigation of the Internal Flow Field and Redesign of a 30° Backswept Impeller. Power Eng. 2000, 1, 580–584. (In Chinese) [Google Scholar]
- Zhang, R.; Yun, L. Investigation on the effect of slot pulse jet on centrifugal pump performance. Turbomachinery Society of Japan, Korean Society for Fluid Machinery, Chinese Society of Engineering Thermophysics. Int. J. Fluid Mach. Syst. 2018, 11, 139–145. [Google Scholar] [CrossRef]
- Shi, W.; Li, L.; Xu, R.; Wang, B.; Tan, L.; Zhou, L. Effect of blade slotting on radial force of single vane centrifugal pump. J. Drain. Irrig. Mach. Eng. (JDIME) 2020, 38, 865–870, 890. (In Chinese) [Google Scholar]
- Zhao, W.; Lu, J.; Zhao, F. Research on cavitation control of centrifugal pump based on slot jet principle. J. Zhejiang Univ. (Eng. Ed.) 2020, 54, 1785–1794. [Google Scholar]
- Wu, W.; Xiong, Y. A Reshaping Method for Anti-cavitating Hydrofoil Design. J. Shanghai Jiaotong Univ. 2013, 47, 878–883, 888. (In Chinese) [Google Scholar]
- Wu, W.; Xiong, Y.; Qi, W. Cavitation suppression based on airfoil modification. Res. Chin. Ships 2012, 7, 36–40, 45. (In Chinese) [Google Scholar]
- Gonzalez-Avila, S.R.; Nguyen, D.M.; Arunachalam, S.; Domingues, E.M.; Mishra, H.; Ohl, C.D. Mitigating cavitation erosion using biomimetic gas-entrapping microtextured surfaces (GEMS). Sci. Adv. 2020, 6, eaax6192. [Google Scholar] [CrossRef]
- Kang, B.Y.; Kang, S.H. Effect of the number of blades on the performance and cavitation instabilities of a turbo- pump inducer with an identical solidity. J. Mech. Sci. Technol. 2015, 29, 5251–5256. [Google Scholar] [CrossRef]
- Choi, C.H.; Kim, J. Study on the Cavitating Flows in a Turbopump Inducer. J. Propuls. Power 2015, 31, 537–542. [Google Scholar] [CrossRef]
- Liu, Y.; Tan, L. Tip clearance on pressure fluctuation intensity and vortex characteristic of a mixed flow pump as turbine at pump mode. Renew. Energy 2018, 129, 606–615. [Google Scholar] [CrossRef]
- Tan, L.; Yu, Z.; Xu, Y.; Liu, Y.; Cao, S. Role of blade rotational angle on energy performance and pressure fluctuation of a mixed-flow pump. Proc. Inst. Mech. Eng. Part A J. Power Energy 2017, 231, 227–238. [Google Scholar]
- Che, B. Study on Cavitation Mechanism and Passive Control of Hydrofoil Attachment; Zhejiang University: Hangzhou, China, 2019. [Google Scholar]
- Li, J.Y.; Gao, Z.X.; Wu, H.; Jin, Z.J. Numerical Investigation of Methodologies for Cavitation Suppression Inside Globe Valves. Appl. Sci. 2020, 10, 5541. [Google Scholar] [CrossRef]
- Shin, S.; Hong, J.W.; Nagarathinam, D.; Ahn, B.K.; Park, S.G. Tip Vortex Cavitation and Induced Noise Characteristics of Hydrofoils. Appl. Sci. 2021, 11, 5906. [Google Scholar] [CrossRef]
- Kim, S.J.; Choi, Y.S.; Cho, Y.; Choi, J.W.; Kim, J.H. Numerical Analysis of Inter-Blade Vortex Cavitation Characteristics in a Francis Hydro Turbine. In Proceedings of the 2018 Annual Fall Meeting of the Korean Society for New&Renewable Energy, Jeju, Korea, 4–6 April 2018. [Google Scholar]
- Chen, K.; Wan, D. Numerical simulation of hydrofoil cavitation flow based on viscosity modified SST k-ω model. Hydrodyn. Res. Prog. 2019, 34, 224–231. [Google Scholar]
- Yang, D.D.; Yu, A.; Ji, B.; Zhou, J.J.; Luo, X.W. Numerical analyses of ventilated cavitation over a 2-D NACA0015 hydrofoil using two turbulence modeling methods. J. Hydrodyn. 2018, 30, 101–112. [Google Scholar] [CrossRef]
- Wang, X. Theory and Application of Cavitation Bubble and Supercavitation Bubble Flow; National Defense Industry Press: Beijin, China, 2009. [Google Scholar]
- Upadhyay, M.; Seo, M.W.; Naren, P.R.; Park, J.H.; Nguyen, T.D.B.; Rashid, K.; Lim, H. Experiment and multiphase CFD simulation of gas-solid flow in a CFB reactor at various operating conditions: Assessing the performance of 2D and 3D simulations. Korean J. Chem. Eng. 2020, 37, 2094–2103. [Google Scholar] [CrossRef]
Publisher’s Note: MDPI stays neutral with regard to jurisdictional claims in published maps and institutional affiliations. |
© 2021 by the authors. Licensee MDPI, Basel, Switzerland. This article is an open access article distributed under the terms and conditions of the Creative Commons Attribution (CC BY) license (https://creativecommons.org/licenses/by/4.0/).