Article

Synthesis and Characterization of Some Graphene Oxide Powders Used as Additives in Hydraulic Mortars

1
Raluca Ripan Institute of Research in Chemistry, Babes Bolyai University, 30 Fantanele Str., 400294 Cluj Napoca, Romania
2
Department of Molecular Biology and Bio-technology, Faculty of Biology and Geology, Babes Bolyai University, 1 M. Kogalniceanu Street, 400084 Cluj Napoca, Romania
3
Faculty of Economic Sciences, 1 Decembrie 1918 University of Alba Iulia, 15–17 Unirii Street, 510009 Alba Iulia, Romania
*
Authors to whom correspondence should be addressed.
Appl. Sci. 2021, 11(23), 11330; https://doi.org/10.3390/app112311330
Submission received: 12 October 2021 / Revised: 25 November 2021 / Accepted: 26 November 2021 / Published: 30 November 2021

Abstract

:
Various powders of graphene oxide (GO), GO with silver (GO-Ag) and zinc oxide (GO-ZnO) were obtained. The powders were silanized with (3-aminopropyl) triethoxysilane (APTES) aiming to be used, in a future stage, as additives in the hydraulic lime mortars composition. The powders were characterized by Fourier Transform Infrared Spectrometry (FTIR) and Scanning Electron Microscopy (SEM) before and after the silanization process. GO, GO-Ag, GO-Ag-APTES, GO-ZnO and GO-ZnO-APTES powders were also investigated by Thermogravimetric Analysis (TG/DTA) and Ultraviolet–Visible Spectroscopy (UV-Vis). Likewise, the antibacterial effect of powders against five bacterial strains was evaluated. The peaks associated to the functional groups from GO, GO-APTES, GO-Ag, GO-Ag-APTES, GO-ZnO and GO-ZnO-APTES powders were identified by FTIR analysis. The mass losses of powders, analyzed by TG/DTA were lower than those recorded for GO. By UV-VIS analysis, maxima corresponding to the electronic π-π * and n-π * transitions were recorded. SEM images highlighted the lamellar and layered structure of GO, but also the presence of Ag and Zn nanoparticles on the surface of graphene sheets. All these results confirm the presence of Ag/ZnO/APTES on the GO. The antibacterial effect evaluated by recording the diameter of the inhibition zone ranged between 12–22 mm.

1. Introduction

The environmental pollution phenomenon has a significant impact on the construction buildings, especially on the cultural heritage ones, causing important damages, which require complex maintenance or repair interventions, involving significant material and economic cost [1]. Therefore, the development of the new materials capable of providing efficient treatments for the heritage buildings remain an important objective [2].
The literature data reveals that graphene oxide (GO), resulting from the graphite oxidation, is a versatile material, that can be successfully used in several activity fields, such as electronics, environment, biomedicine and why not, in construction [2,3,4]. The functional groups containing oxygen, i.e., hydroxyl (-OH), epoxy (-C-O-C), carbonyl (-C=O), carboxyl (-COOH), which are present both on the surface of GO sheets and on their edges [5,6,7,8], allow the GO functionalization. The silanization of GO, by functionalizing its reactive groups with organosilanes, can lead to an improvement of the properties of the construction materials in which they are introduced [9,10].
According to the literature data, GO also has a good antibacterial activity due to its ability to generate reactive oxygen species (ROS) but also due to the shape edges of the GO sheets, which are able to penetrate the cell membranes of the bacteria, thus leading to their death. Moreover, the functionalization of GO sheets with ZnO might improve the antibacterial effect of the materials in which they are introduced because ZnO generates ROS, while the accumulation of Zn nanoparticles in the cytoplasm can inhibit the cell loads. On the other hand, the addition of the Ag nanoparticles can accelerate the destruction of bacteria causing constant cell membrane damages, leading to increased permeability and disruption of the bacterial DNA replication [11].
The aim of the present study was to synthetize and characterize various powders of graphene oxide (GO), GO combined with silver (GO-Ag) or Zn oxide (GO-ZnO). The powders were silanized with (3-aminopropyl) triethoxysilane (APTES). The non-silanized powders (GO, GO-Ag and GO-ZnO), as well as the silanized ones (GO-APTS, GO-Ag-APTES and GO-ZnO-APTES) were characterized by Fourier Transform Infrared Spectrometry (FTIR) and Scanning Electron Microscopy (SEM) before and after the silanization process. The GO, AG-GO, GO-ZnO, GO-Ag-APTES and GO-ZnO-APTES powders were also investigated by Thermogravimetric Analysis (TG/DTA) and Ultraviolet–Visible Spectroscopy (UV-Vis). Furthermore, the antibacterial activity of all synthesized powders against Streptococcus mutans, Porphyromonas gingivalis, Enterococcus faecalis, Escherichia coli and Staphylococcus aureus was also evaluated.
These materials are intended to be used in a future work as additives for preparing hydraulic mortars with improved adhesion to the original support materials and with antibacterial properties that could be effectively applied for the heritage buildings [12].

2. Materials and Methods

2.1. Materials

The graphite flake and (3-aminopropyl) triethoxysilane (APTES, 99%) ethanol (95%) were purchased from Alfa Aesar, sulphuric acid (H2SO4, 98%), hydrochloric acid (HCl, 35%), and hydrogen peroxide (H2O2, 30%) were supplied by from Chempur, potassium permanganate (KMnO4), sodium nitrate (NaNO3), silver nitrate (AgNO3), sodium hydroxide (NaOH) were purchased from Merck, while polyvinylpyrrolidone (PVP) and toluene (C7H8) were supplied from Sigma Aldrich and PENTA, respectively.
For this study, three batches of graphene oxide (GO) powder were prepared and mixed and then divided into three parts. One part was considered as the control sample, the second part was combined with Ag nanoparticles and the third one with ZnO. The powders were then silanized with APTES.

2.1.1. Synthesis of Graphene GO, GO-Ag and GO-ZnO Powders

Synthesis of Graphene Oxide

The Hummer method may differ depending on the oxidizing agents used to exfoliate the graphite powder. It was started from graphite flakes (10 mesh) and NaNO3 which were mixed in a 2:1 ratio. The powders mixture was added slowly, under continuous stirring in a beaker over 230 cm3 of concentrated H2SO4. The temperature was kept below 5 °C for two hours. Then, KMnO4 was added very slowly over the obtained suspension in a ratio of 3:1 compared to the initial amount of the graphite flakes, maintaining the temperature below 15 °C for the next 30 min. The temperature was raised at 35 °C, and after other 30 min, 460 cm3 of distilled water was added very slowly (in drops) when the temperature raised at 95 °C. After this period of time, 1400 cm3 distilled water were also added. The reaction was completed by adding in droplets 100 cm3 of hydrogen peroxide (H2O2), after which the stirring was switched off and the particles were allowed to settle for 3 h. After filtration, the mixture was washed five times with a 5% HCl solution and then five times with distilled water. After washing and filtration, the obtained precipitate was frozen and then lyophilized obtaining the GO powder [10].

Synthesis of Ag Nanoparticles

Solution A of silver nitrate was prepared by adding 3.4 g of AgNO3 in 20 mL of distilled water. Solution B was prepared by dissolving polyvinylpyrrolidone (1 g), glucose (1 g), and NaOH (1 g) in 60 mL of distilled water. Solution B was heated to 60 °C, under continuous stirring, and then solution A was added dropwise into it. The obtained mixture was stirred for 30 min.

Synthesis of GO-Ag Powder

To obtain GO-Ag powder, we used GO and AgNO3 in a mass ratio of 2:1. An aqueous suspension of 30 cm3 of GO was sonicated for 30 min and was added over the solution of silver nanoparticle previously prepared. The mixture was sonicated for 2 h and then was left to stand, in the dark place until the next day. After that it was filtered and washed repeatedly with distilled water, until a pH value of 5.5–6 was reached. The obtained precipitate was then transferred in a plastic container and placed in a freezer until the next day when it was lyophilized.

Synthesis of GO-ZnO Nanopowder

Two different solutions were prepared as follows: (a) 7.5 g of GO powder was added over 100 cm3 of a distilled water and the mixture was ultra-sonicated for 30 min at maximum speed; (b) ZnO powder (GO: ZnO = 1:20 (w/w)) was added in 750 cm3 of distilled water, over which 15 mL of NaOH (pH 9.5) was added and the mixture was ultrasonicated for 30 min at the maximum speed. The two solutions were combined, and the sonication was continued for another 45 min, after which a magnetic stirring was performed at a temperature of 50 °C. After these steps, the mixture was poured into a larger vessel over an amount of distilled water three times higher. The resulted solution was mixed and left to stand until the next day. At the end, the mixture was filtered and washed repeatedly with distilled water, until a pH of 5.5–6 was reached. The obtained precipitate was distributed in two plastic containers and placed in a freezer until the next day when it was lyophilized.

2.1.2. Silanization of GO, GO-Ag and GO-ZnO Powders

Silanization of lyophilized GO, GO-Ag and GO-ZnO powder was performed with APTES (3-aminopropyl) triethoxysilane silane (APTES) by using the same procedure.
In the first stage, the lyophilized powder of GO was added over toluene (0.1 g GO/40 cm3 toluene) and then sonicated for 30 min. In the second stage, the silane was added (0.1 g GO/1.6 cm3 APTES) after which it was stirred with a magnetic stirrer for 3 h, and then allowed to rest until the next day. Thereafter, the resulting mixture was washed with toluene to remove unreacted APTES and then dried at 50 °C and filtered.

2.2. Characterization Techniques

2.2.1. Fourier Transform Infrared Spectrometry (FT-IR)

ATR-FTIR spectra of the dried powder samples were recorded on FTIR spectrophotometer (Jasco Europe s.r.l. Cremella, Italy) equipped with an ATR (attenuated total reflectance) attachment with horizontal ZnSe crystal (Jasco PRO400S). The spectra resolution was 4 cm−1, and scans were repeated 100 times. The appropriate amount of the samples was placed on the ZnSe crystal and then the FTIR spectrum was measured in the range of 4000–500 cm−1.

2.2.2. Thermogravimetric Analysis (TG/DTA)

The thermal analysis of the samples was performed using a TGA/SDTA 851e-Mettler Toledo Thermogravimeter (Schwerzenbach, Switzerland), in an inert atmosphere, at a speed of 20 °C/minute, in an alumina crucible of 900 µL, using an amount of sample between 10 and 40 mg.

2.2.3. Ultraviolet–Visible Spectroscopy (UV-Vis)

The UV-Vis measurements were performed using an Able Jasco V-750 UV-VIS spectrometer from Jasco Europe s.r.l. Cremella, Italy.

2.2.4. Scanning Electron Microscopy (SEM)

The morphological and structural characteristics of the graphene-containing powders were observed by scanning electron-microscopy (SEM) using the Inspect S (FEI Company, Hillsboro, OR, USA) equipment.

2.2.5. Antibacterial Analysis

The tested microorganisms were Streptococcus mutans ATCC 25175, Porphyromonas gingivalis ATCC 33277, Enterococcus faecalis ATCC 29212, Escherichia coli ATCC 25922 and Staphylococcus aureus ATCC 25923 (from Microbiology Lab, Biology and Geology Faculty, Babes-Bolyai University). Out of each bacterial strain grown for 24 h on Nutrient Agar medium, a dilution with 0.5 McFarland in a sterile saline solution was made.
For the agar-well diffusion method, Petri dishes with Mueller Hinton agar media (Oxoid) were inoculated with each bacterial strain suspension and keept at 37 °C for 20 min to infiltrate. Subsequently, 5 mm diameter wells were carved in the agar using a sterile cut pipette tip (5 agar-wells/Petri dish). From each GO-based powder sample (graphene) an equal quantity was placed in each well so that the well was completely filled.
After 18–24 h incubation at 37 °C, the round area formed around the wells was measured; the larger the diameter of the inhibition zone, the higher the sensibility of bacteria to that graphene powder [13]. Each experiment was performed three times and the mean value was calculated.

3. Results and Discussions

The characterization methods were used to demonstrate both the interaction of Ag/ZnO with GO powder, but also the functionalization of these powders with APTES and their antibacterial effect.

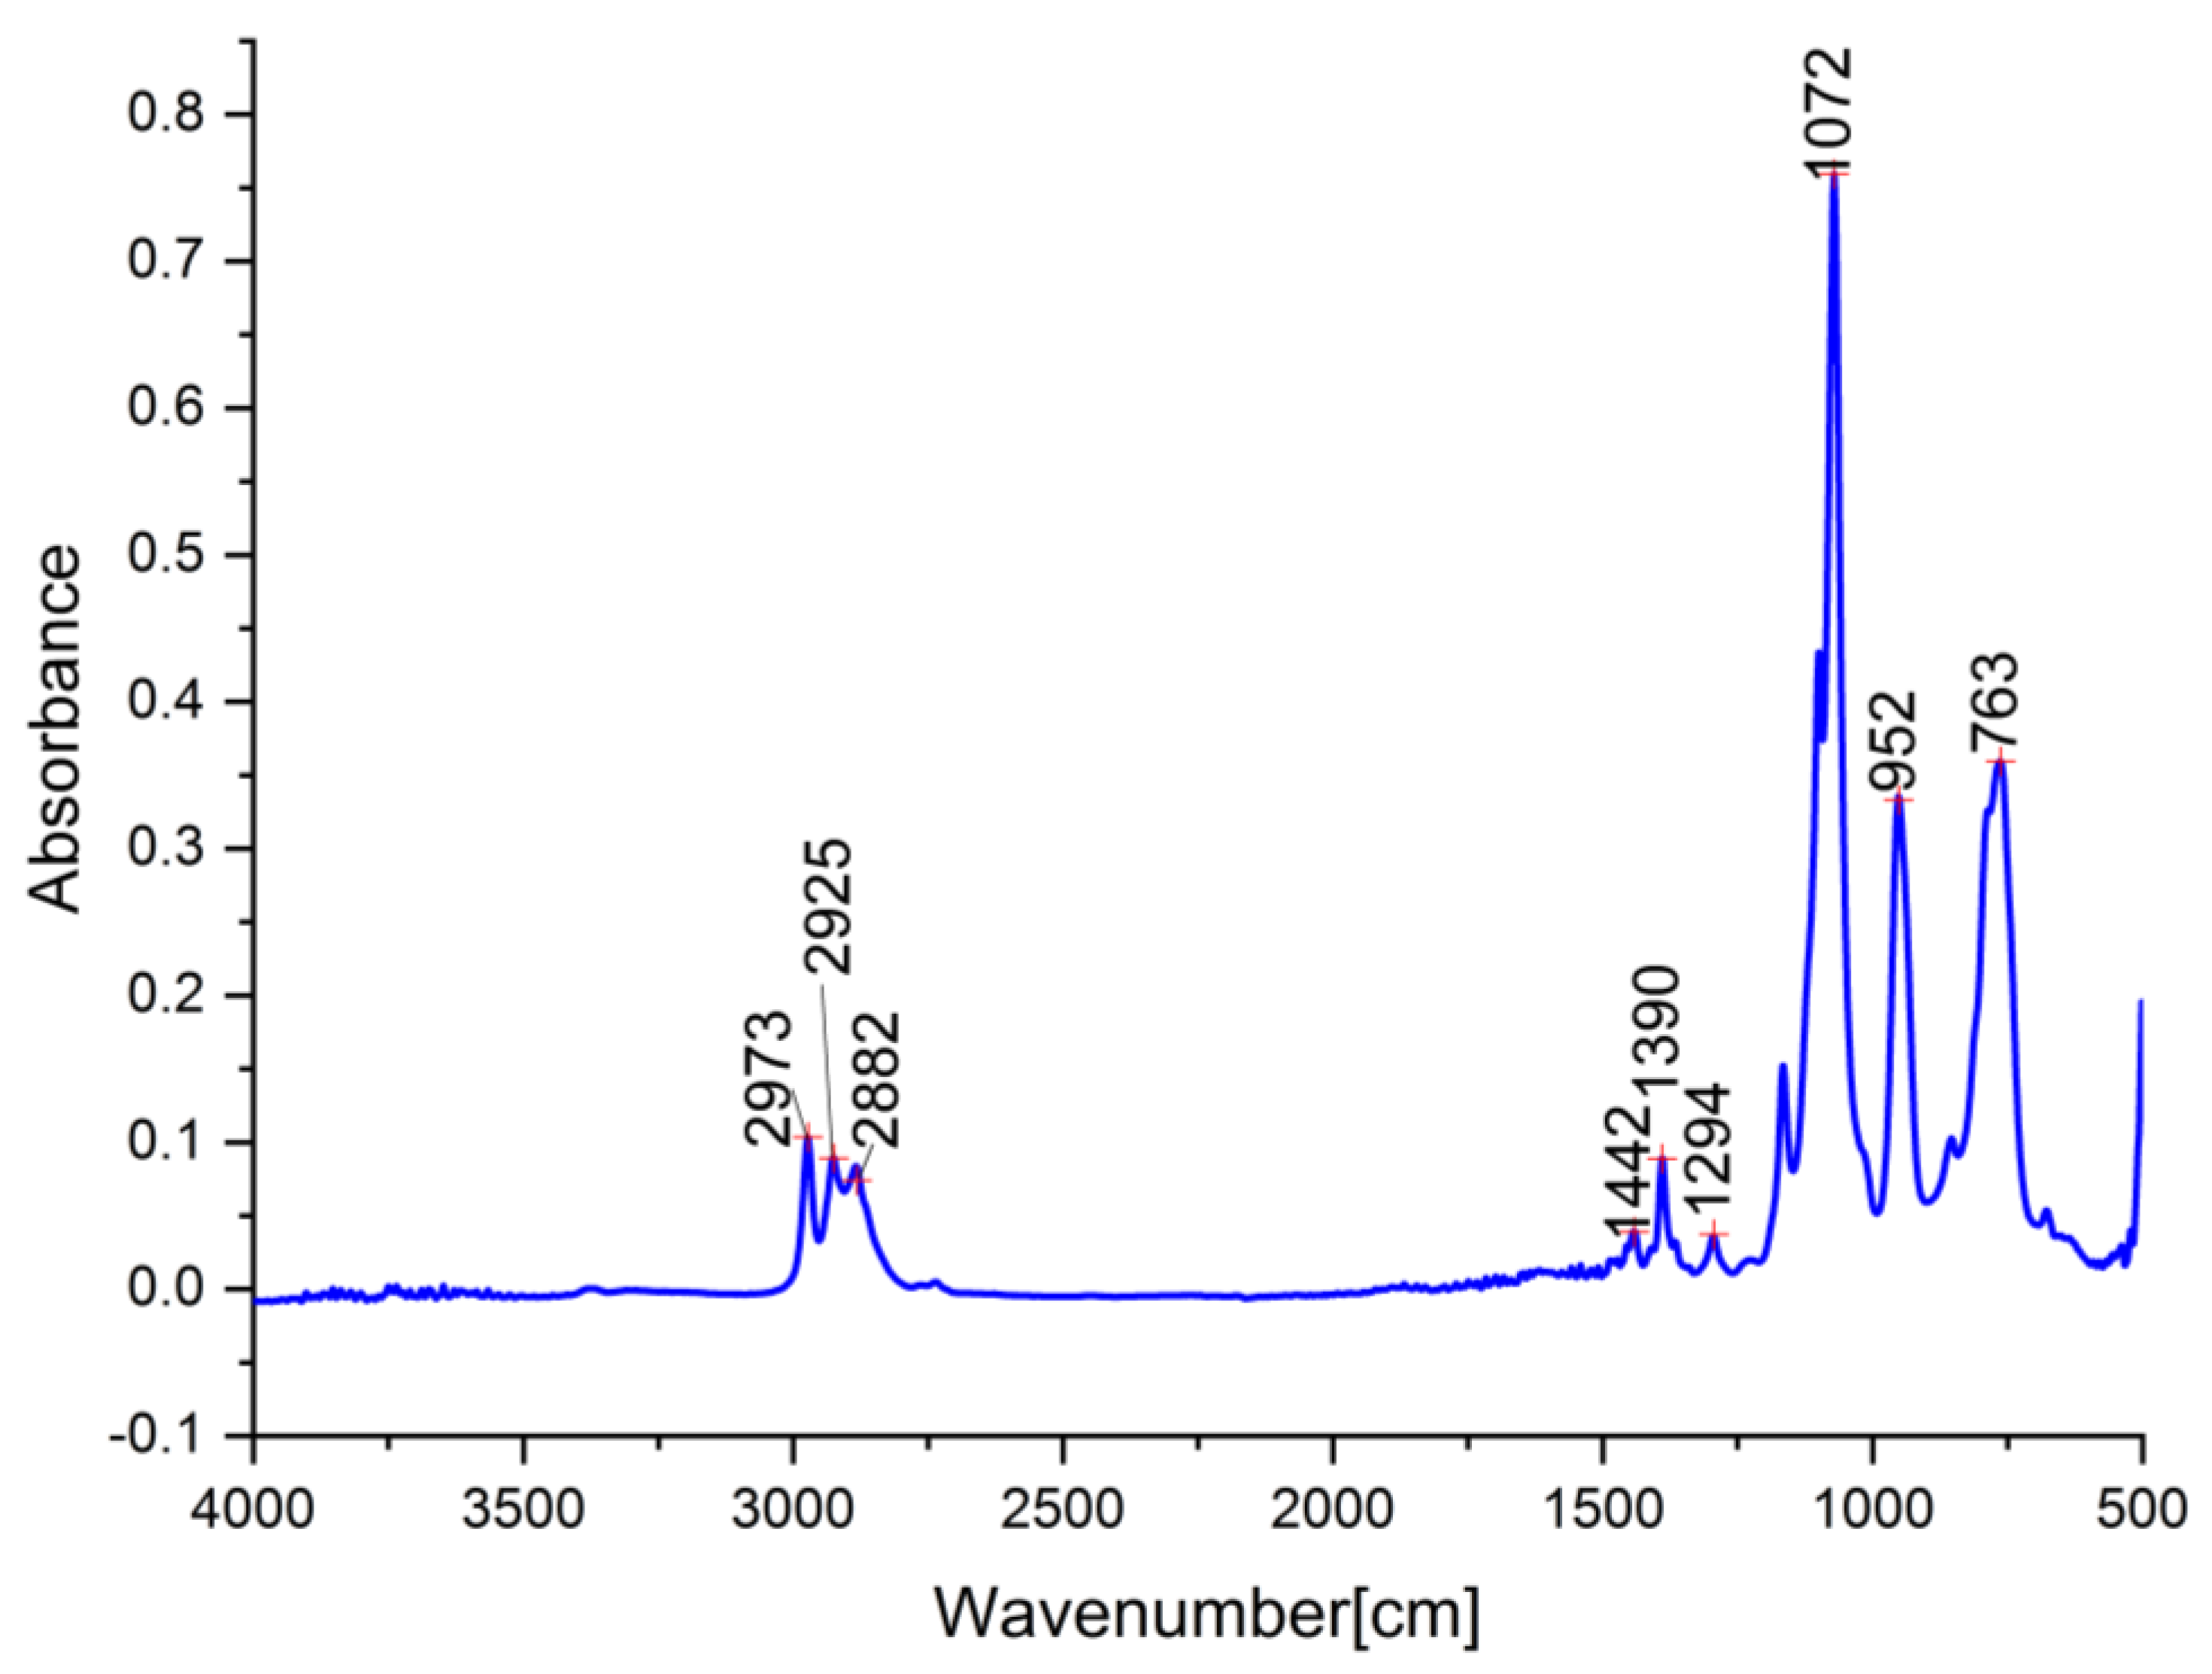
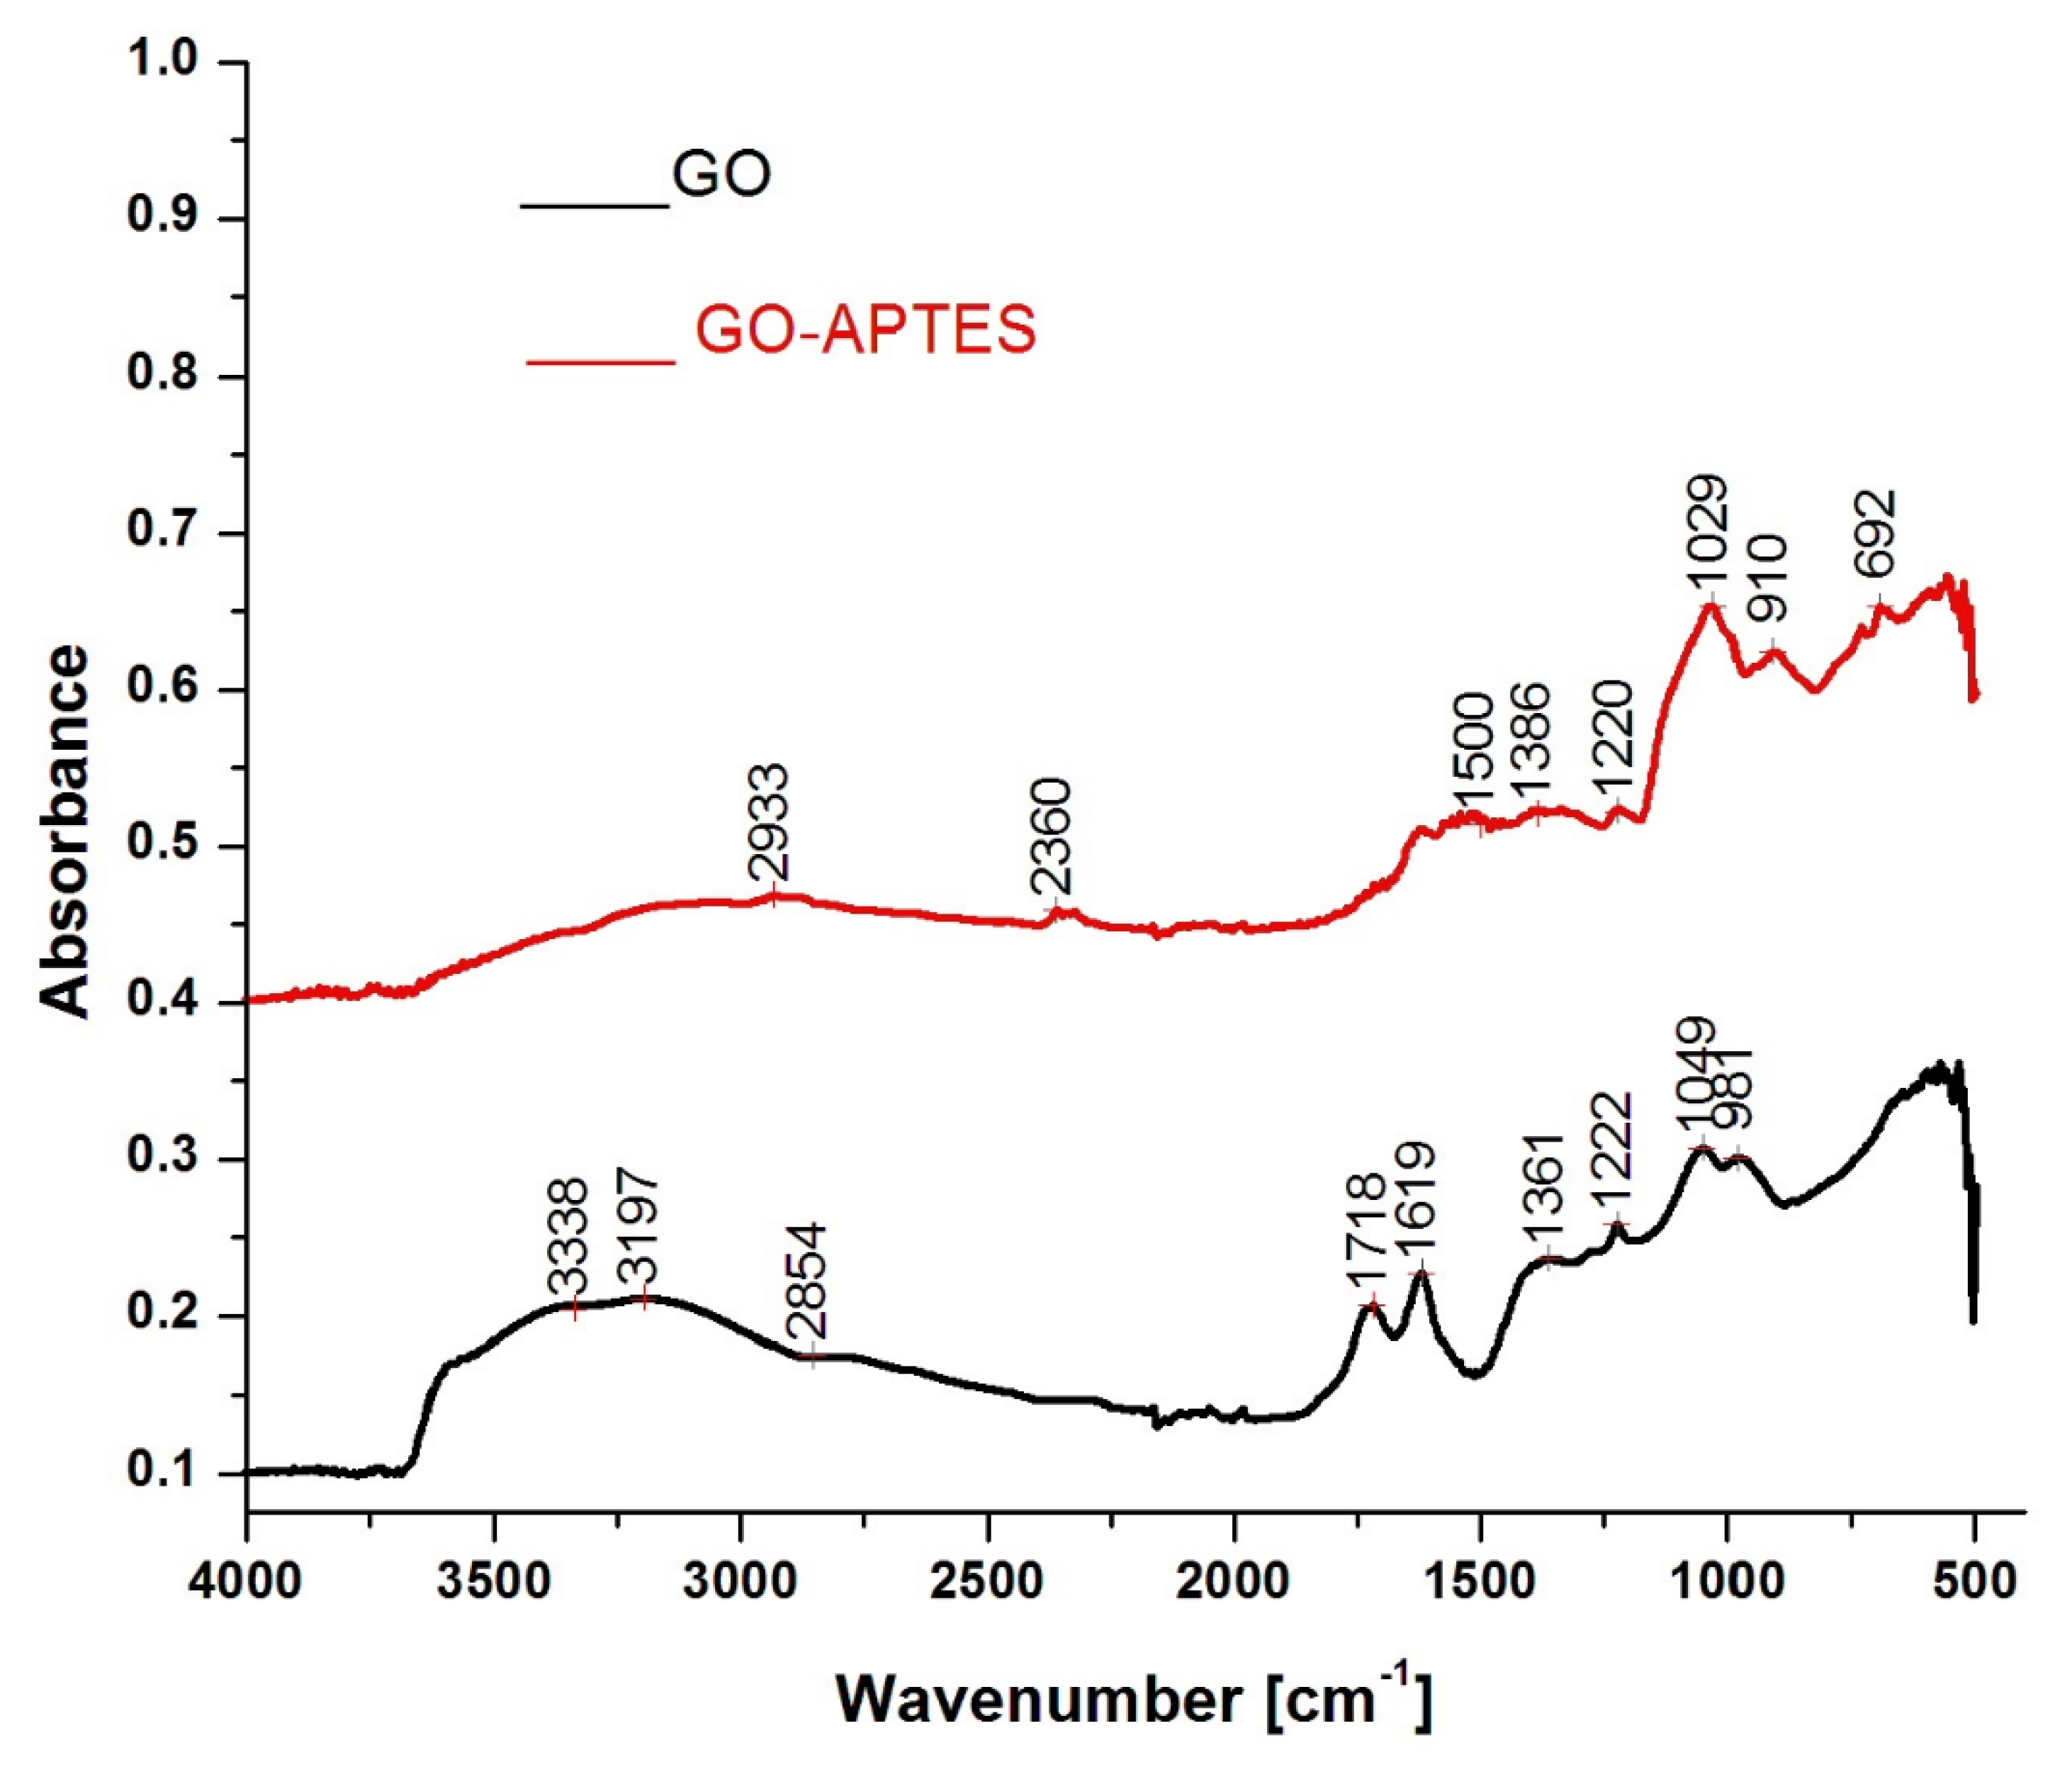
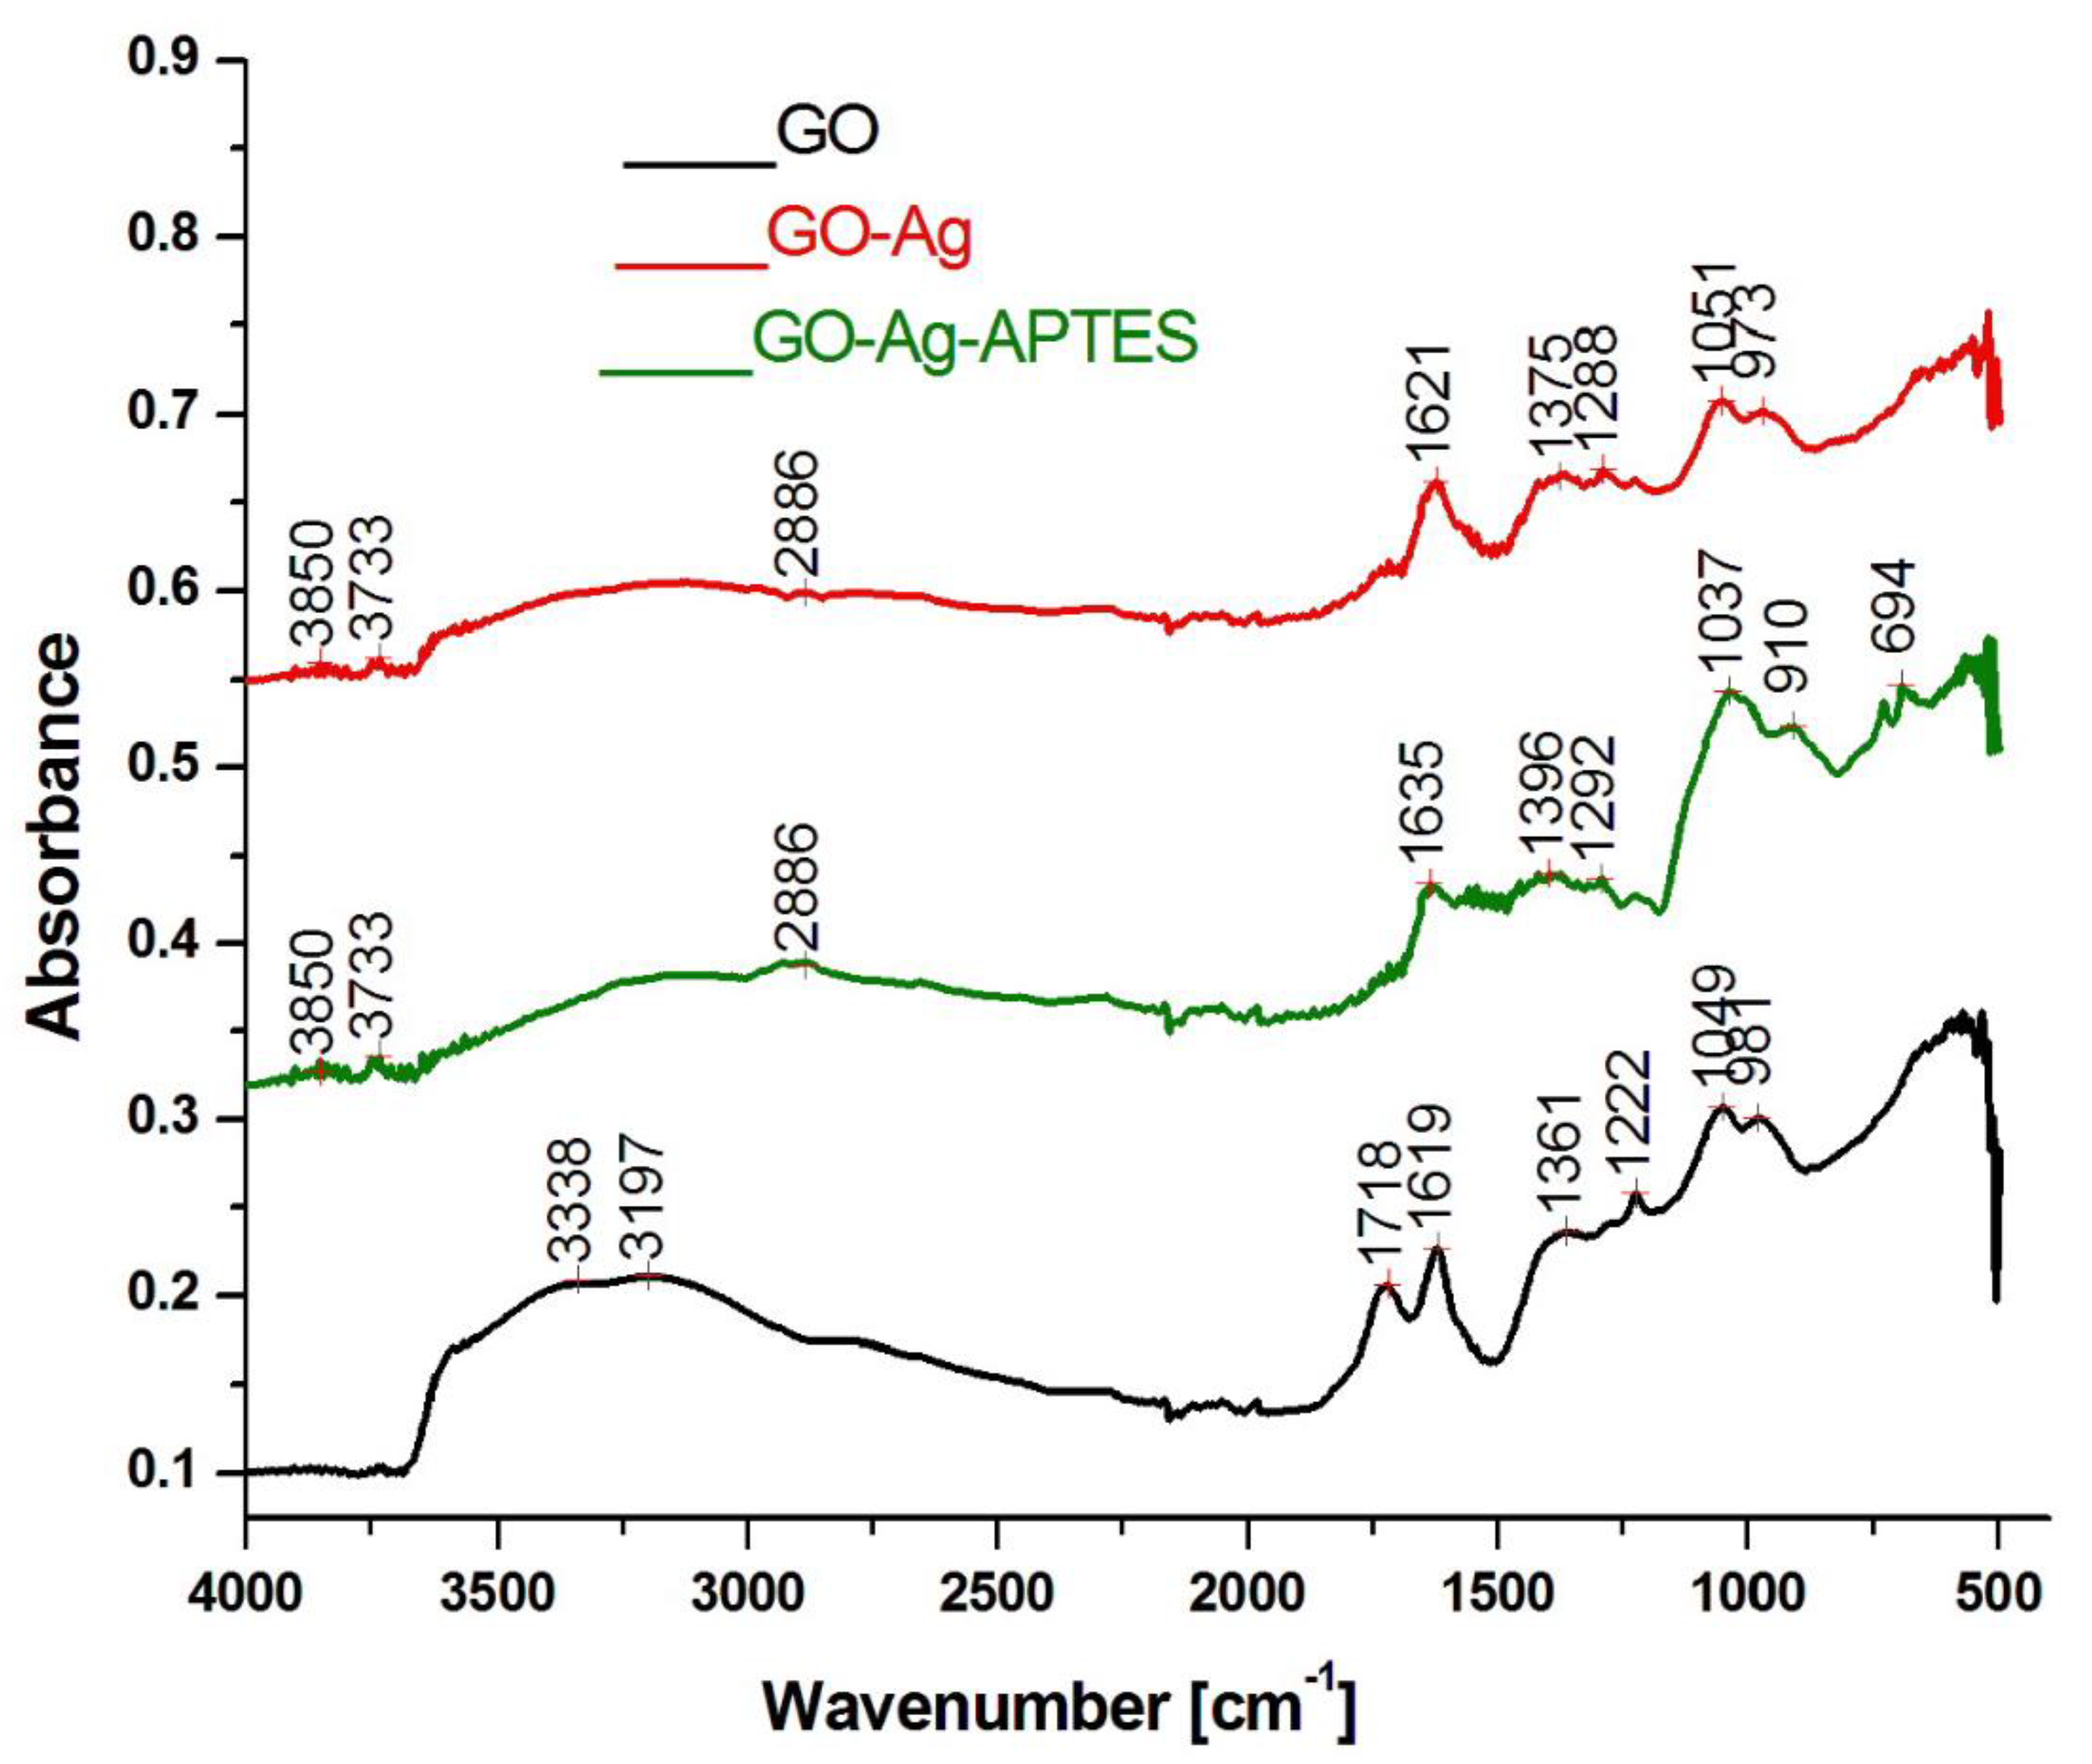
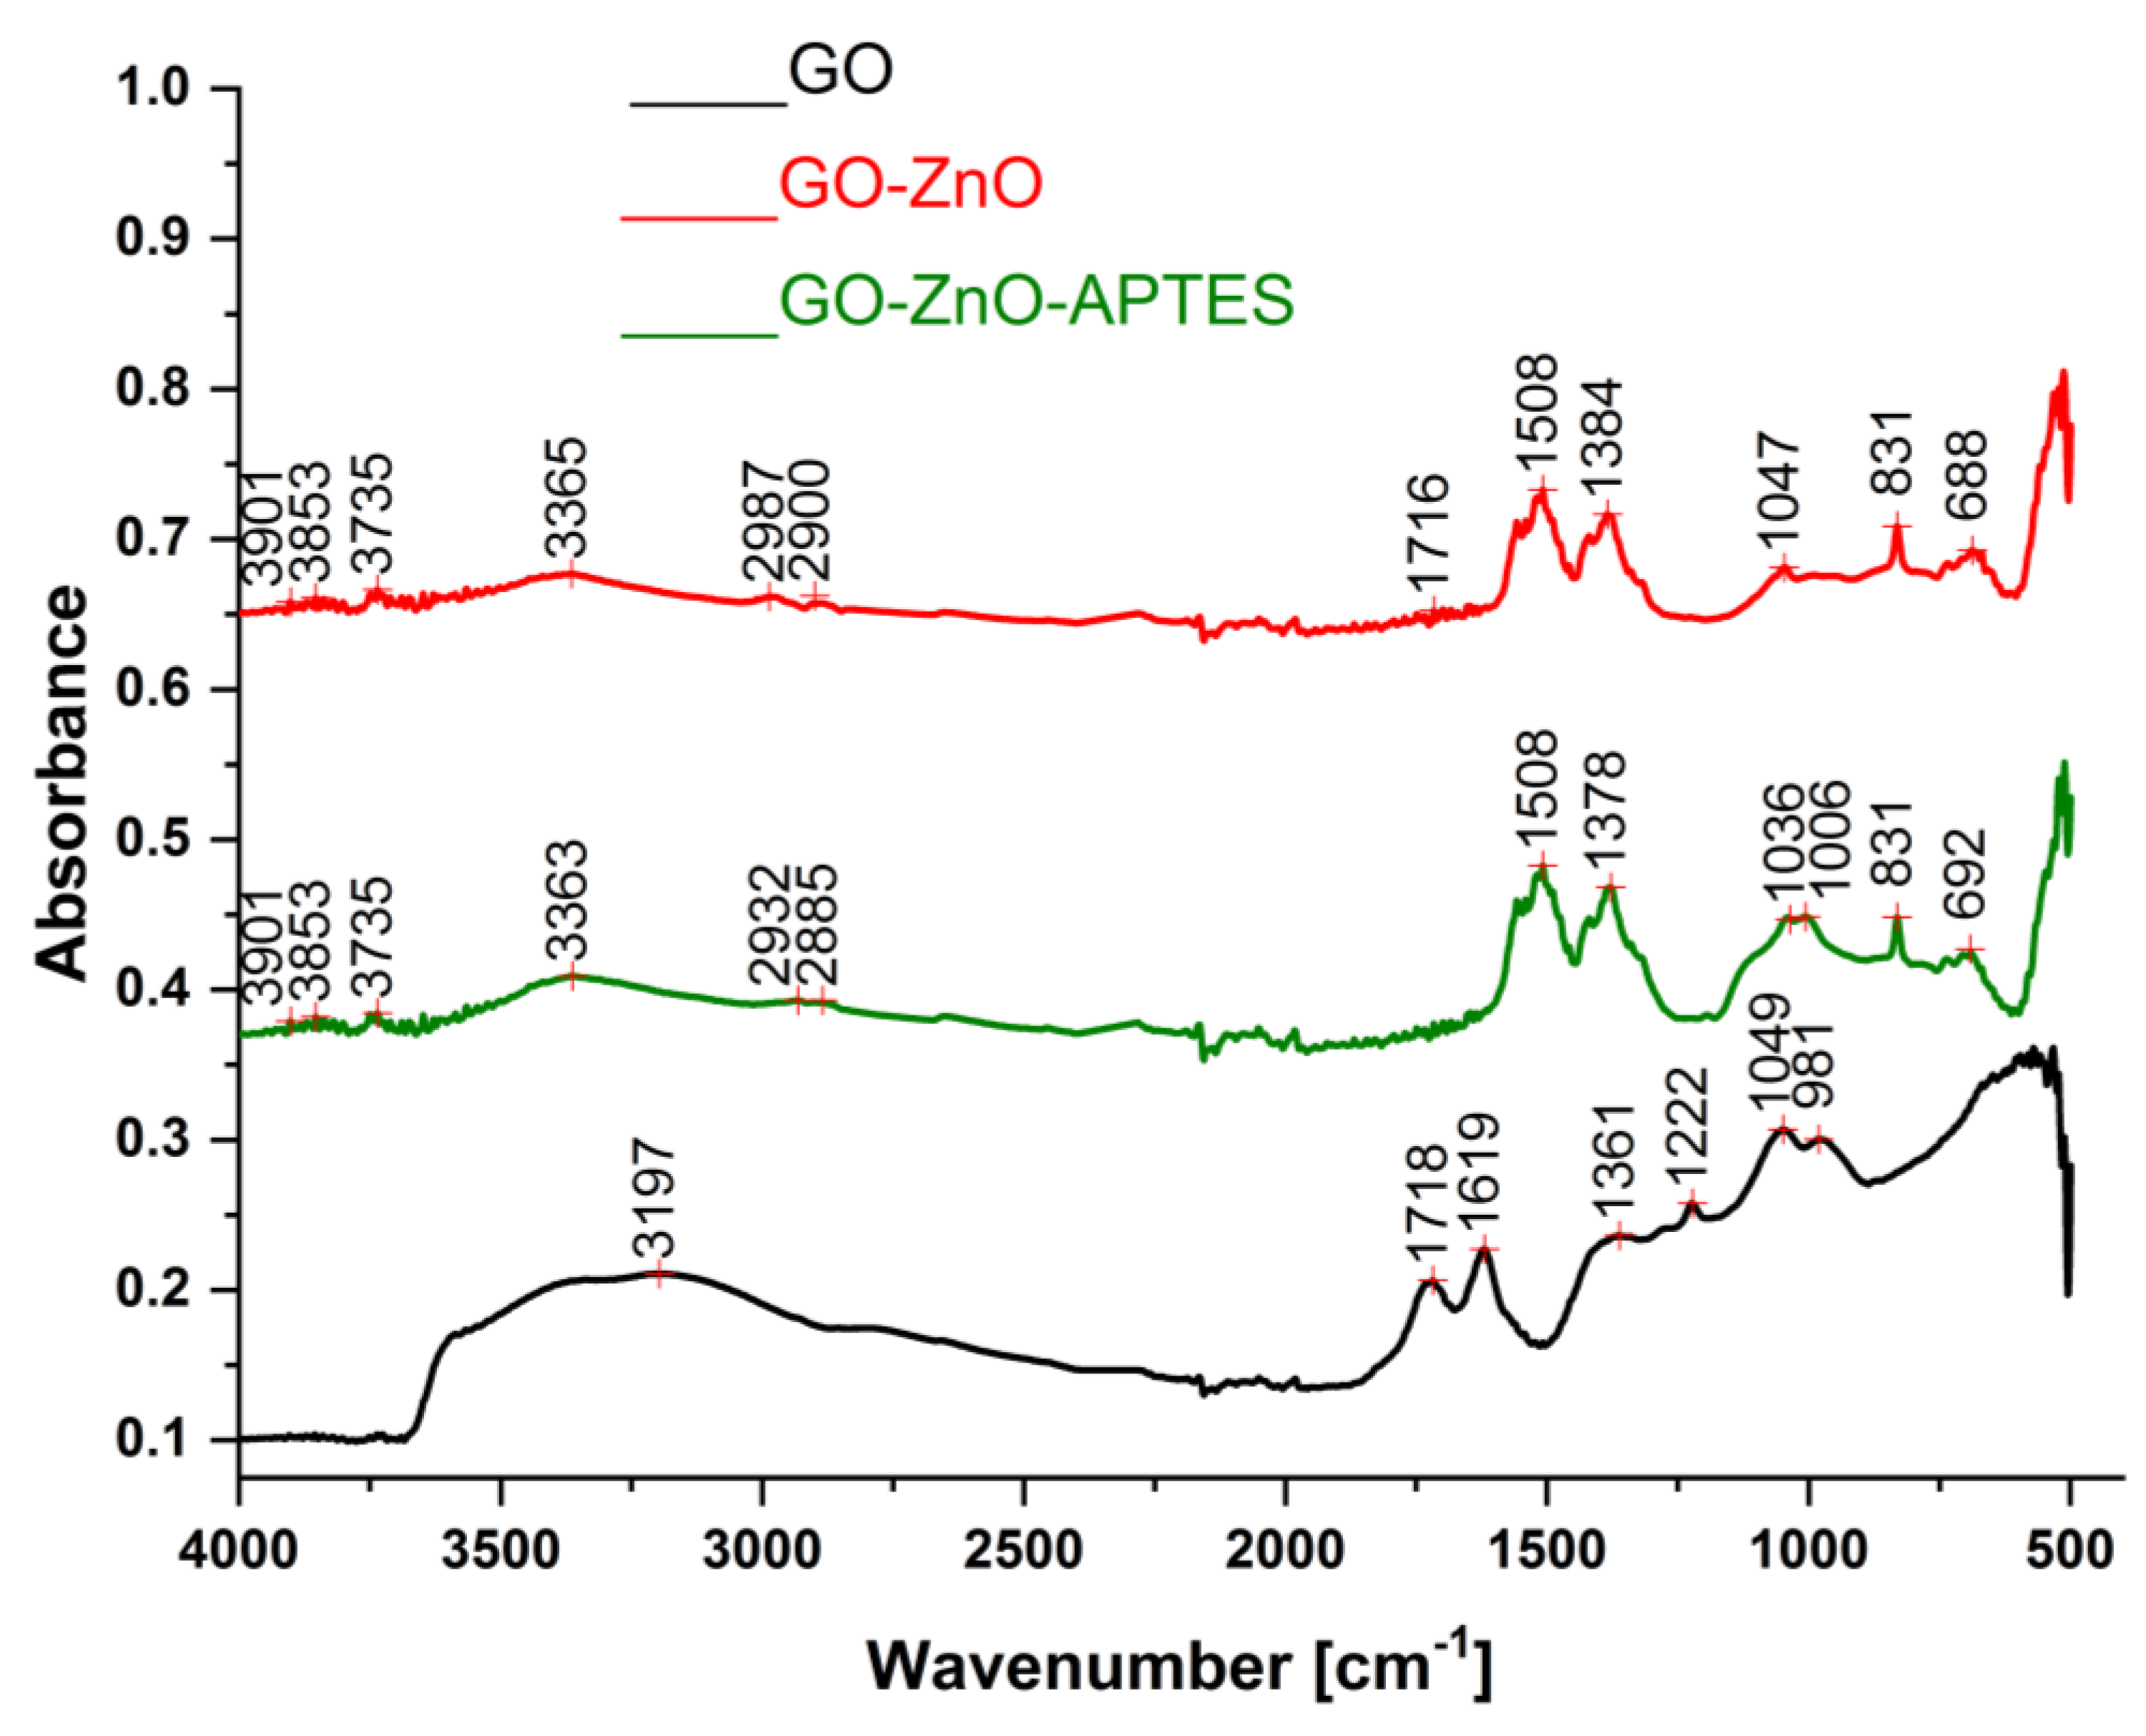
3.1. Fourier Transform Infrared Spectrometry (FT-IR)

FT-IR spectroscopy was used to confirm the synthesis of GO, GO-Ag and GO-ZnO powders by identifying the molecular groups structures of these compounds, before and after the silanization process, respectively.
The FT-IR spectrum of the APTES recorded in the wavenumber range of 4000–500 cm−1 is shown in Figure 1.
The APTES silane has amine and silane groups that are able to react with the functional groups on the surface of graphene oxide sheets. The attachment of the silane to the GO sheets leads to the formation of ethers and silica esters. Thus, the amine from APTES can bind to the carboxylic and epoxy groups of GO, while the silica can bind the oxygen containing functional groups from the surface of GO sheets [14].
In the APTES spectrum (Figure 1), the absorption bands observed at 2973 cm−1 and from 2925 cm−1 are attributed to the asymmetric vibrations of the CH3 and CH2 groups, respectively. The band from 2882 cm−1 corresponds to the vibration of the C-H functional group, while the absorption bands from 1390 cm−1 and 1442 cm−1 are assigned to the symmetrical bending vibrations of the C-CH3 group and to the shear vibrations of the C-CH2 group, respectively. The band from 1295 cm−1 is attributed to the stretching vibrations of the C-N group [15]. It could be also noticed in Figure 1, the presence of three intense absorption bands with peaks at 1072 cm−1 corresponding to the stretching vibrations Si–O, at 763 cm−1 assigned to the bending vibrations of the C-H bond [16] and at 952 cm−1 due to the vibrations of Si-C, C-O and Si-O bonds [17].
The FT-IR spectra of the graphene oxide (GO) and of the silanized graphene oxide (GO-APTES), ranging between 4000–500 cm−1 are shown in Figure 2.
In the GO spectrum, one could observe a large absorption band with three peaks at 3338 cm−1 and 3197 cm−1 assigned to the stretching vibration of the C-H and O-H bnd [18] and at 2854 cm−1 corresponding to the C-H stretching vibrations [19]. In the GO–APTES spectrum there is also a large absorption band with one peak at 2933 cm−1 that can be assigned to the C-H bond vibration from the CH2 or CH3 group [20] The smaller peak at 2360 cm−1 can be attributed to the stretching vibration of the C-H bond [21].
Moreover, in the GO spectrum, several peaks of higher intensity could be observed at 1718 cm−1 corresponding to the stretching vibrations of carbonyl groups [22], and at 1619 cm−1 assigned to the C=O stretching vibrations from carbonyl or carboxyl groups [23], but also to the physically adsorbed water molecules on or between the graphene sheets [24]. The peak at 1361 cm−1 corresponds to the stretching vibration of C=O group, while the one observed at 1222 cm−1 can be assigned to the stretching vibration of the C-O bond; the last was found in the GO-ATPES spectrum at 1220 cm−1 [25].
In the GO-APTES spectrum, the small peaks around 1500 cm−1 can be ascribed to the asymmetrically stretch of the C=C bonds in the aromatic ring [24] or to the skeletal vibration of graphene sheet [26] while the peak at 1386 cm−1 can be assigned to the stretching vibration of C-N bond [27]. In the GO spectrum, the peak at 1049 cm−1 corresponds to the alkoxy group [15,28] and the one at 981 cm−1 is assigned to the ring out-of-plane deformation [29]. In the GO-APTES spectrum, the peaks are found at lower wavelengths, respectively at 1029 cm−1 due to the valence vibrations of the Si-O-Si bond [15,30] and at 910 cm−1 assigned to the Si-O-C bond [17]. The peak at 692 cm−1 corresponds to the Si-phenyl compounds [31]. The presence of the silane peaks in the GO spectrum confirms its presence on the GO sheets.
The FT-IR spectra of the GO, GO-Ag and GO-Ag-APTES powder are shown in Figure 3.
In the GO-Ag spectrum, the peaks at 3850 cm−1 and at 3733 cm−1 can be assigned to the absorbed water due the stretching vibration of O-H group of carboxyl, alcohol and absorbed water molecules (some also noticed in the GO-Ag-APTES spectrum) [32]. The broadband between 3000–3700 cm−1 from the GO-Ag and GO-Ag-APTES spectra can be attributed to the oxygen groups, mainly to the hydroxyl groups located both on the surface and at the edge of GO sheets [24]. The peak at 1621 cm−1 can be assigned to the stretching vibrations of C=O [33], while the one at 1373 cm−1 can be due to the O-H bending vibration [34]. The peak at 1288 cm−1 corresponds to the –C–N bond (characteristic of PVP used in the synthesis of Ag nanoparticles) and the one at 1051 cm−1 can be due to the C–O-C stretching vibration of alkoxy group [35]. The peak noticed at 1718 cm−1 in the GO spectrum almost disappeared in the GO-Ag spectrum and the peak at 981 cm−1 decreased to 973 cm−1, which indicates the interaction of the Ag nanoparticles with the functional groups that give absorption peak in those areas. Moreover, the intense peak at 1051 cm−1 in the GO-Ag spectrum may indicate a strong interaction between the Ag+ ions and the functional groups on the GO sheets.
In the GO–Ag-APTES spectrum, the peak at 2886 cm−1 can be attributed to the vibrations of the alkyl groups, of the silane fraction on the graphene sheets [9,15]. The peak at 1635 cm−1 can be assigned to the C=C stretching vibration [9], and the one at 1396 cm−1 might be due to the C-OH stretching vibrations [36], but also to the C-N stretching vibration [37]. The peak at 1292 cm−1 is assigned to the C-N bending vibration [37], while the ones at 1037 cm−1 and 694 cm−1 correspond to the presence of Si-O-Si and Si-O-C on the graphene sheets surface [9]. The peak at 910 cm−1 can be assigned to the epoxy group stretch [38].
The FT-IR spectra of the GO, GO-ZnO and GO-ZnO-APTES powder are presented in Figure 4.
In the GO-ZnO powder, the amount of graphene oxide is about 20 times lower than the amount of ZnO. Therefore, the spectrum of GO-ZnO powder is significantly different from the spectrum of GO. Comparing the three spectra from Figure 4, a series of smaller peaks appearing between 3500 cm−1 and 4000 cm−1 could be observed. They are more prominent in the GO-ZnO powder spectrum and can be associated with the OH group, indicating the hydrophilic character of this powder. The prominent peaks observed at 3365 cm−1 in the GO-Zn spectrum, and at 3363 cm−1 in the GO-ZnO-APTES spectrum can be attributed to the stretching vibrations specific to the OH group and to the N-H stretching vibration, respectively [15,33,39]. The small peaks at 2987 cm−1 and 2900 cm−1 in the GO-ZnO spectrum, which could be also noticed at 2932 cm−1 and 2885 cm−1 in the GO-ZnO-APTES spectrum can be ascribed to the C-H stretching vibration of the alkane group [40].
In the GO-ZnO and GO-ZnO-APTES spectra, a series of small peaks appeared in the range of 1980 cm−1 and 1610 cm−1 which could be assigned to the stretching vibration of the C=O bond within esters, amides, carboxylic, ketones groups [15]. The peaks at 1718 cm−1 (carbonyl groups), and at 1619 cm−1 (C=O bond) from the GO spectrum were reduced in both, GO-ZnO and GO-ZnO-APTES spectra, during the preparation process of the GO-ZnO powders. In the GO-ZnO spectrum, the absorbance peak from 1508 cm−1 indicates the skeletal vibration of the graphene sheets, while the peak at 1384 cm−1 corresponds to the vibration of the C=O bond [15,41]. The peaks at 1361 cm−1 (C=O bond) and 1222 cm−1 (C-O bond) from the GO spectrum was not observed in the other spectra (i.e., GO-ZnO and GO-ZnO-APTES). The peaks at 1049 cm−1 and 981 cm−1 from the GO spectrum corespond to the epoxy group and to the alkoxy group vibrations, respectively [42]. In the GO-ZnO spectrum the peak from 1047 cm−1 is attributed to the C-O stretching vibration [43] and the peak from 989 cm−1 corresponds to the vibration of Si—O—Zn bond. Both peaks from 1036 cm−1 and 1006 cm−1 in the GO-ZnO-APTS spectrum can be assigned to the Si-O-Si bond [31], while the one at 1378 cm−1 is ascribed to the O–H deformations of the C–OH groups [44]. The appearance of a new band with lower peaks at 688 cm−1 in the GO-ZnO spectrum and and at 692 cm−1 in the GO-ZnO-APTES spectrum could be ascribed to the presence of ZnO on the graphene sheets [44,45]. The peak at 692 cm−1 in the GO-ZnO-APTES spectrum may be assigned to the Si-phenyl compounds bonds [31]. The peak at 831 cm−1 can be ascribed to the C–H group [44].
The appearance of several new peaks and the decrease of the intensity of the peaks in the GO-ZnO spectrum as compared to those in the GO spectrum indicates that the ZnO is linked to the functional groups on the surface of the graphene sheets. Moreover, certain maxima found in the GO-ZnO-APTES spectrum have a lower intensity than those found in the GO-ZnO spectrum. In addition, the appearance of the maxims attributed to the silane groups confirms the presence of the APTES on the GO-ZnO sheets.

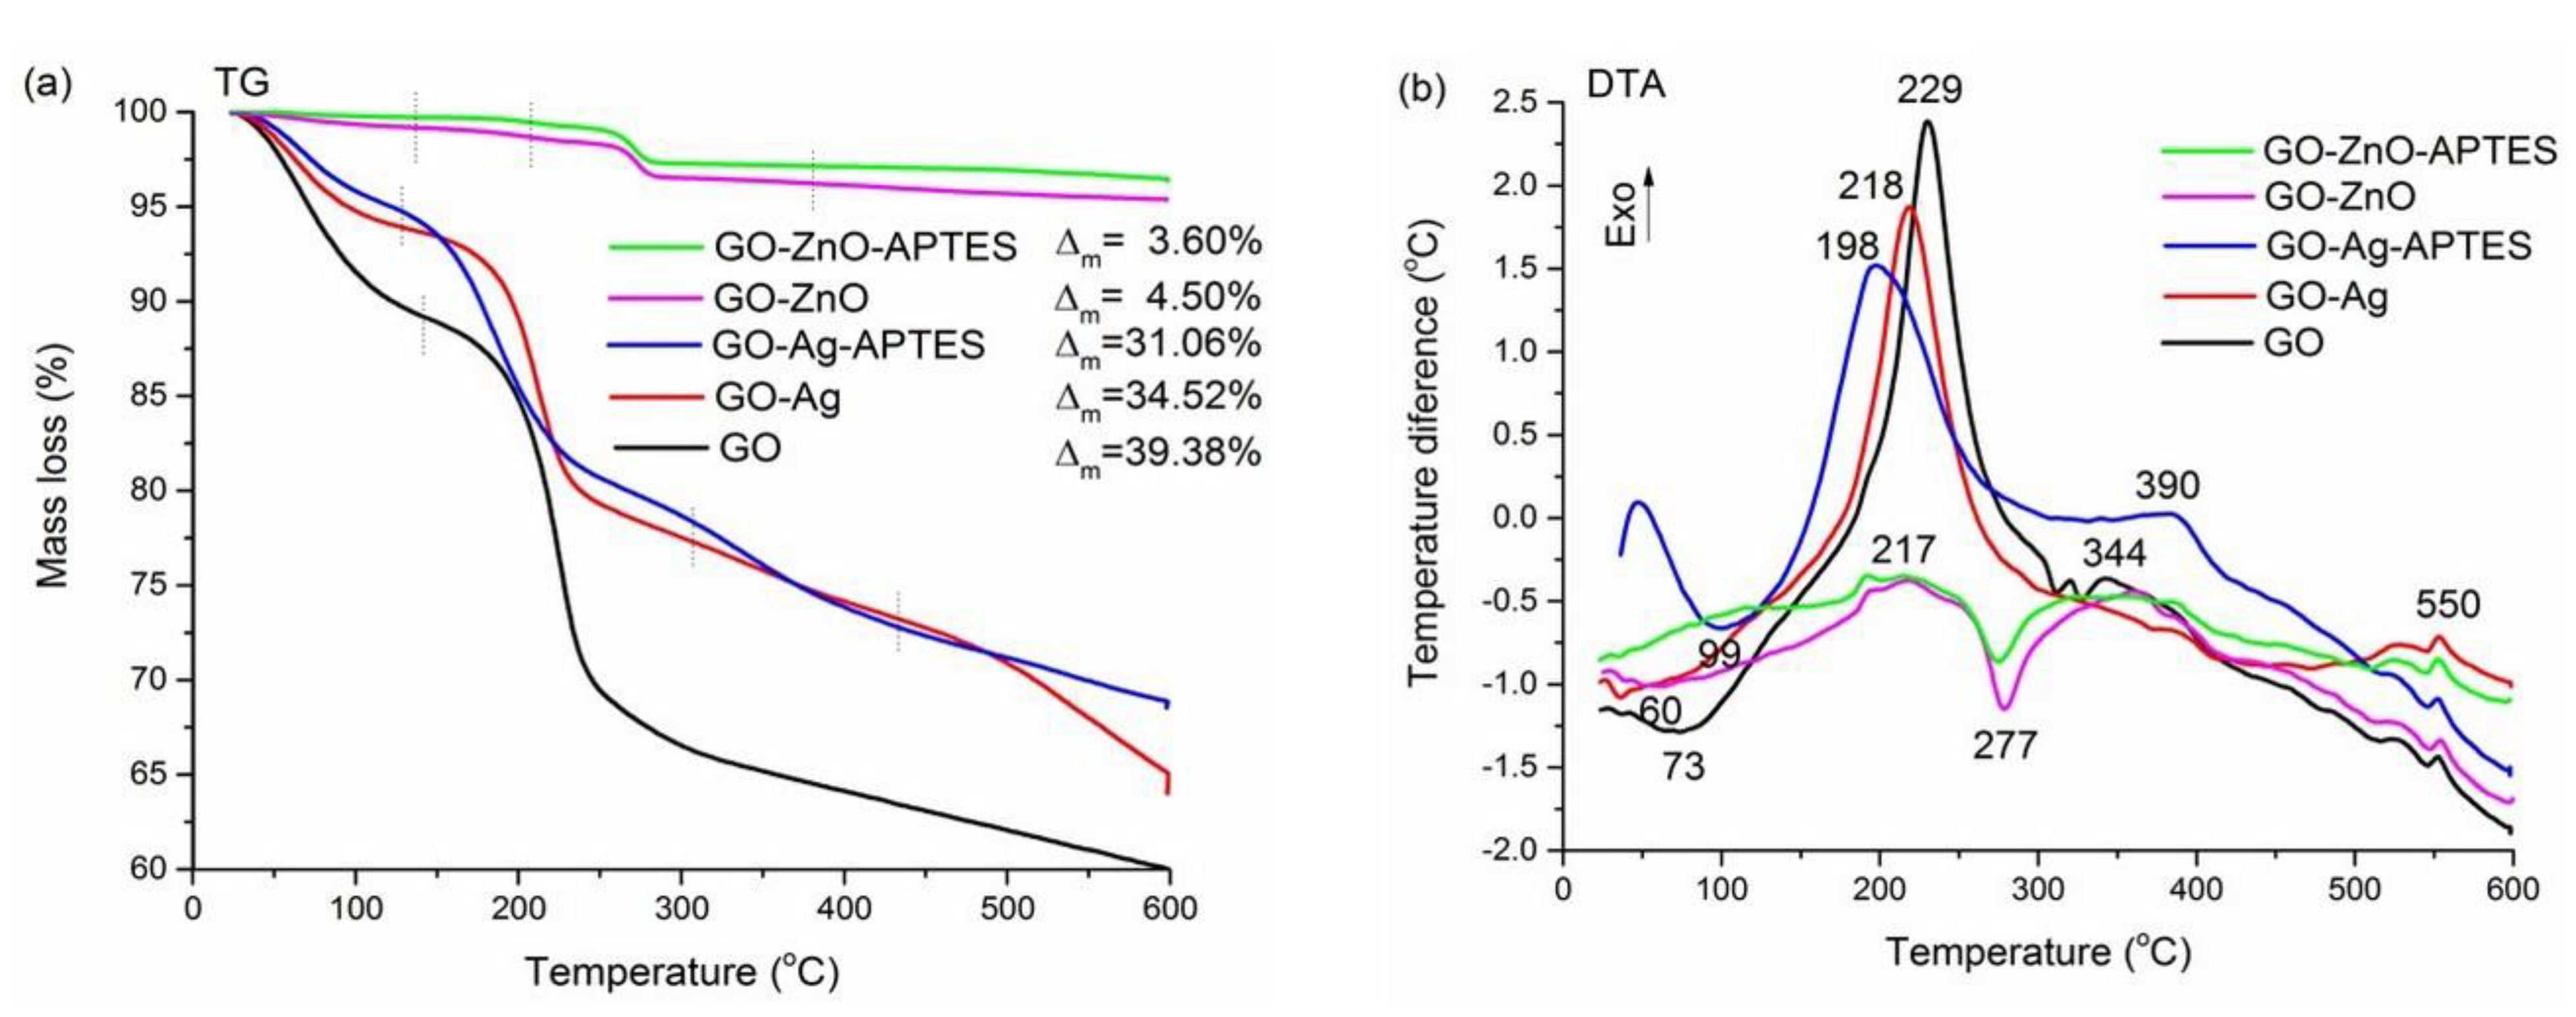
3.2. Thermogravimetric Analysis (TG/DTA)

Thermal degradation of GO, GO-Ag, GO-Ag-APTES, GO-ZnO and GO-ZnO-APTES powders was investigated by TG/DTA.
From Figure 5, it can be seen that the total mass loss of GO is 39.38%. The GO powder was thermally decomposed in two steps. In the first step, up to 140 °C, a weight loss of 10.21% occurs, being accompanied by an endothermic effect noticed on the DTA curve at 73 °C. Since GO has a hydrophilic nature, this loss may be due to the vapor removal of the physically adsorbed water, but also to some functional groups with oxygen on the surface of graphene (hydroxyl type) [46]. The weight loss occurring in the second step, of 29.17%, was accompanied by an exothermic maximum at 229 °C and may be due to the decomposition of more stable oxygen functional groups, with the CO and CO2 release [46]. Eigler and co showed that the temperature range between 200–300 °C is often neglected in the literature, and the weight loss is also due to the release of SO2, in addition to the water and CO2 [47].
The total mass loss of GO-Ag is 34.52%, lower than that of GO, which allows us to assume that a series of functional groups on the surface of GO sheets reacted with Ag nanoparticles. The GO-Ag powder is thermally decomposed in four steps. The mass loss of 5.84%, recorded up to 130 °C, which occurs in the first step, may be due, as previously explained, to the removal of the physically adsorbed water. In the second step, between 130–300 °C, there is a higher mass loss (16.35%), accompanied by a strong exothermic effect at 218 °C, which could be due to the removal of some functional groups with oxygen from the graphene surface. The weight losses occurring in the third step (3.92%) between 300–420 °C and in the fourth step (8.41%) between 420–600 °C might be due to the removal of GO. They are indicated on the DTA curve by the slight exothermic effects at 390 °C and 550 °C [48,49]. The thermal maxima at which the mass losses of the GO-Ag powder occurred are lower than those recorded for GO powder indicating the role of the silver nanoparticles as catalysts, ensuring the reduction at the decomposition temperatures, when they are present on the GO sheets [50].
The total mass loss of GO-Ag-ATPES is 31.06%, lower than the loss suffered in the case of GO-Ag, which allows us to assume that some of the functional groups on the GO surface which remained unreacted after the interaction with Ag nanoparticles reacted with the silane (APTES). As for GO-Ag, the weight loss was achieved in four steps. The mass losses suffered in the first two steps, between 25–120 °C and 120–270 °C, accompanied by a strong exothermic effect at 198 °C are 4.70% and 15.39%, respectively. They are lower for the GO-Ag-APTES sample as compared to the GO-Ag sample. Therefore, in addition to the losses of CO, CO2 and moisture, some of the functional groups on the GO-Ag surface (especially the epoxy group) can be assumed to be functionalized with silane. In the steps three and four, the total mass losses (10.97%) are also lower than those of GO-Ag (12.33%) confirming the previous assumption regarding the interaction of GO-Ag with the silane. Thus, APTES decompositions take place in a large temperature domain. It starts at 390 °C with removal of nitrogenous fragments and continue with decomposition of oxyethyl groups, between 450–600 °C [51].
From the TG curve corresponding to the GO-ZnO powder, a total mass loss of 4.50% can be observed, which is much lower than that of GO. Recall that the ratio of GO: ZnO is 1:20. As in the previous case, the mass losses were realized in four steps. In the first two steps, between 25–140 °C and 140–230 °C, the mass losses have the same value (0.72%). These losses were accompanied by an endothermic effect at 60 °C and one a slightly exothermic effect at 217 °C. As in the other cases, these losses can be attributed to both the release of CO, CO2 and moisture and to the fact that some of the functional groups on the GO surface interacted with ZnO. In the third step, between 230–380 °C, there is a weight loss of 2.21%, accompanied by an endothermic effect at 277 °C. The loss of mass in this step may be due to pyrolysis of oxygen-containing functional groups. In the fourth step, between 380–600 °C, the mass loss was 0.84%, with a slight exothermic maximum at 550 °C, which may be due to decomposition of the GO skeleton.
In the case of GO-ZnO-APTES powder, the total mass losses are lower (3.60%) as compared to those recorded for GO-ZnO powder, which confirms the presence of the silane deposited on the surface of GO-Zn powder. As in the previous case, the weight loss occurred in four steps. In the first two steps, between 25–140 °C and 140–220 °C, the mass losses have close values, 0.36% and 0.39%, lower than in the case of GO-ZnO powder. These losses were accompanied by an exothermic maximum, in the second step, at 217 °C. In the third step, between 220–400 °C there is a weight loss of 2.19%, accompanied by an endothermic effect at 275 °C and a small exothermic effect at 350 °C. The mass loss in this step may be due to pyrolysis of oxygen-containing functional groups and to decomposition of nitrogenous fragments from APTES, respectively [51]. In the fourth step, between 400–600 °C, the mass loss was 0.64% and may be due to the removal of the GO skeleton and to the removal of oxyethyl groups from APTES [51]. The difference of approximately 0.9% between the total mass losses of GO-ZnO and GO-ZnO-APTES confirms the previous assumption regarding the interaction between the GO-Zn and the silane.

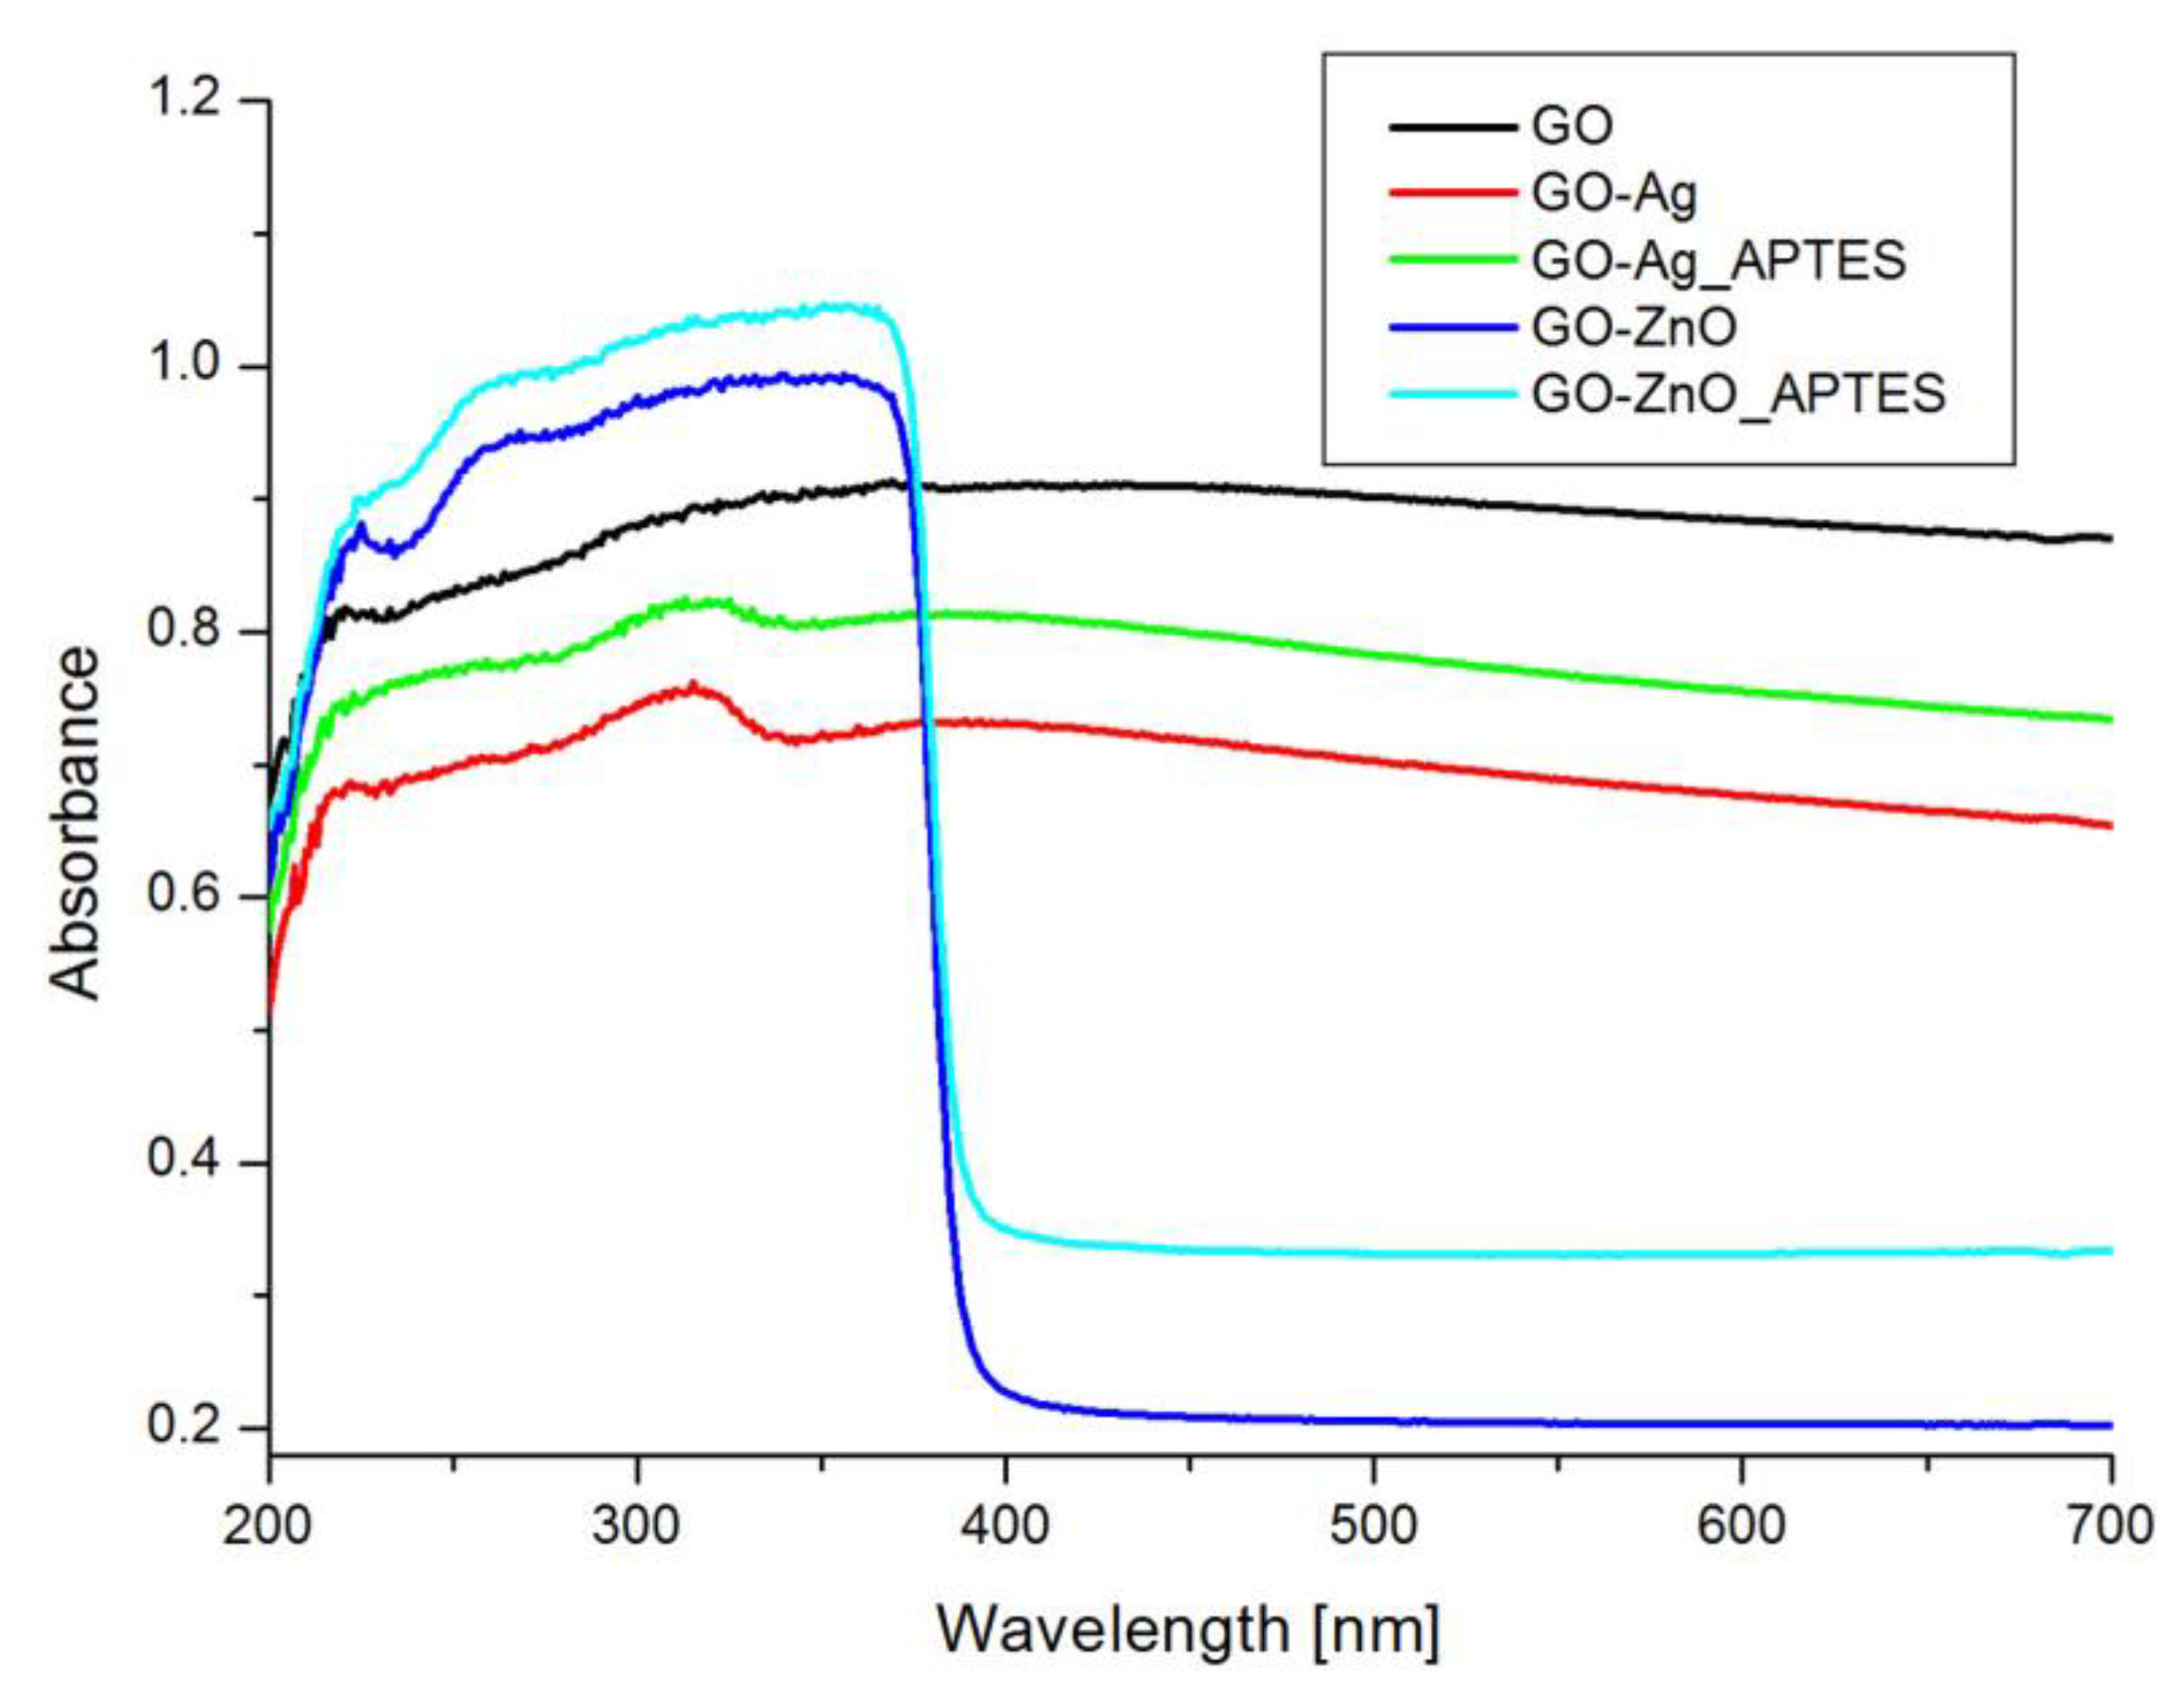
3.3. Ultraviolet–Visible Spectroscopy (UV-Vis)

The UV-Vis spectrograms of GO, GO-Ag, GO-Ag-APTES, GO-ZnO and GO-ZnO-APTES powders are shown in Figure 6.
The UV-VIS spectra of the GO-based powder materials from Figure 6 contains absorption bands at 222 nm (GO), 223 nm (GO-Ag), 232 nm (GO-Ag-APTES), 224 nm (GO-ZnO and GO-ZnO-APTES) corresponding to the π-π * electronic transitions of the aromatic C-C bonds. In the cases where the recorded absorption peaks are lower as compared to the values reported in the literature (230 nm, 232 nm, 238 nm) [52,53], it could be assumed that there was a decrease in the delocalized electrons and thus more energy was required for the electronic transition, suggesting that the samples were oxidized with several functional groups on the basal planes. This assumption was based on the direct proportionality between the maximum intensity and the degree of oxidation [54]. The absorption peaks at around 300 nm, namely at 348 nm (GO), 315 nm (GO-Ag), 318 nm (GO-Ag-APTES) are associated to the n–π * transitions of the C=O bonds from the carbonyl group [55]. According to the literature [56,57], the absorption peak of ZnO appears around at 365 nm. In our study, a close value to this wavelength was noticed in the spectra of both GO functionalised with ZnO samples (blue lines in Figure 6), which also confirms the presence of ZnO on the GO powder.

3.4. Scanning Electron Microscopy (SEM)

SEM images obtained on the GO powders before (a, c, e) and after the silanization process (b, d, f) are presented in Figure 7, at magnifications of ×500 and ×5000, respectively.
Figure 7 shows the multiple lamellar aspect of the GO powder, which allows us to distinguish the edges of the sheets that are superimposed on each other. Figure 7a–d shows that the GO layers have sharp edges that are raised in places. In Figure 7c–f it can be observed the dispersion mode of the Ag (in the form of white dots) and Zn nanoparticles on the surface of the GO sheets and between the GO layers, especially in the case of GO-ZnO (Figure 7e,f) where zinc oxide is abundantly attached to the surface of the GO sheets. In addition, there is a difference between the images taken on the non-silanized powders and those recorded on silanized powders. On the silanized powders from Figure 7b,d, it could be observed how the agglomerations were reduced and some separate layers are clearly visible due to the attachment of the siloxane group on the surface of the GO sheet. In Figure 7f were ZnO is in excess, the GO layers are hardly noticeable, as if they were wrapped in a protective coating.

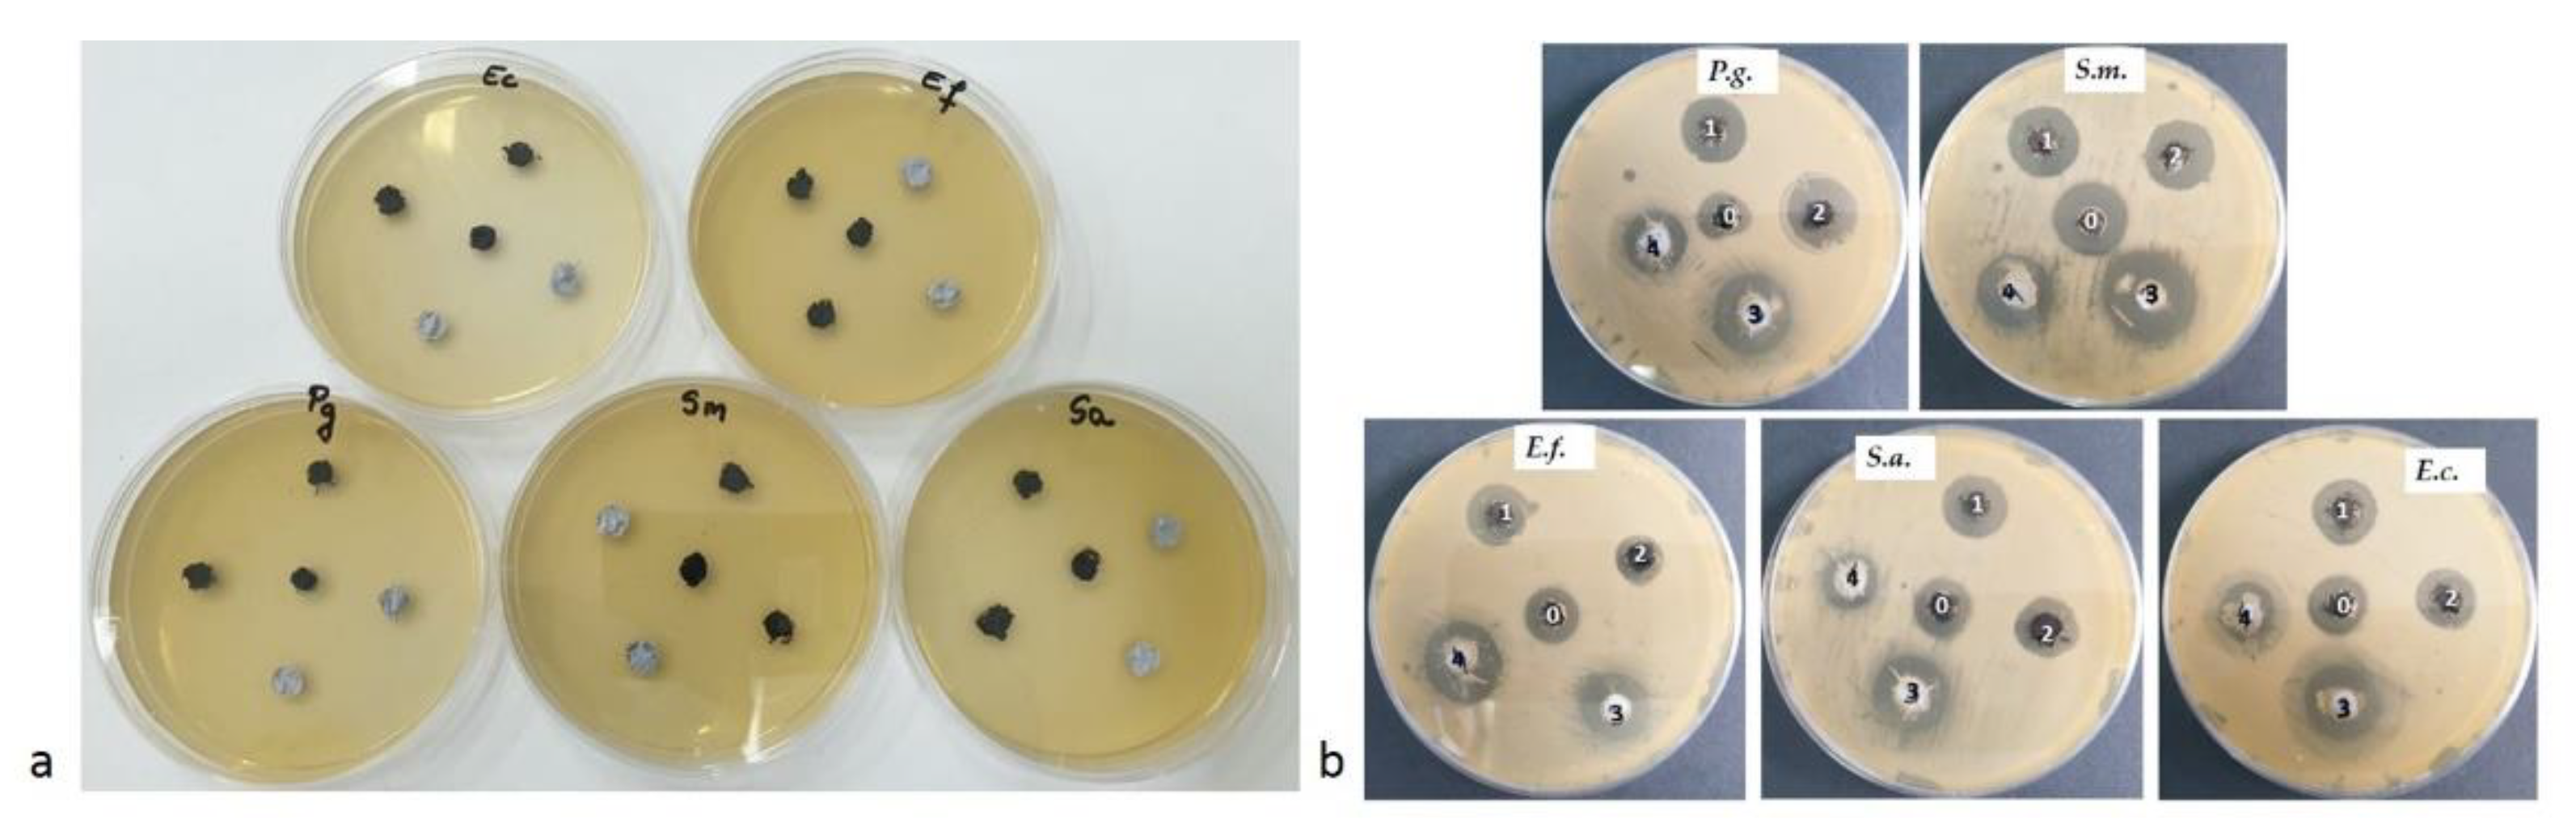
3.5. Antibacterial Analysis

In the literature, there are different reports about the antibacterial activity of GO. For example, some studies reported that the antibacterial activity against E. coli was higher for GO than for reduced GO or graphite [58,59], while other papers showed a bacterial growth with the addition of GO to the culture medium [60]. Therefore, due to the functionalization capacity of GO, it was tried to increase its antibacterial capacity by introducing different nanoparticles (i.e., Ag, Zn).
The antimicrobial mechanism of GO-Ag is based on the fact that the Ag+ ions released by silver nanoparticles can bind strongly to the thiol (SH) groups from the enzymes and proteins on the cell surface, causing damage to the cell walls through the holes in the membrane and in the cellular wall, thus ensuring the penetration of Ag nanoparticles into the bacteria [50,61]
In this study, the antibacterial effect of non-silanized powders (GO, GO-Ag, GO-Zn) and silanized powders (GO-APTES, GO-Ag-APTES, GO-Zn-APTES) against five bacterial strains (Table 1 and Figure 8) was investigated, following the direct contact between the powders and the culture medium. After the end of the incubation period, at 37 °C, the zones of inhibition (mm) were determined at the tested microbial strains. For all bacterial strains, it was observed that the results from the tested powders varied in the size of the diameter of the inhibition zone depending on the microbial strain tested.
Following the performed test, a bacterial inhibition was noticed for all the samples against the tested bacterial strains. The highest values of the diameter of the inhibition zone (ranging between 17 and 22 mm) for all powder samples, including for the reference sample (GO) were recorded against Streptococcus mutans. By contrast to Streptococcus mutans, against the other bacterial strains, the control GO sample generated a constant antibacterial effect. The highest bacterial inhibition effect against Streptococcus mutans was obtained in the case of GO-ZnO sample. The GO-Zn sample also produced the highest diameter of the inhibition zone (18 mm) against Escherichia coli and Staphylococcus aureus, while all other samples generated rather similar antibacterial effects. Against Porphyromonas gingivalis, GO-Ag-APTES sample produced the highest value of the inhibition zone (20 mm); its antibacterial effect is similar to that of the GO-Zn sample. The GO-ZnO-APTES sample developed the largest diameter of the inhibition zone (19 mm) against Enterococcus faecalis. Similar results have been also reported in the literature [11,62].
A comparison of the results obtained for the non-silanized samples (Figure 8 and Table 1) revealed that the GO-Zn sample exerted the highest antibacterial effect against all tested bacterial strains. However, it should be also taken into consideration that the Zn content in the GO-Zn sample is much higher as compared to the Ag content from the GO-Ag sample. Among the silanized samples, the highest antibacterial effect was noticed for the GO-Ag-APTES sample against the tested bacterial strains, except for Enterococcus faecalis, against which it developed the smallest diameter of the inhibition zone (12 mm).
Comparing the results presented in Table 1 and Figure 8 for the silanized and non-silanized samples, different behaviors could be noticed, depending on the tested bacterial strain. Thus, against four bacterial strains, the non-silanized samples showed a greater or a similar antibacterial effect with the silanized ones. Instead, the silanized GO samples functionalized with Ag and ZnO presented higher antibacterial effects against Porphyromonas gingivalis and Enterococcus faecalis, respectively, as compared to the non-silanized samples. The differences in the antimicrobial activity between the non-silanized and silanized powders could be due to the physicochemical interaction between the graphene-derived materials and the microorganisms with which they come into contact [63,64].
The limitation of this study is related to the fact that the antibacterial effect was tested against bacterial strains from the endowment of the biology laboratory. It is recommended to perform tests on other classes of bacteria or fungi, which are mostly identified on the walls of the heritage buildings. It would be also interesting to conduct a study on the evolution of the antibacterial effect over the time, in various environmental conditions, using different investigation methods.

4. Conclusions

FTIR spectra of the GO-Ag, GO-ZnO powders and silanized powders put in evidence the specific functional groups formed by the Ag or ZnO attached on the surface of the graphene sheets. The total mass losses of GO powders combined with Ag or ZnO, recorded after the TG/DTA analysis, are lower than those of GO powders. The decreases of the mass losses recorded after the silanization of the powder samples confirm that some of the functional groups with oxygen from the surface of the graphene sheets were functionalized with Ag, ZnO, and with APTES, respectively. Following the UV-VIS analysis, some peaks corresponding to the π-π * electronic transitions attributed to the aromatic C-C bonds and to the n-π * electronic transitions attributed to the C=O bonds were registered. SEM images confirm the presence of Ag nanoparticles on the graphene sheets, but also their overloading with zinc oxide in the case of the GO-Zn powder. The antibacterial effect of the silanized and non-silanized samples depends on the tested bacterial strains. The measured diameters of the inhibition zones around the tested powders ranged between 12 and 22 mm. Although the GO-Zn sample had the highest antibacterial effect against most of the bacterial strains tested, a satisfactory antibacterial effect was obtained for all functionalized, silanized or non-silanized powders. The inclusion of these powders as additives in hydraulic mortars can lead to an improvement in their quality.

Author Contributions

Conceptualization, D.P. (Dorin Popa) and M.M.; validation, M.P. and S.V.; investigation, M.F., I.P., C.S., R.C. and S.C.; visualization, G.F.; writing—original draft preparation, D.P. (Doina Prodan). All authors have read and agreed to the published version of the manuscript.

Funding

This research received no external funding.

Acknowledgments

This work was supported by a grant of MEN-UEFISCDI, Project PN-III-P2-2.1-PED-2019-3739.

Conflicts of Interest

The authors declare no conflict of interest.

References

  1. Popa, D.; Varvara, S.; Moldovan, M.; Prodan, D.; Carpa, R.; Varsta, A.; Popa, M. Study on the importance of physicochemical characteristics from the walls in the rehabilitation works of heritage buildings. J. Environ. Prot. Ecol. 2018, 19, 1166–1174. [Google Scholar]
  2. Faria, P.; Duarte, P.; Barbosa, D.; Ferreira, I. New composite of natural hydraulic lime mortar with graphene oxide. Constr. Build. Mater. 2017, 156, 1150–1157. [Google Scholar] [CrossRef] [Green Version]
  3. Sun, M.; Li, J. Graphene oxide membranes: Functional structures, preparation and environmental applications. Nano Today. 2018, 20, 121–137. [Google Scholar] [CrossRef]
  4. Han, S.; Sun, J.; He, S.; Tang, M.; Chai, R. The application of graphene-based biomaterials in biomedicine. Am. J. Transl. Res. 2019, 11, 3246–3260. [Google Scholar]
  5. Mkhoyan, K.A.; Contryman, A.W.; Silcox, J.; Stewart, D.A.; Eda, G.; Mattevi, C.; Miller, S.; Chhowalla, M. Atomic and electronic structure of graphene-oxide. Nano Lett. 2009, 9, 1058–1063. [Google Scholar] [CrossRef] [PubMed] [Green Version]
  6. Kumari, S.; Sharma, P.; Yadav, S.; Kumar, J.; Vij, A.; Rawat, P.; Kumar, S.; Sinha, C.; Bhattacharya, J.; Srivastava, C.M.; et al. A novel synthesis of the graphene oxide-silver (GO-Ag) nanocomposite for unique physiochemical applications. ACS Omega 2020, 5, 5041–5047. [Google Scholar] [CrossRef] [PubMed] [Green Version]
  7. Allahbakhsh, A.; Haghighi, A.H.; Sheydaei, M. Poly(ethylene trisulfide)/graphene oxide nanocomposites. J. Therm. Anal. Calorim. 2017, 128, 427–442. [Google Scholar] [CrossRef]
  8. Justh, N.; Berke, B.; László, K.; Szilágyi, I.M. Thermal analysis of the improved Hummers’ synthesis of graphene oxide. J. Therm. Anal. Calorim. 2018, 131, 2267–2272. [Google Scholar] [CrossRef] [Green Version]
  9. Lee, C.Y.; Bae, J.H.; Kim, T.Y.; Chang, S.H.; Kim, S.Y. Using silane-functionalized graphene oxides for enhancing the interfacial bonding strength of carbon/epoxy composites. Compos. A Appl. Sci. Manuf. 2015, 75, 11–17. [Google Scholar] [CrossRef]
  10. Vuppaladadiuma, S.S.R.; Agarwalb, T.; Kulanthaivela, S.; Mohantyc, B.; Barikc, C.S.; Maitib, T.K.; Pald, S.; Pala, K.; Banerjeea, I. Silanization improves biocompatibility of graphene oxide. Mater. Sci. Eng. C 2020, 110, 110647. [Google Scholar] [CrossRef] [PubMed]
  11. El-Shafai, N.; El-Khouly, M.E.; El-Kemary, M.; Ramadan, M.; Eldesoukey, I.; Masoud, M. Graphene oxide decorated with zinc oxide nanoflower, silver and titanium dioxide nanoparticles: Fabrication, characterization, DNA interaction, and antibacterial activity. RSC Adv. 2019, 9, 3704–3714. [Google Scholar] [CrossRef] [Green Version]
  12. Popa, D.; Carpa, R.; Moldovan, M.; Prodan, D.; Varvara, S.; Golumbeanu, M.; Popa, M. Culturable bacterial communities from the, spoiled walls of the heritage buildings. J. Environ. Prot. Ecol. 2019, 20, 773–780. [Google Scholar]
  13. Carpa, R.; Drăgan-Bularda, M.; Muntean, V. Microbiologie Generală: Lucrări Practice; Presa Universitară Clujeană: Cluj-Napoca, Romania, 2014. (In Romanian) [Google Scholar]
  14. Leaper, S.; Abdel-Karim, A.; Faki, B.; Luque-Alled, J.M.; Alberto, M.; Vijayaraghavan, A.; Holmes, S.M.; Szekely, G.; Badawy, M.I.; Shokri, N.; et al. Flux-enhanced PVDF mixed matrix membranes incorporating APTS-functionalized graphene oxide for membrane distillation. J. Membr. Sci. 2018, 554, 309–323. [Google Scholar] [CrossRef]
  15. Smith, B.C. Infrared interpretation. In A Systematic Approach; CRC Press: Boca Raton, FL, USA; London, UK; New York, NY, USA; Washington, DC, USA, 1999. [Google Scholar]
  16. Lucia, A.; Bacher, M.; van Herwijnen, H.W.; Rosenau, T. A direct silanization protocol for dialdehyde cellulose. Molecules 2020, 25, 2458. [Google Scholar] [CrossRef]
  17. Oh, T.; Choi, C.K. Comparison between SiOC thin films fabricated by using plasma enhance chemical vapor deposition and SiO2 thin films by using fourier transform infrared spectroscopy. J. Korean Phys. 2010, 56, 1150–1155. [Google Scholar] [CrossRef]
  18. Lewandowska, K.; Rosiak, N.; Bogucki, A.; CieleckaPiontek, J. Tuning Electronic and Magnetic Properties in Graphene Oxide–Porphyrins Complexes. OSF Prepr. 2019. [Google Scholar] [CrossRef]
  19. Habte, A.T.; Ayele, D.W. Synthesis and characterization of reduced graphene oxide (rGO) started from graphene oxide (GO) using the tour method with different parameters. Adv. Mater. Sci. Eng. 2019, 2019, 5058163. [Google Scholar] [CrossRef] [Green Version]
  20. da Silva, C.T.; Monteiro, J.P.; Radovanovic, E.; Girotto, E.M. Unprecedented high plasmonic sensitivity of substrates based on gold nanoparticles. Sens. Actuators B Chem. 2014, 191, 152–157. [Google Scholar] [CrossRef]
  21. Alruwais, R.S.; Adeosun, W.A.; Marwani, H.M.; Jawaid, M.; Asiri, A.M.; Khan, A. Novel aminosilane (APTES)-grafted polyaniline@ graphene oxide (PANI-GO) nanocomposite for electrochemical sensor. Polymers 2021, 13, 2562. [Google Scholar] [CrossRef]
  22. Aliyev, E.; Filiz, V.; Khan, M.M.; Lee, Y.J.; Abetz, C.; Abetz, V. Structural characterization of graphene oxide: Surface functional groups and fractionated oxidative debris. Nanomaterials 2019, 9, 1180. [Google Scholar] [CrossRef] [Green Version]
  23. Cham Sa-Ard, W.; Fawcett, D.; Fung, C.C.; Chapman, P.; Rattan, S.; Poinern, G.E.J. Synthesis, characterisation and thermo-physical properties of highly stable graphene oxide-based aqueous nanofluids for potential low-temperature direct absorption solar applications. Sci. Rep. 2021, 11, 16549. [Google Scholar] [CrossRef]
  24. Steiner, P. Nanoscopic Infrared Characterisation of Graphene Oxide. Doctoral Dissertation, University of Manchester, Manchester, UK, 2018; 94p. [Google Scholar]
  25. Balaji, A.; Yang, S.; Wang, J.; Zhang, J. Graphene oxide-based nanostructured DNA sensor. Biosensors 2019, 9, 74. [Google Scholar] [CrossRef] [Green Version]
  26. Batra, K.; Nayak, S.; Behura, S.K.; Jani, O. Optimizing performance parameters of chemically-derived graphene/p-Si heterojunc-tion solar cell. J. Nanosci. Nanotechnol. 2015, 15, 4877–4882. [Google Scholar] [CrossRef]
  27. Liu, P.; Yao, Z.; Zhou, J. Controllable synthesis and enhanced microwave absorption properties of silane-modified Ni 0.4 Zn 0.4 Co 0.2 Fe2O4 nanocomposites covered with reduced graphene oxide. RSC Adv. 2015, 5, 93739–93748. [Google Scholar] [CrossRef]
  28. Hanifah, M.F.; Jaafar, J.; Aziz, M.; Ismail, A.F.; Rahman, M.A.; Othman, M.H. Synthesis of graphene oxide nanosheets via modified hummers’ method and its physicochemical properties. J. Teknol. 2015, 74, 195–198. [Google Scholar] [CrossRef] [Green Version]
  29. Stroe, M.; Cristea, M.; Matei, E.; Galatanu, A.; Cotet, L.C.; Pop, L.C.; Baia, M.; Danciu, V.; Anghel, I.; Baia, L.; et al. Optical properties of composites based on graphene oxide and polystyrene. Molecules 2020, 25, 2419. [Google Scholar] [CrossRef]
  30. Weigel, C.; Kellner, R. FTIR-ATR-spectroscopic investigation of the silanization of germanium surfaces with 3-aminopropyltriethoxysilane. Fresenius Z. Anal. Chem. 1989, 335, 663–668. [Google Scholar] [CrossRef]
  31. Arkles, B.C.; Peterson, W.R., Jr.; Anderson, R. Silicon Compounds: Register and Review, 3rd ed.; Petrarch Systems Inc.: Bristol, PA, USA, 1984; 240p. [Google Scholar]
  32. Banu, R.; Salvi, N.; Ameta, C.; Ameta, R.; Punjabi, P.B. Visible light driven photocatalytic degradation of brilliant green dye using graphene oxide/copper oxide binary composite. Indian J. Chem. 2019, 58B, 157–166. [Google Scholar]
  33. Moura, I.A.D.B.; Sousa, T.G.D.; Lima, A.M.; Silva, W.O.D.; Brandao, L.P. Synthesis and characterization of graphene-oxide reinforced copper matrix composite. Mater. Proc. 2020, 4, 72. [Google Scholar] [CrossRef]
  34. Cahyana, A.H.; Liandi, A.R.; Yunarti, R.T.; Febriantini, D.; Ardiansah, B. Green synthesis of dihydropyrimidine based on cinnamaldehyde compound under solvent-free using graphene oxide as catalyst. AIP Conf. Proc. 2019, 2168, 020069. [Google Scholar] [CrossRef]
  35. Lozovskis, P.; Jankauskaitė, V.; Guobienė, A.; Kareivienė, V.; Vitkauskienė, A. Effect of graphene oxide and silver nanoparticles hybrid composite on P. aeruginosa strains with acquired resistance genes. Int. J. Nanomed. 2020, 15, 5147. [Google Scholar] [CrossRef] [PubMed]
  36. Li, N.; Chen, X.; Chen, X.; Ding, X.; Zhao, X. Ultrahigh humidity sensitivity of graphene oxide combined with Ag nanoparticles. RSC Adv. 2017, 7, 45988–45996. [Google Scholar] [CrossRef] [Green Version]
  37. Dai, J.; Zhao, H.; Ye, Y.; Wang, L.; Cao, S.; Su, X.; Hu, X.; Li, L. Improving the selectivity of magnetic graphene oxide through amino modification. Water Sci. Technol. 2017, 76, 2959–2967. [Google Scholar] [CrossRef] [Green Version]
  38. Yuan, H.; Qi, F.; Zhao, N.; Wan, P.; Zhang, B.; Xiong, H.; Liao, B.; Ouyang, X. Graphene oxide decorated with titanium nanoparti-cles to reinforce the anti-corrosion performance of epoxy coating. Coatings 2020, 10, 129. [Google Scholar] [CrossRef] [Green Version]
  39. Shaari, H.A.H.; Ramli, M.M.; Mohtar, M.N.; Razali, N.H.F. Characterization and conductivity of graphene oxide (GO) dispersion in different solvents. AIP Conf. Proc. 2021, 2332, 060001. [Google Scholar] [CrossRef]
  40. Xiong, G.; Pal, U.; Serrano, J.G.; Ucer, K.B.; Williams, R.T. Photoluminesence and FTIR study of ZnO nanoparticles: The impurity and defect perspective. Phys. Stat. Sol. 2006, 3, 3577–3581. [Google Scholar] [CrossRef]
  41. Saranya, M.; Ramachandran, R.; Wang, F. Graphene-zinc oxide (G-ZnO) nanocomposite for electrochemical supercapacitor applications. J. Sci. Adv. Mater. Devices. 2016, 1, 454–460. [Google Scholar] [CrossRef] [Green Version]
  42. Clarina, T.; Rama, V. [3 + 2] Cycloaddition promoted by zinc oxide nanoparticles anchored on reduced graphene oxide using green solvent. Synth. Commun. 2018, 48, 175–187. [Google Scholar] [CrossRef]
  43. Sookhakian, M.; Ridwan, N.A.; Zalnezhad, E.; Yoon, G.H.; Azarang, M.; Mahmoudian, M.R.; Alias, Y. Layer-by-layer electrodeposited reduced graphene oxide-copper nanopolyhedra films as efficient platinum-free counter electrodes in high efficiency dye-sensitized solar cells. J. Electrochem. Soc. 2016, 163, D154–D159. [Google Scholar] [CrossRef]
  44. Pang, Y.L.; Tee, S.F.; Lim, S.; Abdullah, A.Z.; Ong, H.C.; Wu, C.H.; Chong, W.C.; Mohammad, A.W.; Mahmoudi, E. Enhancement of photocatalytic degradation of organic dyes using ZnO decorated on reduced graphene oxide (rGO). Desalination Water Treat. 2018, 108, 311–321. [Google Scholar] [CrossRef]
  45. Xu, J.; Zhang, Y.; Gutha, Y.; Zhang, W. Antibacterial property and biocompatibility of chitosan/poly(vinyl alcohol)/ZnO (CS/PVA/ZnO) beads as an efficient adsorbent for Cu(II) removal from aqueous solution. Colloids Surf. B Biointerfaces 2017, 156, 340–348. [Google Scholar] [CrossRef]
  46. Soltani, T.; Lee, B.K. A benign ultrasonic route to reduced graphene oxide from pristine graphite. J. Colloid Interface Sci. 2017, 486, 337–343. [Google Scholar] [CrossRef]
  47. Eigler, S.; Dotzer, C.; Hof, F.; Bauer, W.; Hirsch, A. Sulfur species in graphene oxide. Chem. Eur. J. 2013, 19, 9490–9496. [Google Scholar] [CrossRef]
  48. Yang, H.; Li, F.; Shan, C.; Han, D.; Zhang, Q.; Niu, L.; Ivask, A. Covalent functionalization of chemically converted graphene sheets via silane and its reinforcement. J. Mater. Chem. 2009, 19, 4632–4638. [Google Scholar] [CrossRef]
  49. Zhang, X.; Zhang, W.; Li, Y.; Li, C. Hybrid luminescent materials of graphene oxide and rare-earth complexes with stronger luminescence intensity and better thermal stability. Dye. Pigment. 2017, 140, 150–156. [Google Scholar] [CrossRef]
  50. De Faria, A.F.; Martinez, D.S.T.; Meira, S.M.M.; de Moraes, A.C.M.; Brandelli, A.; Souza Filho, A.G.; Alves, O.L. Anti-adhesion and antibacterial activity of silver nanoparticles supported on graphene oxide sheets. Colloids Surf. B Biointerfaces 2014, 113, 115–124. [Google Scholar] [CrossRef]
  51. Yang, S.Q.; Yuan, P.; He, H.P.; Qin, Z.H.; Zhou, Q.; Zhu, J.X.; Liu, D. Effect of reaction temperature on grafting of γ-aminopropyl triethoxysilane (APTES) onto kaolinite. Appl. Clay Sci. 2012, 62, 8–14. [Google Scholar] [CrossRef]
  52. Li, D.; Müller, M.B.; Gilje, S.; Kaner, R.B.; Wallace, G.G. Processable aqueous dispersions of graphene nanosheets. Nat. Nanotechnol. 2008, 3, 101–105. Available online: http://www.nature.com/doifinder/10.1038/nnano.2007.451. (accessed on 4 October 2021). [CrossRef]
  53. Hidayah, N.M.S.; Liu, W.W.; Lai, C.W.; Noriman, N.Z.; Khe, C.S.; Hashim, U.; Lee, H.C. Comparison on graphite, graphene oxide and reduced graphene oxide: Synthesis and characterization. AIP Conf. Proc. 2017, 1892, 150002. [Google Scholar] [CrossRef]
  54. Emiru, T.F.; Ayele, D.W. Controlled synthesis, characterization and reduction of graphene oxide: A convenient method for large scale production. Egypt. J. Basic Appl. Sci. 2017, 4, 74–79. [Google Scholar] [CrossRef] [Green Version]
  55. Patil, A.G.; Bafna, H.R.; More, M.P.; Deshmukh, P.K.; Patil, P.O. Green Synthesis of graphene based silver nanocomposite for enhanced antibacterial activity against dental pathogens. JSM Nanotechnol. Nanomed. 2017, 5, 1058. [Google Scholar]
  56. Yang, Y.; Liu, T. Fabrication and characterization of graphene oxide/zinc oxide nanorods hybrid. Appl. Surf. Sci. 2011, 257, 8950–8954. [Google Scholar] [CrossRef]
  57. Singh, D.K.; Pandey, D.K.; Yadav, R.R.; Singh, D. A study of nanosized zinc oxide and its nanofluid. Pramana 2012, 78, 759–766. [Google Scholar] [CrossRef]
  58. Liu, S.; Zeng, T.H.; Hofman, M.; Burcombe, E.; Wei, J.; Jiang, R.; Kong, J.; Chen, Y. Antibacterial activity of graphite, graphene oxide, and reduced graphene oxide: Membrane and oxidative stress. ACS Nano 2011, 5, 6971–6980. [Google Scholar] [CrossRef]
  59. Moldovan, M.; Prodan, D.; Sarosi, C.; Carpa, R.; Socaci, C.; Rosu, M.C.; Pruneanu, S. Synthesis, morpho-structural properties and antibacterial effect of silicate-based composites containing graphene oxide/hydroxyapatite. Mater. Chem. Phys. 2018, 217, 48–53. [Google Scholar] [CrossRef]
  60. Ruiz, O.N.; Fernando, K.A.; Wang, B.; Brown, N.A.; Luo, P.G.; McNamara, N.D.; Vangsness, M.; Sun, Y.P.; Bunker, C.E. Graphene oxide: A nonspecific enhacer of cellular growth. ACS Nano 2011, 5, 8100–8107. [Google Scholar] [CrossRef] [PubMed]
  61. Duran, N.; Marcato, P.D.; Conti, R.D.; Alves, O.L.; Costa, F.T.M.; Brocchi, M. Potential use of silver nanoparticles on pathogenic bacteria, their toxicity and possible mechanisms of action. J. Brazil. Chem. Soc. 2010, 21, 949–959. [Google Scholar] [CrossRef]
  62. Das, M.R.; Sarma, R.K.; Saikia, R.; Kale, V.S.; Shelke, M.V.; Sengupta, P. Synthesis of silver nanoparticles in an aqueous suspension of graphene oxide sheets and its antimicrobial activity. Colloids Surf. B Biointerfaces 2011, 83, 16–22. [Google Scholar] [CrossRef]
  63. Khorrami, S.; Abdollahi, Z.; Eshaghi, G.; Khosravi, A.; Bidram, E.; Zarrabi, A. An improved method for fabrication of Ag-GO nanocomposite with controlled anti-cancer and anti-bacterial behavior: A comparative study. Sci. Rep. 2019, 9, 1–10. [Google Scholar]
  64. Mohamed, M.M.; Ghanem, M.A.; Khairy, M.; Naguib, E.; Alotaibi, N.H. Zinc oxide incorporated carbon nanotubes or graphene oxide nanohybrids for enhanced sonophotocatalytic degradation of methylene blue dye. Appl. Surf. Sci. 2019, 487, 539–549. [Google Scholar] [CrossRef]
Figure 1. FT-IR spectra of silane (APTES).
Applsci 11 11330 g001
Figure 2. FT-IR spectra of graphene oxide (GO) and silanized graphene oxide (GO-APTES).
Applsci 11 11330 g002
Figure 3. FT-IR spectra of graphene oxide (GO), graphene oxide with silver (GO-Ag) and silanized graphene oxide with silver (GO-Ag-APTES).
Applsci 11 11330 g003
Figure 4. FT-IR spectra of graphene oxide (GO), graphene oxide with zinc oxide (GO-ZnO) and silanized graphene oxide with zinc oxide (GO-ZnO-APTES).
Applsci 11 11330 g004
Figure 5. TG (a) and DTA (b) curves of GO, GO-Ag, GO-Ag-APTES, GO-ZnO and GO-ZnO-APTES GO.
Applsci 11 11330 g005
Figure 6. UV-Vis spectra of GO, GO-Ag, GO-Ag-APTES, GO-ZnO si GO-ZnO-APTES powders.
Applsci 11 11330 g006
Figure 7. SEM images of the: (a) GO, (b) GO-APTES (c) GO-Ag, (d) GO-Ag-APTES, (e) GO-ZnO and (f) GO-ZnO-APTES powders, at ×500 and (×5000 superimposed) magnifications.
Applsci 11 11330 g007
Figure 8. Images of samples (a) at time 0 and (b) after 18 h of incubation.
Applsci 11 11330 g008
Table 1. The diameter of inhibition zones (mm) for the tested graphenes.
Sample */Bacterial Strain01234
Streptococcus mutans1818182217
Porphyromonas gingivalis1417201915
Enterococcus faecalis1415121719
Escherichia coli1415151815
Staphylococcus aureus1416151814
* Legend: 0 = GO, 1 = GO-Ag, 2 = GO-Ag-APTES, 3 = GO-Zn, 4 = GO-Zn-APTES.
Publisher’s Note: MDPI stays neutral with regard to jurisdictional claims in published maps and institutional affiliations.

