1. Introduction
Inculcating knowledge and building awareness to prepare people to understand the dangers of tsunamis and deal with such disasters in the future are still issues today. Lessons learned from the 2011 tsunamis in Tohoku, Japan are that past understanding of tsunamis and the provision of continuous tsunami education may be effective ways to promote safe and reliable disaster management (e.g., [
1]). Therefore, it is essential to inform the public about the possibility of large tsunami waves beyond those that occurred before 2011 [
2]. It has been reported that people who live in earthquake and tsunami-prone areas, such as Lampung Bay, Indonesia [
3] and the port city of Valparaíso, Chile [
4], have insufficient knowledge and awareness about earthquakes and tsunamis. In fact, the Lampung Bay area, Indonesia is prone to tectonic and volcanic activity from Mount Anak Krakatau. The region experienced a tectonic earthquake that caused a tsunami in 2018 [
5], and the mighty eruption of Krakatoa caused a tsunami in 1883 [
6]. Meanwhile, the port city of Valparaíso, Chile, experienced four major earthquakes in the 18th century and two major earthquakes that triggered tsunamis in 2010 and 2015. Likewise, it has been reported that people on the southern coast of Makran, Iran have low levels of awareness and are reluctant to move out of the area. In 1945, a tsunami struck the area where they live [
7]. Furthermore, individuals who live in regions where a tsunami has not occurred, such as the beaches of Kamakura, Japan, and different coastal cities in Florida, USA, may have low levels of awareness. The city of Kamakura experienced tsunamis in the years 1241, 1495, 1703, and 1923. Florida has several potential seismic and volcanic resources in the Caribbean, a sea that has created tsunamis in the past. Although residents and visitors in those areas have a relatively high level of awareness, their knowledge about evacuation is still lacking [
8].
Three-dimensional modeling is considered to have several advantages. Sugawara (2018) showed that 3D modeling is able to simulate the details, such as the vertical movement of water and soil scouring behind it [
9]. Likewise, Marras & Mandli (2021) showed the three-dimensional nature of flow approaching the coast and moving inland and demonstrated that it is important to simulate its turbulent nature. Moreover, the 3D model with the Reynolds-averaged Navier-Stokes (RANS) equation simulates tsunami inundation better than the two-dimensional model with depth-averaged flow [
10,
11]. In order to convey information to the general public, 3D modeling developed based on photorealistic visualization and animations is more easily understood by society [
12,
13]. A photorealistic visualization and 3D animation method were developed to allow the public to understand the tsunami phenomenon intuitively. However, the spatial resolution of the particles and flooded area method used in this model are not sufficient due to cost and time limitations as well as the available photos being out-of-date [
12]. The weaknesses of the photorealistic visualization method were solved by developing the Unmanned Aerial Vehicle (UAV) approach and photogrammetry technique [
14].
Unmanned Aerial Vehicle (UAV) platforms and photogrammetry techniques have been utilized for disaster management. These approaches have been used for investigation and information gathering in post-disaster areas for rescue and the development of emergency management [
15,
16,
17,
18,
19]. Regarding tsunami disasters, UAV photogrammetric methods have been applied to analyze dislocations and boulder deposits as a sign of high-energy waves on the coast, which may indicate the presence of tsunamis [
20,
21,
22]. Moreover, [
23] argued that the tsunami inundation model made by the “Digital Elevation Model’’ (DEM)-UAV is much more reliable than the DEM-National Topographic Map (RBI) because it includes geometric error correction steps using Ground Control Point (GCP) and DEM data in the photogrammetric process. Unfortunately, the authors did not discuss how to determine safe areas and evacuation routes in detail. In addition, they did not create 3D buildings that make the inundation area more real to allow the wider public to understand them more easily.
The use of UAV photogrammetry for 3D tsunami mapping and modeling will likely provide several benefits for conveying tsunami hazard information to the community. This method produces a model that “shows the current area situation”, is flexible, has a high image resolution, is accurate, and is low cost [
15,
24,
25]. Moreover, the approach is most useful in situations where the speed of information is important [
19]. In addition, for geodata acquisition, UAV is more suitable if applied to a small area [
20]. Furthermore, the model resembles the original object; thus, the community can easily understand the information conveyed [
14].
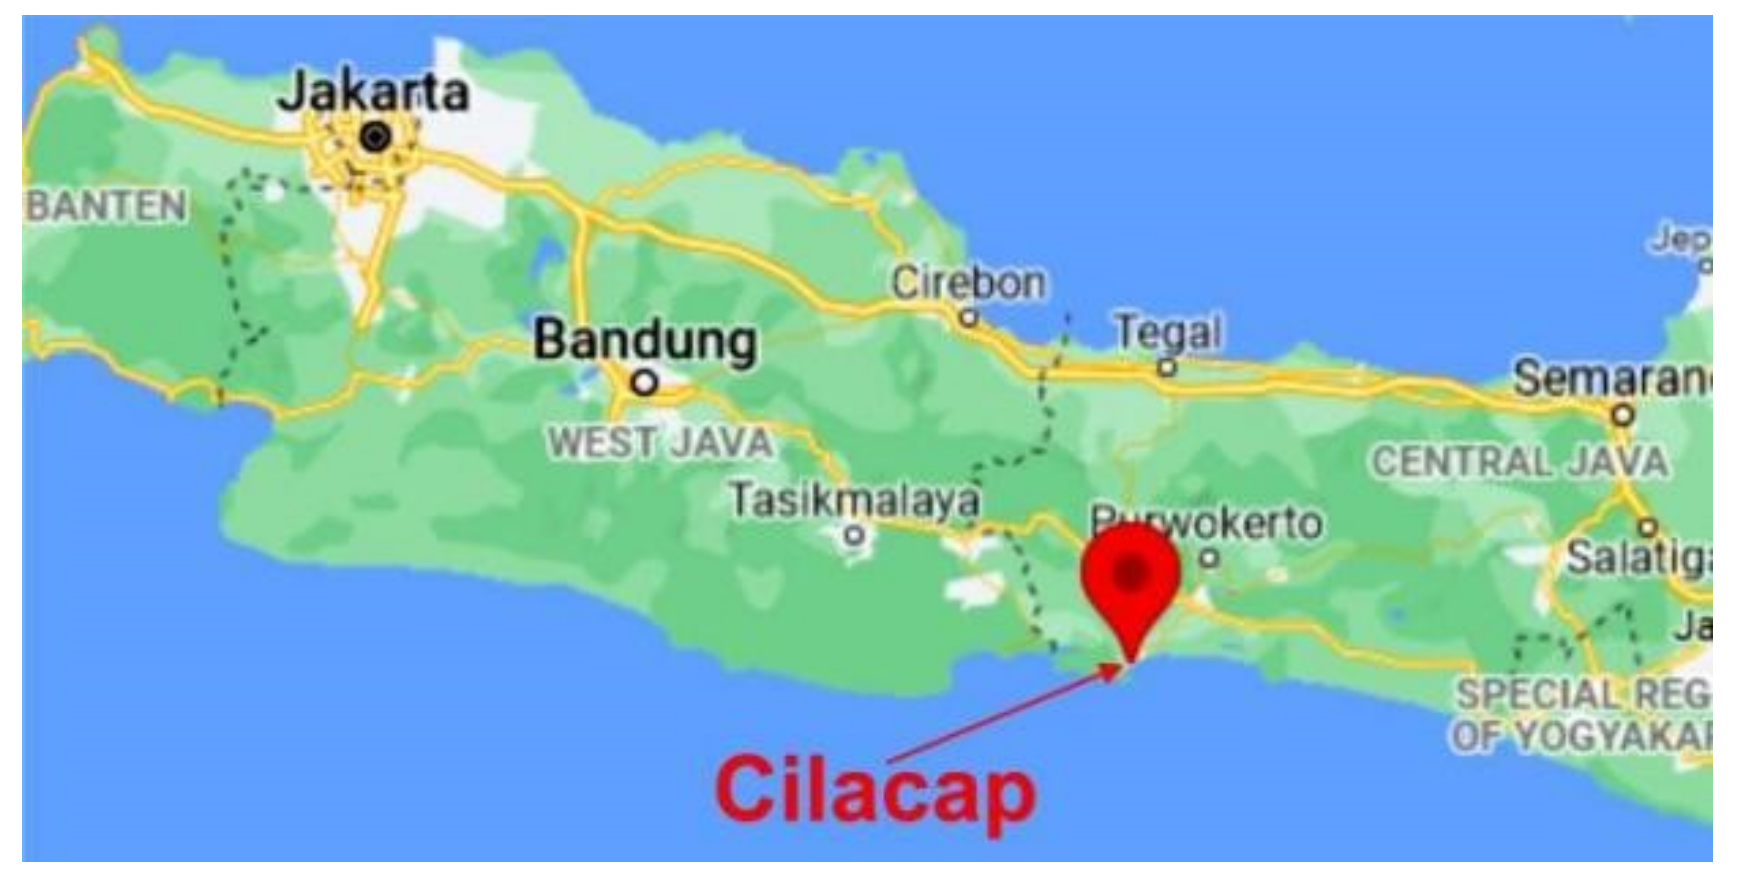
The research purpose is to carry out 3D modeling of tsunami hazards using UAV photogrammetry. This paper develops a series of procedures for building a 3D model to provide information during normal periods and during the occurrence of a tsunami, including infomration about the distribution, distance, and depth of inundation. We measure the height and shape of the exterior of the building by referring to orthomosaic and DEM data obtained from the UAV platform and processed by the Agisoft metashape professional application. This technique can indicate safe areas so that evacuation routes can be planned. Thus, this study fills a gap in previous research. The study focused on the area of Cilacap, Indonesia as the sample location. Cilacap is an oil and gas industrial city that has the largest oil refinery in Indonesia and several supporting facilities for oil and gas activities [
26].
2. Material and Methods
This research was carried out using an experimental method [
27] to experiment with the technique of using drones in photogrammetry to produce good quality aerial photos and also to experiment with Agisoft software settings during the processing of aerial photos to accurately produce a 3D orthomosaic and formulate a visualization technique to estimate the extent of tsunami wave distribution. This research used drones to take aerial photos in the field and a computer laboratory to process aerial photos into 3D models. The stages of experiments carried out in this research can be seen in the
Figure 1.
2.1. Literature Review
Before starting the research, a review of the literature from various previous studies was carried out to find out how tsunami modeling has been conducted previously, what the prospects of photogrammetry for 3D animation modeling are, and why Cilacap was chosen as a sample location for tsunami modeling.
2.1.1. Previous Tsunami Modeling
Tsunami modeling is incredibly beneficial for visualizing tsunami events that have already happened and will happen in the future [
28]. Current modeling is in the forms of numerical simulations [
29,
30,
31], 2D tsunami simulation modeling [
24,
32,
33], and 3D tsunami simulation modeling [
12,
34,
35].
A deeper review of 3D tsunami simulation modeling identified three types of 3D tsunami simulation modeling that are widely used today. They are high-resolution Modeling based on Computational Fluid Dynamics (CFD), modeling based on photorealistic particle visualization methods, and photogrammetry/unmanned aerial vehicles (UAV) methods [
14]. Of these three models, the photogrammetry/unmanned aerial vehicle (UAV) typeis the most visually realistic, has a high level of accuracy, and is most easily understood by ordinary people [
12,
34,
35,
36,
37].
Several types of software are commonly used to create virtual cities for tsunami modeling, such as Lumion and City Engine. However, the results obtained with virtual cities do not represent the original environment, because they are made based on the properties provided in the software. Therefore, the photogrammetry/UAV technique is better, because it can produce a virtual city that follows the original environment [
12,
35,
36]. However, this technique also has weaknesses because it takes a long time to carry out the production process and requires a computer with very high specifications. Moreover, the production costs are expensive compared with those required to create a virtual city with the software [
14].
2.1.2. Photogrammetry Prospects for 3D Animation Modeling
Unmanned Aerial Vehicle Photogrammetry (UAV-Ph) has recently acquired popularity as a cost-effective and efficient method of generating high-quality maps and geometric data [
38]. which is essential for 3D modeling [
39]. Two of the most interesting features of UAV-Ph methods are their ability to flexibly adjust the scale required for high-precision surveying and mapping products by changing the flying height and their ability to vertically orient the image to the target surface [
40]. Sashi and Jain (2007) said that the precision obtained in the photogrammetry of 3D modeling corresponds perfectly with the original object, which is required for any further work, like reconstruction [
41]. UAV-Ph is also used to document archaeological sites to detect debris [
42]. The geometric information obtained is applied to 3D modeling and reconstruction, in some cases of cave geometry or ancient Turkish theatre. Photogrammetry is considered the best type of technology for processing image data because it can provide accurate, metric, and detailed 3D information in any application range and can estimate the accuracy and reliability of unknown parameters based on the measured image correspondence [
43,
44]. The main application areas of photogrammetry are cartography and mapping, accurate 3D documentation of cultural heritage [
45,
46], reverse engineering, building monitoring and deformation analysis [
47]; human movement analysis [
48], industrial surveying [
49], Urban Planning, forensics [
50], navigation, heating, telecommunications, and others.
2.1.3. Cilacap as a Study Area
The district is located in an area that is vulnerable to severe earthquakes that could potentially trigger a tsunami. Based on data from paleo-tsunami deposits, tsunamis hit Cilacap district in 1883, 1982, and 2006 [
51,
52]. The last tsunami generated waves as high as 5–8 m in the southwest to the center of the island of Java. The waves were triggered by a 7.8-Richter-Scale earthquake off the coast of Pangandaran in the south. Waves moved from Pangandaran beach to Widarapayung beach in Cilacap and reached a height of 21 m on Nusakambangan Island, located in the northern city of Cilacap [
53]. In the future, Cilacap district has the potential to be hit by a tsunami with a wave height of 20 m due to a 8.7–9.2 SR megathrust earthquake in southern Java [
51,
54,
55].
The Indian Ocean borders Cilacap district in the south and west, as well as rivers in the south and east. The geographical location gives this district the potential to be hit by tsunami waves from three directions, especially in the southern part of the district [
54,
56,
57].
Cilacap is the largest district in Central Java province, Indonesia, having an area of around 6.2% of the total area of Central Java province. Several areas in Cilacap have become marine industries and port centers and are connected to the rail network. This district has a special economic role in the oil industry and agriculture sector. The district of Cilacap is one of the most densely populated urban-coastal areas in Central Java Province, Indonesia [
58]. In addition, the district is developing dynamically, with several buildings being located just a few meters from the shoreline [
59]. The Indonesia National Disaster Management Authority (BNPB) estimates that tsunami inundation in Cilacap will impact 10 sub-districts with a total of 86,149 people exposed.
2.2. Tsunami Data from Cilacap
The data used for tsunami modeling in this research were obtained from previous research conducted by [
51,
60]. The data included tsunami height model along the southern coast of Java, which was made based on the worst-case scenario where the source of the tsunami being modeled on the southern coast of Java broke at the same time (Cilacap is one of the areas included in the area of the south coast of Java) (see
Figure 2). Based on the obtained data, the lowest tsunamis produce waves that are 0.83 m in height, and the highest produce waves that reach 18.22 m in height. This is shown in
Figure 3.
2.3. Location Determination Coordinates and GCP
The model required the determination of location coordinates, the installation and measurement of Ground Control Points (GCP), aerial photos, aerial photo processing, tsunami distribution point formulation, tsunami distribution point visualization, and tsunami distribution point distance measurement (start point distance and endpoint distance).
Table 1 below is the location of the coordinates for determining the location to fly the drone.
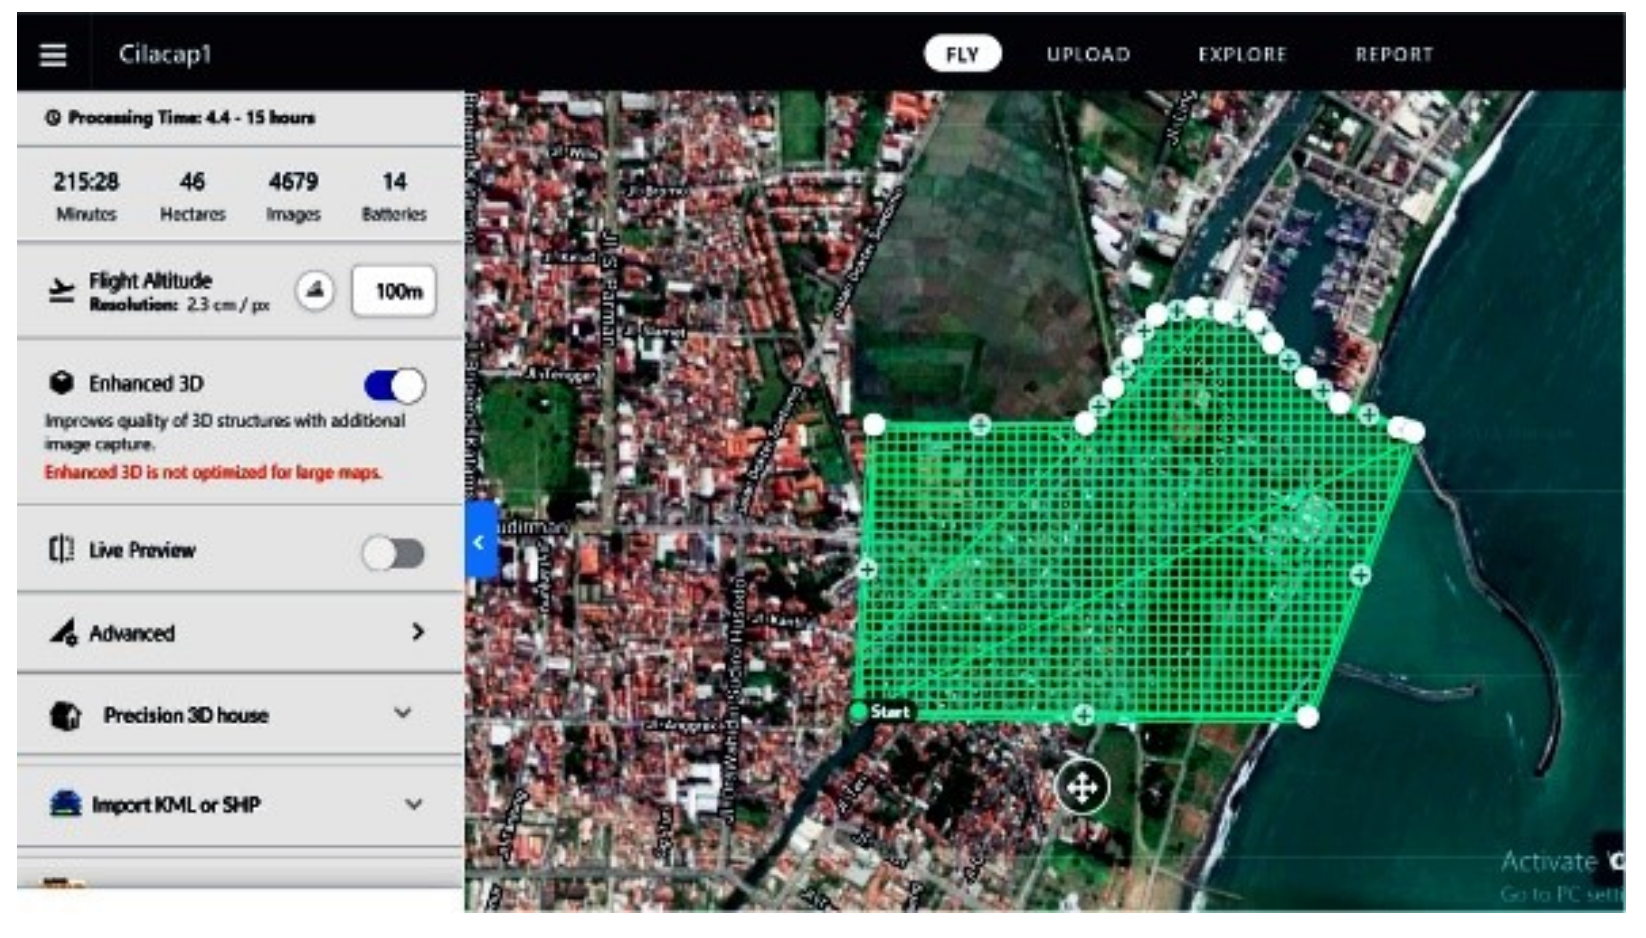
To fly the drone at the research location, used the DroneDeploy software to establish the autopilot setting, as illustrated in
Figure 4.
Before flying the drone, ten Ground Control Points (GCPs) were installed on the ground for the global positioning of object points (Premark). The coordinate point parameters used as control points in the coordinate transformation are listed in
Table 2.
2.4. UAV Process Drone Photogrammetry
After determining the location for the mapping area, a process of taking aerial photos with Unmanned Aerial Vehicles (UAV) using the drone was carried out.
Table 3 presents the specifications of the equipment and the parameters of the autopilot track mode used.
A total of 4853 aerial photos were produced using aerial image recording with drones, with a resolution of 4000 × 3000 pixels.
Figure 5 shows some of the successful aerial photos taken.
The thirteen drone flights were planned when designing an application for autopilot settings. However, 16 drone flights were used during the actual implementation on the field due to the adjustment of wind speed conditions. Each drone flight took 18 to 23 min to complete. Gimbal orientation was 90’, the front lap and side lap values were 85 per cent using the 3D crosshatch method, the GSD was 3.3 cm/px, and the flight speed was 5 m/s.
There were no issues with the region’s reconstruction because no structures had high density or complexity. The drones were flown high enough above the buildings (100 m from ground level) to prevent the overlapping value being reduced. Some of the issues experienced while flying drones on the field, such as changes in wind speed in the morning, afternoon, and evening, resulted in reductions in the drone flying speed. Changes in the amount of light, which can be more significant during the day, as well as reflections of light from the sea surface, might impact camera calibration quality. To overcome this problem, before we could fly the drone, we had to wait until the amount of sunlight reflected during the day had lowered.
2.5. Orthomosaic Process
The next stage was to process the aerial photos using photogrammetry techniques to produce a 3D orthomosaic, using Agisoft metashape professional software. It is critical to calibrate the camera before undergoing model reconstruction so that the model produced has a high level of accuracy. If an image is captured with a different camera, this step is essential. Images were only taken with one camera in this research, but the camera calibration process was carried out nevertheless. The stages and settings are shown in
Table 4, and the visual results of the 3D orthomosaic modeling process are shown in
Figure 6 and
Figure 7.
2.6. Formulation of the Distribution Area
The process of determining the distribution area and the distance of tsunami waves involved measurements through distribution area formulations. These were generated through a comparison between the DEM of the first building, which was closest to the shoreline; the maximum height of the building closest to the shoreline; the maximum height of the tsunami wave; and the degree of the tsunami wave slopes after arriving on land and hitting buildings, trees, or stones.
The method used to measure the tsunami area distribution was the Simple Additive Weighting Method (SAW), which has the following equation:
where
WD is the tsunamis wave distribution area (tsunamis endpoint);
P1 is the DEM of the building closest to the beach;
P2 is the height of the building closest to the beach;
P3 is the tsunami wave height prediction;
P4 is the slope degree of the tsunami waves.
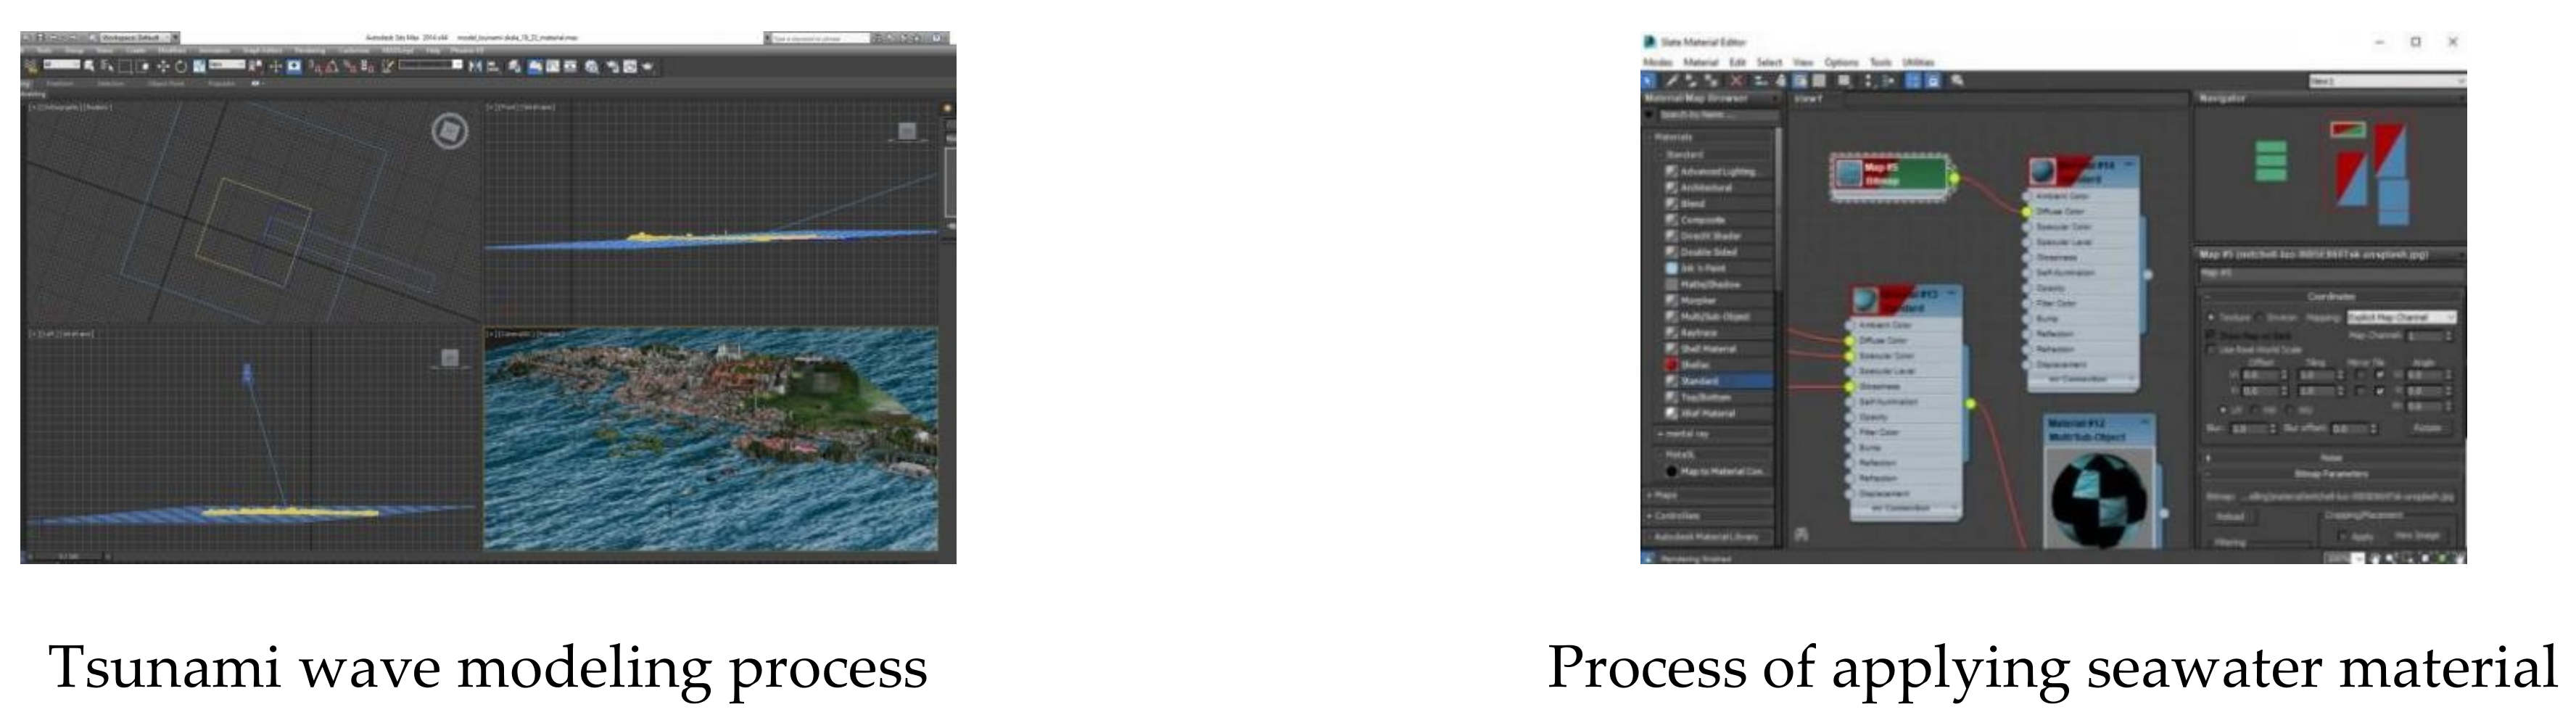
2.7. Three-Dimensional Modeling Process
This stage was carried out to create a model of tsunami height and the distribution of tsunami waves from the starting point (coastal line) to the endpoint. This process was based on the calculation of the distribution area formulation (see
Figure 8) with the following data: P1 = 0, P2 = 15 m, P3= 18.22 m, P4= 10
0. This 3D modeling process was conducted using 3ds max software with a plane and polygon mesh tool, which was then molded into a tsunami wave with a height and wave distribution that was changed to fit the data from the starting point to the endpoint of the tsunami wave. After that, elements that matched the color of ocean water were applied to the model to make it look more genuine. This tsunami model was merged with the 3D orthomosaic model created previously with Agisoft metashape professional software by importing it into the 3ds max program and combining it with ocean wave modeling, resulting in single modeling. The process is shown in
Figure 9.
2.8. Three-Dimensional Modeling Visualization Results
The results of the 3D Modeling Process below show the conditions before the tsunami and the conditions when the tsunami happened. The differences can be clearly viewed in
Figure 10.
2.9. Measurement Coordinates of Tsunami Distribution
After determining the distribution of sea waves created in the 3D modeling visualization process, the next step was to measure the distance between the starting point and the tsunami wave end using Agisoft metashape professional software, as shown in
Figure 11.
3. Results and Discussion
The modeling methods that are used widely today are difficult for ordinary people to understand. Therefore, this research tried to design a method that ordinary people can easily understand. The method used here for tsunami modeling involves the application of photogrammetry techniques from drones/Unmanned Aerial Vehicles (UAV). The resulting 3D orthomosaic pictures are further processed to simulate tsunami waves using 3D modeling software (3ds max). The simulation involves the implementation of distribution area formulations.
The results of mathematical calculations used to measure tsunami characteristics, such as wave distribution, height, and distance from the starting and ending points, are plotted into an orthomosaic 3D image resulting in visualization or animation that is similar to the actual tsunami event. Therefore, the visualization is easily understood by ordinary people.
This research developed a formula to calculate the distribution area of tsunami waves and the distance of tsunami waves to the endpoint. The formulation was obtained through a comparison between the DEM of the first building closest to the shoreline, the maximum height of the building closest to the shoreline, the maximum height of the tsunami wave, and the degree of inclination of the tsunami wave after hitting land, a building, a tree, or stones. The formula can be used as a guide to conduct 3D modeling of tsunami waves, the height of the tsunami, the distribution of the tsunami waves, and the furthest distance (endpoint) from the tsunami waves.
When a tsunami wave reaches the beach and collides with the ground, buildings, trees, or rocks, the slope of the tsunami wave decreases, about a 100 drop in altitude, allowing a straight line to be drawn and the tsunami’s endpoint location to be determined.
The 3D modeling of tsunami waves was conducted using 3ds max software, while the 3D orthomosaic results from the sample area in the research location (Cilacap) were produced using Agisoft metashape professional software. For this orthomosaic process, photogrammetry data obtained from the UAV/Drone process were required from the sample research area (Cilacap).
Although the 3D tsunami model developed in this research can be carried out for any area, a location must be selected to be used as a sample. In this research, Cilacap was chosen as the sample location for tsunami simulation, because it has a historical record of past tsunami events (paleotsunamis), and there is a prediction that an 8.7–9.2 magnitude megathrust earthquake will occur in southern Java with the potential to cause a tsunami up to 20 m in height’. Therefore, the 3D tsunami model generated in this research is expected to convey information about the coordinates of the tsunami wave distribution and the furthest distance (endpoint) from the tsunami wave (refer to
Table 5). The model can be used as a recommendation to determine safe locations for evacuation routes and locations to build a shelter or to determine which existing buildings can be used as alternative shelters when tsunamis happen.
From the visualization of 3D tsunami modeling, the wave direction, how the water has infiltrated land and entered the river, the height of the wave, and the distribution area can be understood. Therefore, this tsunami model can also be used as a disaster education media to deliver accurate disaster information.
Tsunami hazard modeling through three-dimensional animations is predicted to mitigate wider negative consequences from tsunami disasters. A visually appealing and realistic model could help to boost public acceptance of the tsunami preparedness education program. According to our research, three-dimensional modeling can more correctly depict the power of tsunami waves by integrating three-dimensional models of nearby buildings. Three-dimensional modeling at a high resolution allows for a more accurate description of complicated tsunami events. Not only practical to society, the tsunami hazard map produced by three-dimensional modeling is also critical and influential for guiding the government and the Disaster Management Agency in their decision-making about evacuation structures. This is because it will allow them to assess the impact of a tsunami’s magnitude on a structure. This modeling technique can also be used to assess tsunami risk reduction. Additionally, three-dimensional modeling enables the identification of risk factors, the assessment of the economic impact of disaster damage, and can assist with spatial planning and disaster management.
4. Conclusions
Tsunami inundation scenarios and mitigation efforts can be conveyed through tsunami modeling. However, ordinary people have difficulty understanding currently used tsunami models. The contribution of this research is the development of a method that can be used to determine the distribution point of tsunami waves through the 3D orthomosaic technique that compares the heights of the buildings closest to the shoreline and a Digital Elevation Model (DEM) of the buildings closest to the shoreline and predicts the height of tsunamis waves and their slopes as they reach land. The 3D visualization results from this modeling provide a better understanding of the behaviors of tsunami inundation on land. Moreover, the 3D visualization is easier to understand by ordinary people and the policy-making community. Hence, it can be used for developing strategic policies for tsunami risk reduction, for example, for preparing evacuation routes and locations for building shelters and contingency planning. The model can also be used as a medium for disaster education and the delivery of accurate disaster information.
This research is limited to describing the process of conducting 3D modeling, the prediction of distribution, and determining the endpoint distance of the tsunami wave. Therefore, t further improvement in this area of research is needed in order to determine the strength of tsunami waves, the time of wave landing, the time of inundation from the shoreline to the endpoint of the waves on land, and the passage of time to the safe zone or assembly points. Future research should consider using these factors. Additionally, this modeling technique could be used to assess tsunami risk reduction. Three-dimensional modeling enables the identification of risk factors, the assessment of the economic impact of disaster damage, and assistance with spatial planning and disaster management’’.
Author Contributions
Data curation, A.Y., N.R.H., A.P., B.N. and A.M.R.; Formal analysis, A.P., B.N. and A.M.R.; Funding acquisition, Y.K.; Investigation, N.R.H.; Methodology, M.Y.R.; Project administration, S.K.K.; Supervision, M.Y.R.; Validation, N.R.H. and Y.K.; Visualization, M.Y.R.; Writing—original draft, M.Y.R.; Writing—review & editing, A.Y., N.R.H., Y.K. and S.K.K. All authors have read and agreed to the published version of the manuscript.
Funding
Kagawa University, Japan.
Acknowledgments
The writing team would like to express their deepest gratitude to the National Research and Innovation Agency (BRIN), InaTews Program, Research Center for Geotechnology, and Research Center for Informatics. In particular, we would like to extend many thanks and our appreciation to Kagawa University in Japan, which helped fund the publication of this paper.
Conflicts of Interest
In authoring and publishing this paper, the authors state that they have no conflict of interest.
References
- Suppasri, A.; Hasegawa, N.; Makinoshima, F.; Imamura, F.; Latcharote, P.; Day, S. An Analysis of Fatality Ratios and the Factors That Affected Human Fatalities in the 2011 Great East Japan Tsunami. Front. Built Environ. 2016, 2, 1–13. [Google Scholar] [CrossRef] [Green Version]
- Goto, K.; Ishizawa, T.; Ebina, Y.; Imamura, F.; Sato, S.; Udo, K. Ten years after the 2011 Tohoku-oki earthquake and tsunamis: Ge-ological and environmental effects and implications for disaster policy changes. Earth-Sci. Rev. 2021, 212, 103417. [Google Scholar] [CrossRef]
- Susilorini, R.M.R.; Febrina, R.; Fitra, H.A.; Rajagukguk, J.; Wardhani, D.K.; Wastanimpuna, A.; Prameswari, L.L.N. Knowledge, Awareness, and Resilience of Earthquake and Tsunamis Disaster Risk Reduction in Coastal Area Knowledge, Awareness, and Resilience of Earthquake and Tsunamis Disaster Risk Reduction in Coastal Area. In Journal of Physics: Conference Series; IOP Publishing: Bristol, UK, 2021; Volume 1811, p. 012108. [Google Scholar]
- Zamora, N.; Gubler, A.; Orellana, V.; León, J.; Urrutia, A.; Carvajal, M.; Cisternas, M.; Catalán, P.; Winckler, P.; Cienfuegos, R.; et al. The 1730 Great Metropolitan Chile Earthquake and Tsunami Commemoration: Joint Efforts to Increase the Country’s Awareness. Geosciences 2020, 10, 246. [Google Scholar] [CrossRef]
- Sabara, Z.; Umam, R.; Prianto, K.; Junaidi, R.; Rahmat, A. Anak krakatau mountain (AKM) causes a rare tsunamis phenome-non: Impact around the Sunda strait, Indonesia Anak krakatau mountain ( AKM ) causes a rare tsunamis phenomenon: Impact around the Sunda strait, Indonesia. In IOP Conference Series: Earth and Environmental Science; IOP Publishing: Bristol, UK, 2021; Volume 739, p. 012036. [Google Scholar]
- Francis, P.W. The origin of the 1883 Krakatau tsunamiss. J. Volcanol. Geotherm. Res. 1985, 25, 349–363. [Google Scholar] [CrossRef]
- Salah, P. Knowledge, Awareness, and Attitudes toward Tsunamiss: A Local Survey in the Southern Coast of Iran. Sustainability 2021, 13, 449. [Google Scholar] [CrossRef]
- Esteban, M.; Bricker, J.; San, R.; Arce, C. Tsunamis awareness: A comparative assessment between Japan and the USA. Nat. Hazards 2018, 93, 1507–1528. [Google Scholar] [CrossRef] [Green Version]
- Sugawara, D. Evolution of Numerical Modeling as a Tool for Predicting Tsunami-Induced Morphological Changes in Coastal Areas: A Review since the 2011 Tohoku Earthquake. Drought Drought Mitig. Eur. 2018, 47, 451–467. [Google Scholar]
- Marras, S.; Mandli, K.T. Modeling and simulation of tsunamis impact: A short review of recent advances and future chal-lenges. Geosciences 2021, 11, 5. [Google Scholar] [CrossRef]
- Qin, X.; Motley, M.; LeVeque, R.; Gonzalez, F.; Mueller, K. A comparison of a two-dimensional depth-averaged flow model and a three-dimensional RANS model for predicting tsunami inundation and fluid forces. Nat. Hazards Earth Syst. Sci. 2018, 18, 2489–2506.18. [Google Scholar] [CrossRef] [Green Version]
- Isshiki, M.; Asai, M.; Eguchi, S.; O-Tani, H. 3D Tsunami Run-up Simulation and Visualization using Particle Method with Gis-Based Geography Model. J. Earthq. Tsunami. 2016, 10, 1640020. [Google Scholar] [CrossRef]
- Giannakidis, A.; Giakoumidakis, G.; Mania, K. 3D photorealistic scientific visualization of tsunami waves and sea level rise. In Proceedings of the 2014 IEEE International Conference on Imaging Systems and Techniques (IST) Proceedings, IEEE. Piscataway, NJ, USA, 14–17 October 2014; pp. 167–172. [Google Scholar]
- Rezaldi, M.Y.; Nugroho, B.; Kushadiani, S.K.; Prasetyadi, A.; Rivanto, A.M.; Hanifa, N.R.; Yoganingrum, A. A Systematical Review of the Tsu-namis Hazards Modeling. In Proceedings of the 3rd International Conference on Electrical Communication, and Computer Engineering ICECCE 2021, Bilek Hotel Istanbul Source, Istanbul, Turkey, 12–13 June 2021. [Google Scholar]
- Xu, Z.; Yang, J.; Peng, C.; Wu, Y.; Jiang, X.; Li, R.; Zheng, Y.; Gao, Y.; Liu, S.; Tian, B. Development of an UAS for post-earthquake disaster surveying and its application in Ms7.0 Lushan Earthquake, Sichuan, China. Comput. Geosci. 2014, 68, 22–30. [Google Scholar] [CrossRef]
- Meyer, D.; Hess, M.; Lo, E.; Wittich, C.E.; Hutchinson, T.C.; Kuester, F. UAV-based post disaster assessment of cultural heritage sites following the 2014 South Napa Earthquake. 2015 Digital. Herit. 2015, 2, 421–424. [Google Scholar]
- Cahyono, A.B.; A Zayd, R. Rapid mapping of landslide disaster using UAV-photogrammetry. J. Phys. Conf. Ser. 2018, 974, 012046. [Google Scholar] [CrossRef]
- Verykokou, S.; Ioannidis, C.; Athanasiou, G.; Doulamis, N.; Amditis, A. 3D reconstruction of disaster scenes for urban search and rescue. Multimed. Tools Appl. 2017, 77, 9691–9717. [Google Scholar] [CrossRef]
- Macchiarella, N.D.; Robbins, J.M.; Cashdollar, D.J. Rapid virtual object development using photogrammetric imagery obtained with small unmanned aircraft systems applications for disaster assessment and cultural heritage preservation. In Proceedings of the AIAA Scitech 2019 Forum, San Diego, CA, USA, 7–11 January 2019. [Google Scholar]
- Neitzel, F.; Klonowski, J. Mobile 3D Mappping with a Low-Cost UAV System. Int. Arch. Photogram-Metry Remote Sens. Spat. Inf. Sciences 2011, 38, C22. [Google Scholar]
- Hoffmeister, D. Monitoring the sedimentary budget and dislocated boulders in western Greece–Results since 2008. Sedimentology 2020, 67, 1411–1430. [Google Scholar] [CrossRef] [Green Version]
- Biolchi, S.; Furlani, S.; Devoto, S.; Scicchitano, G.; Korbar, T.; Vilibić, I.; Šepić, J. The origin and dynamics of coastal boulders in a semi-enclosed shallow basin: A northern Adriatic case study. Mar. Geol. 2019, 411, 62–77. [Google Scholar] [CrossRef]
- Biolchi, S.; Denamiel, C.; Devoto, S.; Korbar, T.; Macovaz, V.; Scicchitano, G.; Vilibić, I.; Furlani, S. Impact of the October 2018 Storm Vaia on Coastal Boulders in the Northern Adriatic Sea. Water 2019, 11, 2229. [Google Scholar] [CrossRef] [Green Version]
- Aris Marfai, M.; Fatchurohman, H.; Cahyadi, A. An Evaluation of Tsunamis Hazard Modeling in Gunungkidul Coastal Area using UAV Photogrammetry and GIS. Case Study: Drini Coastal Area. In E3S Web of Conferences; EDP Sciences: Les Ulis, France, 2019. [Google Scholar]
- Bendea, H.; Boccardo, P.; Dequal, S.; Tonolo, F.G.; Marenchino, D.; Piras, M. Low cost uav for post-disaster as-sessment. Int. Arch. Photogramm. Remote Sens. Spat. Inf. Sci. 2008, 37, 1373–1379. [Google Scholar]
- Hidayat, R.; Wibowo, M.; Sartimbul, A. Simulation of Oil Spill Pollution due to Tsunamis in Cilacap, Central Java, Indonesia. Int. J. Adv. Sci. Eng. Inf. Technol. 2021, 11, 898–906. [Google Scholar] [CrossRef]
- Chitsaz, N.; Marian, R.; Chahl, J. Experimental method for 3D reconstruction of Odonata wings (methodology and dataset). PLoS ONE 2020, 15, e0232193. [Google Scholar] [CrossRef]
- Grilli, S.T.; Tappin, D.R.; Carey, S.; Watt, S.F.L.; Ward, S.N.; Grilli, A.R.; Engwell, S.L.; Zhang, C.; Kirby, J.T.; Schambach, L.; et al. Modelling of the tsunami from the December 22, 2018 lateral collapse of Anak Krakatau volcano in the Sunda Straits, Indonesia. Sci. Rep. 2019, 9, 1–13. [Google Scholar] [CrossRef] [PubMed]
- Song, M.-J.; Cho, Y.-S. Modeling Maximum Tsunami Heights Using Bayesian Neural Networks. Atmosphere 2020, 11, 1266. [Google Scholar] [CrossRef]
- Moon, W.C.; Puay, H.T.; Lau, T.L. Robust and efficient 3-D numerical model for the hydrodynamic simulation of tsunami wave on land. Adv. Water Resour. 2020, 146, 103762. [Google Scholar] [CrossRef]
- Zhao, T.; Utili, S.; Crosta, G.B. Rockslide and Impulse Wave Modelling in the Vajont Reservoir by DEM-CFD Analyses. Rock Mech. Rock Eng. 2015, 49, 2437–2456. [Google Scholar] [CrossRef] [Green Version]
- Purnawan, P.; Bachtiart, V.S.; Kurniati, T. Development risk analysis method for tsunami disaster. In MATEC Web of Conferences; EDP Sciences: Les Ulis, France, 2018; Volume 197, p. 10005. [Google Scholar]
- Brothelande, E.; Lénat, J.-F.; Normier, A.; Bacri, C.; Peltier, A.; Paris, R.; Kelfoun, K.; Merle, O.; Finizola, A.; Garaebiti, E. Insights into the evolution of the Yenkahe resurgent dome (Siwi caldera, Tanna Island, Vanuatu) inferred from aerial high-resolution photogrammetry. J. Volcanol. Geotherm. Res. 2016, 322, 212–224. [Google Scholar] [CrossRef] [Green Version]
- Qin, X.; Motley, M.R.; Marafi, N.A. Three-dimensional modeling of tsunami forces on coastal communities. Coast. Eng. 2018, 140, 43–59. [Google Scholar] [CrossRef]
- Marfai, M.A.; Khakim, N.; Cahyadi, A.; Rosaji, F.S.C.; Fatchurohman, H.; Wibowo, Y.A. Topographic data acquisition in tsu-na-mis-prone coastal area using Unmanned Aerial Vehicle (UAV). In IOP Conference Series: Earth and Environmental Science; IOP Publishing: Bristol, UK, 2018; Volume 148. [Google Scholar]
- Yunita, L.; Sari, N.M.; Kushardono, D. Preliminary Study of Lsu-02 Photo Data Application to Support 3D Modeling of Tsu-namis Disaster Evacuation Map. Int. J. Remote Sens. Earth Sci. 2017, 14, 119. [Google Scholar]
- Arbad, A.P.; Takeuchi, W.; Jonathan, S.; Jamilah, M.; Ardy, A.; Meimuna, C. Western Lampung probabilistic tsunamis hazard model: Investigations by aerial photogrammetry and remote sensing data. In Proceedings of the 40th Asian Conference on Remote Sensing, ACRS 2019: Progress of Remote Sensing Technology for Smart Future, Daejeon, Korea, 14–18 October 2019; pp. 1–8. [Google Scholar]
- Wolf, P.R.; Dewitt, B.A. Elements of Photogrammetry-With Applications in Gis; McGraw-Hill: New York, NY, USA, 2014; Volume 3. [Google Scholar]
- Achille, C.; Adami, A.; Chiarini, S.; Cremonesi, S.; Fassi, F.; Fregonese, L.; Taffurelli, L. UAV-based photogrammetry and integrated tech-nologies for architectural applications—methodological strategies for the after-quake survey of vertical structures in Mantua (Italy). Sensors 2015, 15, 15520–15539. [Google Scholar] [CrossRef] [Green Version]
- Carvajal-Ramírez, F.; Agüera-Vega, F.; Martínez-Carricondo, P.J. Effects of image orientation and ground control points dis-tribution on unmanned aerial vehicle photogrammetry projects on a road cut slope. J. Appl. Remote Sens. 2016, 10, 034004. [Google Scholar] [CrossRef]
- Shashi, M.; Jain, K. Use of Photogrammetry in 3D modeling and visualization of buildings. J Eng. Appl. Sci. 2007, 2, 37–40. [Google Scholar]
- Sauerbier, M.; Eisenbeiss, H. Uavs for the Documentation of Archaeological Excavations. Proc. Isprs. Comm. V Mid.-Term. Symp. Close Range Image. Meas. Tech. 2010, 38, 526–531. [Google Scholar]
- Mikhail, E.M.; Bethel, J.S.; Chris, M.J. Introduction to Modern Photogrammetry. Photogramm. Rec. 2001, 18, 329–330. [Google Scholar]
- Luhmann, T.; Robson, S.; Kyle, S.; Harley, I. Book Reviews. Photogramm. Rec. 2010, 25, 203–210. [Google Scholar] [CrossRef]
- Grun, A.; Remondino, F.; Zhang, L. Photogrammetric Reconstruction of the Great Buddha of Bamiyan, Afghanistan. Photogramm. Rec. 2004, 19, 177–199. [Google Scholar] [CrossRef]
- El-Hakim, S.; Gonzo, L.; Voltolini, F.; Girardi, S.; Rizzi, A.; Remondino, F.; Whiting, E. Detailed 3D Modelling of Castles. Int. J. Arch. Comput. 2007, 5, 199–220. [Google Scholar] [CrossRef]
- Hampel, U.; Maas, H. Application of Digital Photogrammetry for Measuring Deformation and Cracks during Load Tests in Civil Engineering Material Testing. Opt. 3-D Meas. Tech. VI. 2003, 2, 80–88. [Google Scholar]
- D’Apuzzo, N. Surface measurement and tracking of human body parts from multi-image video sequences. ISPRS J. Photogramm. Remote Sens. 2002, 56, 360–375. [Google Scholar] [CrossRef] [Green Version]
- Luhmann, T. Close range photogrammetry for industrial applications. ISPRS J. Photogramm. Remote Sens. 2010, 65, 558–569. [Google Scholar] [CrossRef]
- Gonzalez-Aguilera, D.; Gomez-Lahoz, J. Forensic Terrestrial Photogrammetry from a Single Image. J. Forensic Sci. 2009, 54, 1376–1387. [Google Scholar] [CrossRef] [PubMed]
- Widiyantoro, S.; Gunawan, E.; Muhari, A.; Rawlinson, N.; Mori, J.; Hanifa, N.R.; Susilo, S.; Supendi, P.; Shiddiqi, H.A.; Nugraha, A.D.; et al. Implications for megathrust earthquakes and tsunamis from seismic gaps south of Java Indonesia. Sci. Rep. 2020, 10, 1–11. [Google Scholar] [CrossRef]
- Rizal, Y.; Zaim, Y.; Santoso, W.D.; Rochim, N.; Anugrah, S.D.; Gunawan, I.; Yatimantoro, T.; Rahayu, R.H. Tsunamis Evidence in South Coast Java, Case Study: Tsunamis Deposit along South Coast of Cilacap. In IOP Conference Series: Earth and Environmental Science; IOP Publishing: Bristol, UK, 2017; Volume 71. [Google Scholar]
- Mori, J.; Mooney, W.D.; Kurniawan, S.; Anaya, A.I.; Widiyantoro, S. The 17 July 2006 Tsunamis earthquake in West Java, Indonesia. Seismol. Res. Lett. 2007, 78, 201–207. [Google Scholar] [CrossRef]
- Irsyam, M.; Cummins, P.R.; Asrurifak, M.; Faizal, L.; Natawidjaja, D.H.; Widiyantoro, S.; Meilano, I.; Triyoso, W.; Rudiyanto, A.; Hidayati, S.; et al. Development of the 2017 national seismic hazard maps of Indonesia. Earthq. Spectra 2020, 36, 112–136. [Google Scholar] [CrossRef]
- Hanifa, N.R.; Sagiya, T.; Kimata, F.; Efendi, J.; Abidin, H.Z.; Meilano, I. Interplate coupling model off the southwestern coast of Java, Indonesia, based on continuous GPS data in 2008–2010. Earth Planet. Sci. Lett. 2014, 401, 159–171. [Google Scholar] [CrossRef]
- B.N.P.B. Menuju Indonesia Tangguh Menghadapi Tsunamis. Masterplan Pengurangan Risiko Bencana Tsunamis [Internet]. 2012, p. 146. Available online: https://bnpb.go.id/uploads/migration/pubs/578.pdf (accessed on 11 October 2021).
- Hilmi, E.; Hendarto, E.; Riyanti Sahri, A. Analisis Potensi Bencana Abrasi dan Tsunami di Pesisir Cilacap. J. Dialog Pe-Nanggulangan Bencana 2012, 3, 35–42. [Google Scholar]
- Muck, M.; Taubenböck, H.; Post, J.; Wegscheider, S.; Strunz, G.; Sumaryono, S.; Ismail, F.A. Assessing building vulnerability to earthquake and tsunami hazard using remotely sensed data. Nat. Hazards 2013, 68, 97–114. [Google Scholar] [CrossRef]
- Dewi, R.S.; Salam, N.; Suwardi, S. Remote Sensing for Dissaster Mitigation: Case Study for Tsunami Evacuation Route Mod-elling in Cilacap Central Java, Indonesia. Int. Arch. Photogramm. Remote Sens. Spat. Inf. Sci. 2010, 38. [Google Scholar]
- Ramadian, R.R.; Meilano, I.; Hanifa, N.R.; Efendi, J. Interseismic coupling off the south of Central Java from GPS-derived baseline change rates. In Proceedings of the International Symposium on Earth Hazard and Disaster Mitigation (ISEDM) 2017: The 7th Annual Symposium on Earthquake and Related Geohazard Research for Disaster Risk Reduction; AIP Publishing: Tokyo, Japan, 2018; Volume 1987, p. 020105. [Google Scholar]
| Publisher’s Note: MDPI stays neutral with regard to jurisdictional claims in published maps and institutional affiliations. |
© 2021 by the authors. Licensee MDPI, Basel, Switzerland. This article is an open access article distributed under the terms and conditions of the Creative Commons Attribution (CC BY) license (https://creativecommons.org/licenses/by/4.0/).


 and
and 


