Article

Experimental and Finite Element Analysis of External ALC Panel Steel Frames with New Semi-Rigid Connector

1
School of Civil Engineering, Anhui Jianzhu University, Hefei 230601, China
2
Anhui Fuhuang Steel Structure Co., Ltd., Hefei 238076, China
*
Author to whom correspondence should be addressed.
Appl. Sci. 2021, 11(22), 10990; https://doi.org/10.3390/app112210990
Submission received: 18 October 2021 / Revised: 16 November 2021 / Accepted: 17 November 2021 / Published: 19 November 2021
(This article belongs to the Special Issue Seismic Assessment and Design of Structures)

Abstract

:
In this paper, a new ALC panel connector was proposed. It has a good engineering economy and high fault tolerance. A quasistatic loading experiment was carried out to verify the feasibility of the external ALC panel steel frame under seismic loading. The test phenomena, hysteretic curve, skeleton curve, stiffness degradation, and energy dissipation of two sets of full-scale specimens were analyzed and discussed. Moreover, the simulation of pendulous Z-panel connectors with different thicknesses was carried out using ABAQUS software. The comparison reveals that the semi-rigid connection has a full hysteresis curve, good energy dissipation capacity, and a 15% increase in peak load capacity. Finally, similar results for different thicknesses in the use of pendulous Z-panel connectors reveal that using the 6 mm connector may be the most economical solution for engineering.

1. Introduction

With urbanization accelerating, traditional construction techniques cannot meet the current increasing demand for housing. Prefabricated building is considered a major trend for future development because of its good seismic performance, easy construction, low greenhouse gas emissions, and high utilization of building materials [1,2,3]. As a type of enclosure system of prefabricated buildings, autoclaved lightweight concrete (ALC or AAC) panels are made of several fine aggregates (cement, sand, gypsum, aluminum powder, etc.) by high temperature and pressure [4,5]. Many scholars conducted in-depth studies. Pehlivanlı [6] et al. studied the strength of AAC blocks with different fiber additions. The result shows that the flexural and compressive strengths of the test blocks are increased, especially for the carbon fiber group. Seddighi et al. [7] investigated the mechanical properties of AAC blocks incorporating graphene. They demonstrate that the addition of graphene brings a significant increase to the compressive and tensile strength and impact resistance of AAC. In addition, other researchers have also attempted to improve the seismic performance of structures by changing material parameters and effective out-of-plane reinforcement techniques. Rousakis et al. [8] investigated RC-framed infilled wall structures reinforced by polyurethane joints (PUFJ) or polyurethane-impregnated fiber grids (FRPU). The result shows that its application improves the initial stiffness, base shear, and maintains a high horizontal drift. By using in-plane cyclic shear-compression tests, Penna et al. [9] studied AAC masonry walls with bed-joint (BJR) reinforcement specimens. They show a significant increase in maximum deformation capacity, shear strength, and seismic performance compared to an unreinforced wall. Kałuża et al. [10] studied the deformation process of in-plane AAC walls with different joint treatments. They find that the specimens reinforced with GFRP show some improvement in deformation, stiffness, and load-carrying capacity. Binici et al. [11] proposed a new innovative fencing system. The results show that its application achieves the required 2% in-plane deformation without cracking and maintains its out-of-plane stability. Deng et al. [12] studied the seismic performance of URM walls reinforced by HDC, which improves the ultimate displacement, energy dissipation, and bearing capacity. De Paula Salgado et al. [13] studied the seismic performance of AAC infill walls with the addition of curauá fiber–cement composites. The result showes satisfactory post-peak ductility because the energy is not abruptly lost but gradually releases throughout its deflection-softening behavior. To improve the strength and ductility of concrete in seismicloading, antiseismic fabric, especially double-sided reinforcement of expansive glass particle plastering is used by Arslan et al. [14]. Erdem et al. [15] studied the seismic performance of three different planar RC frames with flexible connections, including U-slot, T-slot, and female and male slots. The test shows that flexible connections exhibit a bare frame-like behavior, protecting the infill wall and optimizing the rigid wall force pattern. The connection between the prefabricated structure and the main structure is also critical. There are differences in the basic mechanical properties of the different connections (such as beam-column joints, laminated slabs, etc.) [16,17,18,19,20,21]. However, little research has been performed on the connection of the external ALC panel. The main connection methods are hook head bolt and ADR connectors (as shown in Figure 1). The external hook head bolt is rigidly connected to the ALC panel. The hole will be damaged under seismic loading and increase the risk of overall instability. The ADR connector ensures a flexible connection, but it increases the construction cost. The tests showed that the bolted connector and the swing connector have good mechanical properties, but they ignore the innovation of the connector [22,23].
Based on the above works, this paper proposed a new connector called the pendulous ALC Z-panel connector. The connector significantly improves the deformation adaptability of the structure. It also reduces construction error and engineering costs. In order to verify the feasibility of the new connector, two sets of full-scale external ALC-frames were tested using horizontal low cyclic loads. Moreover, finite element software was used to model and analyze the connector. The failure modes, hysteresis curves, skeleton curves, and stiffness degradation curves were compared in detail. Finally, the analysis of several groups of connectors of different thicknesses gave rationalization suggestions for practical application.
The rest of the paper is described as follows: In Section 2, we present the specimen design details, material properties, and test details. Section 3 analyzes the experimental results (experimental phenomena, hysteresis curves, skeleton curves, and stiffness degradation curves). In Section 4, finite element software verifies the simulation accuracy, and the connectors with different thicknesses are analyzed. Finally, Section 5 presents some conclusions.

2. Experimental Work

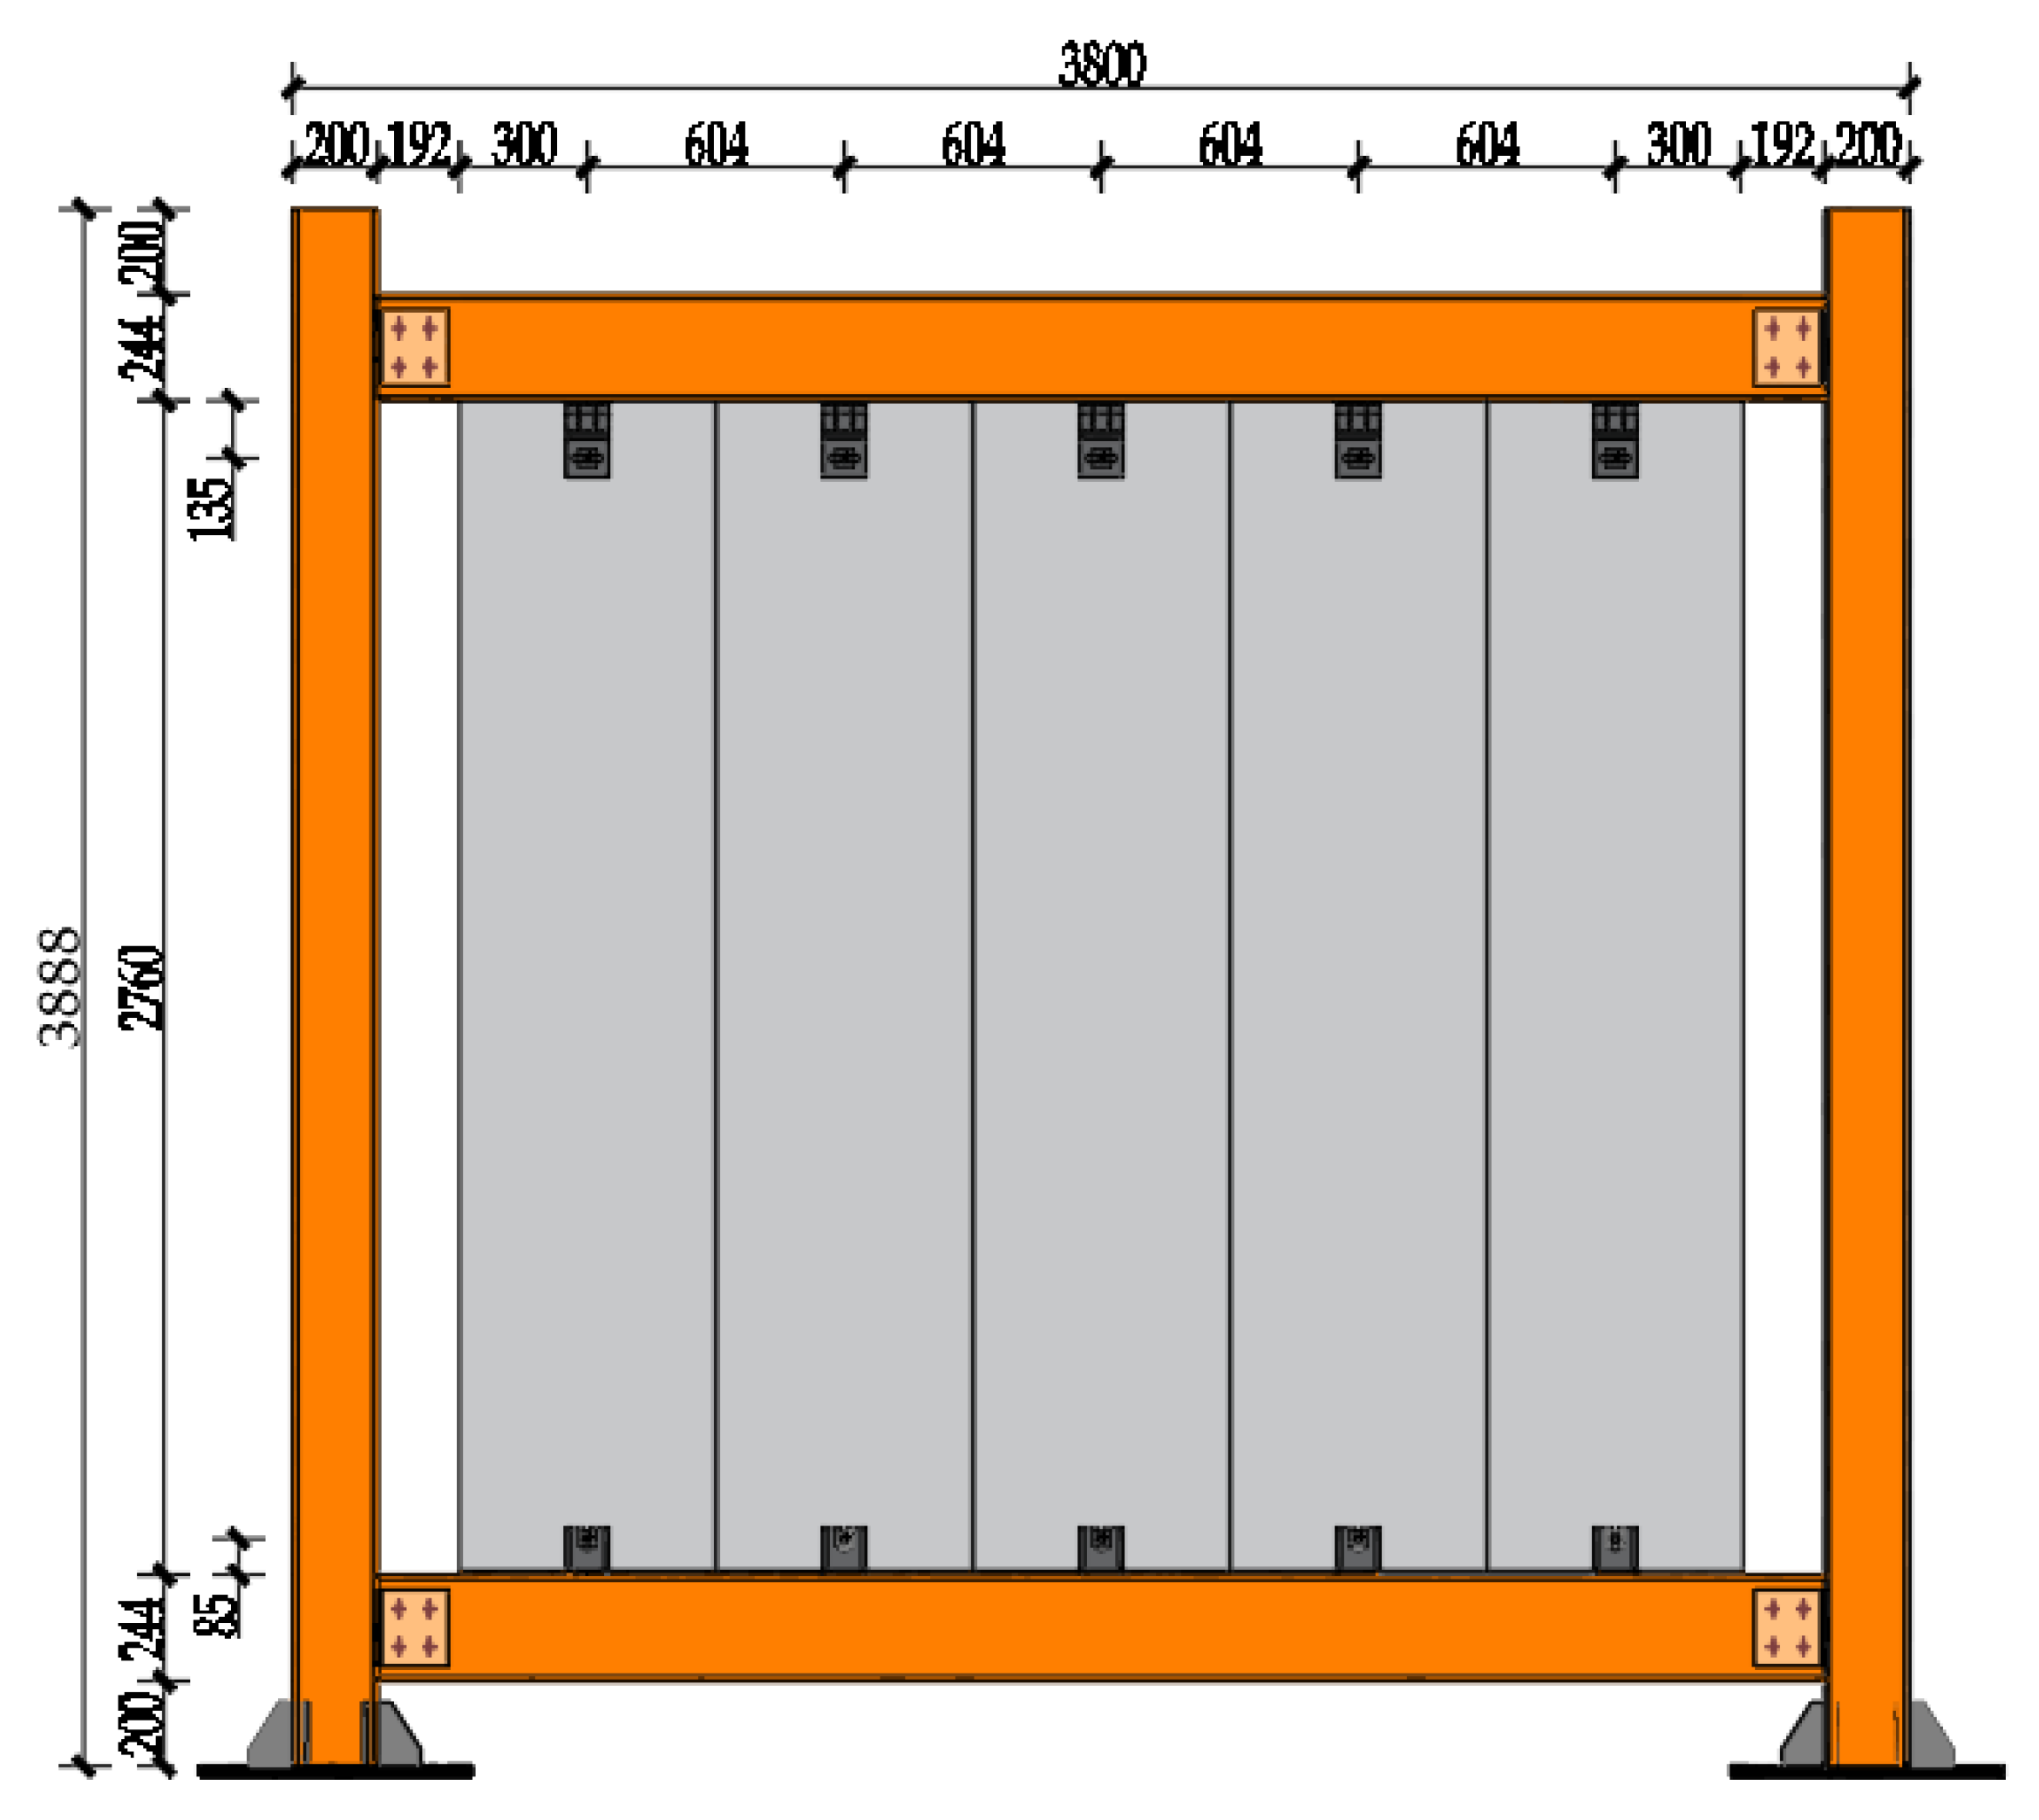
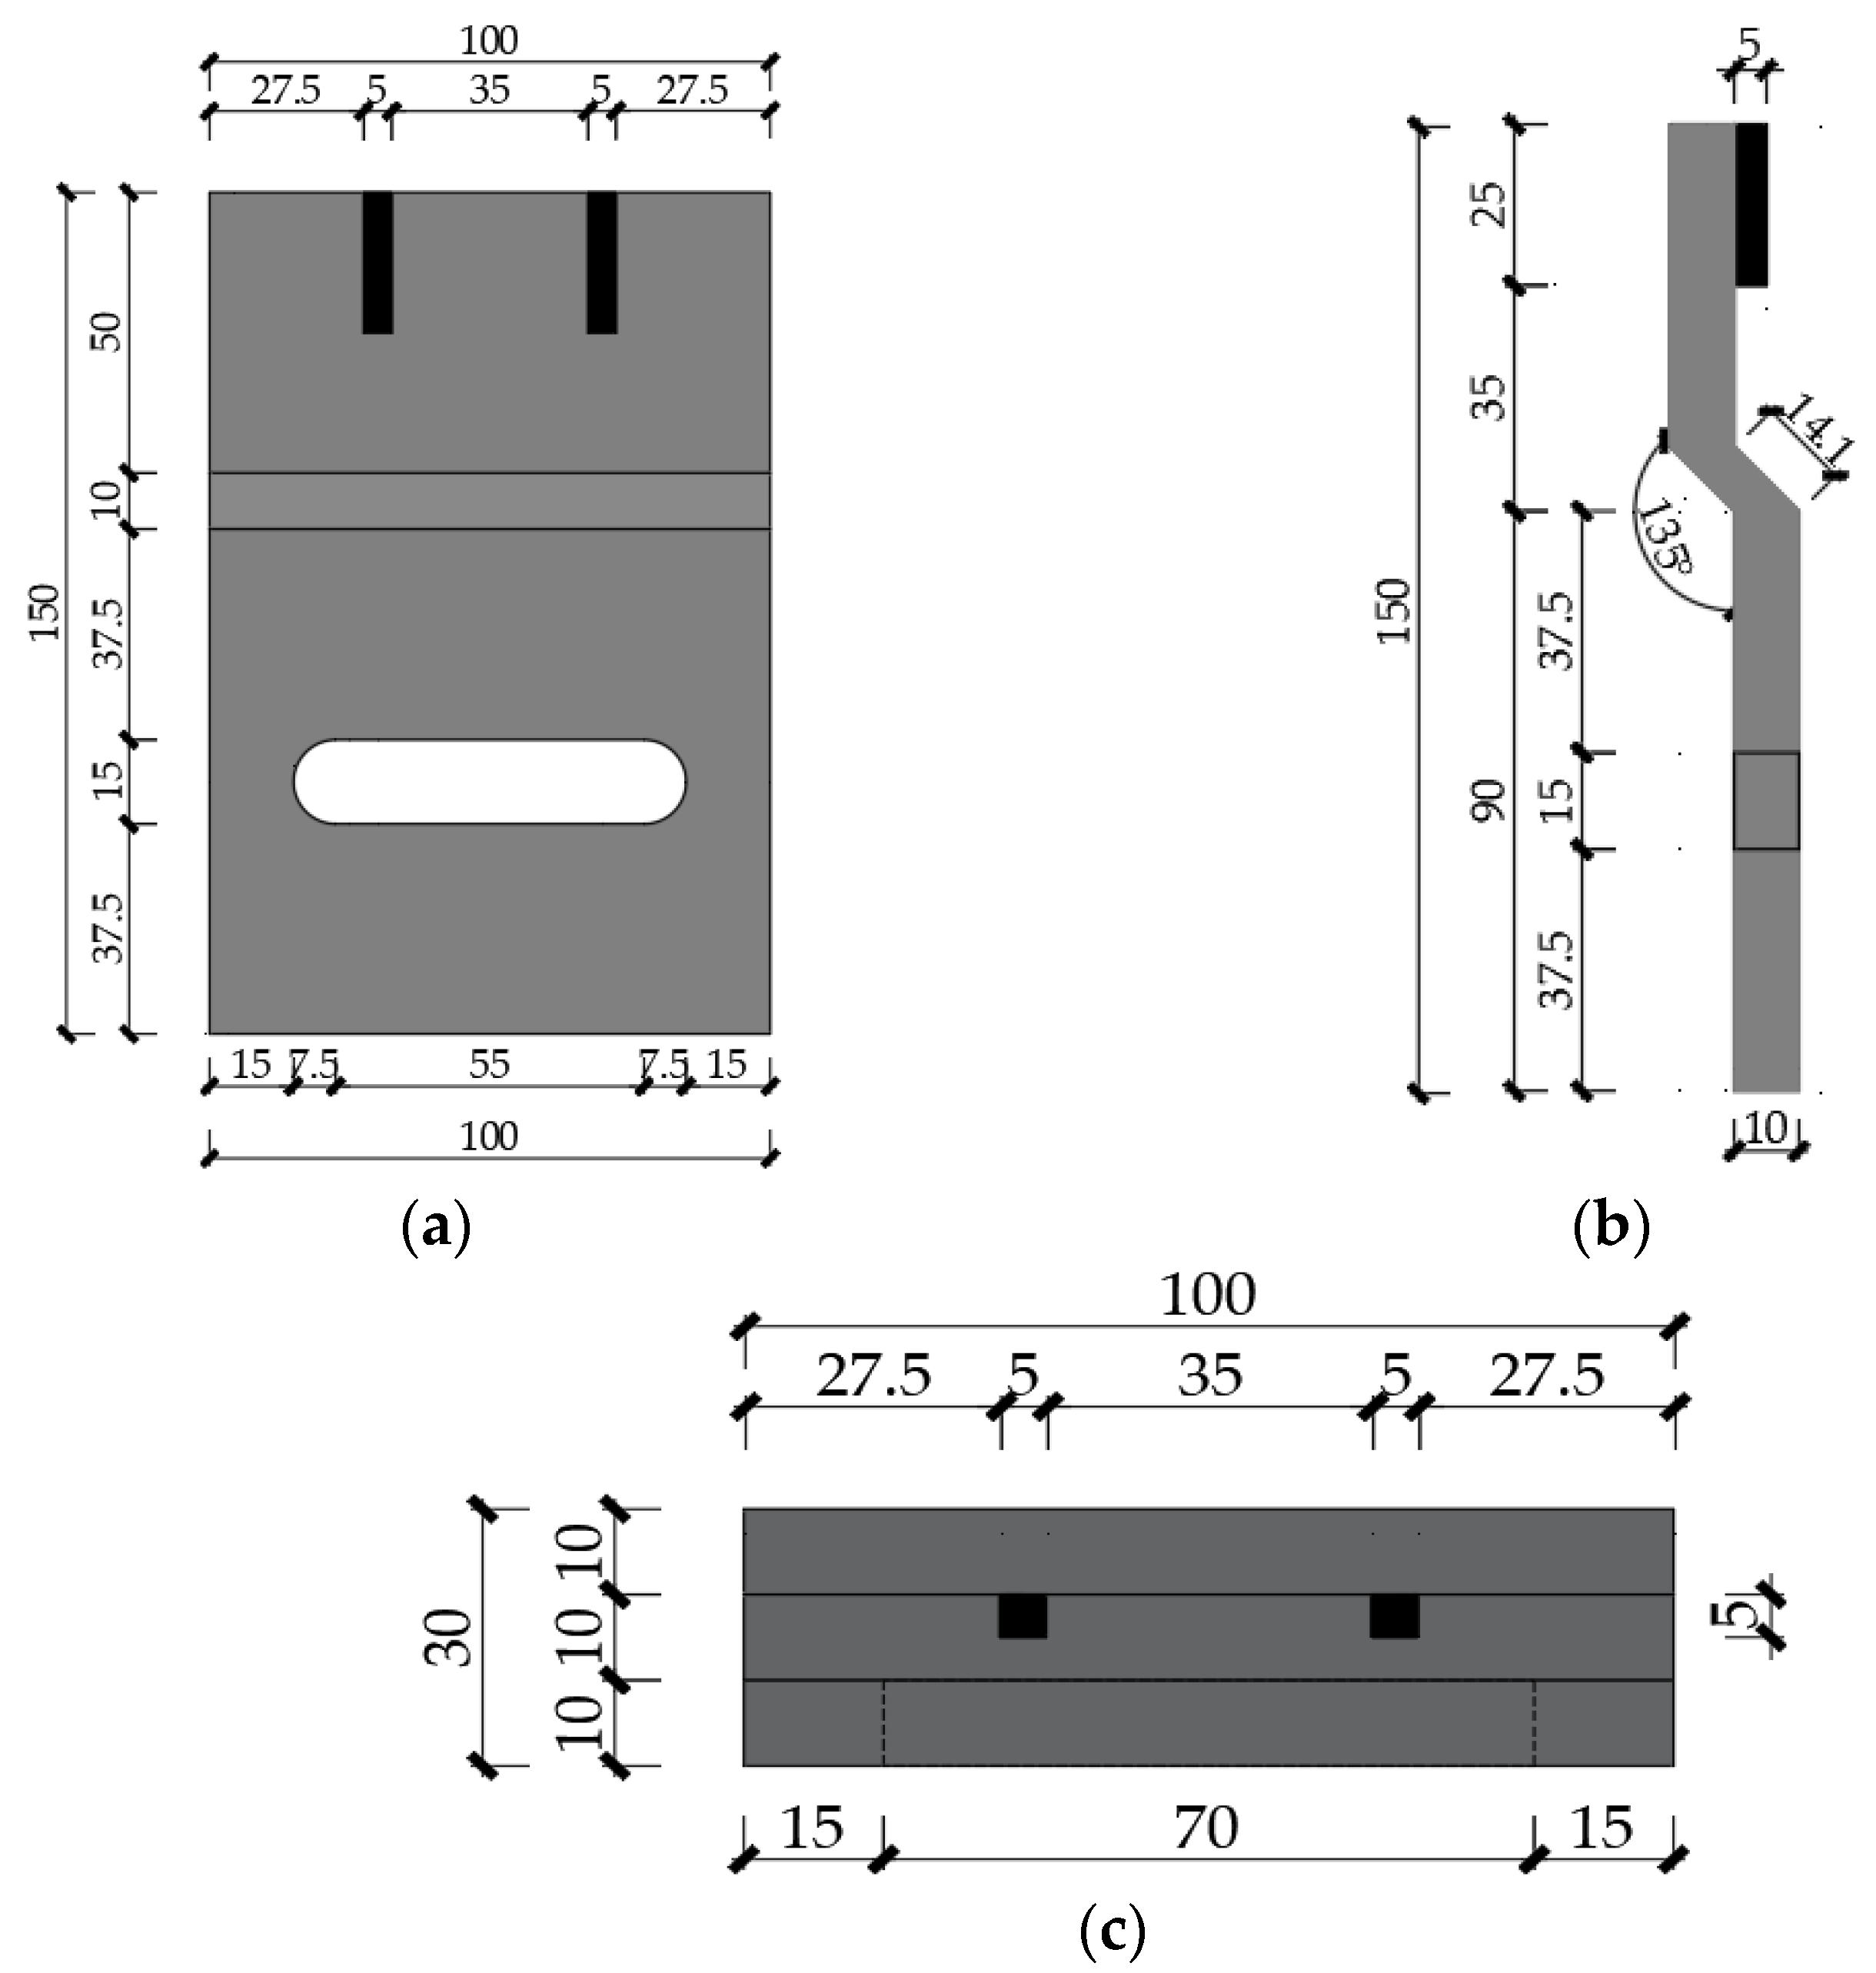
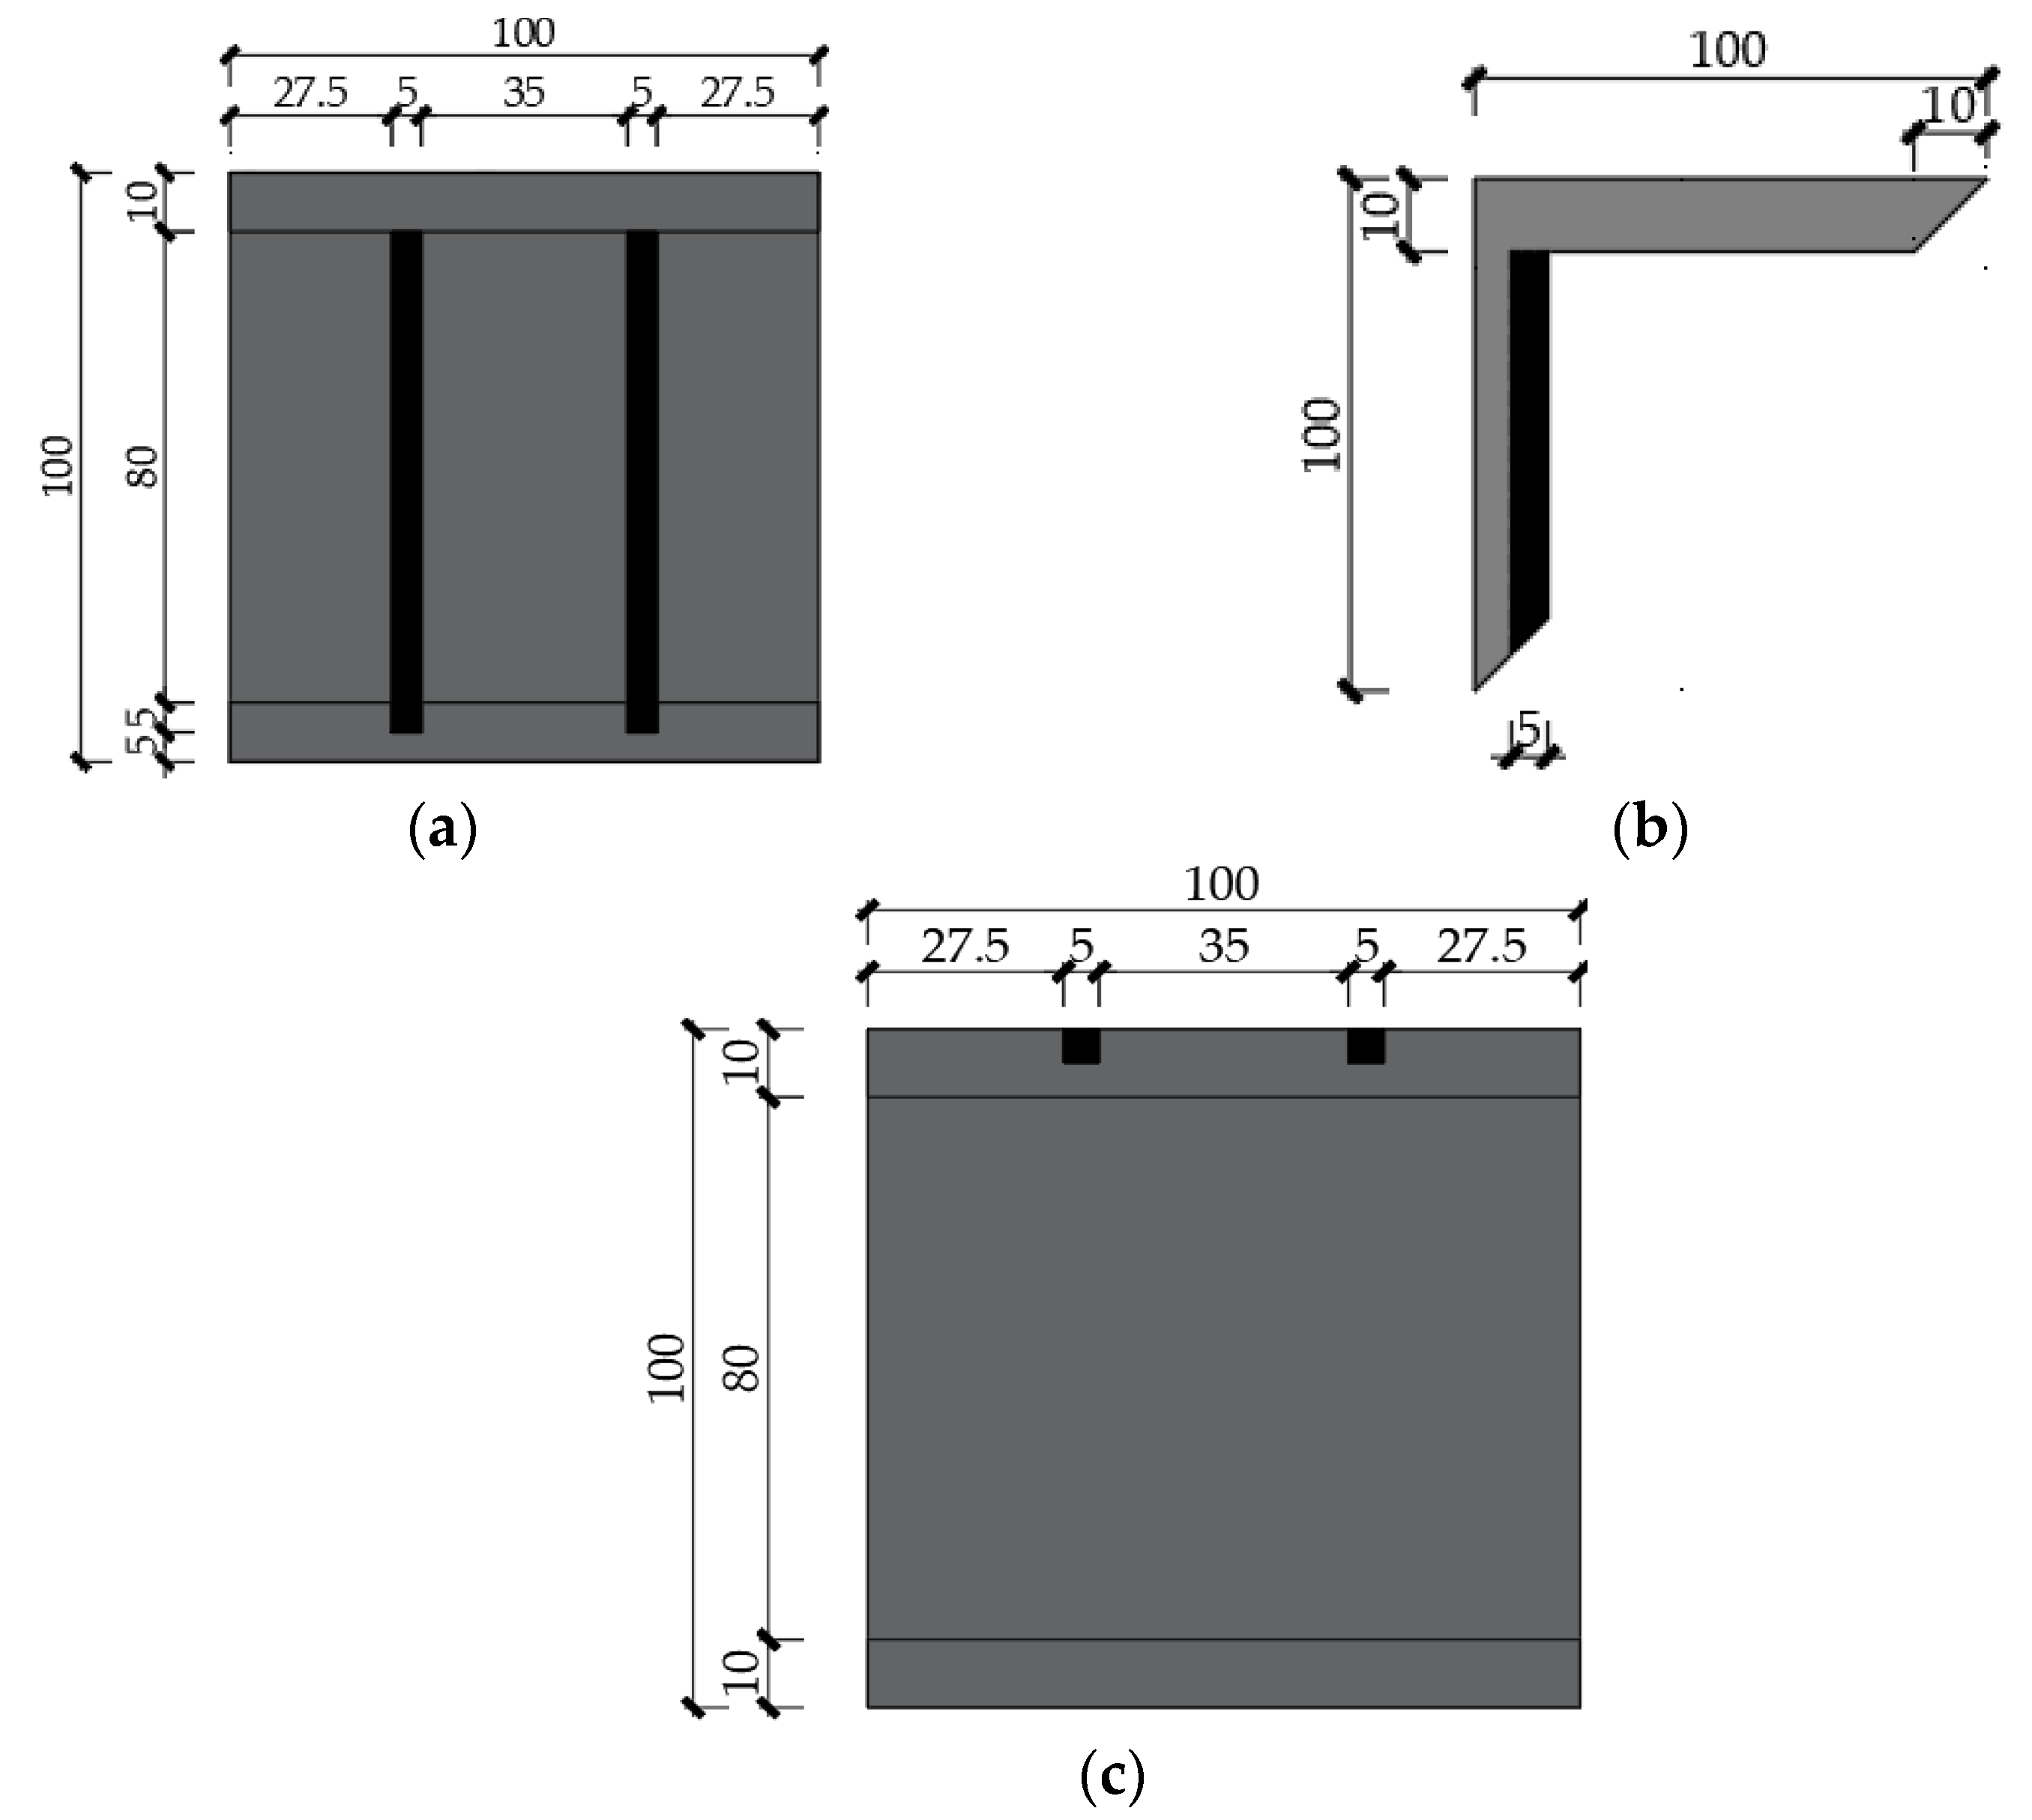
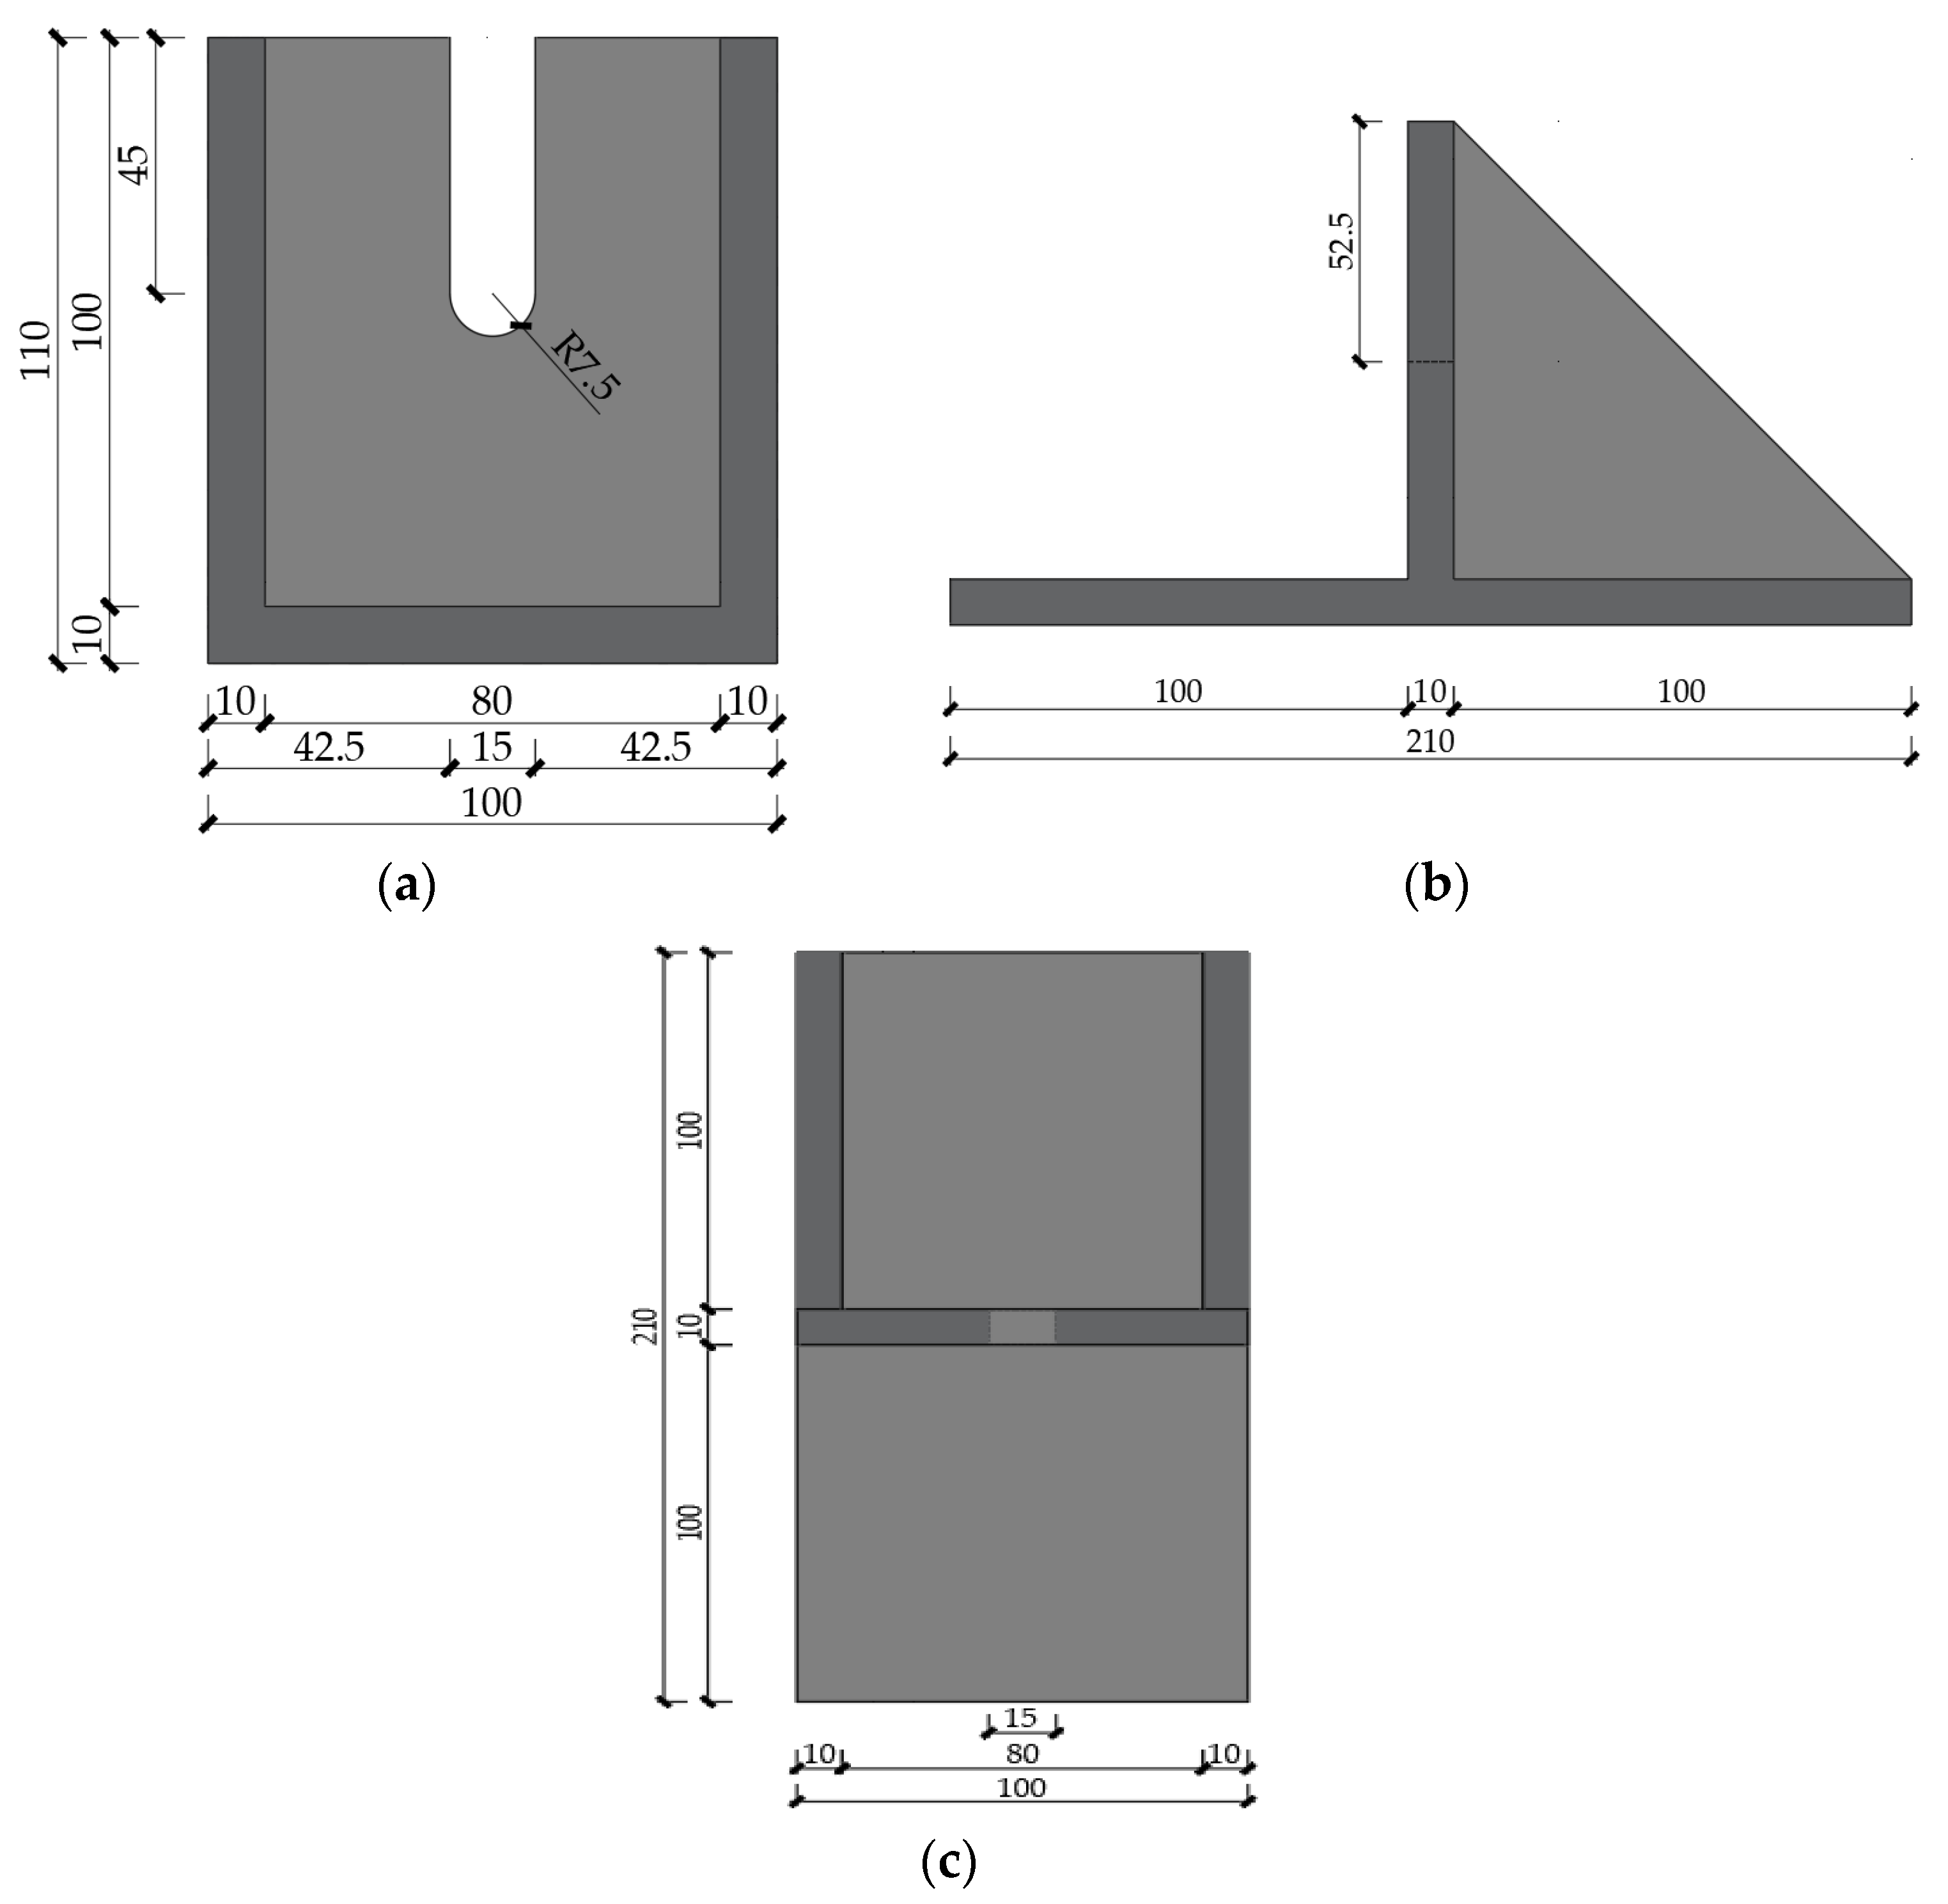
2.1. Design of Specimen

A new pendulous ALC Z-panel connector was proposed, which reduces the effect of seismic load on the external ALC panel steel and improves the deformation resistance of the overall structure. Figure 2 and Figure 3 show the installation diagram of the connector, which consists of the ALC panel, high-strength bolts, and upper and lower parts. The upper connector is divided into an open-hole Z-connector and open-slot L-connector, and the lower connector is composed of a bearing plate and limit hole (as shown in Figure 4, Figure 5 and Figure 6). The specific installation process is as follows. Firstly, the steel frame is installed, then the upper and lower parts are positioned and installed. The ALC panel is lifted into the appropriate position. Finally, the upper Z-connector protrusion is stuck together with the L-connector and connected to the ALC panel with the high-tensile bolt. The ALC panel is placed on the lower support plate and connected with high-strength bolts through the limit holes. Caulking mortar is applied after the ALC panel installation (as shown in Figure 7).

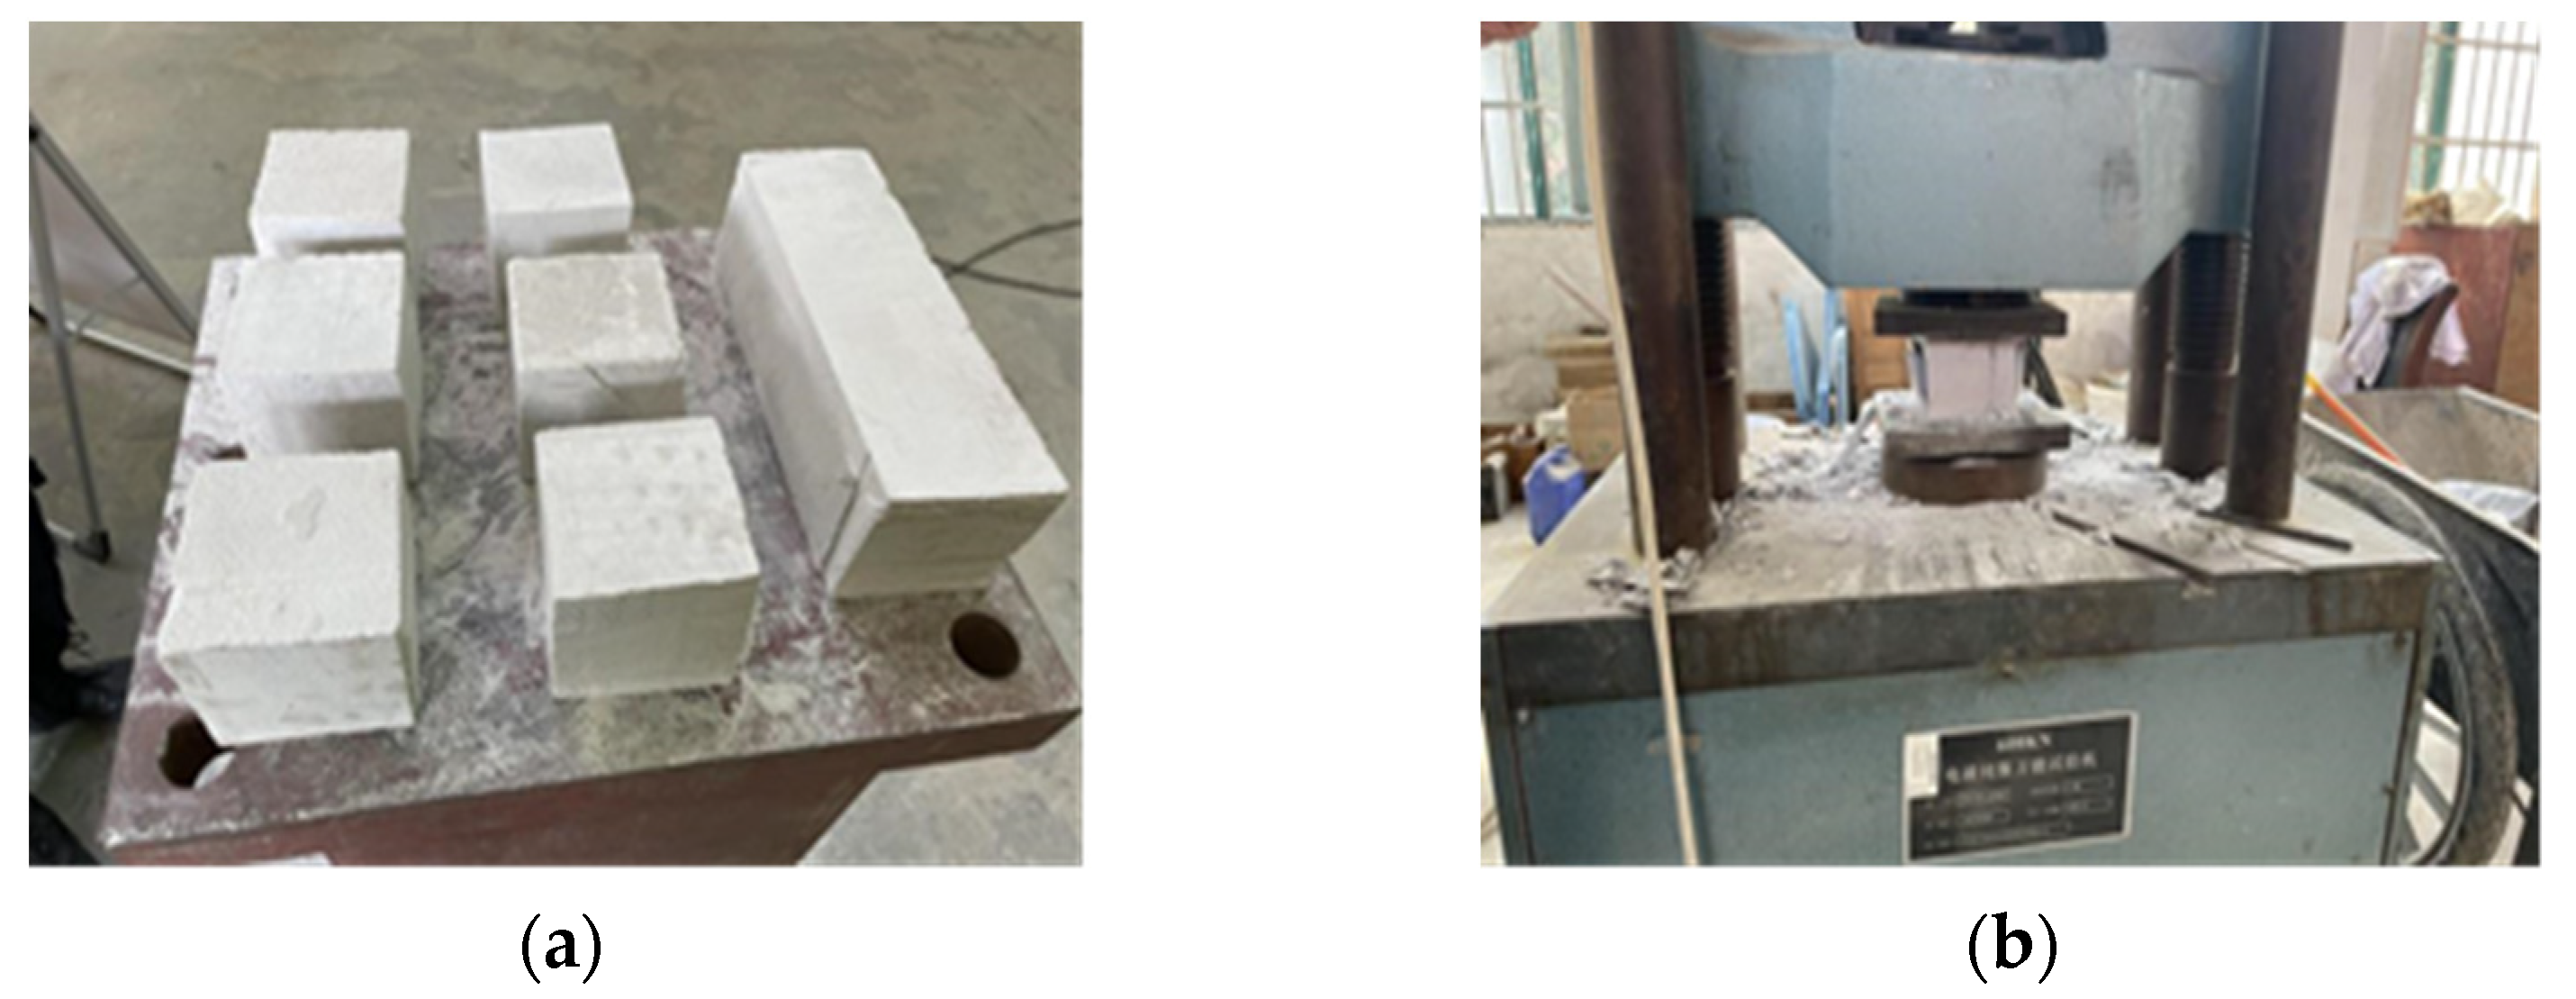
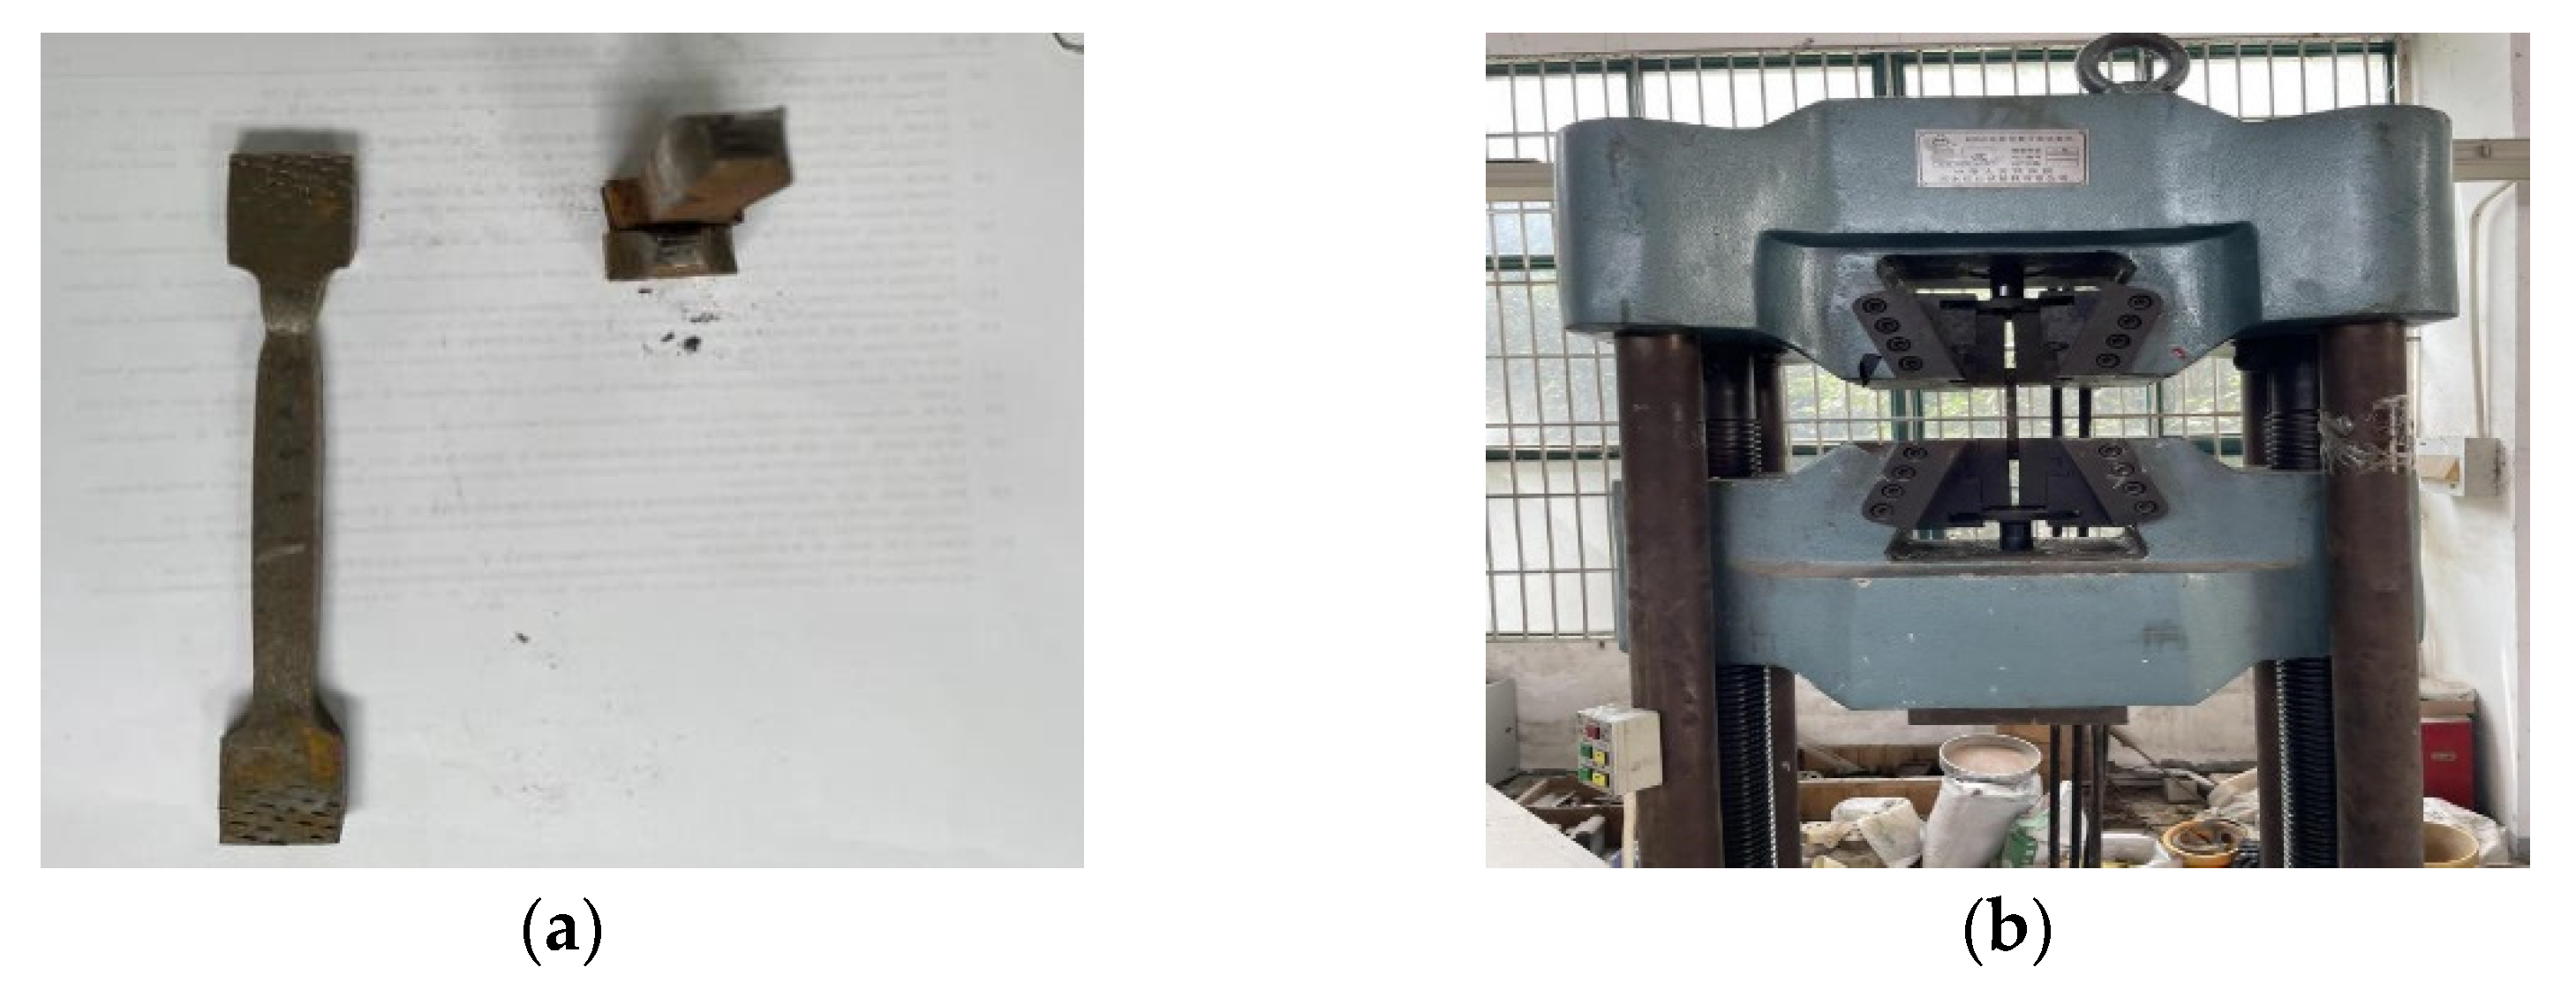
2.2. Material Properties

According to the standard GB/T11969-2020 “Test methods of autoclaved aerated concrete” [24], 9 ALC blocks were prepared to test the compressive strength and E. Their sizes were 100 mm × 100 mm × 100 mm and 100 mm × 100 mm × 300 mm (as shown in Figure 8). Tensile tests were performed on the same batches of steel to determine their yield strength, ultimate strength, modulus of elasticity, and elongation (as shown in Figure 9). The design requirements can be found in GB/T 228.1-2010 “Metallic Materials-Tensile testing” [25]. Table 1 and Table 2 show the autoclaved lightweight concrete and the steel mechanical performance index.

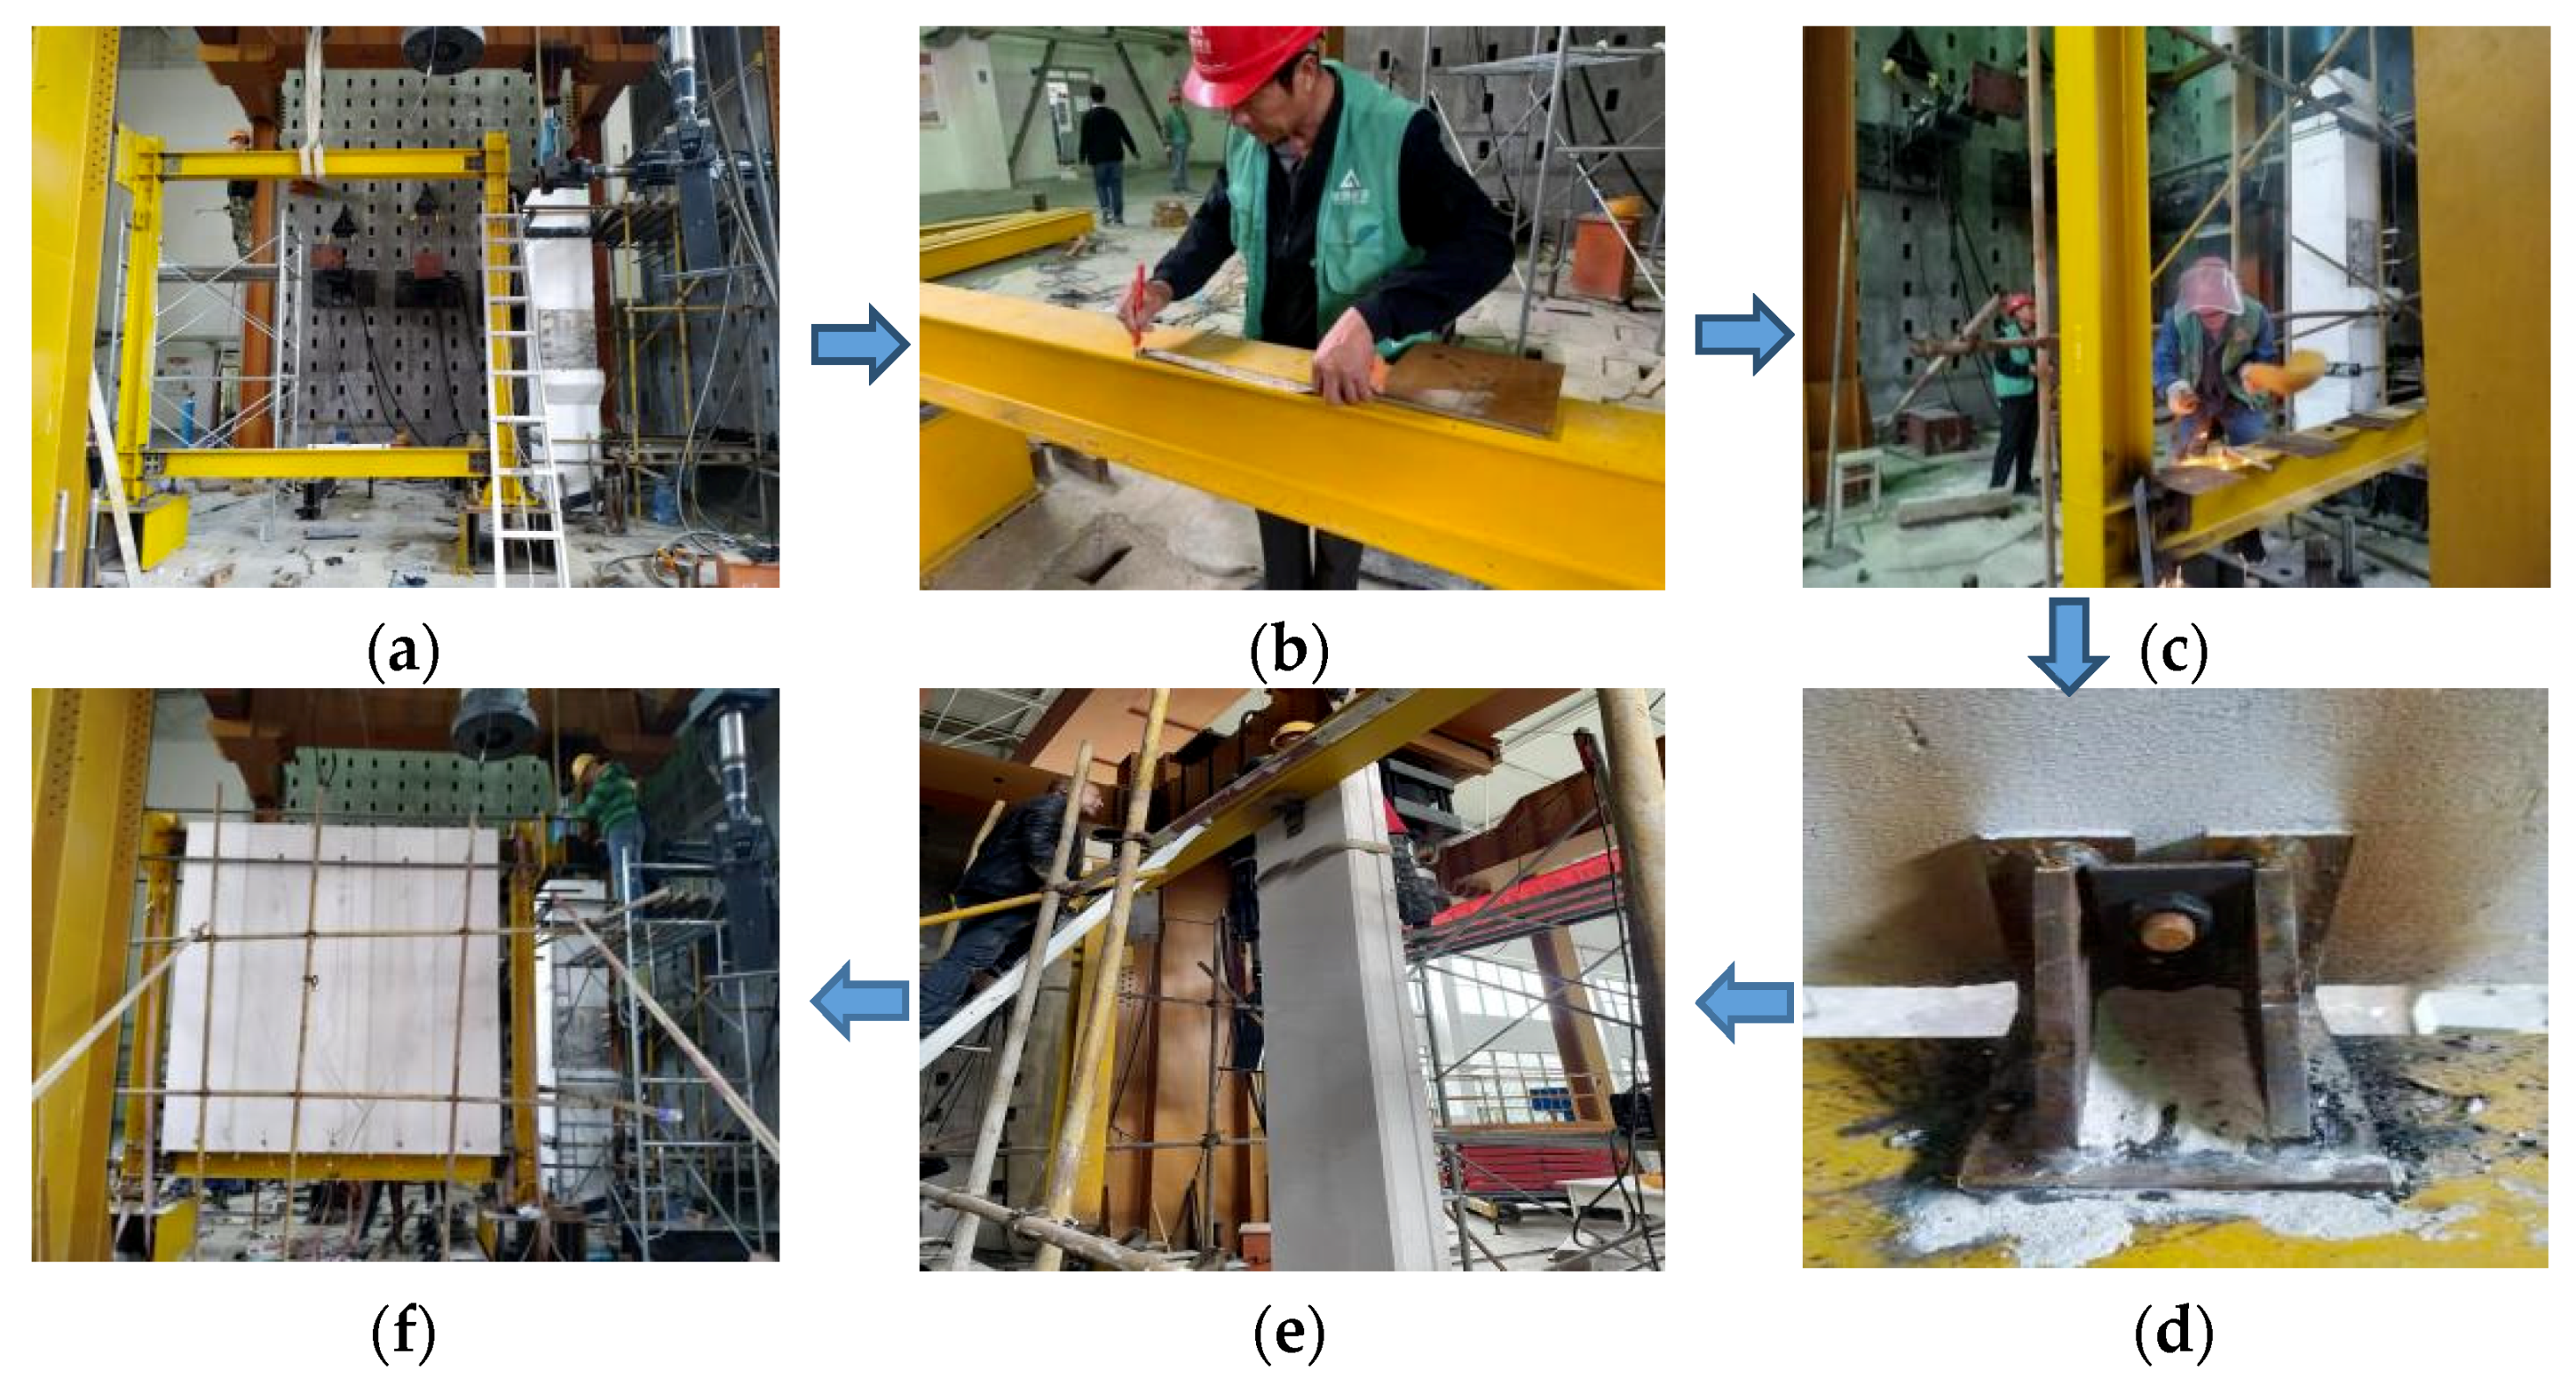
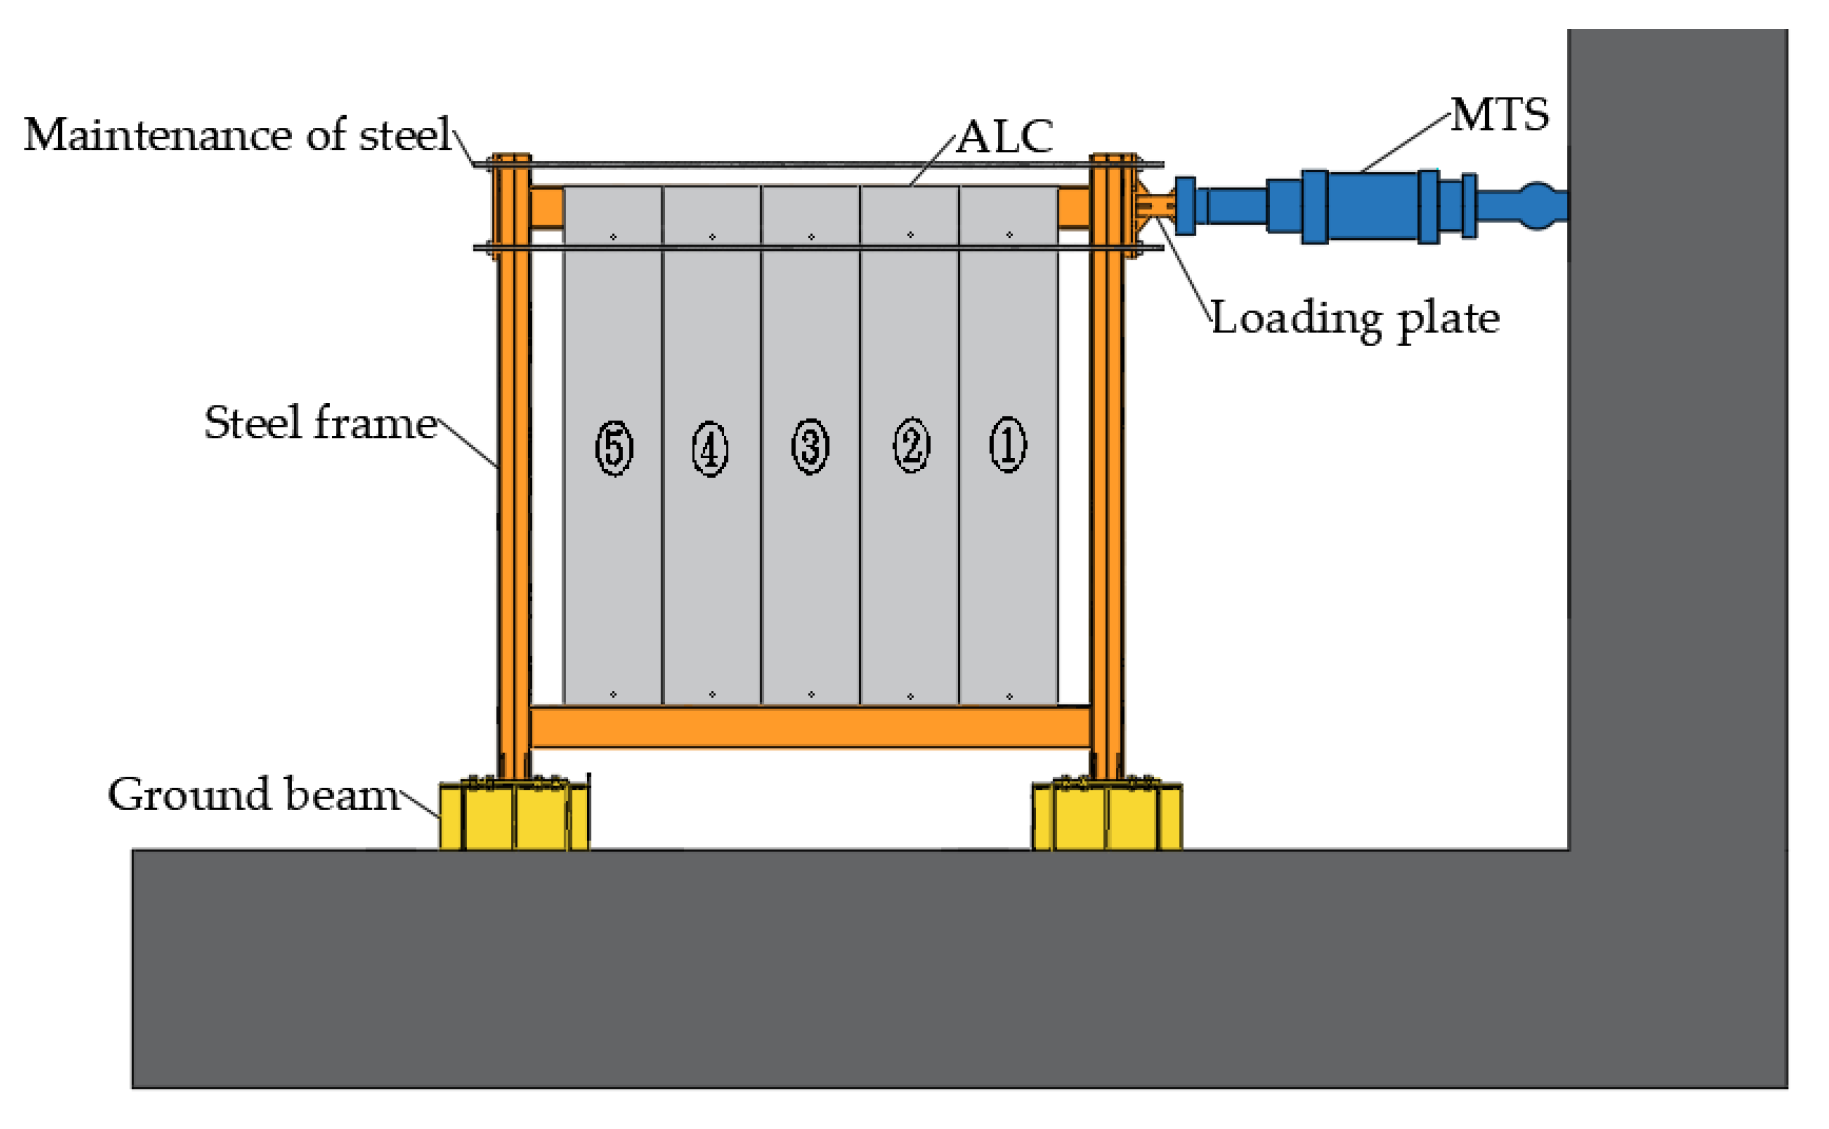
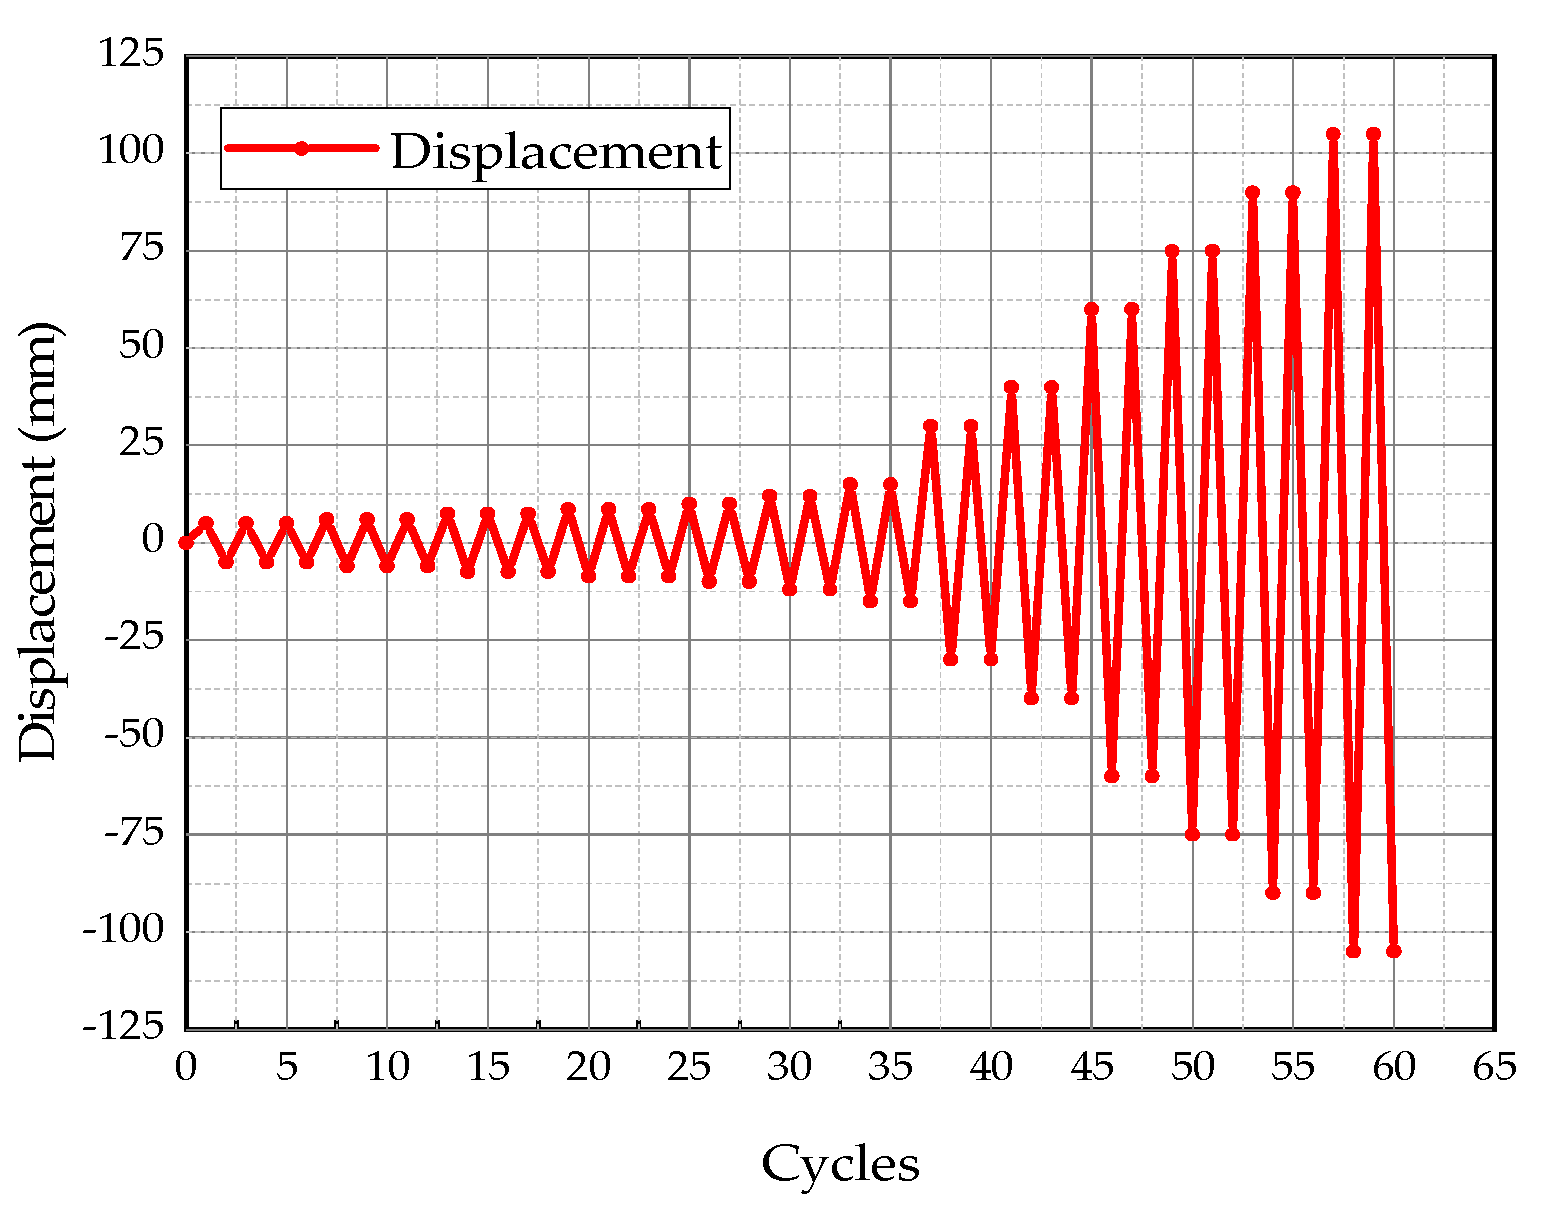
2.3. Experimental Device and Loading System

The two sets of test specimens were ultimately determined to be single-span planar steel frames with a single floor (3888 mm height and 3800 mm span), based on the site dimensions and practical application requirements of the key laboratory hall of structure and underground space at Anhui Jianzhu University. The FW-1 and FW-2 connector groups denote the hooked bolt and pendulous Z-panel connector groups, respectively. This test utilized an American MTS servo loading system with a stroke of 250 mm. A quasistatic loading system was used for this test. A horizontal, low-circumferential reciprocating load was given to the column’s highest point. The loading plate served as a link between the actuator and the frame column (as shown in Figure 10). The steel frames were constructed of hot-rolled Q235 H-beams. More precisely, the beam section measured HM244 mm × 175 mm × 7 mm × 11 mm, and the column section measured HW200 mm × 200 mm × 8 mm × 12 mm, which were all supplied by Anhui Fu Huang Steel Structure Co., Ltd. (Hefei, China).
According to the interstory displacement angle index, 5 mm, 6 mm, 7.5 mm, 8.6 mm, 10 mm, 12 mm, and 15 mm cycles of 3-turn loading and 30 mm, 40 mm, 60 mm, 75 mm, 90 mm, and 105 mm cycles of 2-turn loading were taken into consideration, and they can be found in GB50011-2010 “Code for Seismic Design of Buildings” (as shown in Figure 11) [26]. The end of the test was marked by (1 or 2):
  • When the core components (beam, column, connectors) showed apparent damage.
  • The bearing capacity of the member was reduced to 85% of the ultimate load.

3. Experiment Results and Analysis
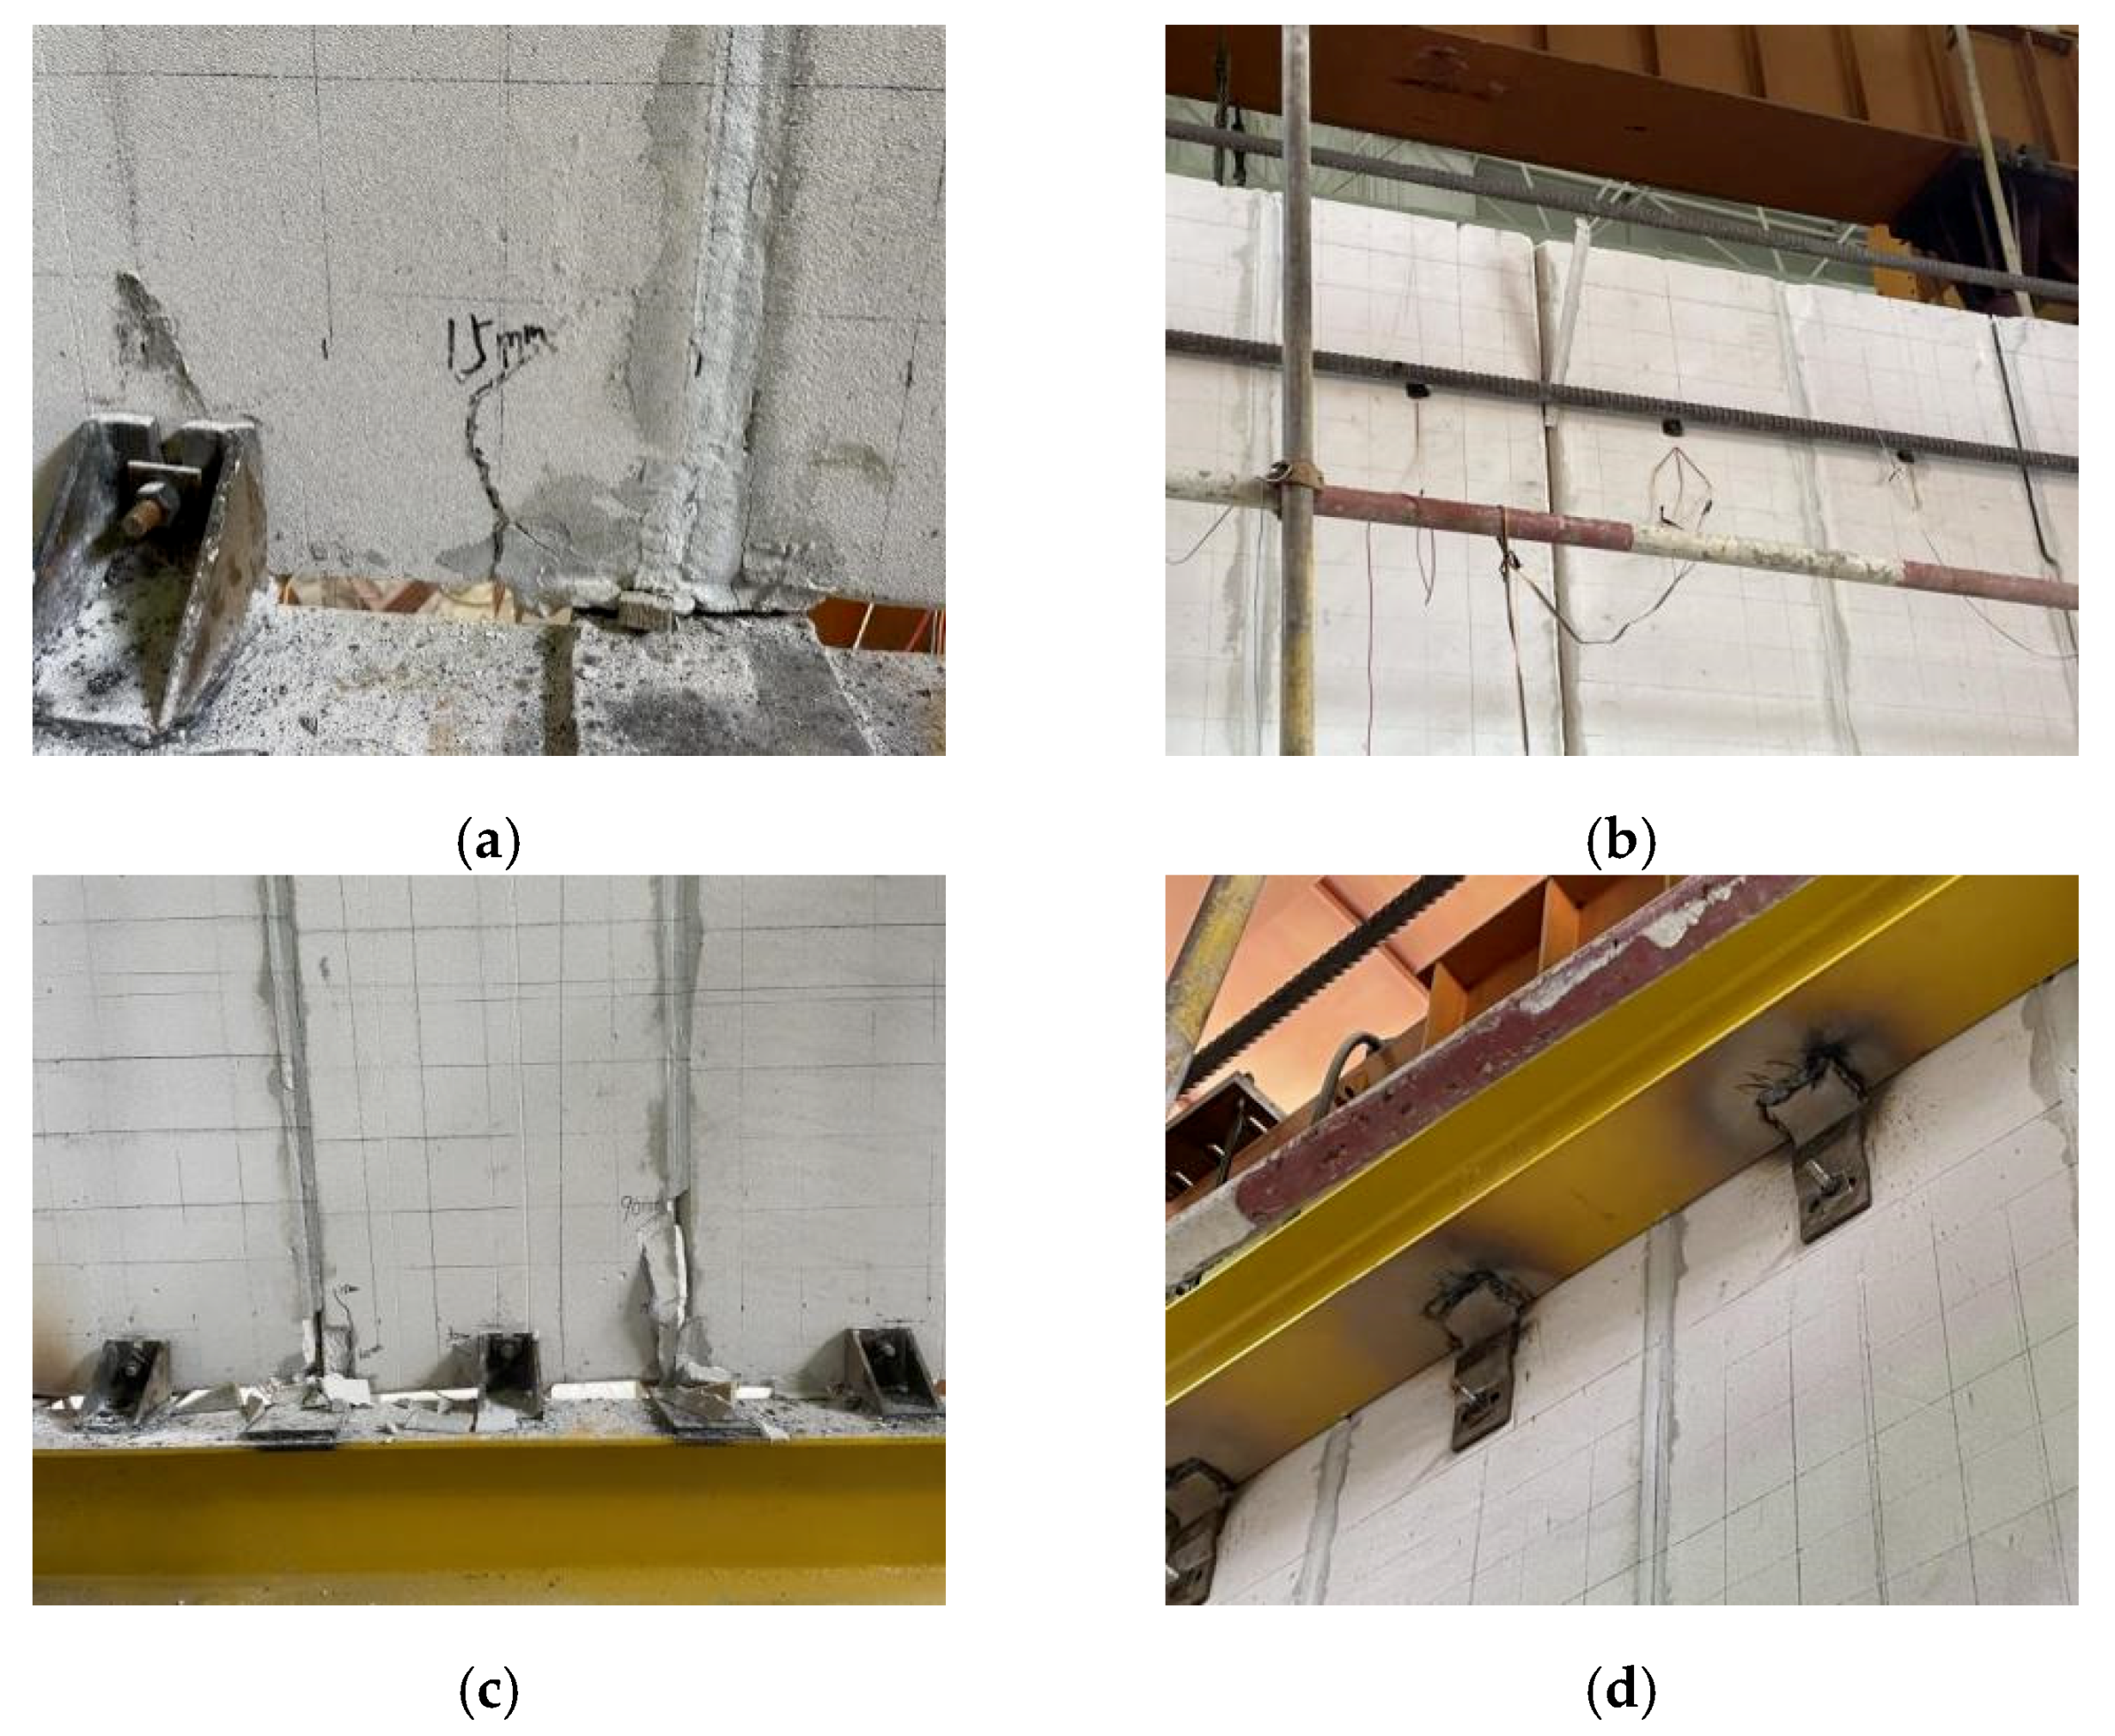
3.1. Specimen FW-1

The schematic diagram of the tested phenomena in the FW-1 group is shown in Figure 12. At the early stage of specimen loading, when the beam end was loaded at 1/600 (Δ = 5 mm), there was no noticeable change in deformation and strain of the specimen, and the panels did not produce cracks. When the displacement angle reached 1/500 (Δ = 6 mm), cracks appeared at the bottom of the mortar of panel joints of No. 1 and No. 2 (Figure 12a). When the displacement angle reached 1/400 (Δ = 7.5 mm), the sound of the panel corner rubbing and the crack of inter-slab splicing mortar continued to increase (Figure 12b). When the displacement angle reached 1/350 (Δ = 8.6 mm), the sound of mutual extrusion between panels could be clearly heard, and vertical cracks were produced in the splicing of the No. 1 and No. 2 panels (Figure 12c). Some small pieces of ALC fell off during the loading of 1/300 (Δ = 10 mm) and 1/250 (Δ = 12 mm) (Figure 12d). When the displacement angle reached 1/200 (Δ = 15 mm), there was evident slippage between the enclosure reinforcement and the end panel, and there was a noticeable misalignment between the panel where the splices fell off. When the displacement angle reached 1/50 (Δ = 60 mm), the crack tended to gradually become wider. At displacement angle 1/40 (Δ = 75 mm), the angle weld at the upper part of panel No. 2 broke off, and a crack appeared at the hook headbolt hole at the lower part of panel No. 3. When the displacement angle reached 3/10 (Δ = 90 mm), there was serious breakage at the welded joint of the left upper beam connector, and the cracks of the panels continued to expand (Figure 12e). At displacement angle 7/20 (Δ = 105 mm), each panel corner was damaged on a large scale, and the No. 3 panel presented oblique cracks (Figure 12f).

3.2. Specimen FW-2

The schematic diagram of the tested phenomena in the FW-2 group is shown in Figure 13. When the displacement angles reached 1/600 (Δ = 5 mm), 1/500 (Δ = 6 mm), and 1/400 (Δ = 7.5 mm), there was no obvious phenomenon in the overall specimen. The change of strain was within a reasonable range, the panel did not produce cracks, and a grating appeared during the experiment when the upper connector bolt and the long circular hole slid. When the displacement angles reached 1/350 (Δ = 8.6 mm), 1/300 (Δ = 10 mm), and 1/250 (Δ = 12 mm), there were no obvious phenomena. Only the two kinds of friction noise could be heard (the friction noise among the panel, bolt, and connector, and the friction noise between the enclosure reinforcement and the loading plate). When the displacement angle reached 1/200 (Δ = 15 mm), vertical cracks appeared at the bottom of panel No. 2 (Figure 13a). When the displacement angle reached 1/100 (Δ = 30 mm), the cracks at the bottom of the panels were extended. When the displacement angle reached 1/75 (Δ = 40 mm), a number of small fragments came off, and the bonding mortar cracked between panel No. 1 and panel No. 2, and panel No. 4 and panel No. 5. (Figure 13b). When the displacement angle reached 1/50 (Δ = 60 mm), a corner of the back of panel No. 4 was broken (Figure 13c). When the displacement angle reached 3/10 (Δ = 90 mm), new cracks appeared at the bottom of the panel, and vertical cracks appeared near the bolt holes at the connector on panel No. 4. When the displacement angle reached 7/20 (Δ = 105 mm), the ALC panel corner was broken severely, and the relative sliding between the bolt and the bolt hole could be clearly observed during the loading process (Figure 13d).

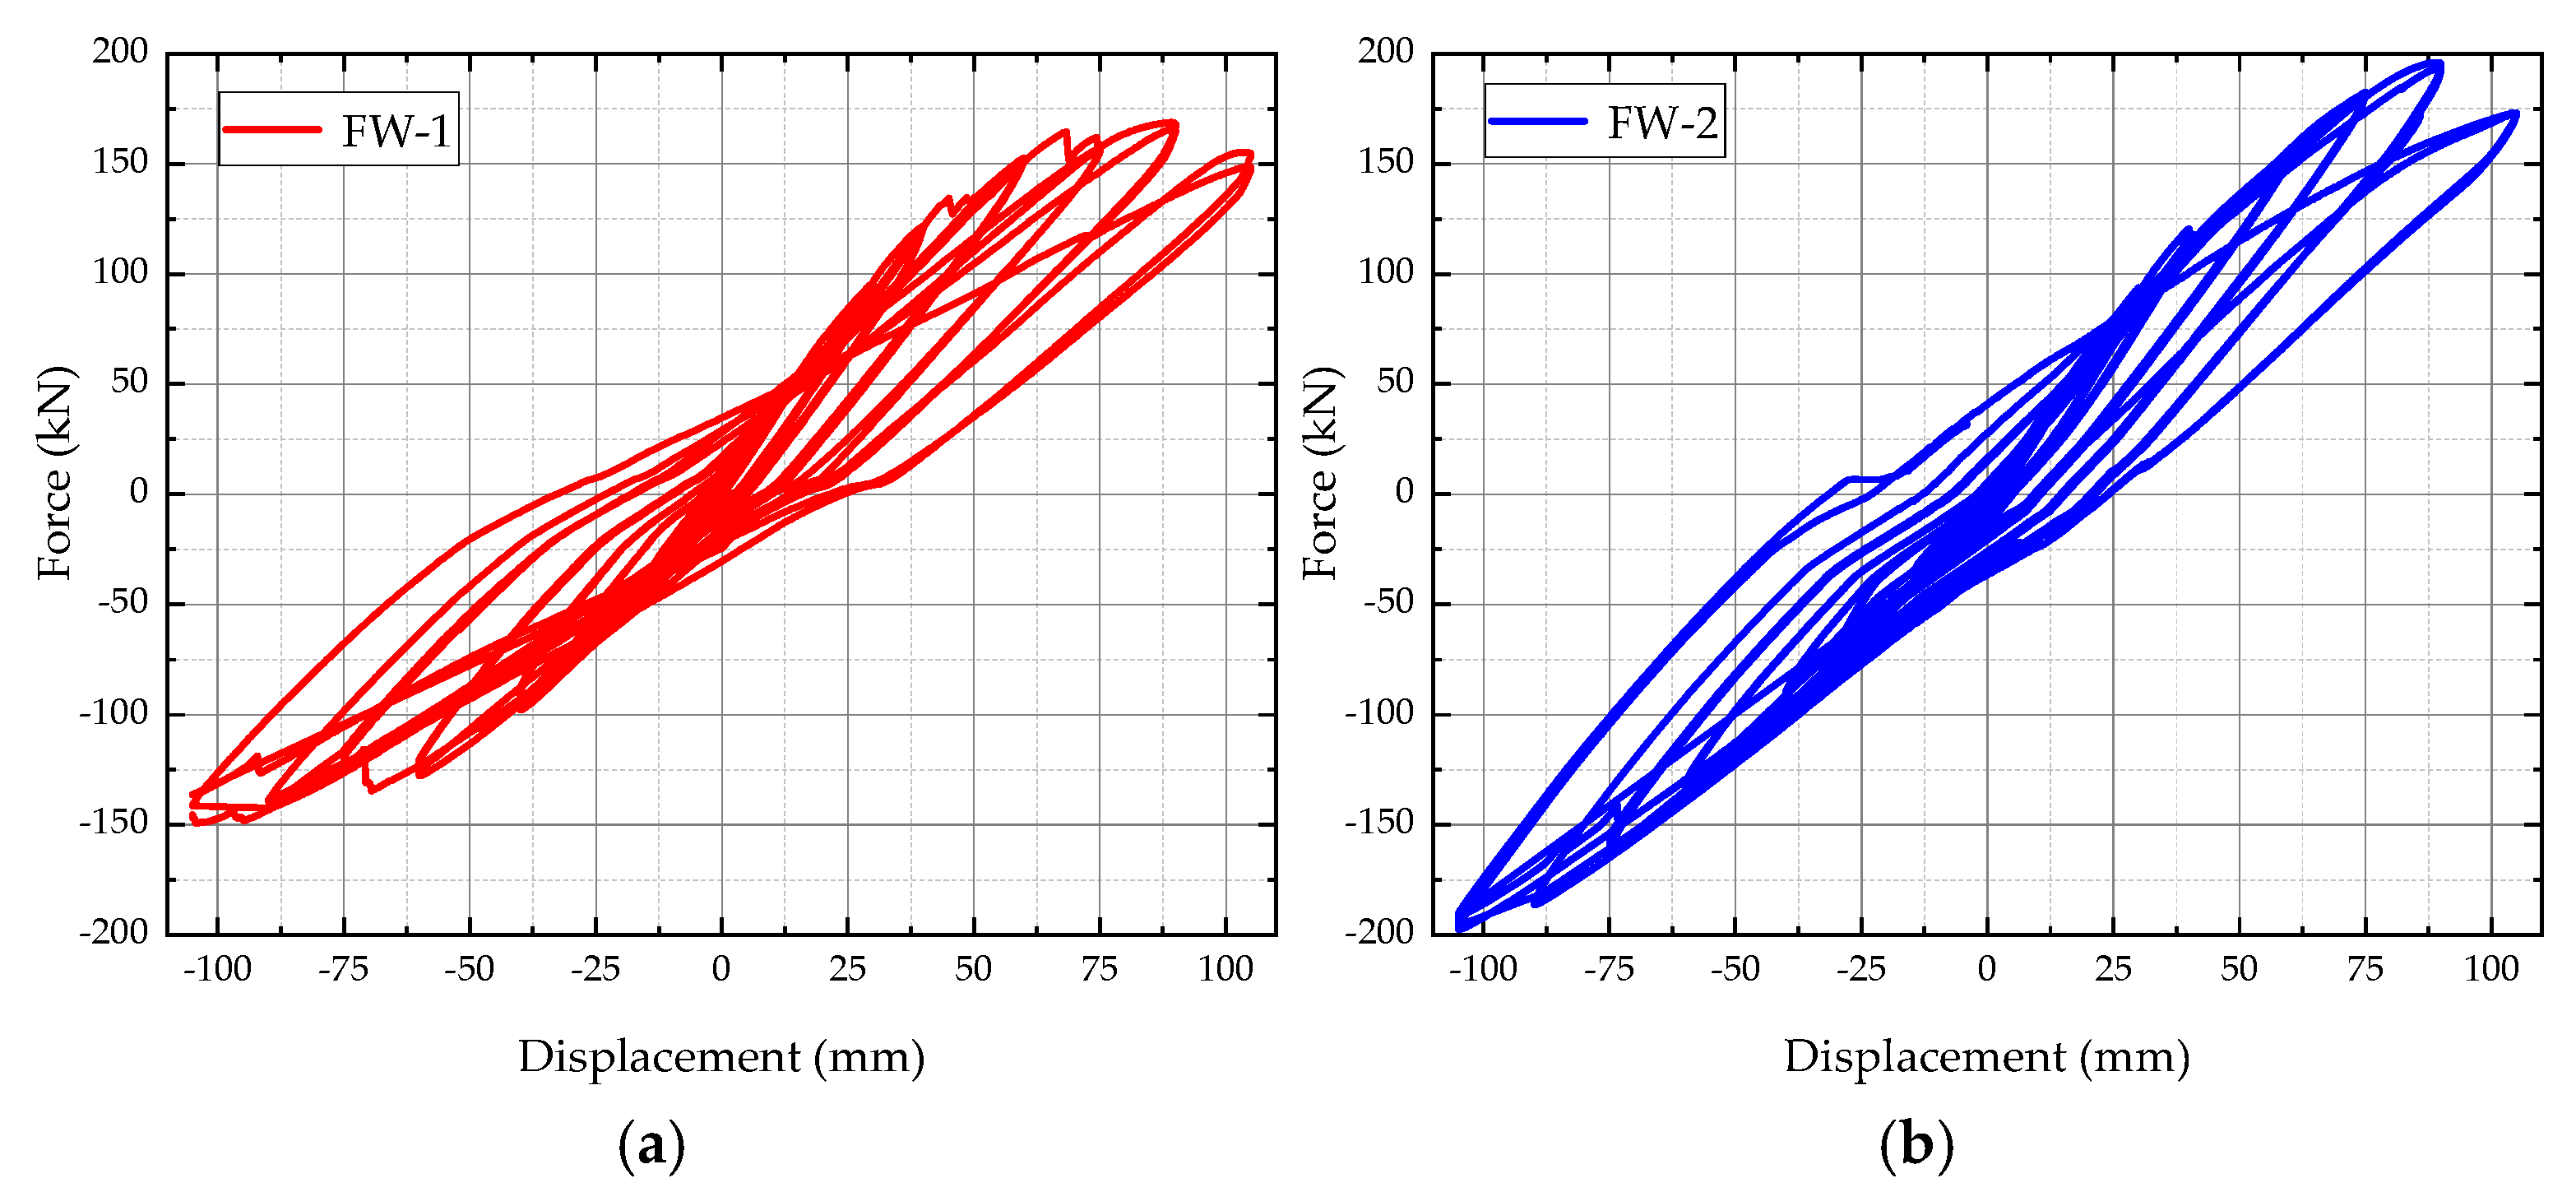
3.3. Hysteresis Curve
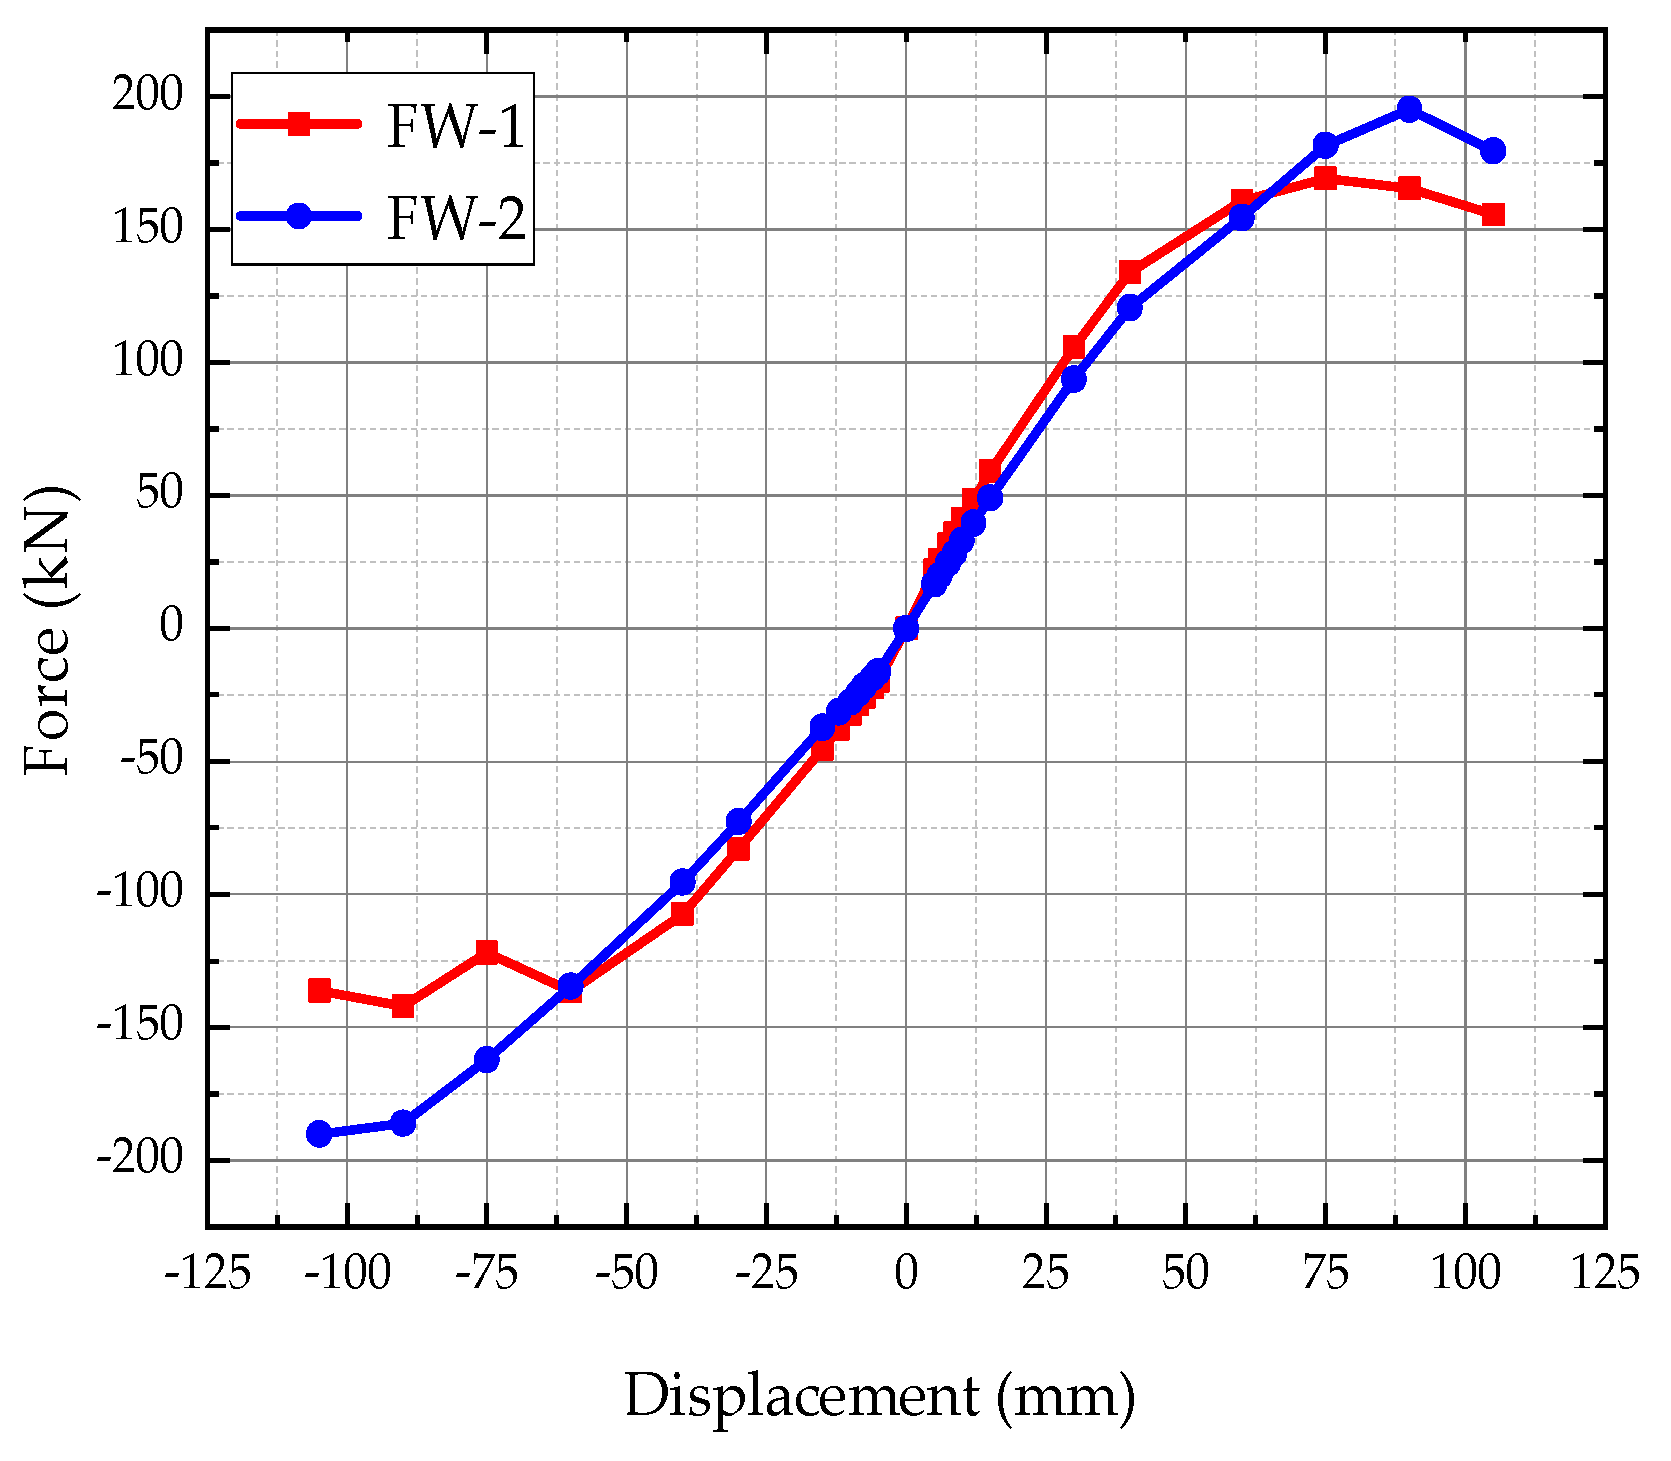
Figure 14 shows a comparison of the two sets of hysteresis curves. The hysteresis curve of FW-2 is fuller and encloses a larger area than FW-1. The bearing capacity of FW-2 is significantly greater than that of FW-1 at the same inter-story displacement angle, which indicates that FW-2 consumes more energy than FW-1 and absorbs seismic loads more effectively during earthquakes. The two sets of hysteresis curves behave asymmetrically, and the negative bearing capacity values are greater than the positive bearing capacity value. With the increase in loading displacement, FW-2 gradually approaches the inverse S-shape and “pinche”, which indicates slippage in the upper part of the pendulous Z-panel connector and some residual deformation of the connection. The characteristic values on hysteresis curves are shown in Table 3.

3.4. Skeleton Curve

The skeleton curve is obtained by connecting the peak points in the same direction on the hysteresis curve in sequence. It reflects the characteristics of the specimens at different stages of stress and deformation. The trend of skeleton curves of FW-1 and FW-2 are similar. However, the positive and negative displacements are asymmetric. The value of positive displacement is greater than negative displacement, resulting from the different fine cracks and ground beam slippage caused by the positive and negative displacements during the test (as shown in Figure 15). Before the displacement reaches 60 mm, FW-2 is lower than FW-1 due to the pendulous Z-panel connector setting of a long circular hole, which reduces the impact of load on the panel and increases overall stability. The drop of FW-2 is slower after passing the peak point, and the bearing capacity of FW-1 decreases rapidly after passing the peak point. It indicates that the carrying capacity of the FW-2 group is higher than the FW-1 group, which reduces the risk of overall instability.

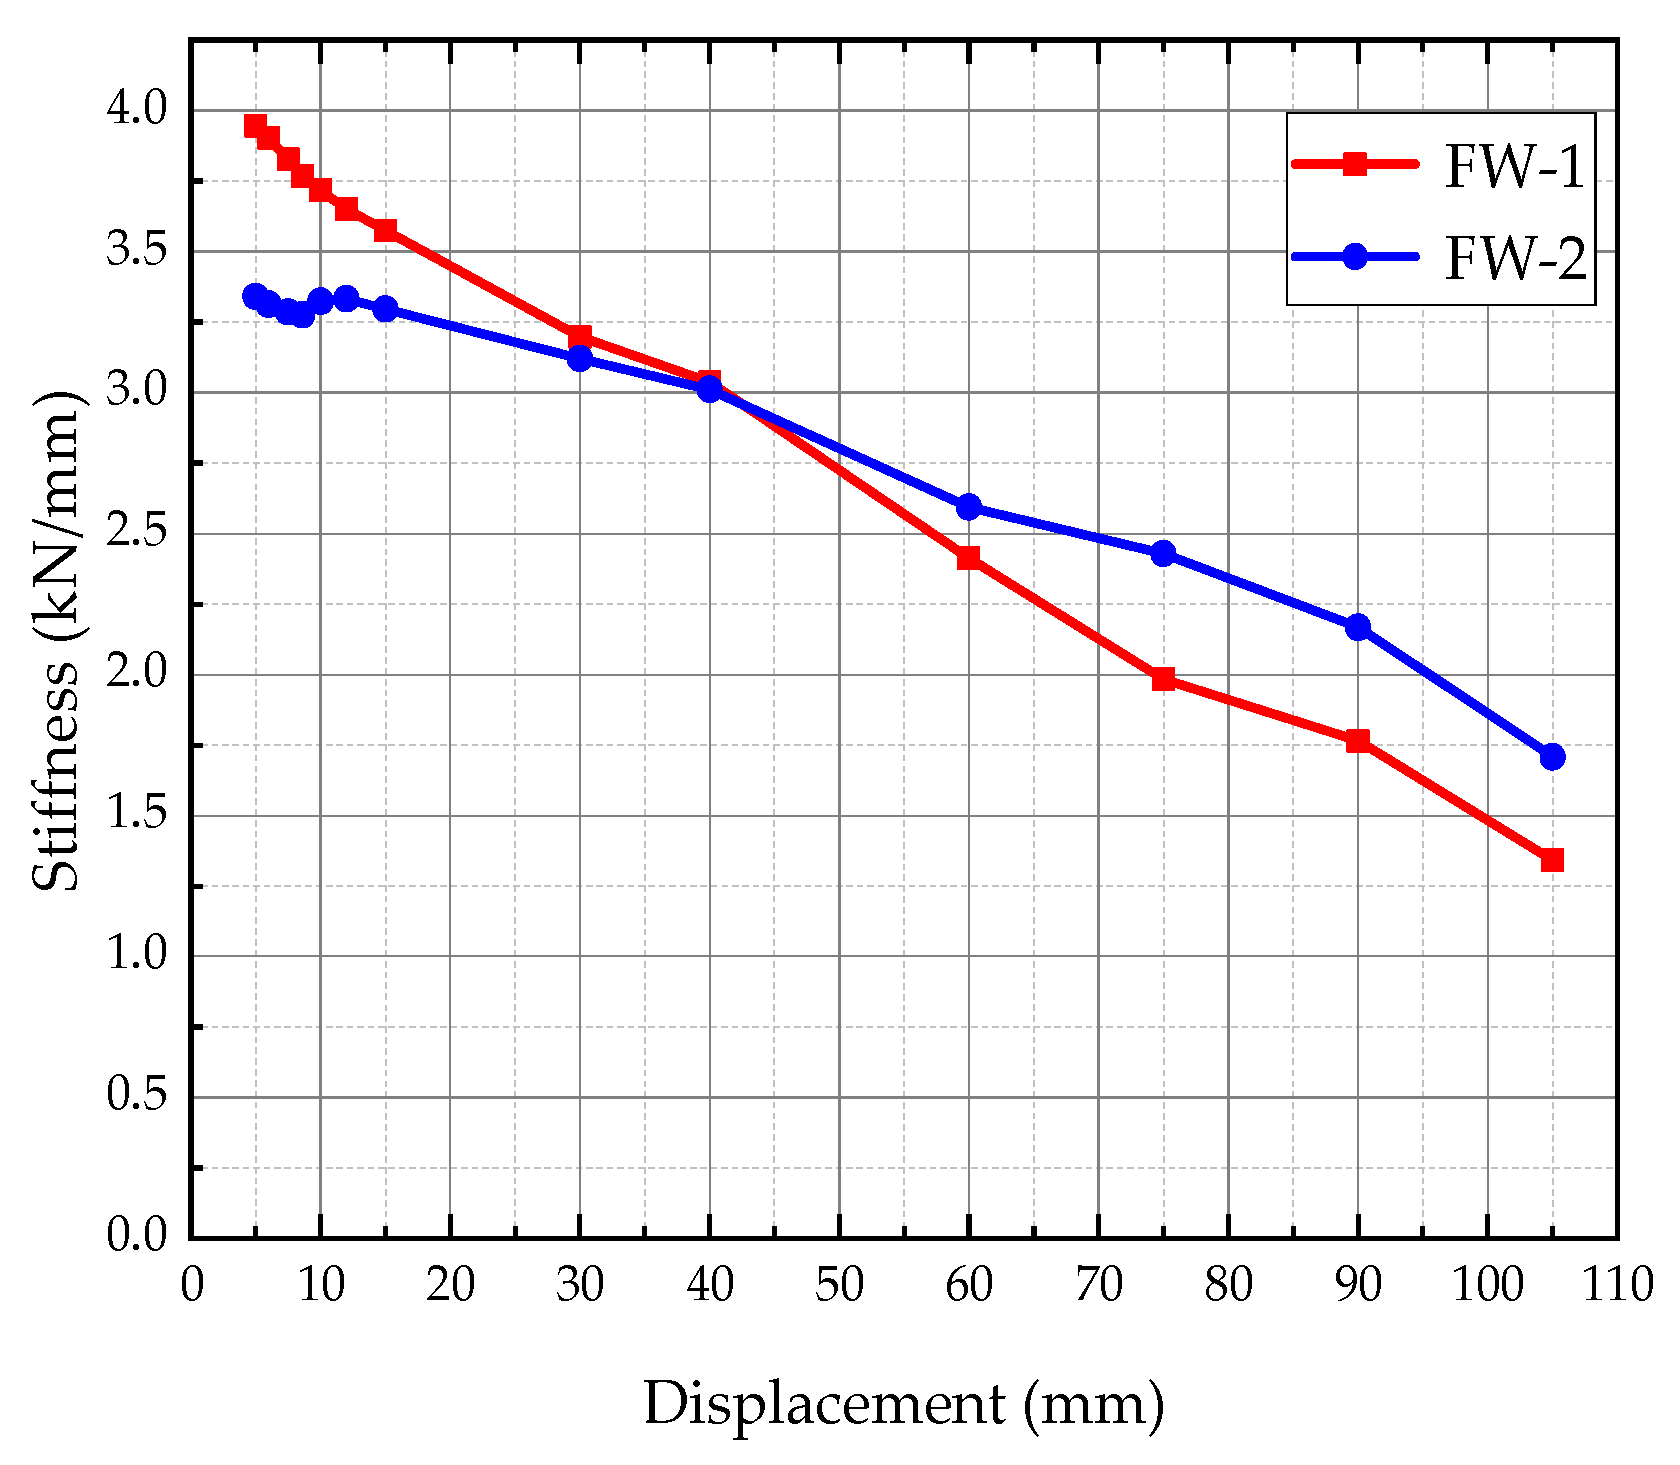
3.5. Stiffness Degradation

Figure 16 uses the secant stiffness to reflect the accumulation of structural damage at the two groups of connectors under external loads expressed as follows.
K = | + F i | + | F i | | + X i | + | X i |
where Fi and Xi are the peak load and peak displacement in the i-th loading regime, respectively. The initial stiffness of specimen FW-2 is smaller than that of specimen FW-1, and the stiffness degradation rate is slower in the middle and later stages of the test. It is due to the bolt sliding in the long circular hole of the ALC pendulous Z-panel connector, which creates a buffer zone between the frame and the ALC panel. At the beginning of the test, the provision of the long circular hole reduces the lateral stiffness of the overall structure and the effect of seismic loading on the ALC panel, while increasing the stability of the ALC panel. In the later part of the test, the bolt contacts the edge of the long circular hole of the connector and provides load-bearing capacity for the whole structure.

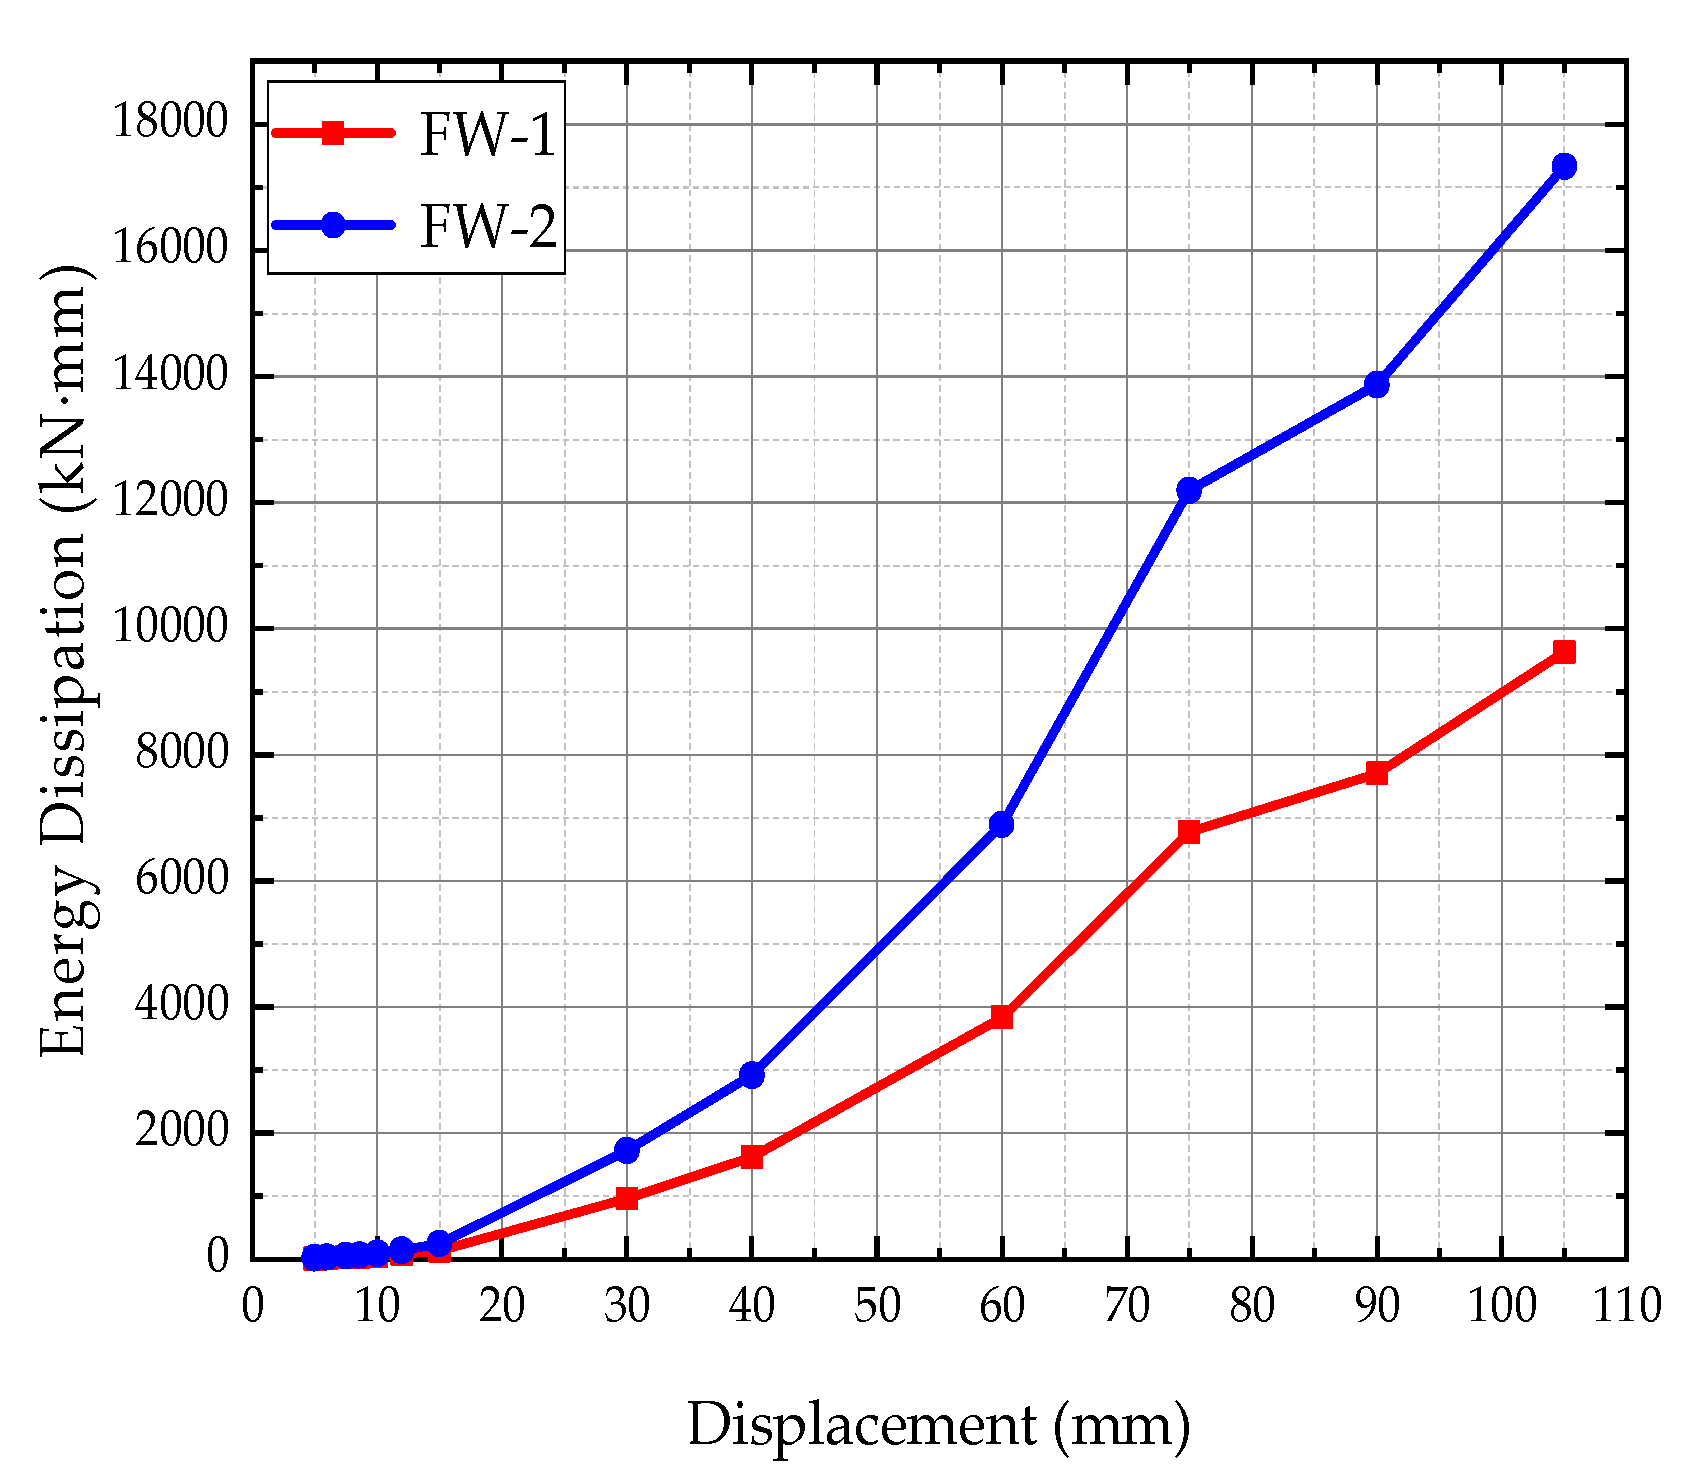
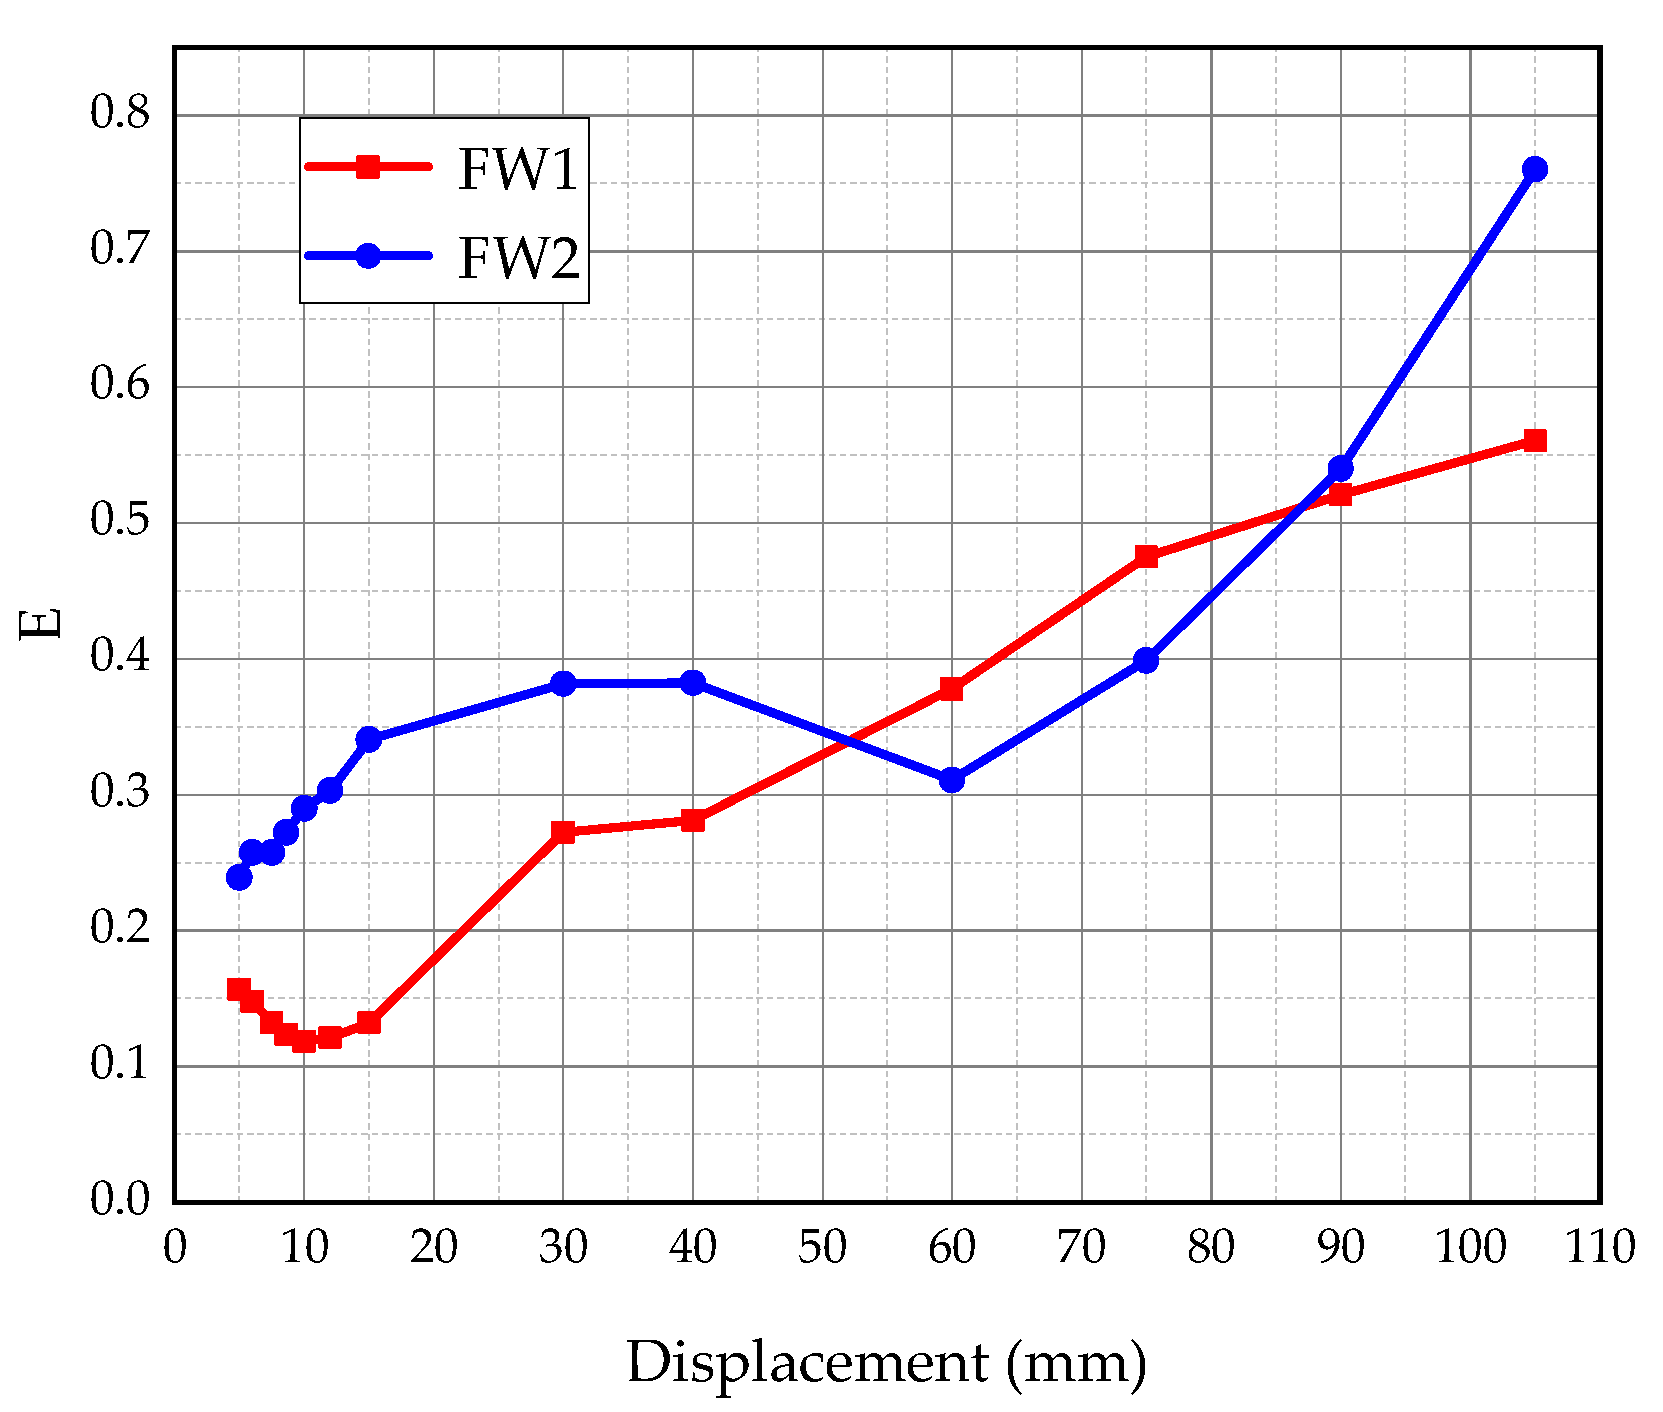
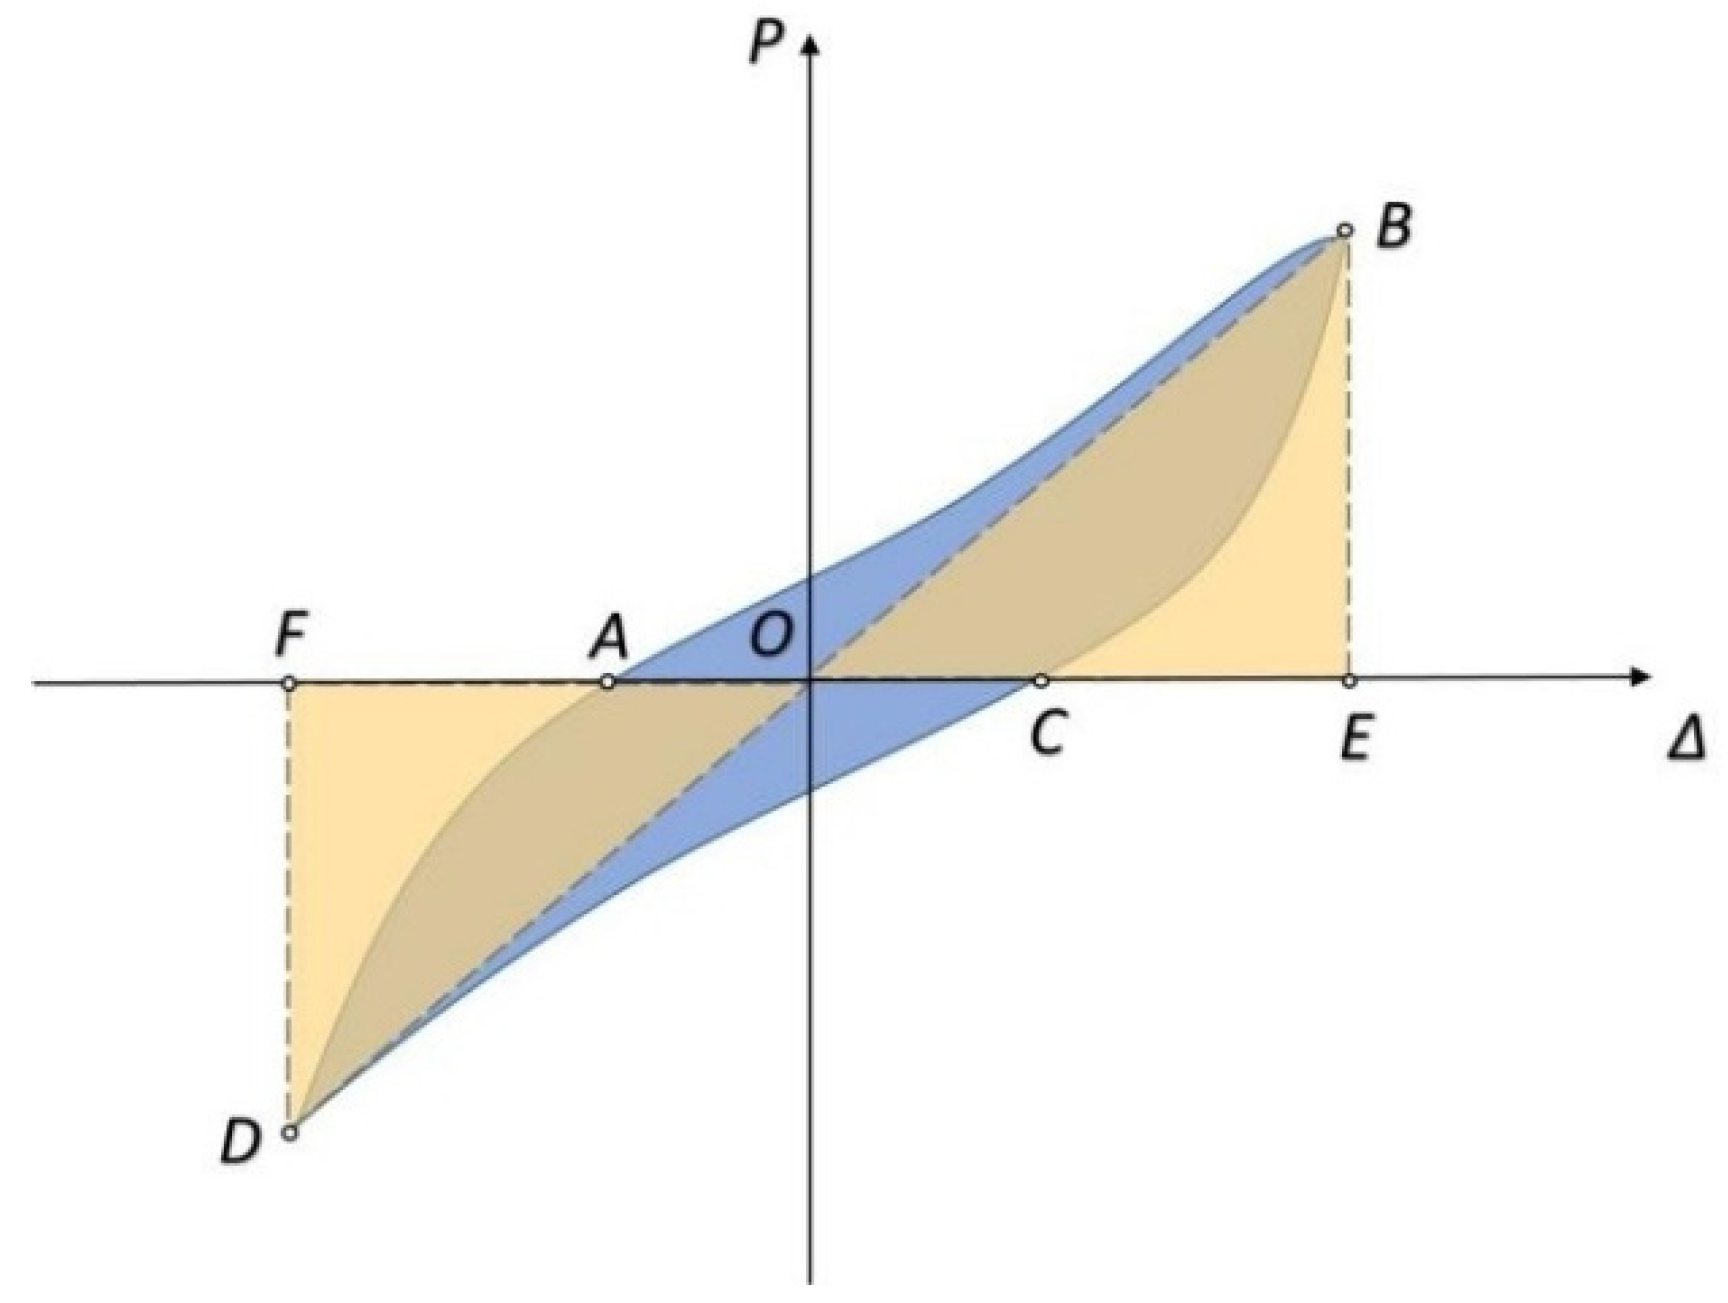
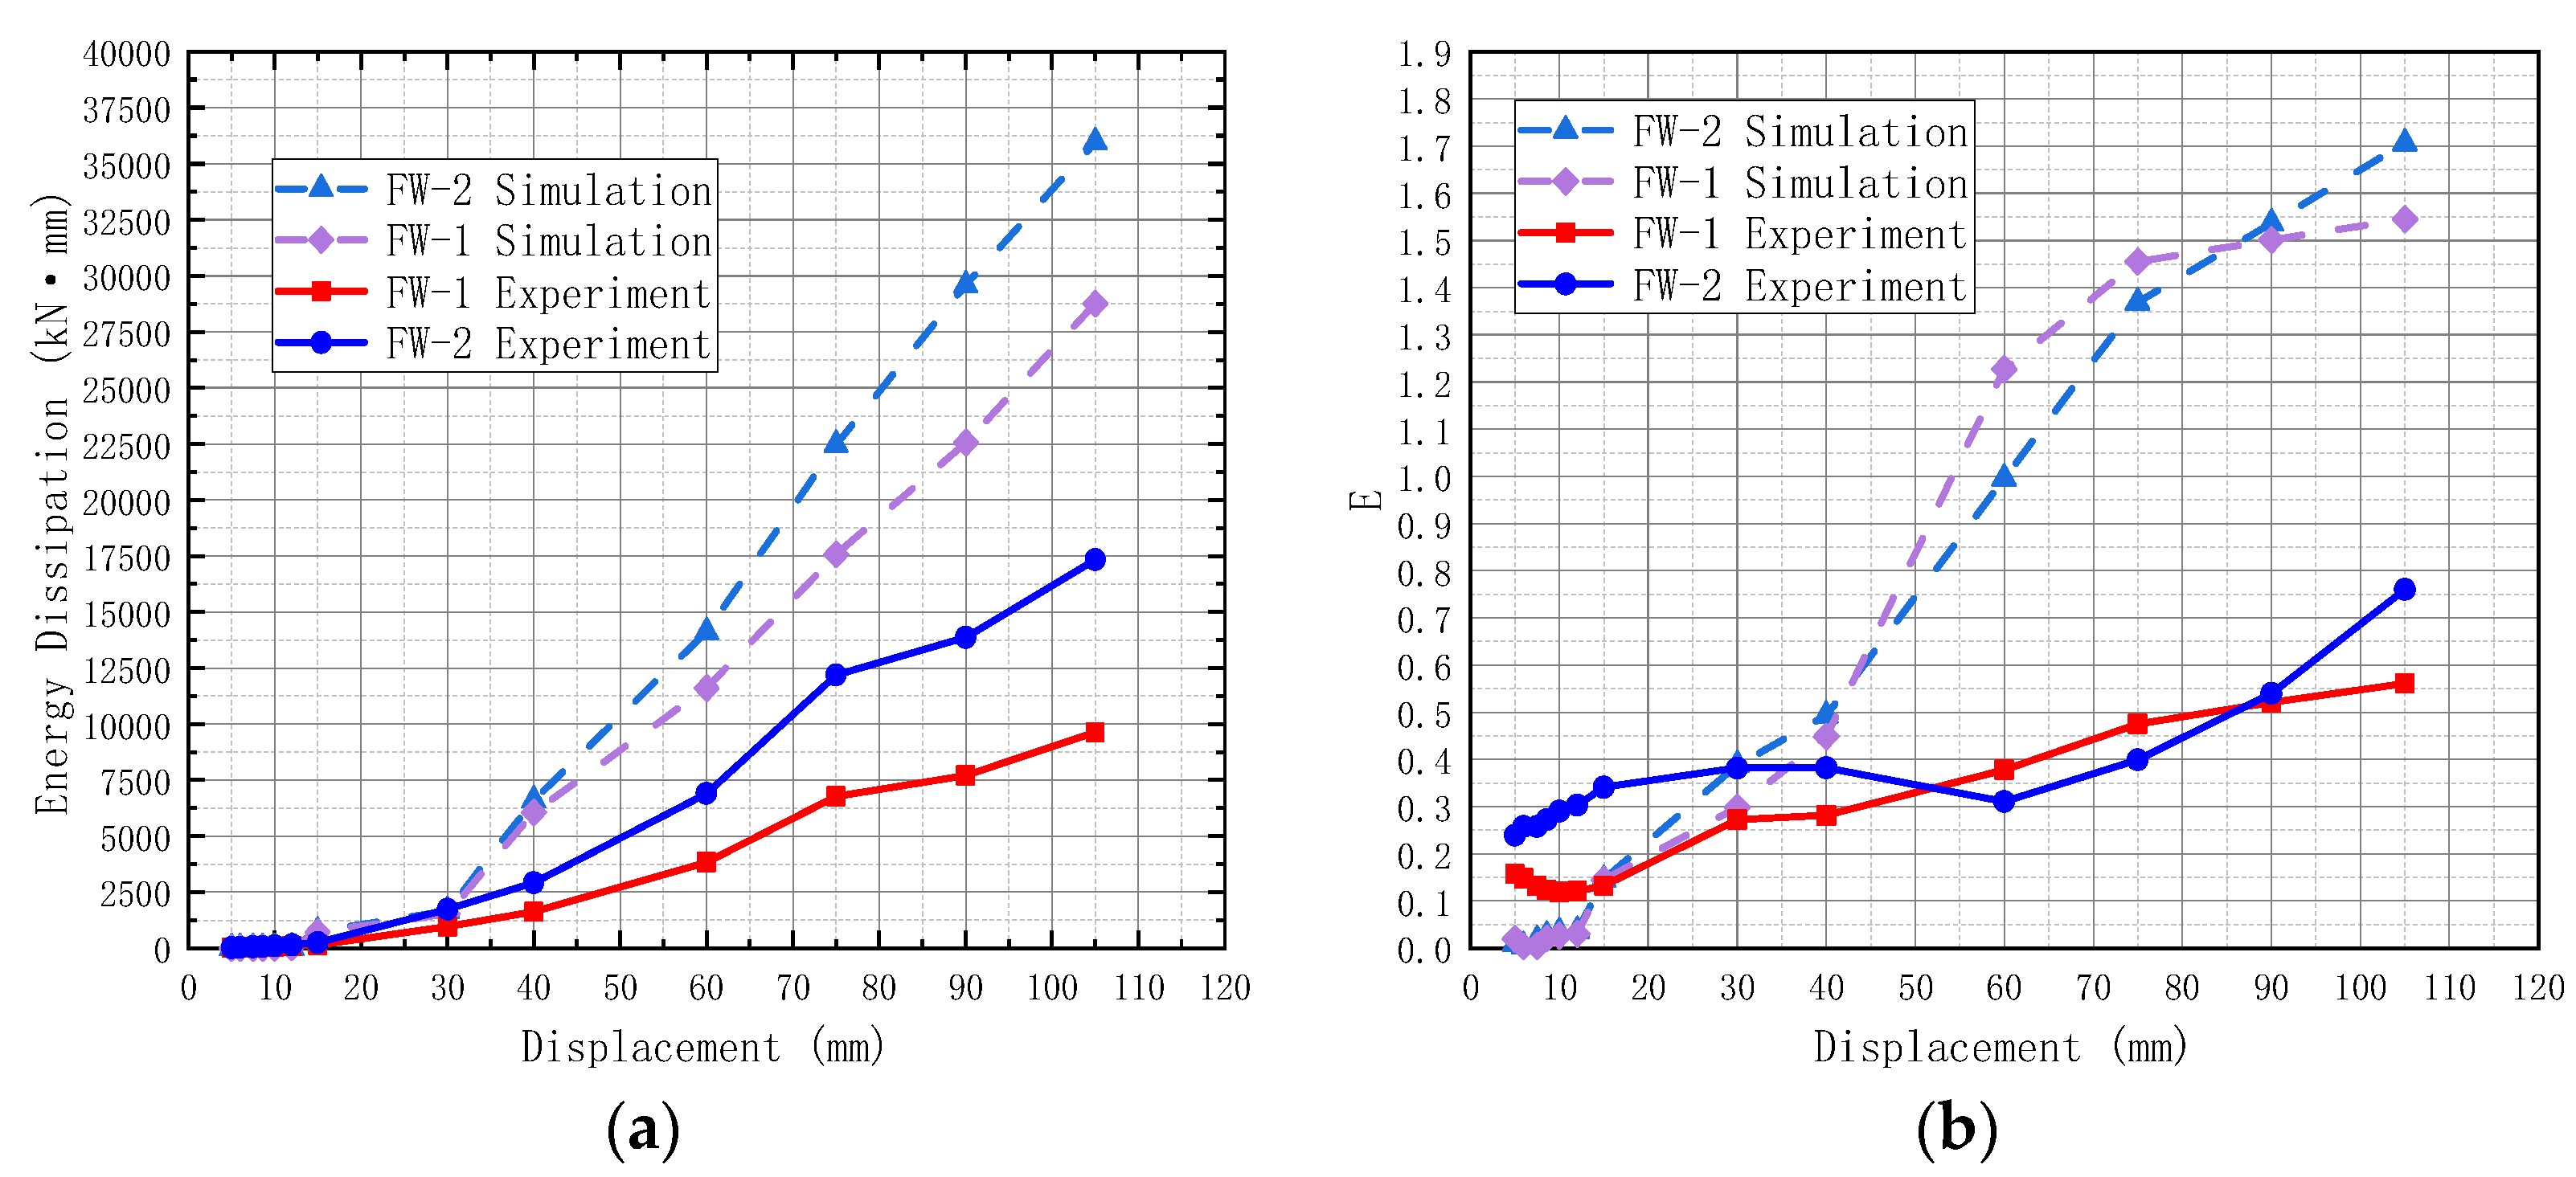
3.6. Energy Dissipation

The area enclosed by the load–displacement hysteresis loop and the energy dissipation factor E was used to investigate the energy dissipation capacity of the two sets of specimens, which can be found in JGJ/T 101-2015 “Specification for seismic test of buildings” [27].
Figure 17 shows the total amount of total energy dissipation in both groups, and it can be observed that the trend of the FW-1 and FW-2 curves is similar. However, the values of specimen FW-2 are larger than that in FW-1.
The energy dissipation coefficient (E) is shown in Figure 18 and defined as
E = S A B C + S C D A S O B E + S O D F
where SABC and SCDA in the numerator are the areas of the hysteresis curves ABC and CDA, and SOBE and SODF in the denominator are the areas of OBE and ODF (as shown in Figure 19). Specimen groups show approximately the same growth trend. In general, the values of FW-2 are larger and faster than those from FW-1. The pendulous Z-panel connector group has better participation in energy dissipation and improves stiffness than the hooked bolt connector.

4. Finite Element Analysis

In order to fully reflect the force mechanism of the two groups of ALC panel steel frame systems, a series of validation and parametric analyses are performed on the pendulous Z-panel connector and the external hooked head bolt connector.

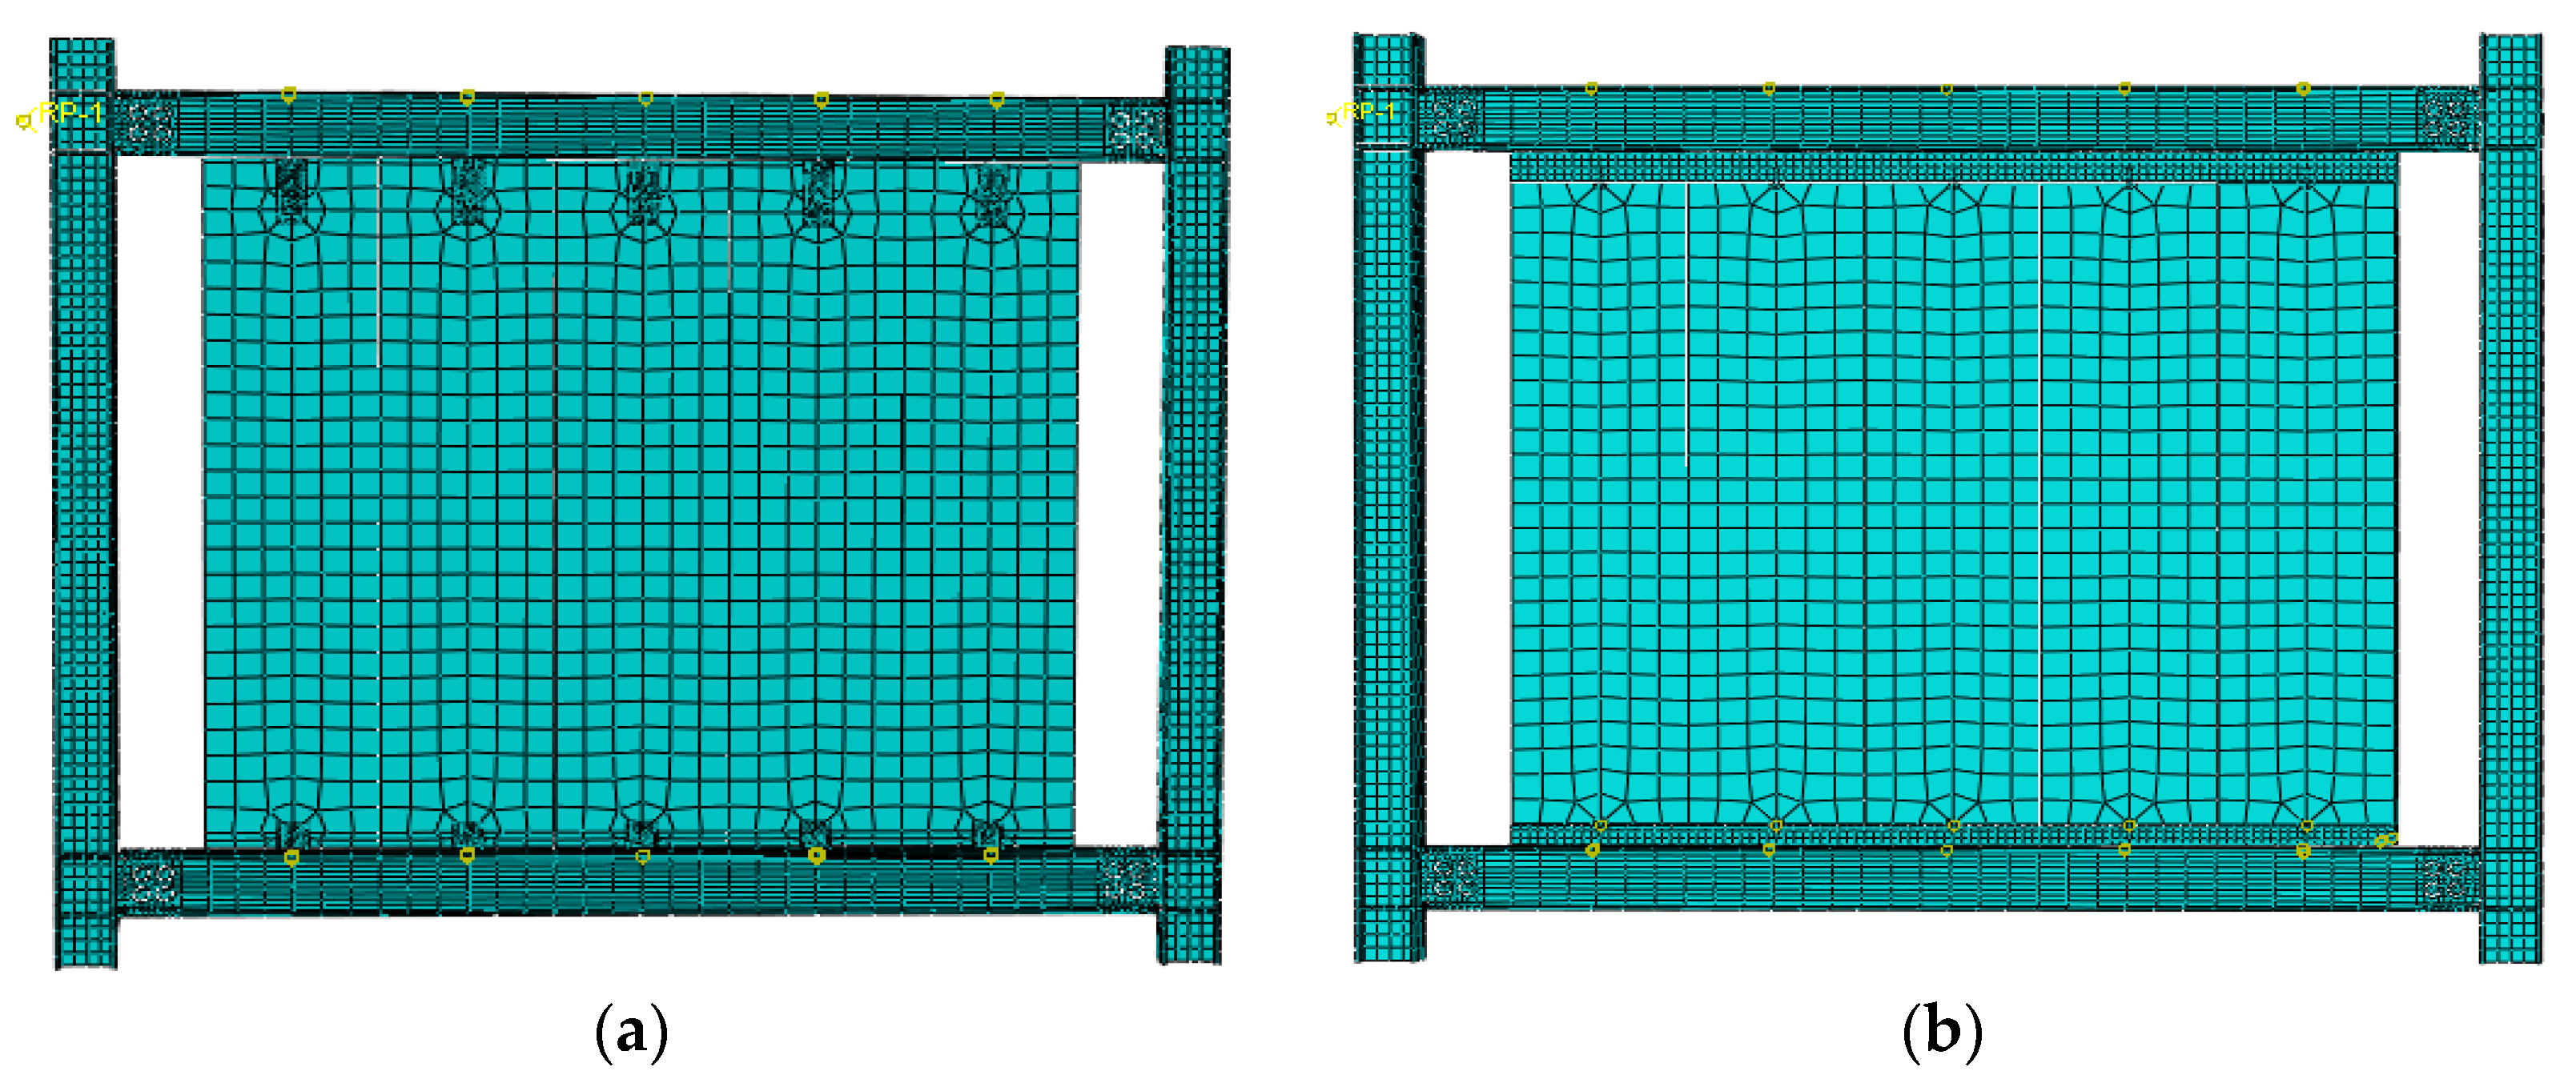
4.1. Finite Element Models

The data simulation and analysis were performed by using ABAQUS finite element software [28,29]. The two models were identical in size, reinforcement distribution diameter, and ALC panel grade. A hexahedral linear reduction integral solid element (C3D8R) was chosen to simulate the column footing, steel beam-column, connector, and bolt to simplify the model. The ALC panel internal reinforcement used linear truss elements (T3D2) to simplify the model. In order to improve the calculation efficiency, the ALC panel bolt holes were refined, and other parts used a thicker mesh (as shown in Figure 20).
The “Tie” constraint replaced all welding operations (between beams and columns, between connectors and beams, etc.). The steel bar was assembled into the ALC panel by using the embed command. Due to the slip effect, the contact surfaces between the connector, bolt, and panel were set to hard contact.
The steel beam and column used Q235B, and the connector used Q345B. A 10.9-grade high-strength bolt (24 diameters) was used for the beam and column connections, and a 5.6-grade bolt (14 diameters) was used for the connector with the ALC panel. The concrete damage model was used to simulate the damage of the ALC panel, which could represent the tensile and compressive performance of the ALC panel in detail. More material properties are shown in Table 4.
According to the real conditions of the test, the H-shaped column’s bottom X, Y, and Z directions were constrained by the translation and rotation (UX = UY = UZ = URX = URY = URZ = 0), and the coupling point (UY = UZ = URX = URY = URZ = 0, UX = 1) of the beam end simulate the same low-cycle reciprocating load.

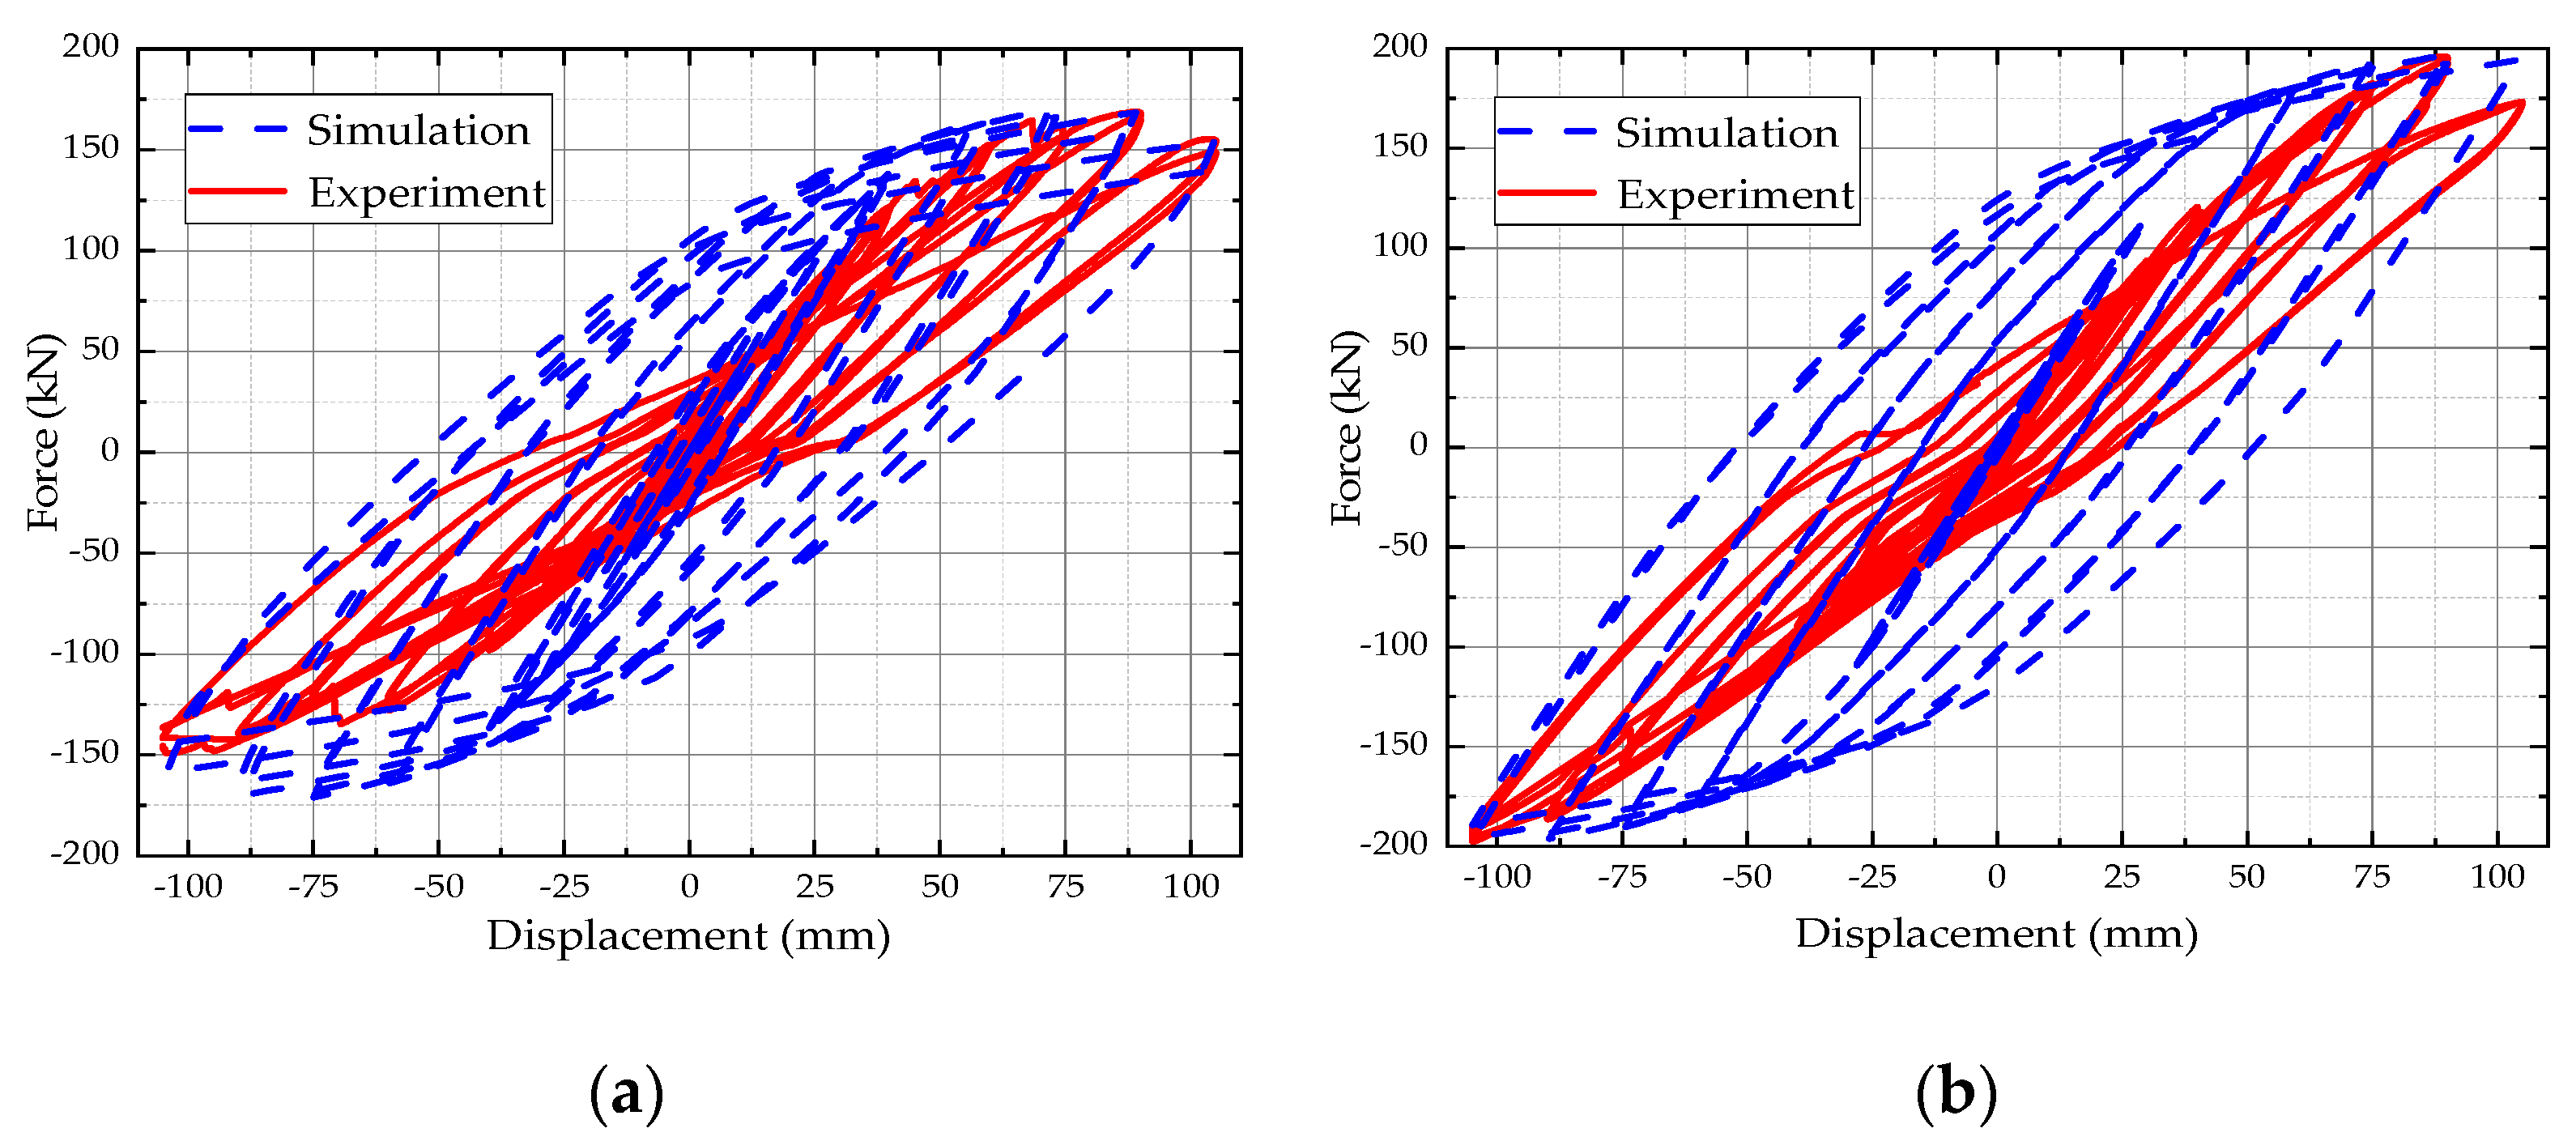
4.2. Comparison of Simulation Results and Experimental Results

Figure 21 shows the stress cloud diagram of the test models. The stress concentration points in the models are consistent with the damage phenomena of the specimens in the experiments, which mainly appear around the beam-column joints. Figure 22 shows the comparison of an experimental hysteresis curve and a simulated one. The overall trends of the hysteresis curves are approximately the same. The hysteresis loop area of the simulation is larger than that of the experiment. The peak value of the simulation is slightly lower than the experimental value, and the “pinch” effect of the experiment is more obvious than the simulation results (as shown in Figure 22). The trends of simulated energy dissipation and energy dissipation coefficient are approximately the same as the experiment. The simulated values are larger than the experimental values, because the area of the simulated hysteresis loop is larger than the experimental one (as shown in Figure 23). The finite element model simplifies the complex boundary conditions in the experiment (slippage of the ground beam, small gaps between specimens, etc.). Moreover, the steel mesh slippage on the ALC panel was not considered. However, all the above differences are reasonable explanations, and the results of the ABAQUS simulation are basically consistent with the experimental results.

4.3. Parametric Study

The damage of the specimen and stress concentration points are mainly found at the bolt hole and the beam-column joint. It indicates that the connector influences the force performance of the ALC panel steel frame. Based on the hooked bolt connector of the general conditions, the pendulous Z-panel connectors of 6 mm, 8 mm, and 10 mm are designed to provide references for practical engineering applications (as shown in Table 5).

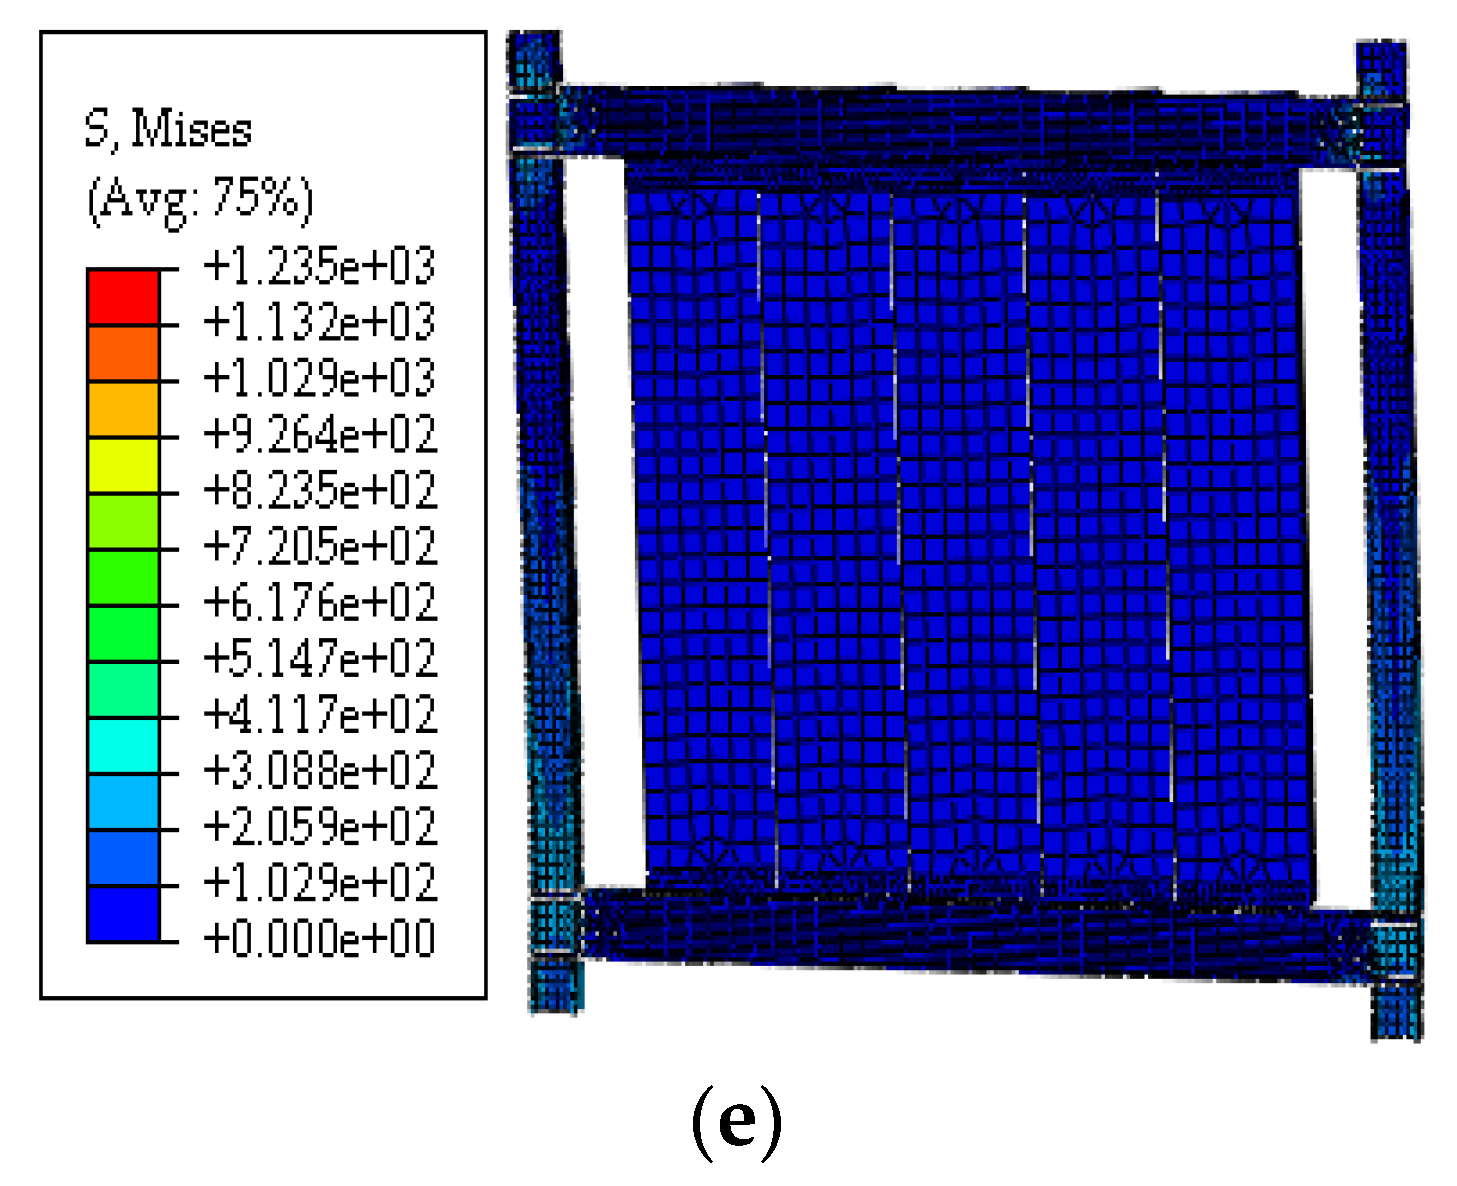
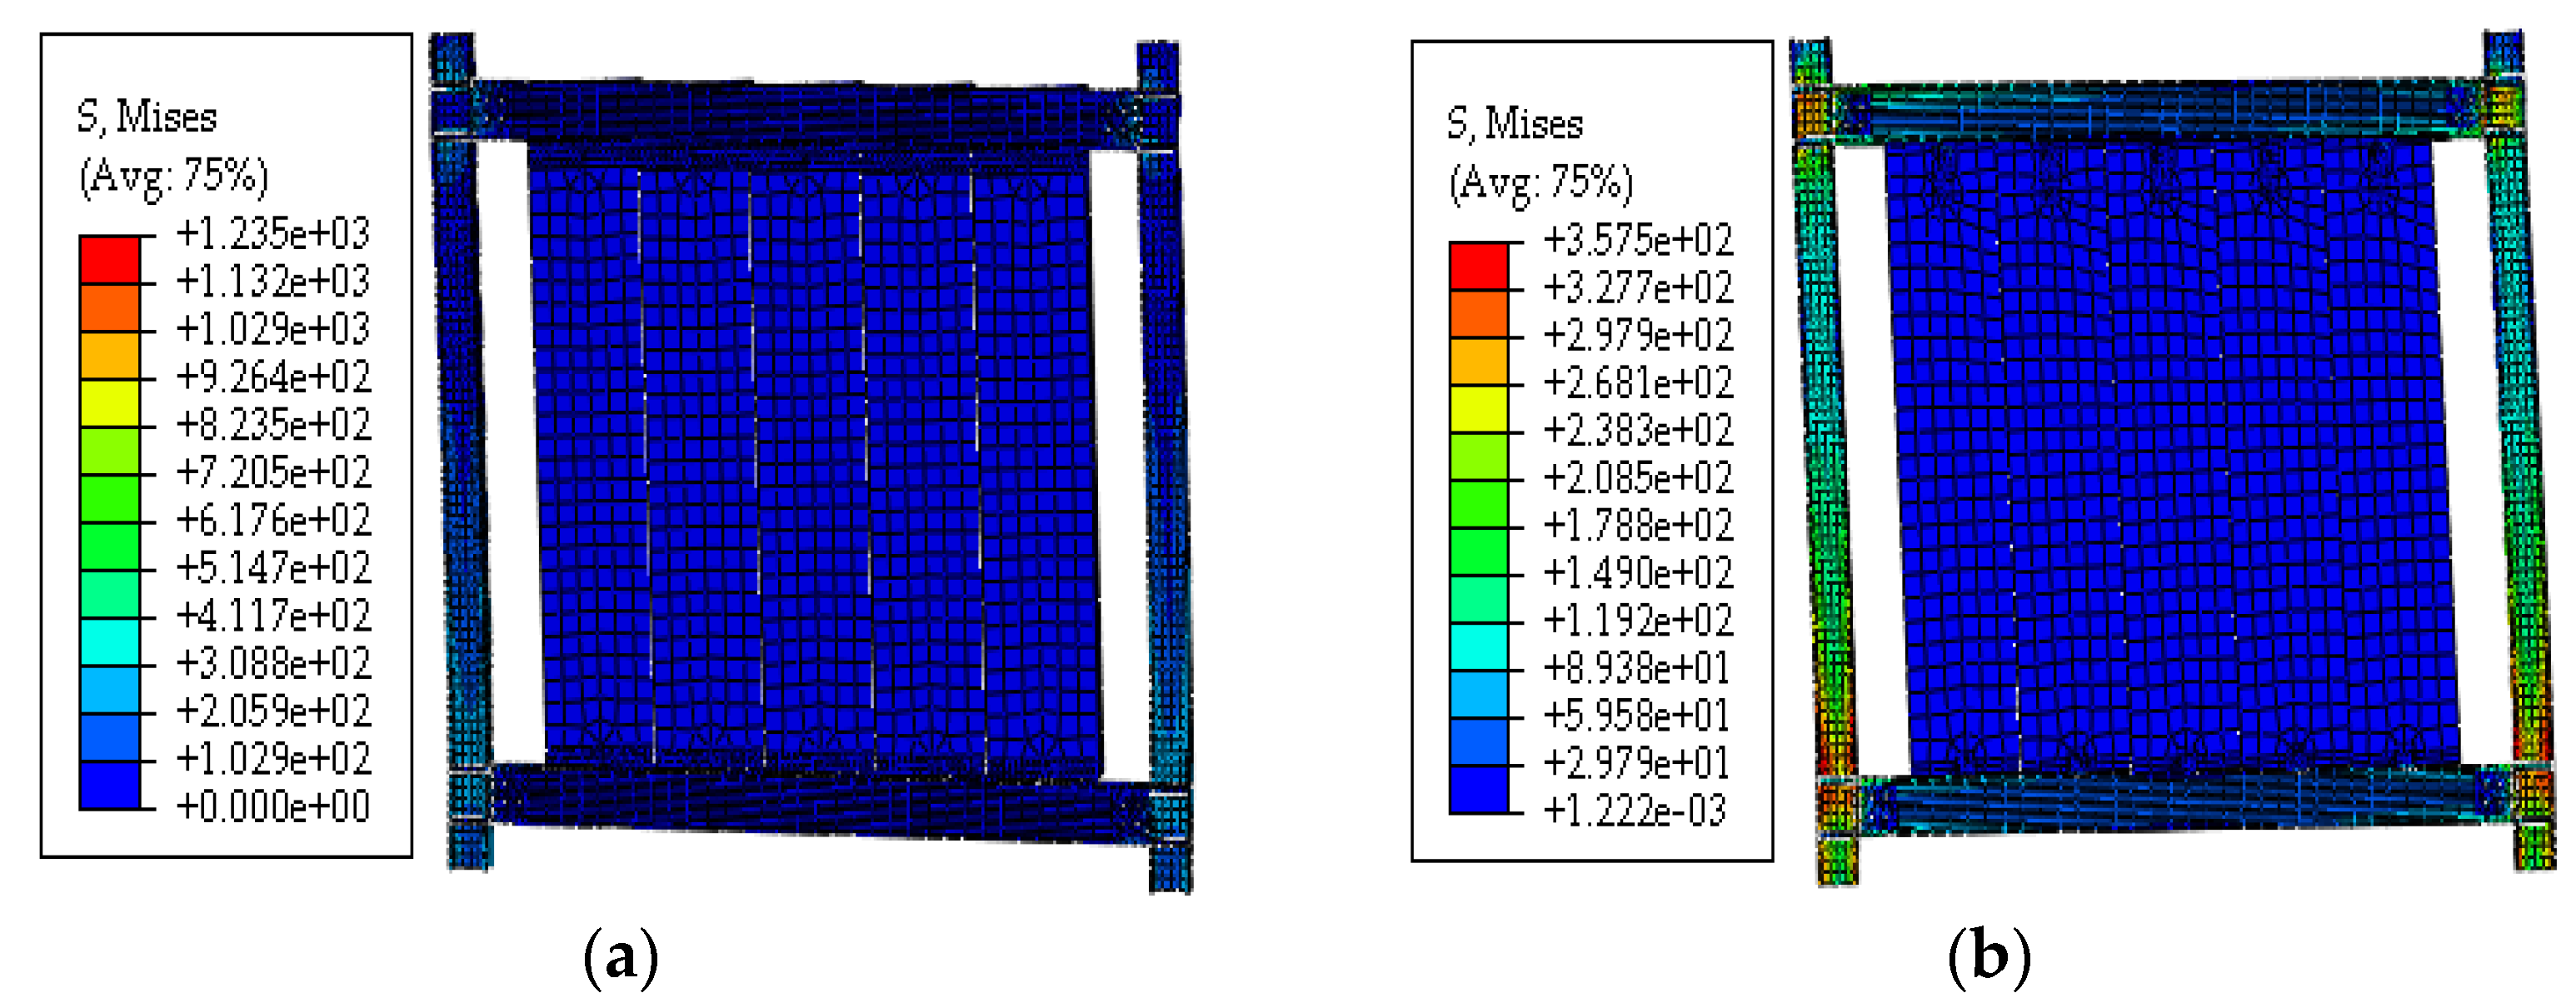
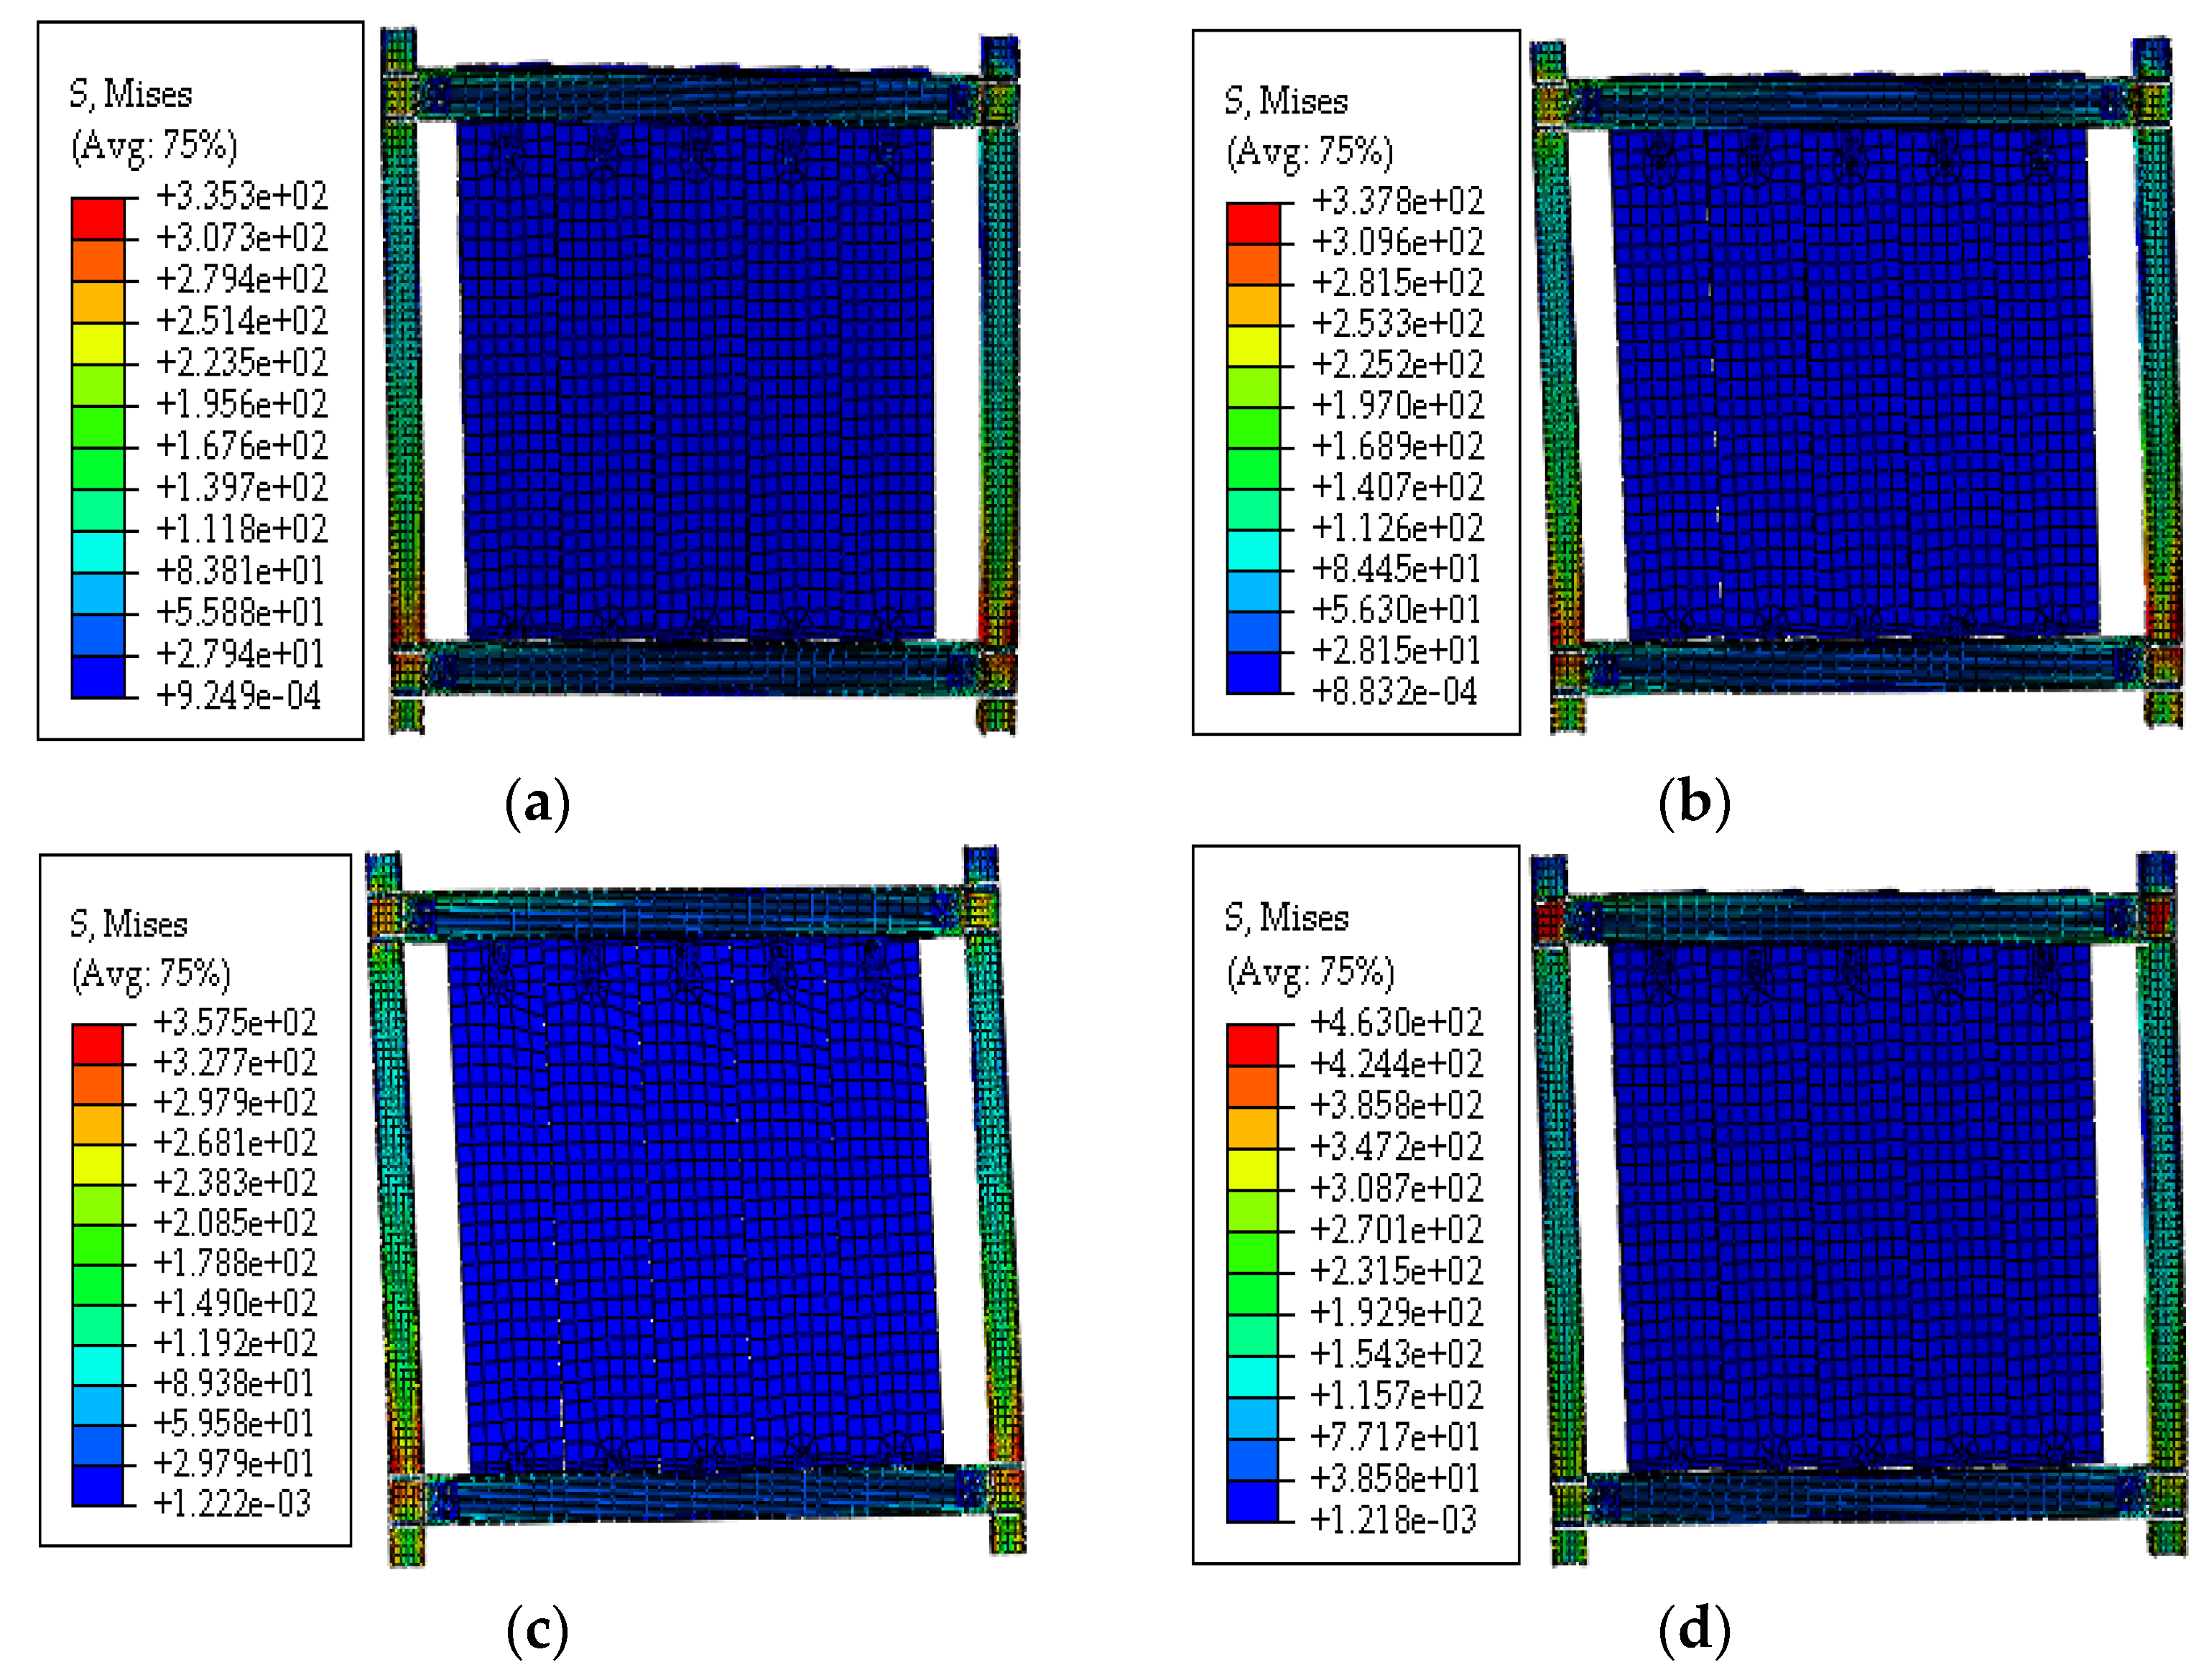
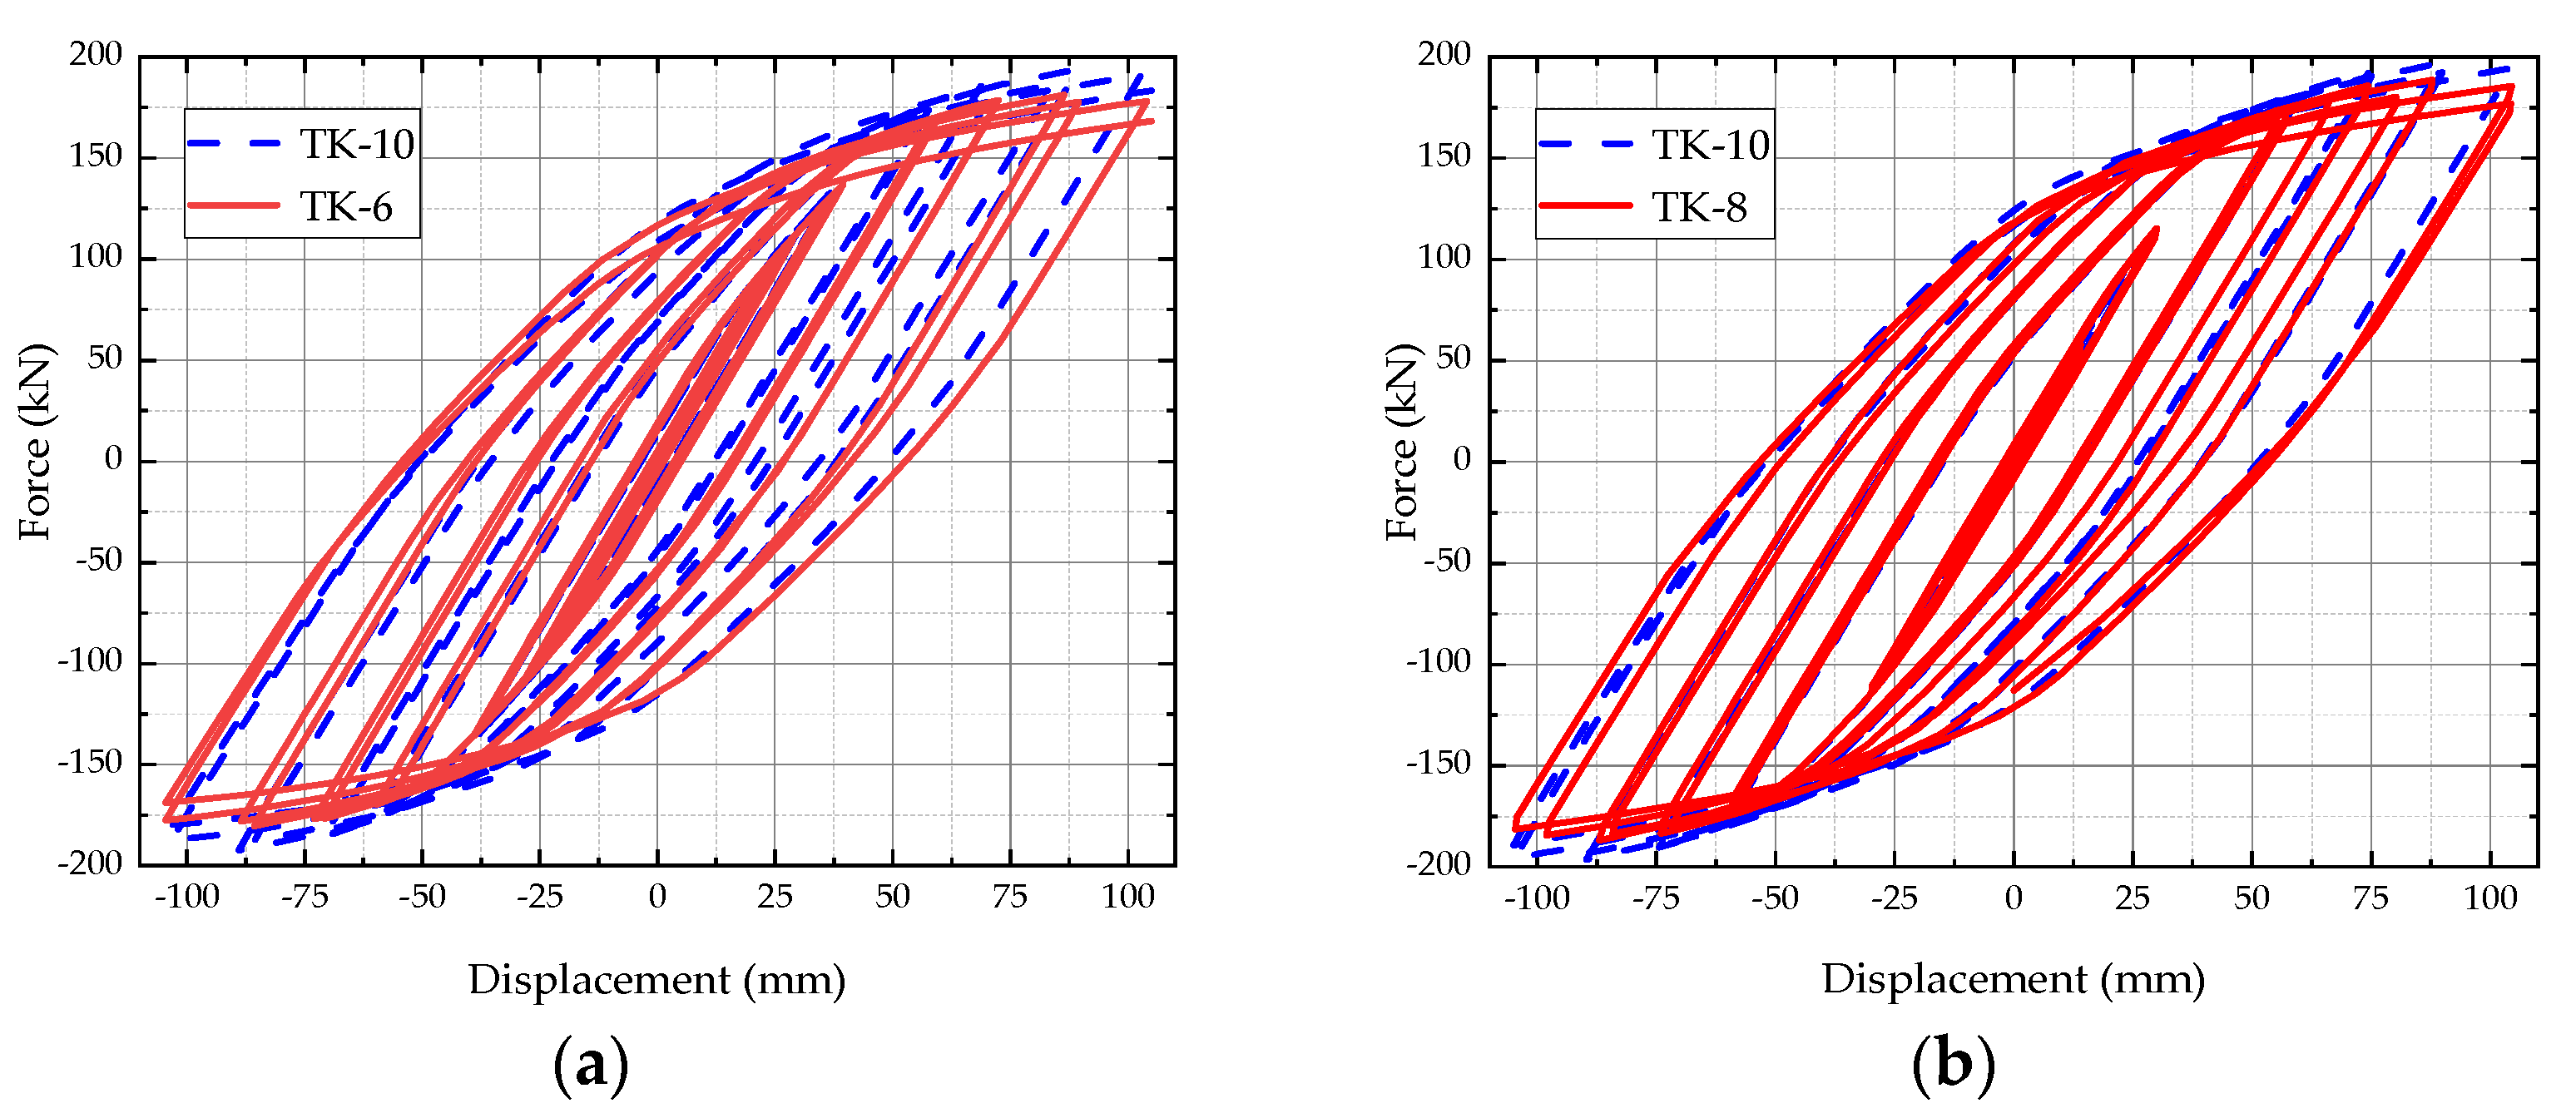
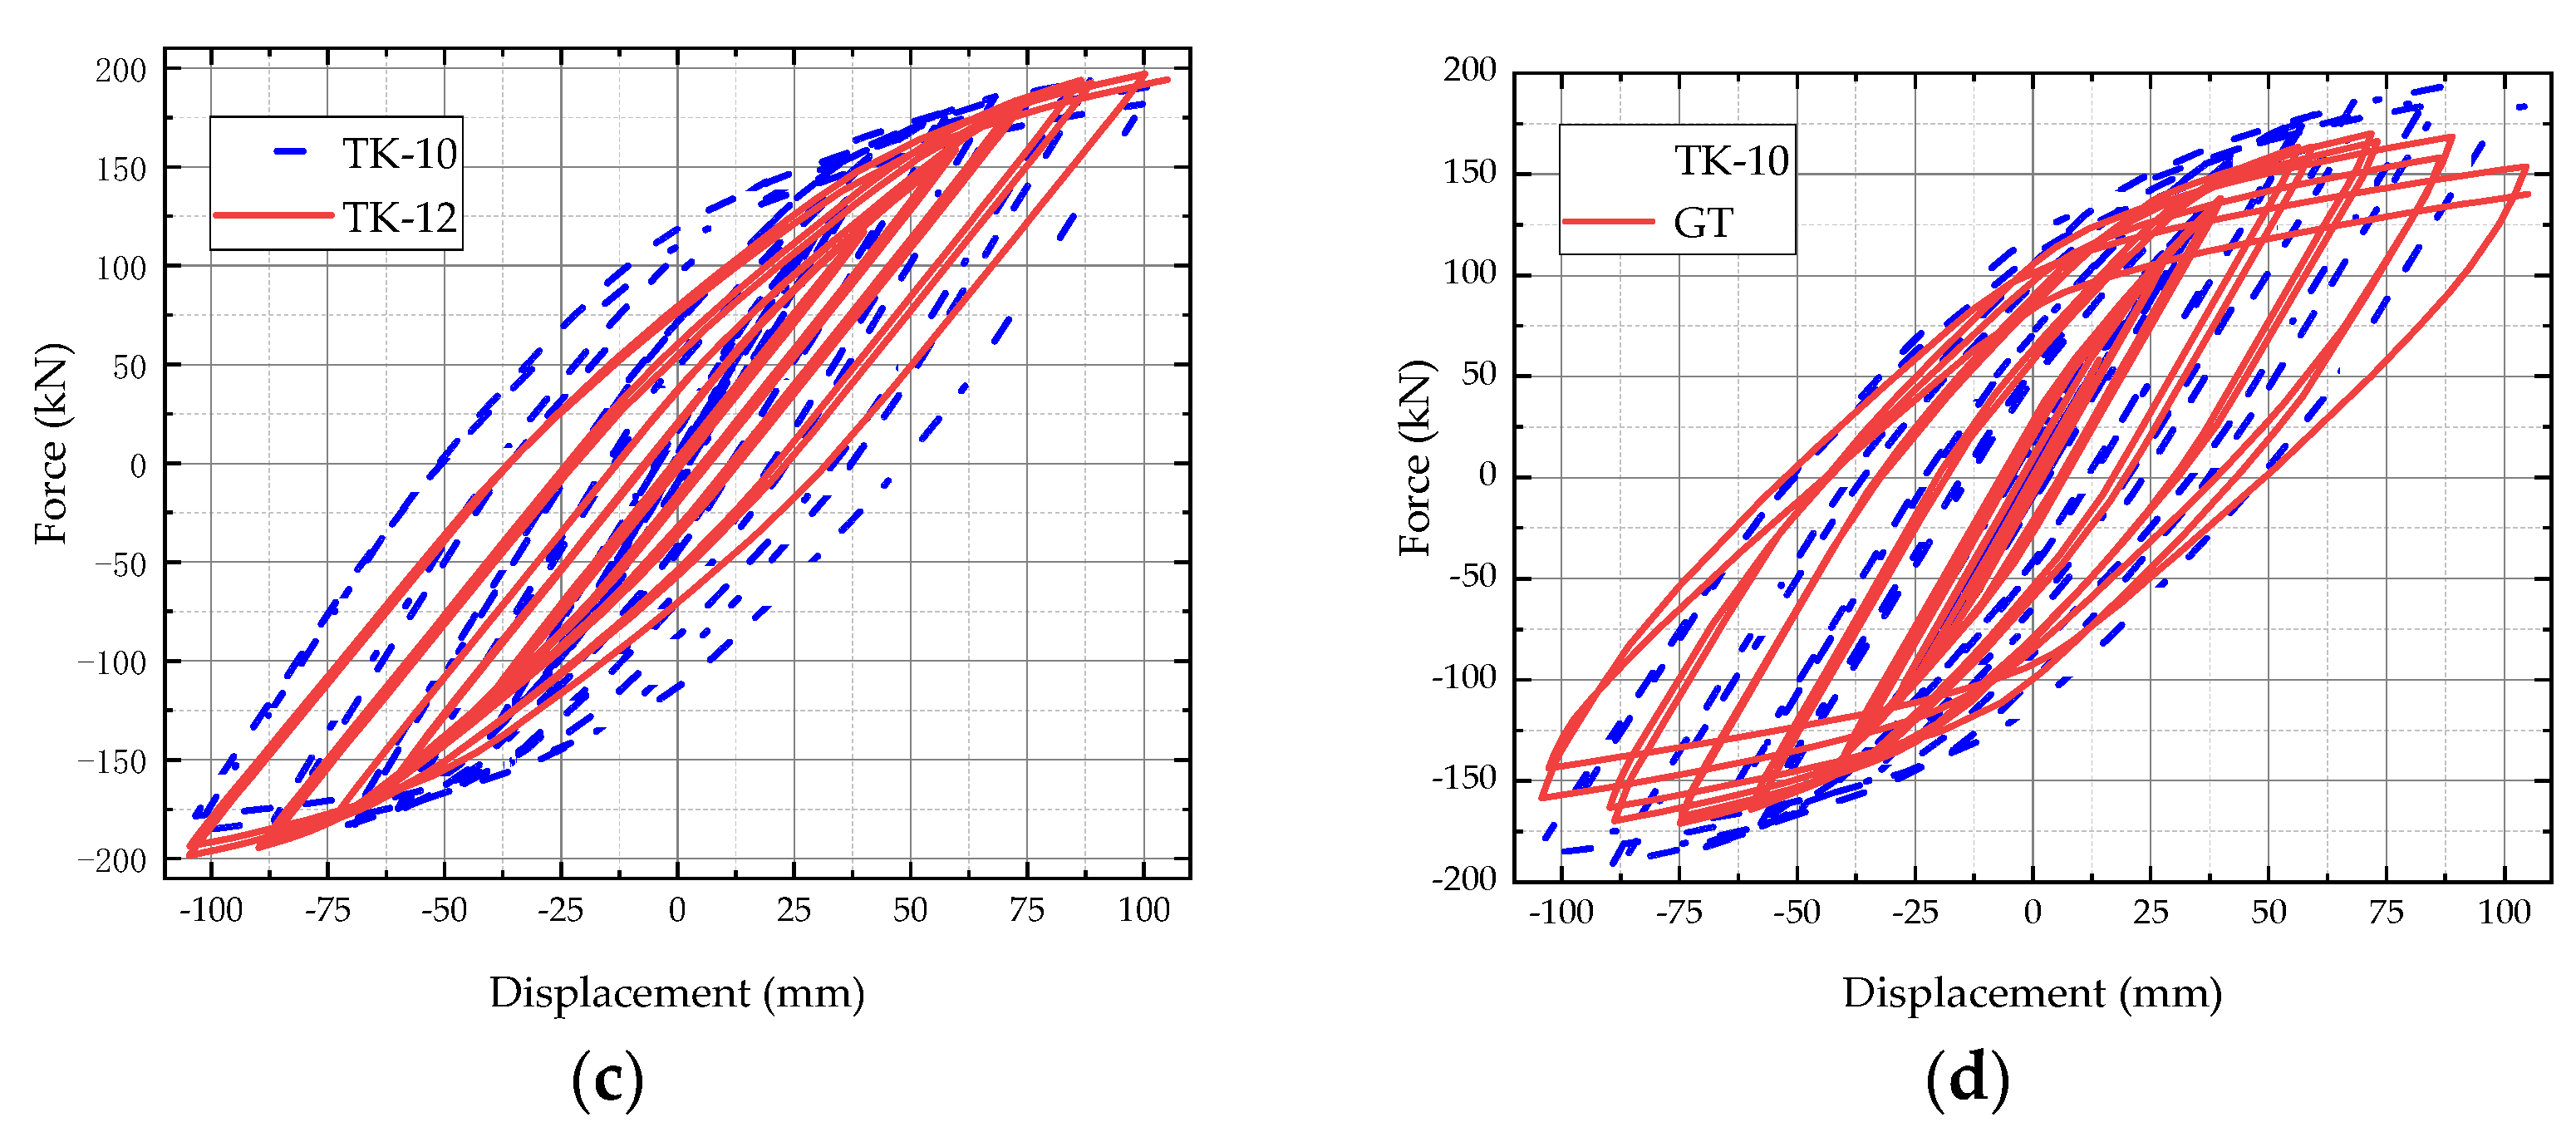
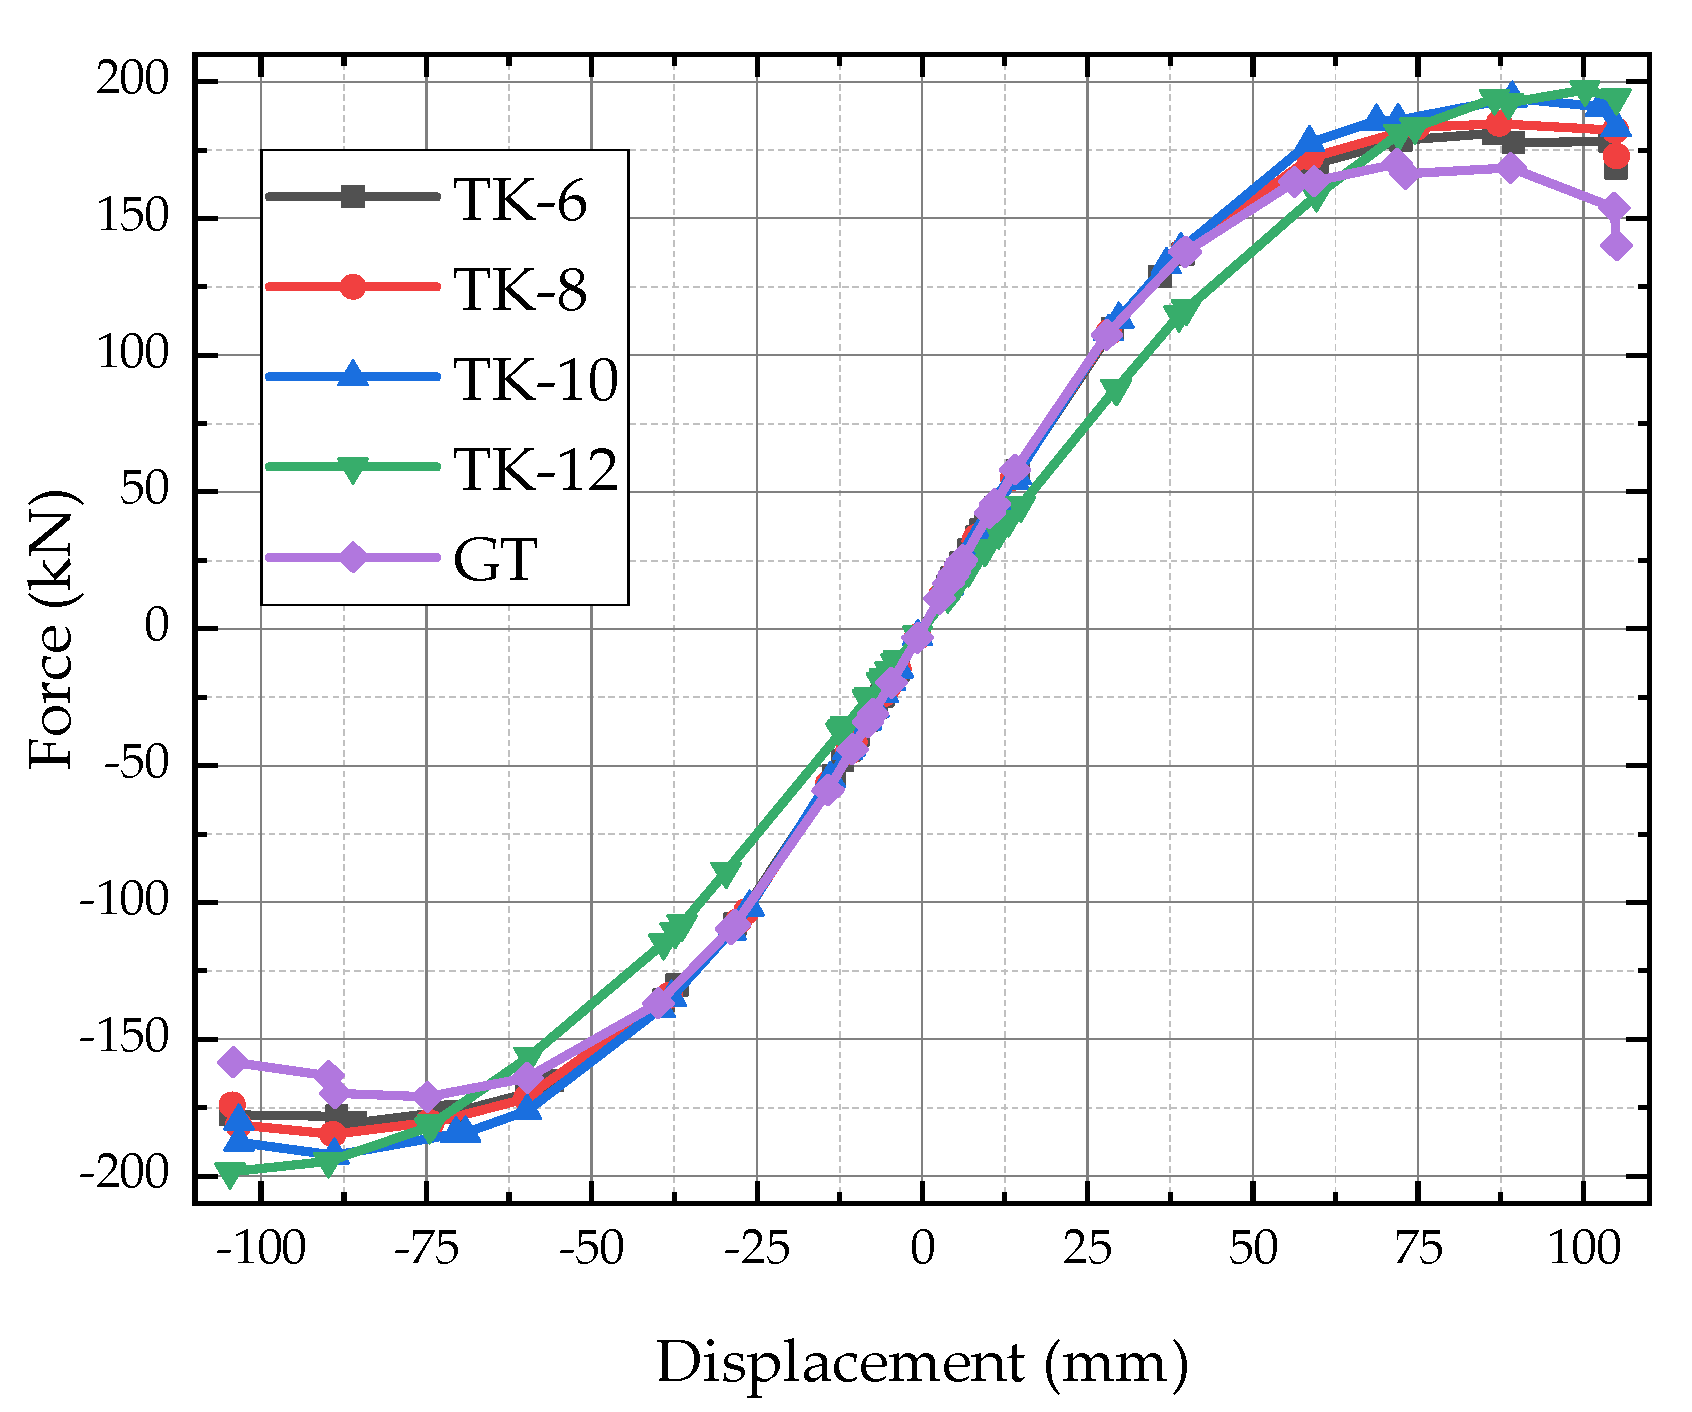
4.4. Stress Cloud, Hysteresis Curve, and Skeleton Curve

Figure 24 shows the stress clouds for connectors with different thicknesses. The damage phenomenon of the ALC panel is similar for all four groups of specimens, which all appear around the beam-column joints. This is very different from the hook head bolt group, which appears around weld between bolt and angle steel. In terms of the ALC panel, the maximum stress value of 6 mm is 2.527 MPa, which is more than 5% lower than the other groups. When the displacement reaches the limit value of the elastic–plastic displacement angle 1/50 (Δ = 60 mm), the stress value of TK-6 is 1.986 MPa. Its stress is the smallest among the five groups (as shown in Table 6). It indicates that the thinner connector has more elastic deformation under seismic loading. It reduces the damage around the bolt hole and optimizes the force performance of the ALC panel.
The hysteresis curves images for GT, TK-6, TK-8, TK-10, and TK-12 are presented in Figure 25. Although their trends are basically the same, they have some differences in peak displacement and peak load. Specifically, the hysteresis curve is fuller as the thickness of the connector increases. At small displacements, the five sets of images appear to largely coincide with the thin hysteresis loops where the specimens are in the linear elastic phase. With the displacement increases, the tendency of specimen TK-6 decreases earlier than TK-8, TK-10, and TK-12, but this situation is much better than the GT group.
Figure 26 shows the relationship of the load–displacement skeleton curves for GT, TK-6, TK-8, TK-10, and TK-12. The five curves have the same variation. The peak of the image becomes more prominent as the thickness of the connector increases. TK-6 has a slight difference in its peak compared to the other groups, and its descent is relatively flat. It indicates that the different thickness connectors improve the bearing capacity and stiffness of the ALC panel steel frame, although the effect is slight.

5. Conclusions

This paper compares the external hooked bolt connector and the pendulous Z-panel connector. The following conclusions can be drawn from the tested and numerical simulations.
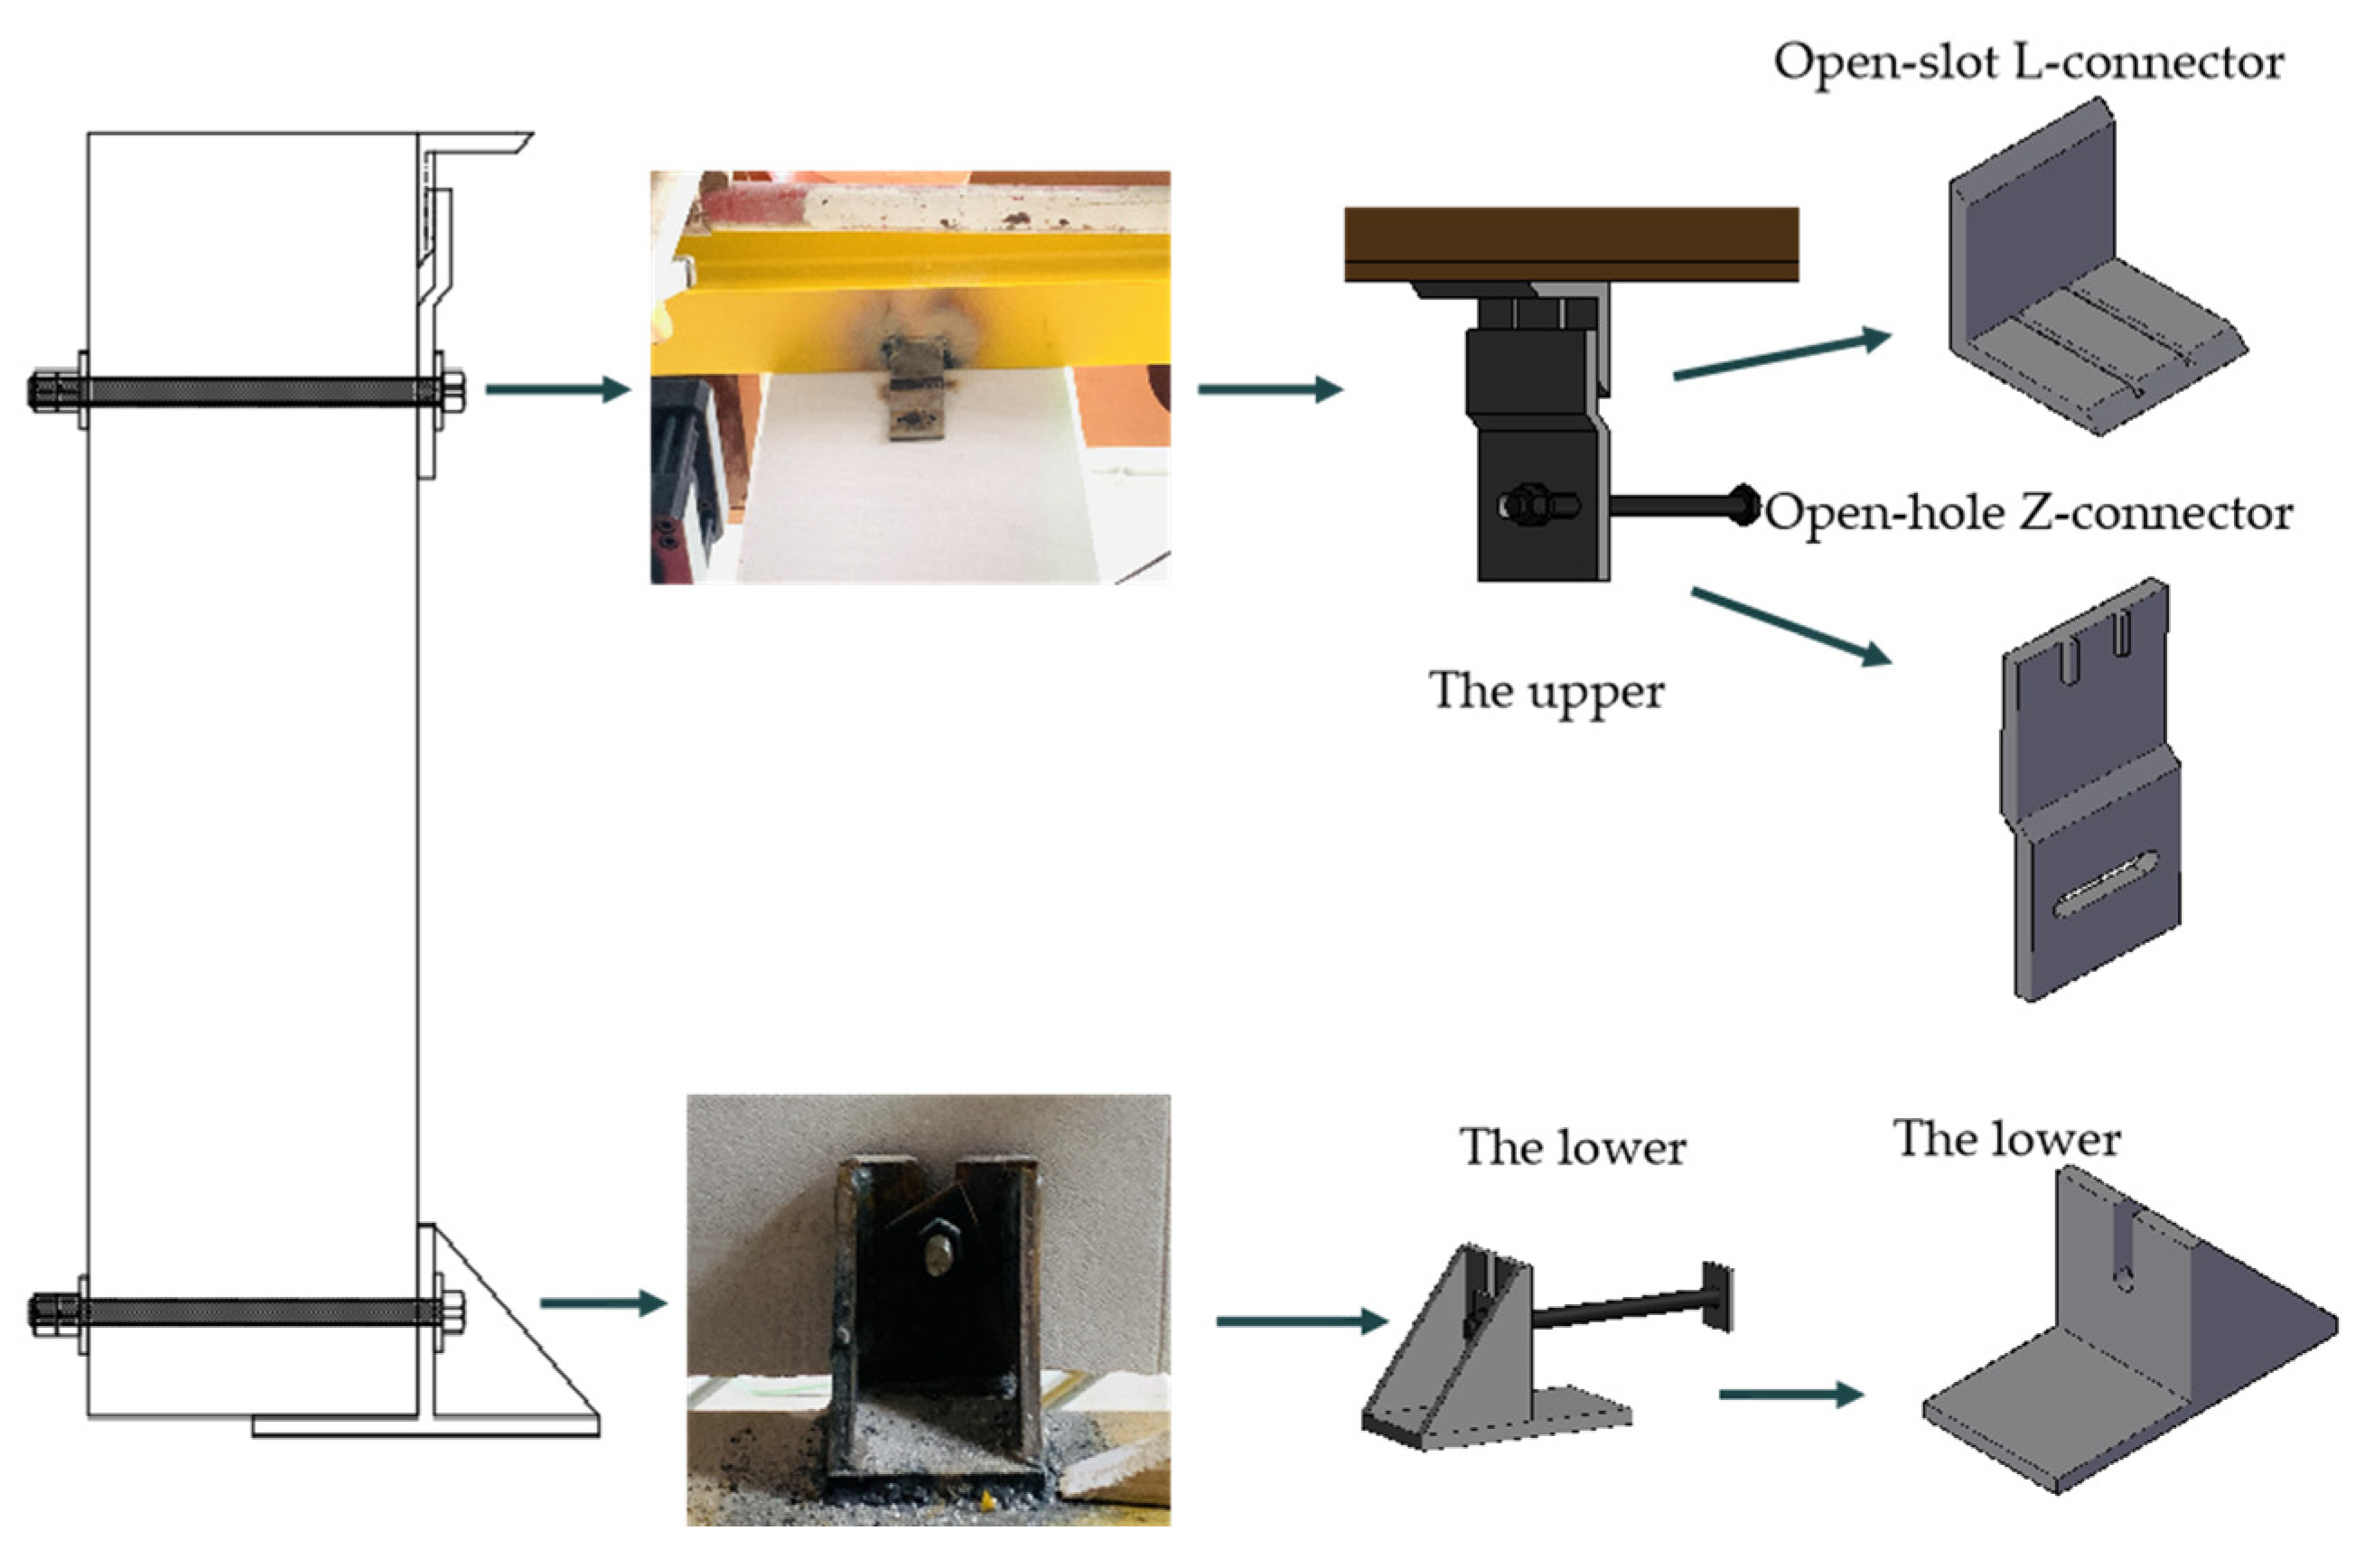
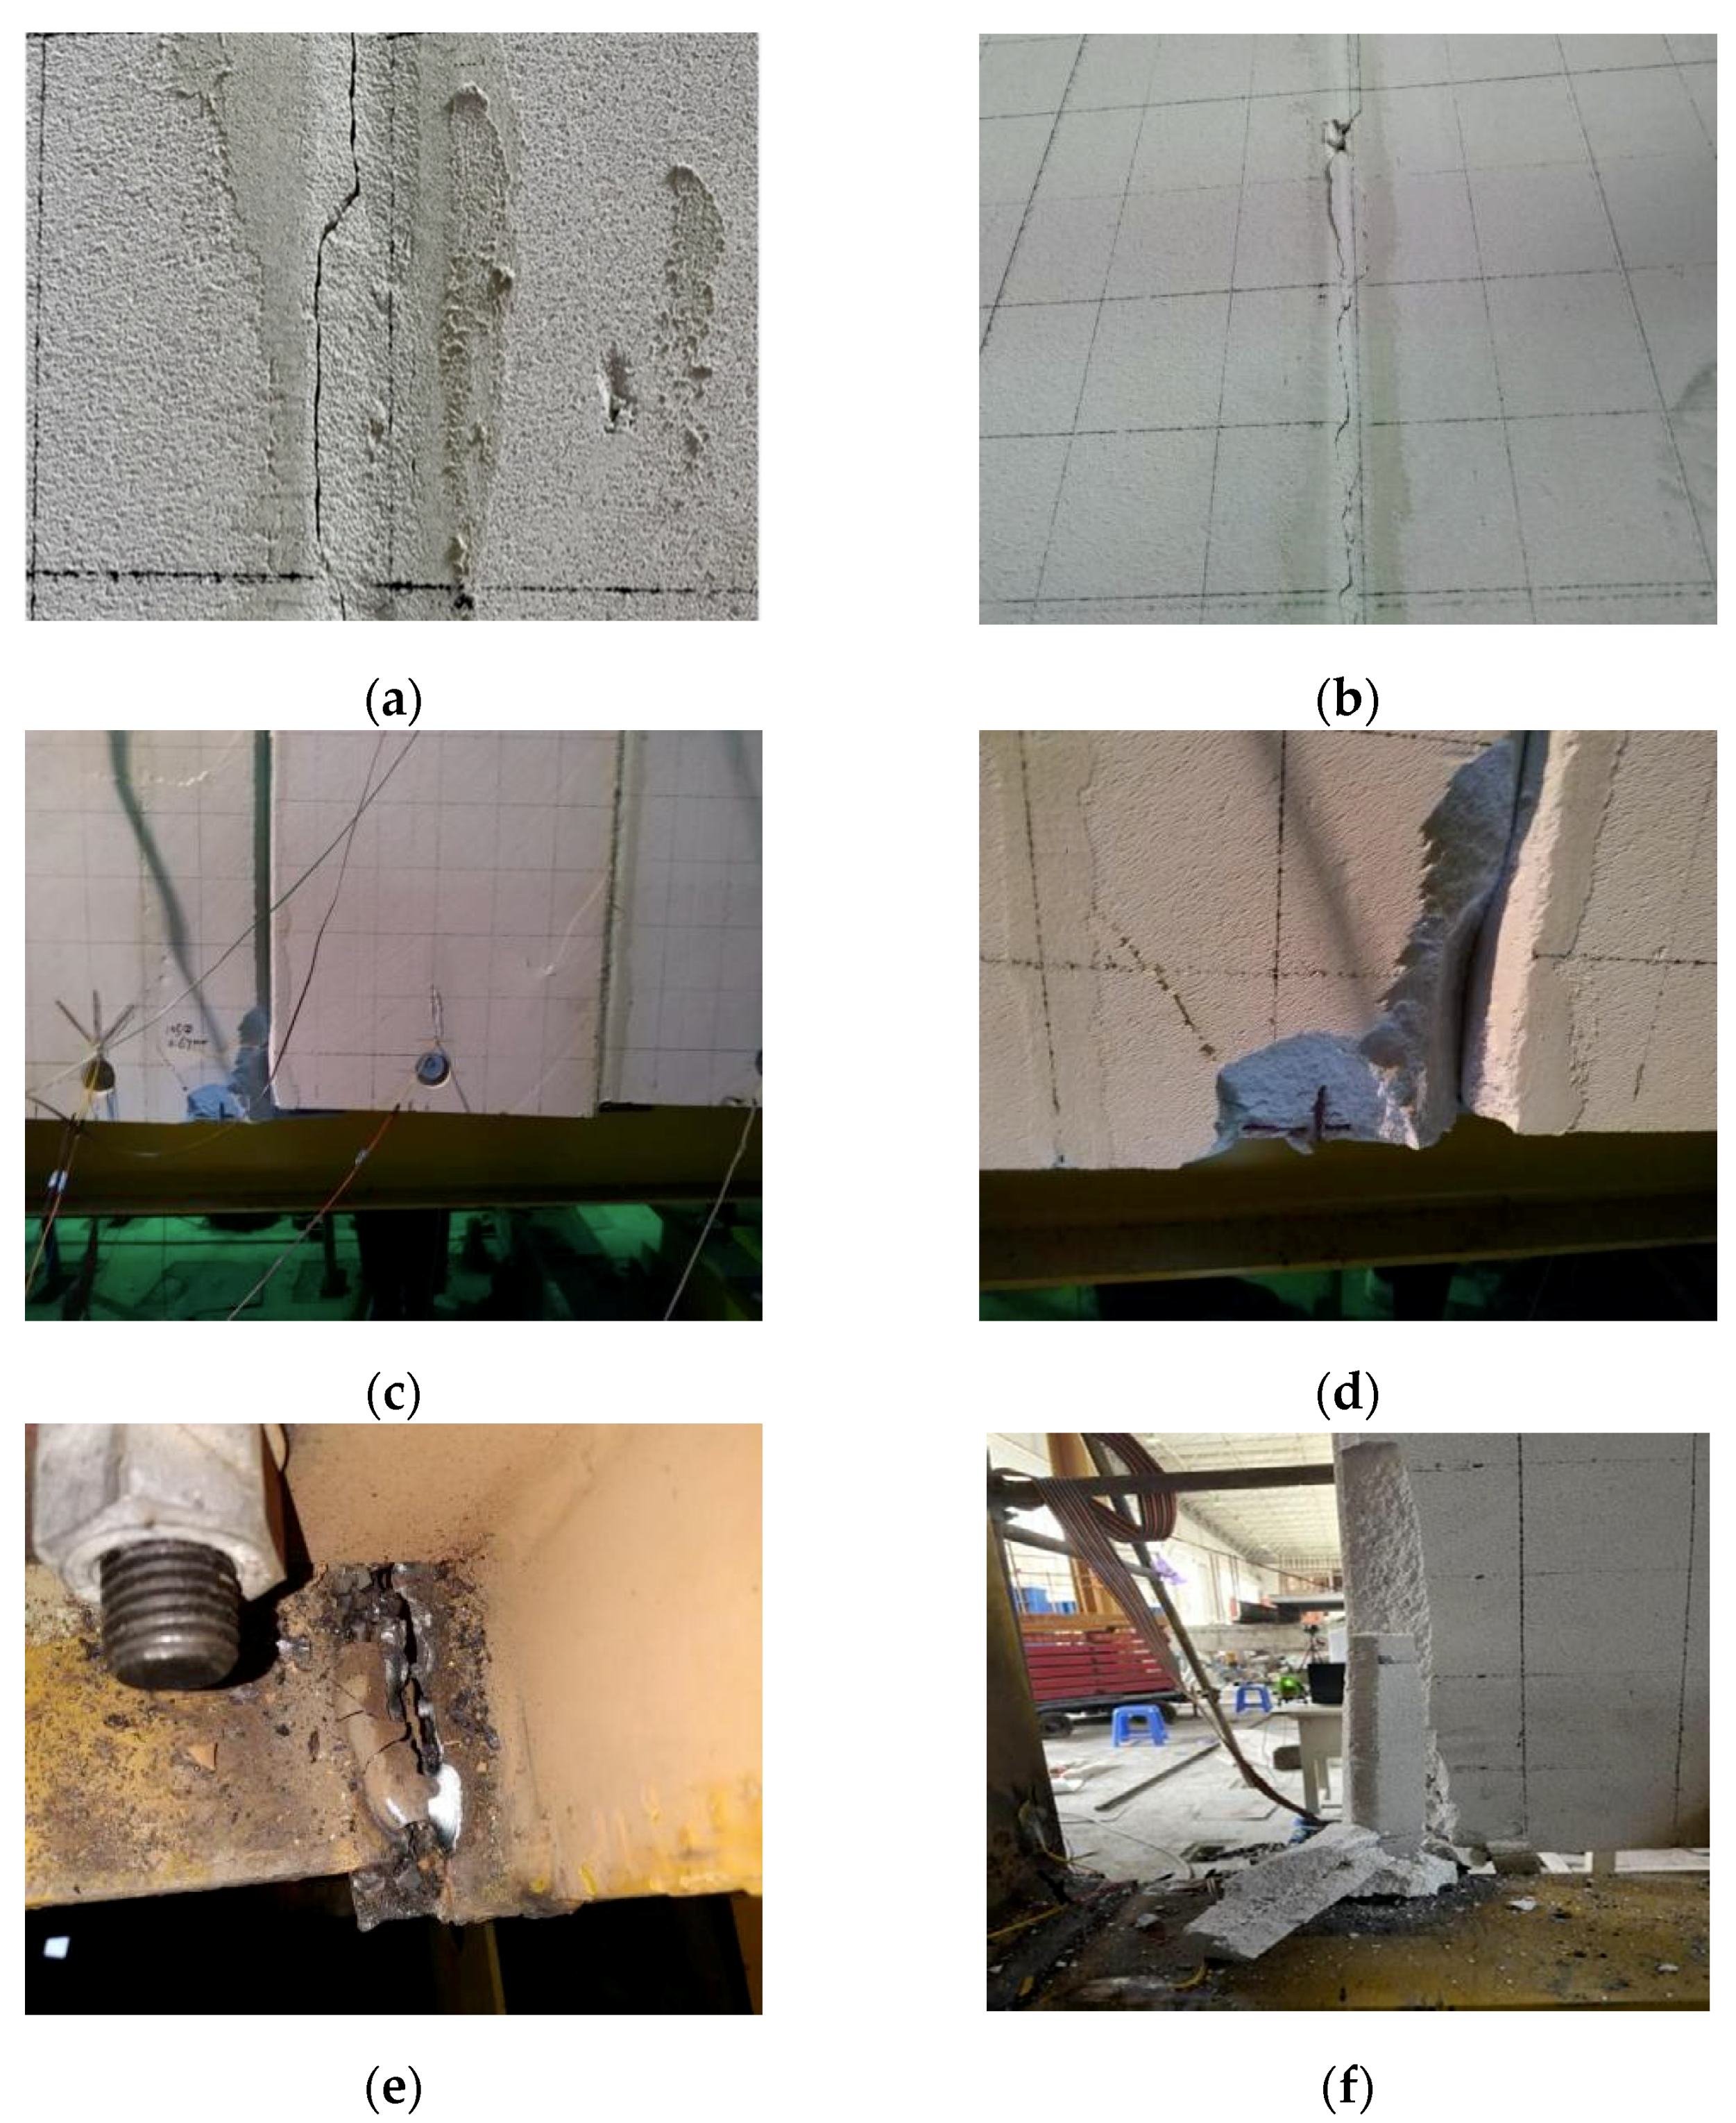
  • The damaged parts of the two groups of the external ALC panel tests are substantially different. For the FW-1 group, the damage first appears at the joints of the panels with clear penetration cracks when the displacement angle reaches 1/500 (Δ = 6 mm). For the FW-2 group, the damage first appears at the bottom span of the panel with slight cracks when the displacement angle reaches 1/200 (Δ = 15 mm). It was proved that the pendulous Z-panel connector optimizes force performance of the ALC panel steel frame, enhances energy dissipation capacity, ensures the integrity of the ALC panel, and avoids the risk of secondary instability.
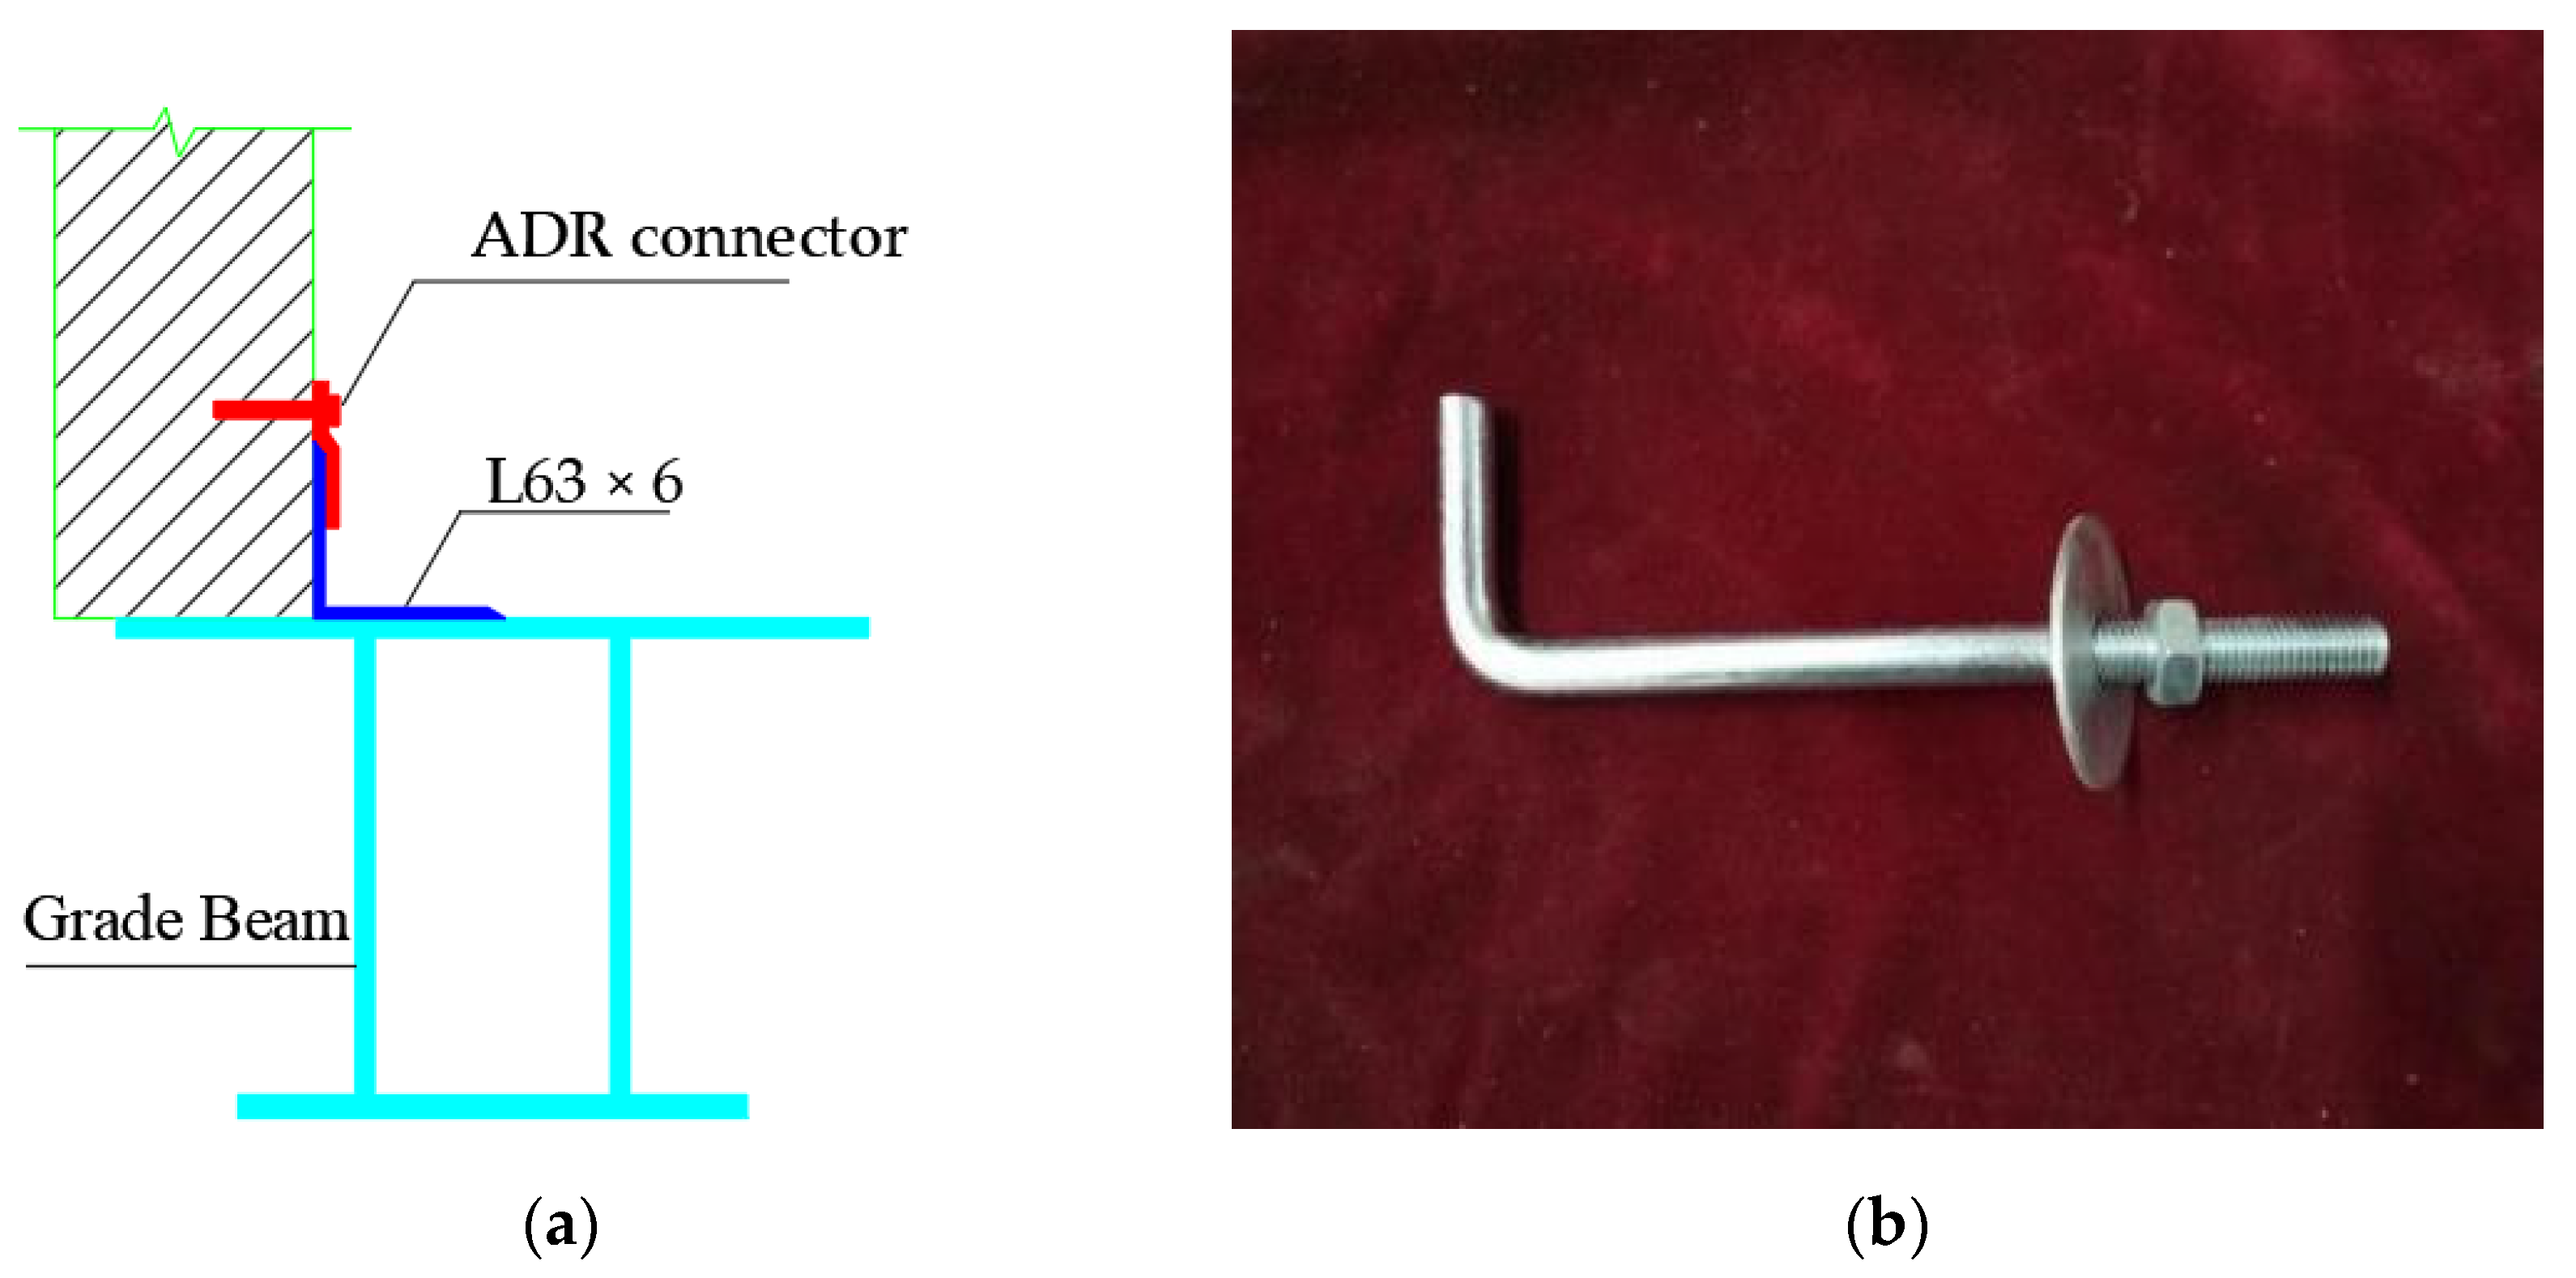
  • The pendulous Z-panel (FW-2) connector method is similar to the semi-rigid connector in terms of the skeleton curve and the stiffness degradation curve in terms of experimental phenomenon and data. The overall damage phenomenon of the pendulous Z-panel connector group is significantly delayed compared to the external hooked bolt connector group because of the bolt sliding in the top long circular hole. This setting effectively releases the lateral force at the initial loading stage, then it reduces the damage to the ALC panel by the earthquake load under unfavorable working conditions and enhances the main structure’s stability.
  • The connector is one of the significant influencing factors to ensure the stability of the external panel-framesynergistic system. Specifically, compared with FW-1, the yield load and peak load of FW-2 increase by 10.6% and 15.3%, respectively, and the yield displacement and peak displacement are increased by 12.6% and 29.9%, respectively. After reaching the peak load, the load capacity of FW-1 decreases rapidly, while the load capacity of FW-2 decreases slowly, although the initial stiffness of FW-2 is smaller. The analysis proves that this connector has good load carrying capacity and ductility.
  • The ABAQUS simulation revealed that the pendulous Z-panel connector of 6 mm has a larger load capacity and energy dissipation capacity than the external hooked bolt connector, which shows a better performance index. The TK-6 has a 7.6% decrease in load capacity compared to TK-10, and the decreasing segment is advanced. However, it has a similar change trend, and the stress around the ALC bolt hole is the smallest among the five groups. Having similar results for different thicknesses in the use of pendulous Z-panel connectors indicated that it would be more reasonable to use the 6 mm connector, which is the most economical solution for engineering.

Author Contributions

Conceptualization, K.D. and Y.L.; methodology, K.D.; software, K.D. and D.Z.; validation, Y.L.; formal analysis, D.Z.; investigation, K.D. and D.Z.; resources, K.D.; data curation, D.Z. and S.H.; writing—original draft preparation, K.D. and D.Z.; writing—review and editing, K.D. and Y.L.; visualization, D.Z.; supervision, K.D., Y.L. and W.S.; project administration, K.D. and W.S.; funding acquisition, K.D., Y.L. and W.S. All authors have read and agreed to the published version of the manuscript.

Funding

This research was funded by the University Synergy Innovation Program of Anhui Province (GXXT-2019-005).

Institutional Review Board Statement

Not applicable.

Informed Consent Statement

Not applicable.

Data Availability Statement

Not applicable.

Acknowledgments

This research was financially supported by the University Synergy Innovation Program of Anhui Province (GXXT-2019-005), the University-Industry Collaborative Education Program of the Ministry of Education (202002129042), and the Scientific Research Project of Anhui Education Department- Key Project (KJ2020A0490).

Conflicts of Interest

The authors declare no conflict of interest.

References

  1. Luo, T.; Xue, X.; Wang, Y.; Xue, W.; Tan, Y. A Systematic Overview of Prefabricated Construction Policies in China. J. Clean. Prod. 2021, 280, 124371. [Google Scholar] [CrossRef]
  2. Tam, V.W.Y.; Tam, C.M.; Zeng, S.X.; Ng, W.C.Y. Towards Adoption of Prefabrication in Construction. Build. Environ. 2007, 42, 3642–3654. [Google Scholar] [CrossRef] [Green Version]
  3. Jurczak, R.; Szmatuła, F. Evaluation of the Possibility of Replacing Fly Ash with Glass Powder in Lower-Strength Concrete Mixes. Appl. Sci. 2021, 11, 396. [Google Scholar] [CrossRef]
  4. Narayanan, N.; Ramamurthy, K. Structure and Properties of Aerated Concrete: A Review. Cem. Concr. Compos. 2000, 22, 321–329. [Google Scholar] [CrossRef]
  5. Karakurt, C.; Kurama, H.; Topçu, İ.B. Utilization of Natural Zeolite in Aerated Concrete Production. Cem. Concr. Compos. 2010, 32, 1–8. [Google Scholar] [CrossRef]
  6. Pehlivanlı, Z.O.; Uzun, İ.; Demir, İ. Mechanical and Microstructural Features of Autoclaved Aerated Concrete Reinforced with Autoclaved Polypropylene, Carbon, Basalt and Glass Fiber. Constr. Build. Mater. 2015, 96, 428–433. [Google Scholar] [CrossRef]
  7. Seddighi, F.; Pachideh, G.; Salimbahrami, S.B. A Study of Mechanical and Microstructures Properties of Autoclaved Aerated Concrete Containing Nano-Graphene. J. Build. Eng. 2021, 43, 103106. [Google Scholar] [CrossRef]
  8. Rousakis, T.; Vanian, V.; Fanaradelli, T.; Anagnostou, E. 3D FEA of Infilled RC Framed Structures Protected by Seismic Joints and FRP Jackets. Appl. Sci. 2021, 11, 6403. [Google Scholar] [CrossRef]
  9. Penna, A.; Mandirola, M.; Rota, M.; Magenes, G. Experimental Assessment of the In-Plane Lateral Capacity of Autoclaved Aerated Concrete (AAC) Masonry Walls with Flat-Truss Bed-Joint Reinforcement. Constr. Build. Mater. 2015, 82, 155–166. [Google Scholar] [CrossRef]
  10. Kałuża, M. Analysis of In-Plane Deformation of Walls Made Using AAC Blocks Strengthened by GFRP Mesh. Procedia Eng. 2017, 193, 393–400. [Google Scholar] [CrossRef]
  11. Binici, B.; Canbay, E.; Aldemir, A.; Demirel, I.O.; Uzgan, U.; Eryurtlu, Z.; Bulbul, K.; Yakut, A. Seismic Behavior and Improvement of Autoclaved Aerated Concrete Infill Walls. Eng. Struct. 2019, 193, 68–81. [Google Scholar] [CrossRef]
  12. Deng, M.; Zhang, W.; Yang, S. In-Plane Seismic Behavior of Autoclaved Aerated Concrete Block Masonry Walls Retrofitted with High Ductile Fiber-Reinforced Concrete. Eng. Struct. 2020, 219, 110854. [Google Scholar] [CrossRef]
  13. de Paula Salgado, I.; de Andrade Silva, F. Flexural Behavior of Sandwich Panels Combining Curauá Fiber-Reinforced Composite Layers and Autoclaved Aerated Concrete Core. Constr. Build. Mater. 2021, 286, 122890. [Google Scholar] [CrossRef]
  14. Arslan, M.E.; Celebi, E. An Experimental Study on Cyclic Behavior of Aerated Concrete Block Masonry Walls Retrofitted with Different Methods. Constr. Build. Mater. 2019, 200, 226–239. [Google Scholar] [CrossRef]
  15. Erdem, M.M.; Emsen, E.; Bikçe, M. Experimental and Numerical Investigation of New Flexible Connection Elements between Infill Walls-RC Frames. Constr. Build. Mater. 2021, 296, 123605. [Google Scholar] [CrossRef]
  16. Ding, K.; Liu, J.; Ren, J.; Ma, W. Dynamic Responses of Cellular Metal-Filled Steel Beam-Column Joint Under Impact Loading. J. Shanghai Jiaotong Univ. Sci. 2020, 25, 384–393. [Google Scholar] [CrossRef]
  17. Ding, K.; Han, M.; Li, X. Experimental research on seismic performance of semi-rigid bolted beam-column joints. J. Hefei Univ. Technol. 2020, 43, 805–810. (In Chinese) [Google Scholar]
  18. Ding, K.; Chen, D.; Liu, Y.; Xia, S. Theoretical and experimental study on mechanical, behavior of laminated slabs with new type joints. China Civ. Eng. J. 2015, 48, 64–69. (In Chinese) [Google Scholar]
  19. Ding, K.; Zhang, Y. Experimental study on seismic performance of fabricated bolted joint under low-cycle reciprocating loads. Results Eng. 2021, 9, 100208. [Google Scholar] [CrossRef]
  20. Ding, K.; Liu, J.; Ma, W.; Liu, Y. Experimental study on seismic performances of a new type of fabricated semi-rigid beam-to-column connection. China Civ. Eng. J. 2021, 54, 1–7, 56. [Google Scholar]
  21. Ding, K.; Ye, Y.; Ma, W. Seismic performance of precast concrete beam-column joint based on the bolt connection. Eng. Struct. 2021, 232, 111884. [Google Scholar] [CrossRef]
  22. Wang, J.; Li, B. Cyclic Testing of Square CFST Frames with ALC Panel or Block Walls. J. Constr. Steel Res. 2017, 130, 264–279. [Google Scholar] [CrossRef]
  23. Miao, Q.; Lu, Q.; Liu, H.; Yang, Y.; Zhang, Q. Research on key technology of autoclaved aerated concrete exterior wall panel system. Build. Struct. 2019, 49, 645–649. (In Chinese) [Google Scholar]
  24. PRC. Test Methods of Autoclaved Aerated Concrete GB/T 11969-2020; China Building Industry Press: Beijing, China, 2021. [Google Scholar]
  25. PRC. Metallic Materials-Tensile Testing GB/T 228.1-2010; China Building Industry Press: Beijing, China, 2011. [Google Scholar]
  26. PRC. Code for Seismic Design of Buildings GB 50011-2010; China Building Industry Press: Beijing, China, 2011. [Google Scholar]
  27. PRC. Specification for Seismic Test of Buildings JGJ/T 101-2015; China Building Industry Press: Beijing, China, 2015. [Google Scholar]
  28. Zhao, X.; Wu, M.; Kong, D.D.; Chen, S.W. Study on Finite Element Model of Infilled Walls of Steel Frames. Adv. Mater. Res. 2011, 250, 2424–2427. [Google Scholar] [CrossRef]
  29. Preti, M.; Bettini, N.; Plizzari, G. Infill Walls with Sliding Joints to Limit Infill-Frame Seismic Interaction: Large-Scale Experimental Test. J. Earthq. Eng. 2012, 16, 125–141. [Google Scholar] [CrossRef]
Figure 1. Connector schematic: (a) schematic of ADR connector; (b) schematic of external hook head bolt.
Applsci 11 10990 g001
Figure 2. Connector installation diagram.
Applsci 11 10990 g002
Figure 3. Connector installation dimension schematic (units: mm).
Applsci 11 10990 g003
Figure 4. Geometric dimension and reinforcement distribution of the Z-connector: (a) front view; (b) side view; (c) top view (units: mm).
Applsci 11 10990 g004
Figure 5. Geometric dimension and reinforcement distribution of the L-connector: (a) front view; (b) side view; (c) top view (units: mm).
Applsci 11 10990 g005
Figure 6. Geometric dimension and reinforcement distribution of the lower connector: (a) front view; (b) side view; (c) top view (units: mm).
Applsci 11 10990 g006
Figure 7. Connector installation schematic: (a) assembling steel frame; (b) positioning of the connector; (c) welding bracket plate; (d) welding connector; (e) panel lifting; (f) applying caulking mortar.
Applsci 11 10990 g007
Figure 8. ALC compression test: (a) ALC specimens; (b) electric servo universal testing machine.
Applsci 11 10990 g008
Figure 9. Steel compression test: (a) steel specimen; (b) electric servo universal testing machine.
Applsci 11 10990 g009
Figure 10. Schematic of test working conditions.
Applsci 11 10990 g010
Figure 11. Loading history.
Applsci 11 10990 g011
Figure 12. Crack pattern of specimen FW1: (a) splice mortar crack; (b) transverse crack in mortar; (c) dislocation of wall panels; (d) crack of the corner; (e) weld fracture; (f) large area of broken panel corner.
Applsci 11 10990 g012
Figure 13. Crack pattern of specimen FW-2: (a) crack in the bottom of the plane; (b) vertical cracks are produced; (c) ALC panel corner shattering; (d) slippage of connectors was obvious.
Applsci 11 10990 g013
Figure 14. Hysteresis curves of FW-1 (a) and FW-2 (b).
Applsci 11 10990 g014
Figure 15. Skeleton curves of FW-1 and FW-2.
Applsci 11 10990 g015
Figure 16. Stiffness degradation of FW-1 and FW-2.
Applsci 11 10990 g016
Figure 17. Energy dissipation of FW-1 and FW-2.
Applsci 11 10990 g017
Figure 18. Energy dissipation coefficient of FW-1 and FW-2.
Applsci 11 10990 g018
Figure 19. Idealized hysteretic relationship.
Applsci 11 10990 g019
Figure 20. Finite element model with (a) FW-1 and (b) FW-2.
Applsci 11 10990 g020
Figure 21. Stress cloud diagram of the test models: (a) FW-1; (b) FW-2.
Applsci 11 10990 g021
Figure 22. Comparison of (a) FW-1 and (b) FW-2 experiment and simulation hysteresis curve.
Applsci 11 10990 g022
Figure 23. Energy dissipation comparison of FW-1 and FW-2: (a) Energy dissipation; (b) Energy dissipation coefficient.
Applsci 11 10990 g023
Figure 24. Stress clouds images: (a) TK-6; (b) TK-8; (c) TK-10; (d)TK-12; and (e) GT.
Applsci 11 10990 g024aApplsci 11 10990 g024b
Figure 25. Hysteresis curve of FEM: (a) TK-6 and TK-10; (b) TK-8 and TK-10; (c) TK-10 and TK-12; (d) TK-10 and GT.
Applsci 11 10990 g025aApplsci 11 10990 g025b
Figure 26. Skeleton curve of TK-6, TK-8, TK-10, TK-12, and GT.
Applsci 11 10990 g026
Table 1. Material properties of autoclaved lightweight concrete.
SpecimenSpecimen
Dimension
(mm)
Cube Compressive
Strength
(MPa)
Elastic
Modulus
(GPa)
Sac1100 × 100 × 1003.89
Sac2100 × 100 × 1002.97
Sac3100 × 100 × 1003.26
Sac4100 × 100 × 1003.78
Sac5100 × 100 × 1003.96
Sac6100 × 100 × 1003.49
Average 3.56
Sae1100 × 100 × 300 1640
Sae2100 × 100 × 300 1880
Sae3100 × 100 × 300 1790
Average 1770
Table 2. Mechanical properties of steel.
SpecimenSectional Dimension
(mm)
Thickness
(mm)
Yield Stress
(N/mm2)
Ultimate Stress
(N/mm2)
Elongation
Steel beam flangeHM 244 × 175 × 7 × 1111263.4401.625.2%
Steel beam webHM 244 × 175 × 7 × 117275.3411.322.3%
Steel column flangeHW 200 × 200 × 8 × 1212289.5435.424.7%
Steel column webHW 200 × 200 × 8 × 128278.2409.820.8%
Q345 10376.6510.119.6%
Table 3. Characteristic values on hysteresis curves.
SpecimenYielding PointUltimate Point
Py,t
(kN)
Δy,t
(mm)
Pm,t
(kN)
Δm,t
(mm)
FW-1137.6551.75169.1968.58
FW-2152.3158.32195.1589.13
Table 4. Material properties.
Material TypeDensity
(t/mm3)
Elastic Modulus
(MPa)
Poisson’s Ratio
SteelQ235B7.89 × 10−9200,0000.3
Q345B7.89 × 10−9206,0000.3
ALC 5 × 10−1017700.2
Table 5. Simulation connector type.
Component NumberTypeFeatures
GTTraditional connectors6 mm
TK-6Fabricated new connectors6 mm
TK-8Fabricated new connectors8 mm
TK-10Fabricated new connectors10 mm
TK-12Fabricated new connectors12 mm
Table 6. ALC panel bolt hole stress.
SpecimenCharacteristic PointMaximum Point
Displacement
(mm)
Mises Stress
(MPa)
Displacement
(mm)
Mises Stress
(MPa)
TK-6601.986105.002.527
TK-8602.076105.002.785
TK-10602.042105.002.612
TK-12602.174105.002.659
GT604.018−105.005.133
Publisher’s Note: MDPI stays neutral with regard to jurisdictional claims in published maps and institutional affiliations.

