Review

Review on Early Warning Methods for Rockbursts in Tunnel Engineering Based on Microseismic Monitoring

1
School of Resources and Civil Engineering, Northeastern University, Shenyang 110819, China
2
State Key Laboratory of Coastal and Offshore Engineering, Dalian University of Technology, Dalian 116024, China
*
Author to whom correspondence should be addressed.
Appl. Sci. 2021, 11(22), 10965; https://doi.org/10.3390/app112210965
Submission received: 18 October 2021 / Revised: 11 November 2021 / Accepted: 17 November 2021 / Published: 19 November 2021
(This article belongs to the Special Issue Tunneling and Underground Engineering: From Theories to Practices)

Abstract

:
Due to the different geological conditions and construction methods associated with different projects, rockbursts in deep-buried tunnels often present different precursor characteristics, bringing major challenges to the early warning of rockbursts. To adapt to the complexity of engineering, it is necessary to review the latest advancements in rockburst early warning and to discuss general early warning methods. In this article, first, microseismic monitoring and localization methods applicable under tunneling construction are reviewed. Based on the latest engineering examples and research progress, the microseismic evolution characteristics of the rockburst formation process are summarized, and the formation process and mechanism of structure-type and delayed rockbursts are analyzed. The different methods for predicting the risk and level of rockbursts using microseismic indices are reviewed, and the implementation methods and application cases for predicting potential rockburst areas and rockburst probability based on a mechanical model are expounded. Finally, combined with the new practice in early warning methods, development directions for the early warning of rockbursts are put forward.

1. Introduction

With the development of infrastructure construction in China, an increasing number of deep-buried tunnel projects is being implemented in the transportation, water conservation, and other engineering fields. Under the influence of high ground stress, the construction of deep-buried tunnels is associated with high engineering safety risks, particularly from rockbursts induced by excavation. A rockburst is a dynamic disaster in which the accumulated elastic strain energy is suddenly released under the action of high ground stress and surrounding rock excavation or other external disturbances, resulting in the spontaneous burst and ejection of rocks [1,2]. Rockbursts have been reported in several tunnel projects such as the Neelum–Jhelum Hydroelectric Project (Pakistan), Kamchik Tunnel (Uzbekistan), Jinping II Hydropower Station (China), Micangshan Tunnel, Erlangshan Tunnel of Sichuan Tibet Highway, and Qinling Railway Tunnel [3,4,5,6].
Because of their sudden and highly destructive characteristics, rockbursts seriously threaten the safety of construction personnel and equipment, bringing unprecedented challenges to engineering construction. Accurate prediction or early warning and corresponding preventive measures can help ensure the safe construction and long-term stable operation of tunneling and other related engineering projects. Therefore, the prediction and early warning of rockbursts is an important research direction.
In the survey and design stage of a project, the division of engineering geological rock assemblage and stress concentration are clearly defined through drilling, geophysical exploration, and mechanical experiments. Based on prior knowledge of the relationship between rock physical and mechanical parameters, stress state, and rockburst level and risk, the rockburst trend can be predicted and evaluated, providing a basis for engineering design. Different criteria for evaluating the rockburst tendency have been established on the basis of various rockburst theories and prior knowledge, mainly including the stress concentration factor (the ratio of the maximum tangential stress to the uniaxial compressive strength of the surrounding rock: σ θ / σ c ), the rock brittleness index (the ratio of the uniaxial compressive strength to the tensile strength of the rock: σ c / σ t ), and the elastic energy index [7,8,9]. On this basis, considering the factors influencing the rockburst tendency (such as the stress, lithology, geological structure, and construction scheme) and with the help of mathematical methods and tools (such as intelligent algorithms, numerical simulation methods, fractal theory, and nonlinear chaos theory), there has been a gradual shift in research, i.e., from the use of rockburst tendency criteria to rockburst trend prediction of engineering rock masses. However, limited by the fineness of survey data, the prediction of the rockburst trend is associated with fuzziness and limitations.
In the construction stage, with the refinement of data pertaining to the geological conditions and stress state, the precision and accuracy of rockburst trend prediction have been significantly improved. However, for projects with a high risk of strong and extremely strong rockbursts, predicting the rockburst trend alone cannot meet the requirements of dynamic early warning. Therefore, it is necessary to utilize all the available types of monitoring instruments and equipment to monitor rockbursts in real time. On-site real-time monitoring methods include the pressure method, photoelastic method, resistivity method, electromagnetic radiation method, and microseismic monitoring method. Microseismic monitoring has been under development since the 1960s, drawing lessons from the rock mass structure monitoring and analysis technology based on geophysical methods. It has been widely used in mining, petroleum, large-scale structural stability monitoring, and other fields. Compared with conventional methods, such as stress monitoring [10] and displacement monitoring, microseismic monitoring has the advantages of real-time and regional performance, and is more suitable for monitoring the stability of brittle rock masses and structures.
The monitoring and early warning of rockbursts can be realized in principle owing to the following three reasons [11]:
(1)
Although a rockburst is related to the regional stress field, it mainly depends on the local inhomogeneity of the rock mass (faults, joints, weak zones, and other defects). For underground engineering construction, the geological conditions within the scope of on-site construction are generally investigated in detail before construction, which has important reference value for the early warning of rockbursts.
(2)
Rockburst is a gradual failure process of brittle media from local damage to a macroscopic abrupt change, with evident microfailure precursors. The rockburst precursor area is limited and can be effectively covered by monitoring methods.
(3)
A rockburst has a short formation period and is evidently disturbed by construction. The short-period repeated rockburst activities in tunnel engineering provide conditions for mastering the law of rockbursts.
In the process of a rockburst, microseismicity shows evident evolution characteristics from disorder to order. Tang et al. [11] first applied the microseismic monitoring method for the early warning of rockbursts in the diversion tunnel of the Jinping II Hydropower Station, and the early warning results have been widely recognized. Sun et al. [12] studied the failure mode of a circular tunnel under unloading condition through numerical experiments. They showed that, with the increase in the ground stress, the acoustic emission (AE) and crack propagation exhibited an evident evolution trend. Yu et al. [13] systematically studied the relationship between rockburst and microseismicity in the Jinping II Hydropower Station, and observed that the distribution area of high energy density in the surrounding rock is consistent with the high-risk area of rockbursts. Ma et al. [14] reported the occurrence of a rockburst, recording approximately 40 microtremors in two minutes, the distribution of which was consistent with the direction of the structural plane obtained by the on-the-spot investigation. In recent years, early warning methods based on microseismic monitoring have produced promising results and successful predictions, such as for the Access Tunnel of Shuangjiangkou Hydropower Station, Sichuan–Tibet Railway Tunnel, and Hanjiang-to-Weihe River Diversion Project [15,16,17].
In summary, the use of microseismic information as a precursory for rockbursts is fully supported by theory and verified practically. Microseismic monitoring has gradually become an important monitoring means for the early warning of rockbursts in tunnel engineering.

2. Microseismic Monitoring Method under Tunnel Construction

2.1. Principle of Microseismic System

Under the action of stress redistribution due to excavation disturbance, the microfractures in the surrounding rock release energy to the surroundings in the form of elastic waves. The microseismic monitoring system collects the elastic waveforms released by the fracture of the rock mass in the monitoring range through the sensor array arranged behind the working face of the tunnel or near the key monitoring area. The signal type is identified on the basis of the waveform characteristics, and the interference signal is eliminated. In the process of rock fracture, both primary waves (P-wave, which is a transverse wave) and secondary waves (S-wave, which is longitudinal wave) are generated at the source. The P- and S-waves naturally separate as they travel at different speeds. The P- and S-wave arrival times for different channels are picked, and the source location is realized by the time difference and other information. Finally, the source parameters such as energy and magnitude are solved. Figure 1 shows the flow of the microseismic signal acquisition and data processing system.

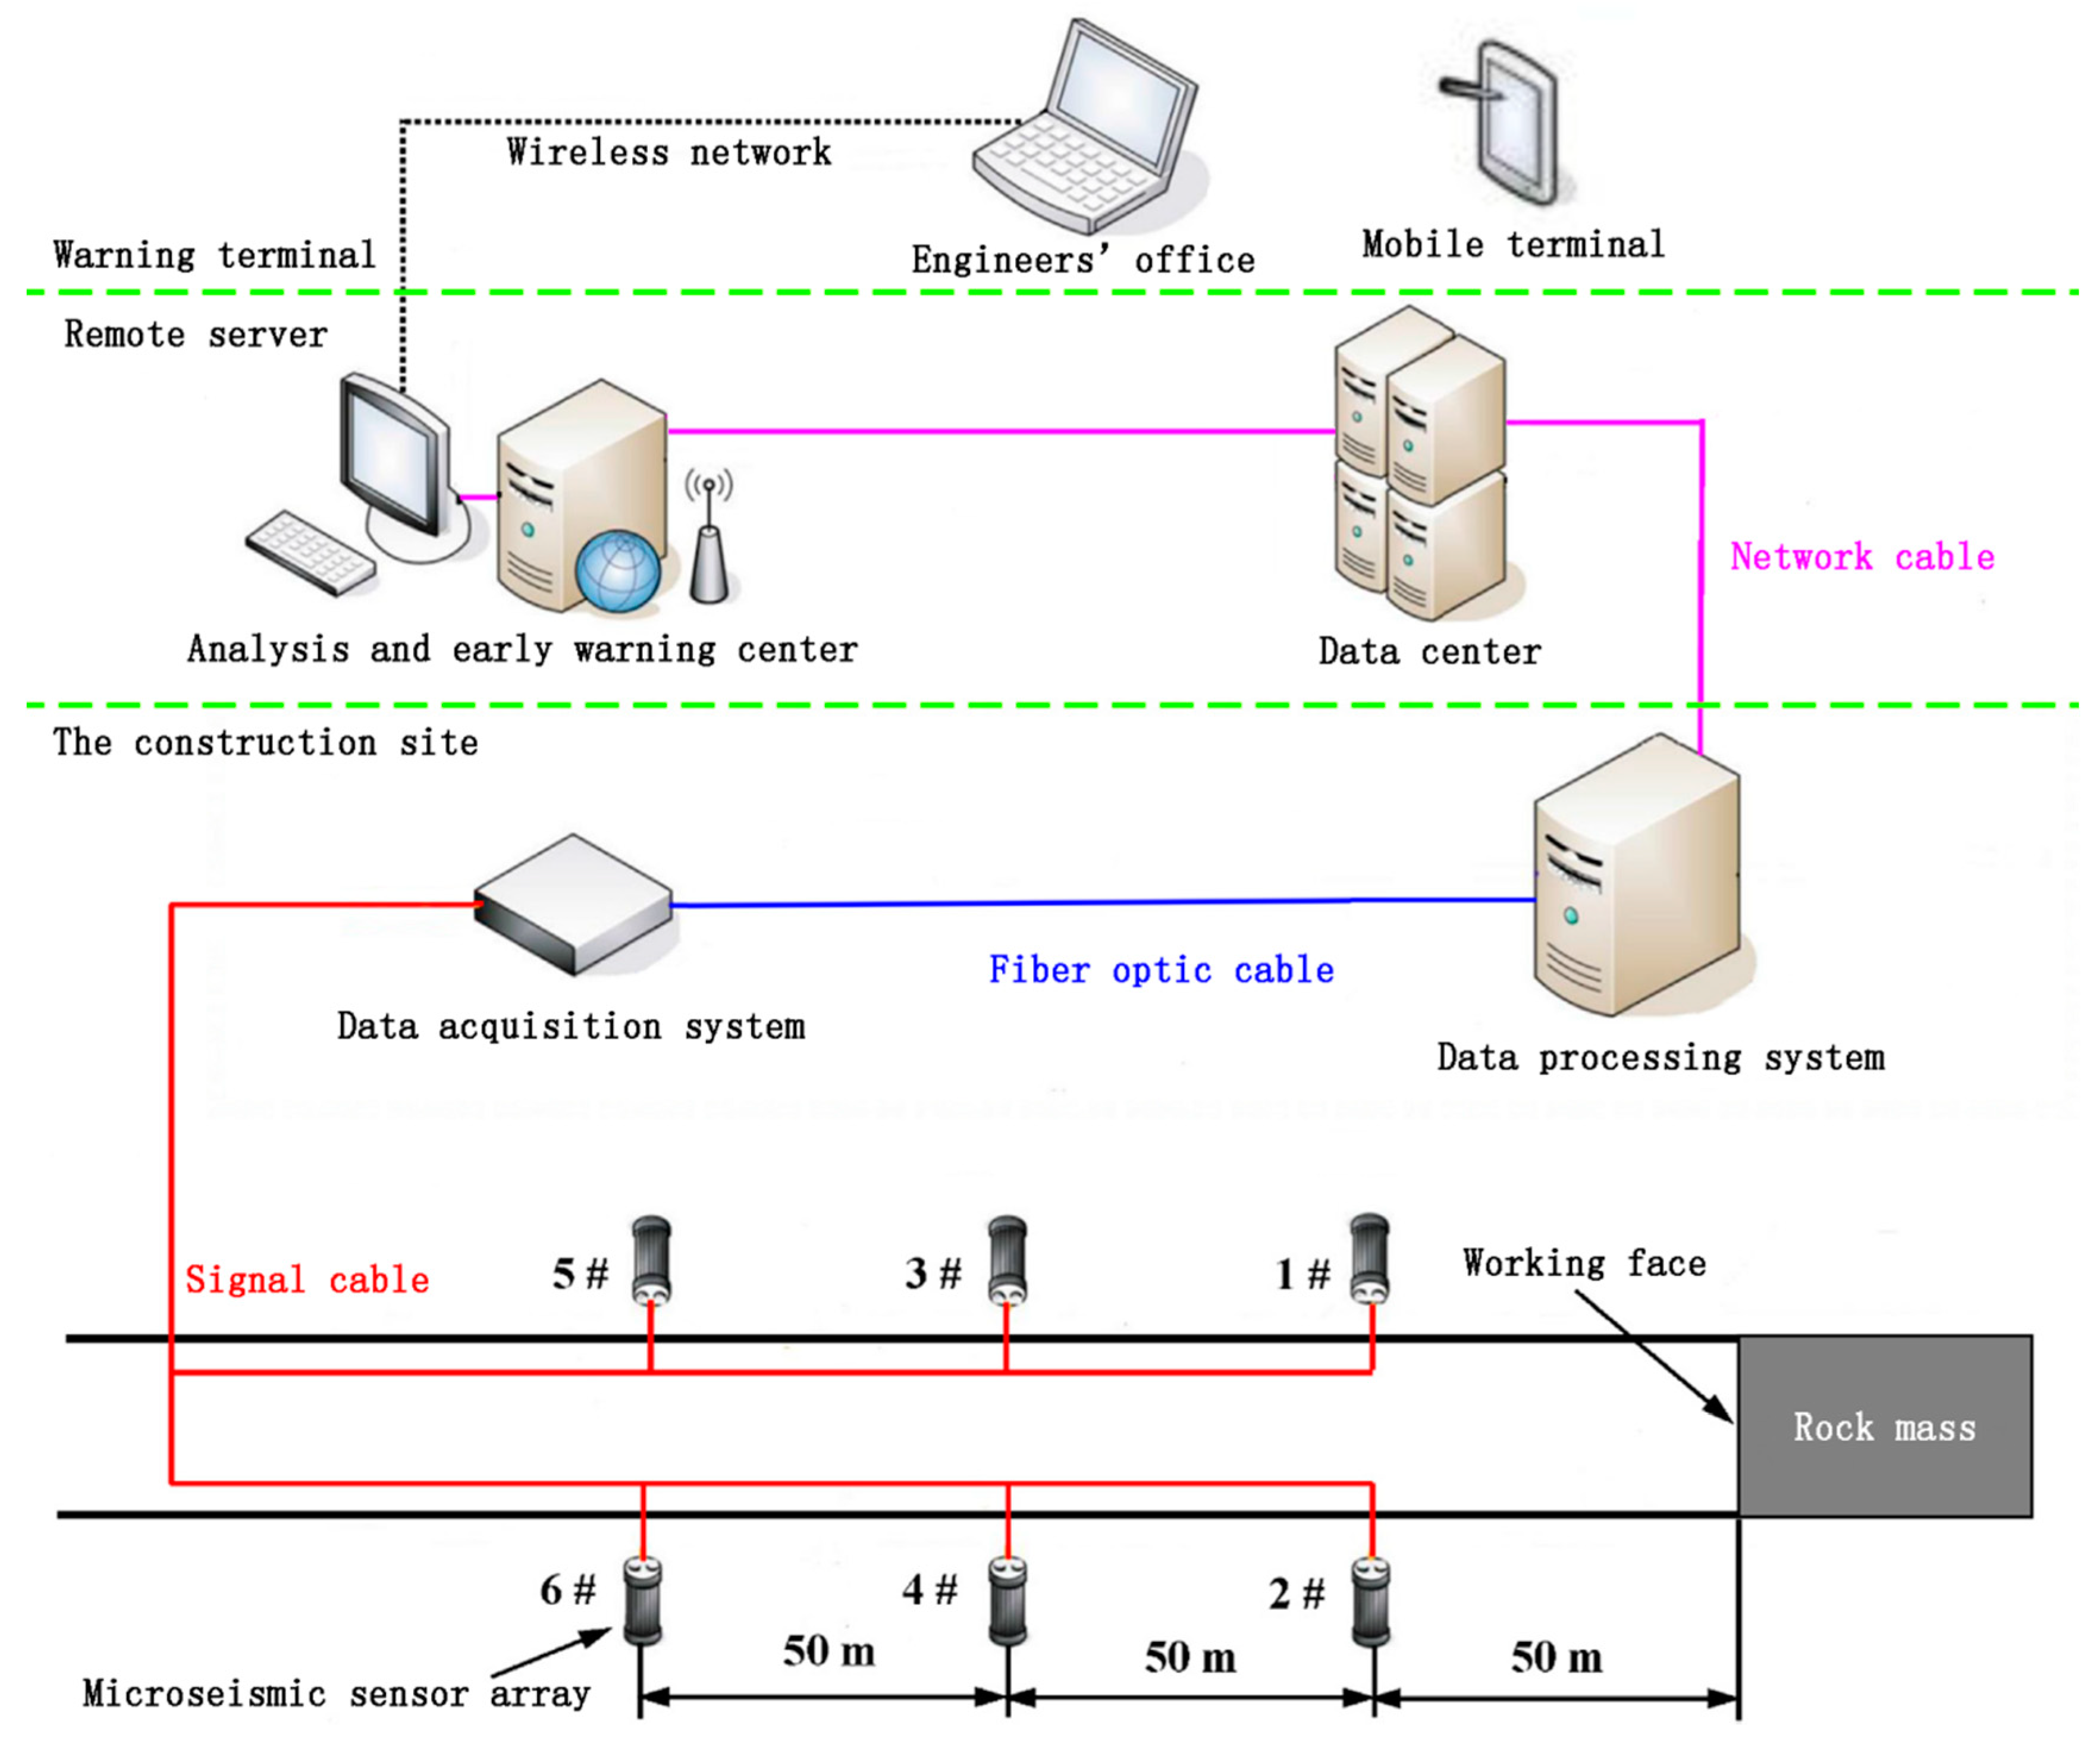
2.2. Installation of Monitoring System

Figure 2 shows the typical topology of the microseismic monitoring system employed in a tunneling environment. The disturbance of tunnel excavation is monitored continuously for 24 h using a sensor array installed near the working face. The microseismic signal received by the sensor is converted into an analog signal, which is transmitted to the data acquisition system through the signal cable and then converted into a digital signal by the A/D converter built into the data acquisition system (the sampling rate is at least 5 kHz from experience). To ensure a reliable long-distance transmission, a fiber optic cable is used to transmit the signal to the data processing system. Based on the recorded signals, the data processing system solves the information, such as the location and source parameters of the microseisms, and uploads the processed microseismic data to the remote server simultaneously. The analysis and early warning center obtain the precursory information of rockbursts by thoroughly analyzing the spatial distribution law of the microseismic events and the evolution law of the focal parameter information. The stability state of the rock mass is then evaluated. Finally, the analysis and early warning center sends the analysis and early warning results to the engineers’ office and transmits them to a mobile terminal (this should be done at least once a day).
The sensor arrangement significantly influences the monitoring effect and the stable operation of the system. In the tunnel driving environment, the microseismic sensors are typically arranged on the tunnel walls on both sides behind the working face, and the distance along the tunnel axis ranges from 30 m to 50 m. To consider the monitoring accuracy of the sensor and ensure that the transmission line is not damaged by falling rocks near the working face, the distance between the sensor array and the working face should be approximately in the range of 50–80 m. To ensure the continuous monitoring of the microfractures in the surrounding rock due to excavation and unloading of the working face, the sensor array is made to move forward once with the advance of 30–50 m. To ensure that the microseismic monitoring system has good positioning accuracy, the sensor should not be installed in the same plane. While laying the signal line of the sensor, breaking should be prevented. To avoid the interaction between microseismic monitoring equipment and the tunnel boring machine (TBM), it is recommended that all microseismic monitoring equipment be installed on the tunnel wall and completely separated from the TBM. This can effectively reduce the damage rate of sensors and cables and improve the stability of the system.

2.3. Classification of Microseismic Signals

The monitoring environment around an engineering rock mass is complex and dynamic, and the microseismic system can record signals from different sources, including the microfracture signal, rockburst signal, blast signal, and noise (e.g., drilling noise, construction background, and electromagnetic interference), as shown in Figure 3. In rockburst warning, the focus is on microfracture signal. Typically, it has a clear wave head and a decaying wave tail, and the frequency domain peak is typically between 50 and 500 Hz. However, in engineering construction, the waveform of the microfracture signal and noise are often similar or intertwined. The focus of the microseismic signal analysis and research is to accurately distinguish microseismic signals and eliminate interference signals. Scholars have conducted considerable research on the classification of microseismic signals.
Conventional methods use characteristic parameters as the basis for classification, which can be the characteristics of the original signal in the time and frequency domains, such as the dominant frequency, amplitude, and duration, and can also be source parameters, such as the magnitude, energy, and corner frequency. For example, Zhao and Gross [18] extracted 16 features from 71 features in the time and frequency domains and introduced them into a support vector machine to establish a classification model to distinguish noise events from microseismic events. Yıldırım et al. [19] employed the peak amplitude ratio (S/P ratio) and the complexity value as input parameters and inputted them to feedforward neural networks (FFNNs), adaptive neural fuzzy inference systems (ANFIS), and probabilistic neural networks (PNNs) to discriminate between earthquakes and quarry blasts. Shang et al. [20] used the principal component analysis to convert source parameters into unrelated variables and inputted them to an artificial neural network to classify microtremors and explosions. Dong et al. [21] used five source parameters and probability density functions related to the blasting time as classification indicators. They used the Fisher classifier, naive Bayesian classifier, and logistic regression as classifiers to distinguish blasts and events. This type of method is simple and flexible, requires fewer training samples, and can be deployed quickly. However, it relies heavily on the artificial selection of the characteristic parameters, and the classification results are typically dichotomies, making it difficult to cope with the complex engineering monitoring environment.
In recent years, the development of deep learning has provided a new idea for the classification of microseismic signals. Bi et al. [22] combined a deep convolution neural network (DCNN) and support vector machine (SVM) to extract features from multichannel waveforms and classify them. Based on the time–frequency analysis of typical microseismic signals obtained from the Hanjiang-to-Weihe River Diversion Project, Tang et al. [23] proposed a convolutional neural network (CNN) model for tunnel microseismic signal recognition based on the depth space and channel information, which is used to identify and classify complex signals. Peng et al. [24] treated the original signal as the characteristic matrix as the input, trained a CNN with 35 layers on 20,000 samples, and classified the microseismic signals as microseismic events, blasting, ore extraction, mechanical noise, and electromagnetic interference. These studies used the supervised learning method, with a large number of samples for training, through self-learning to identify the depth characteristics of the original signal. The prediction accuracy and robustness of this method are superior to those of conventional methods. However, the method of supervised learning requires a large number of labeling samples. With the changes in the engineering environment, the accuracy of deep learning method may decrease. To overcome these shortcomings, future microseismic signal classification research should focus on semi-supervised learning, unsupervised learning, and transfer learning.

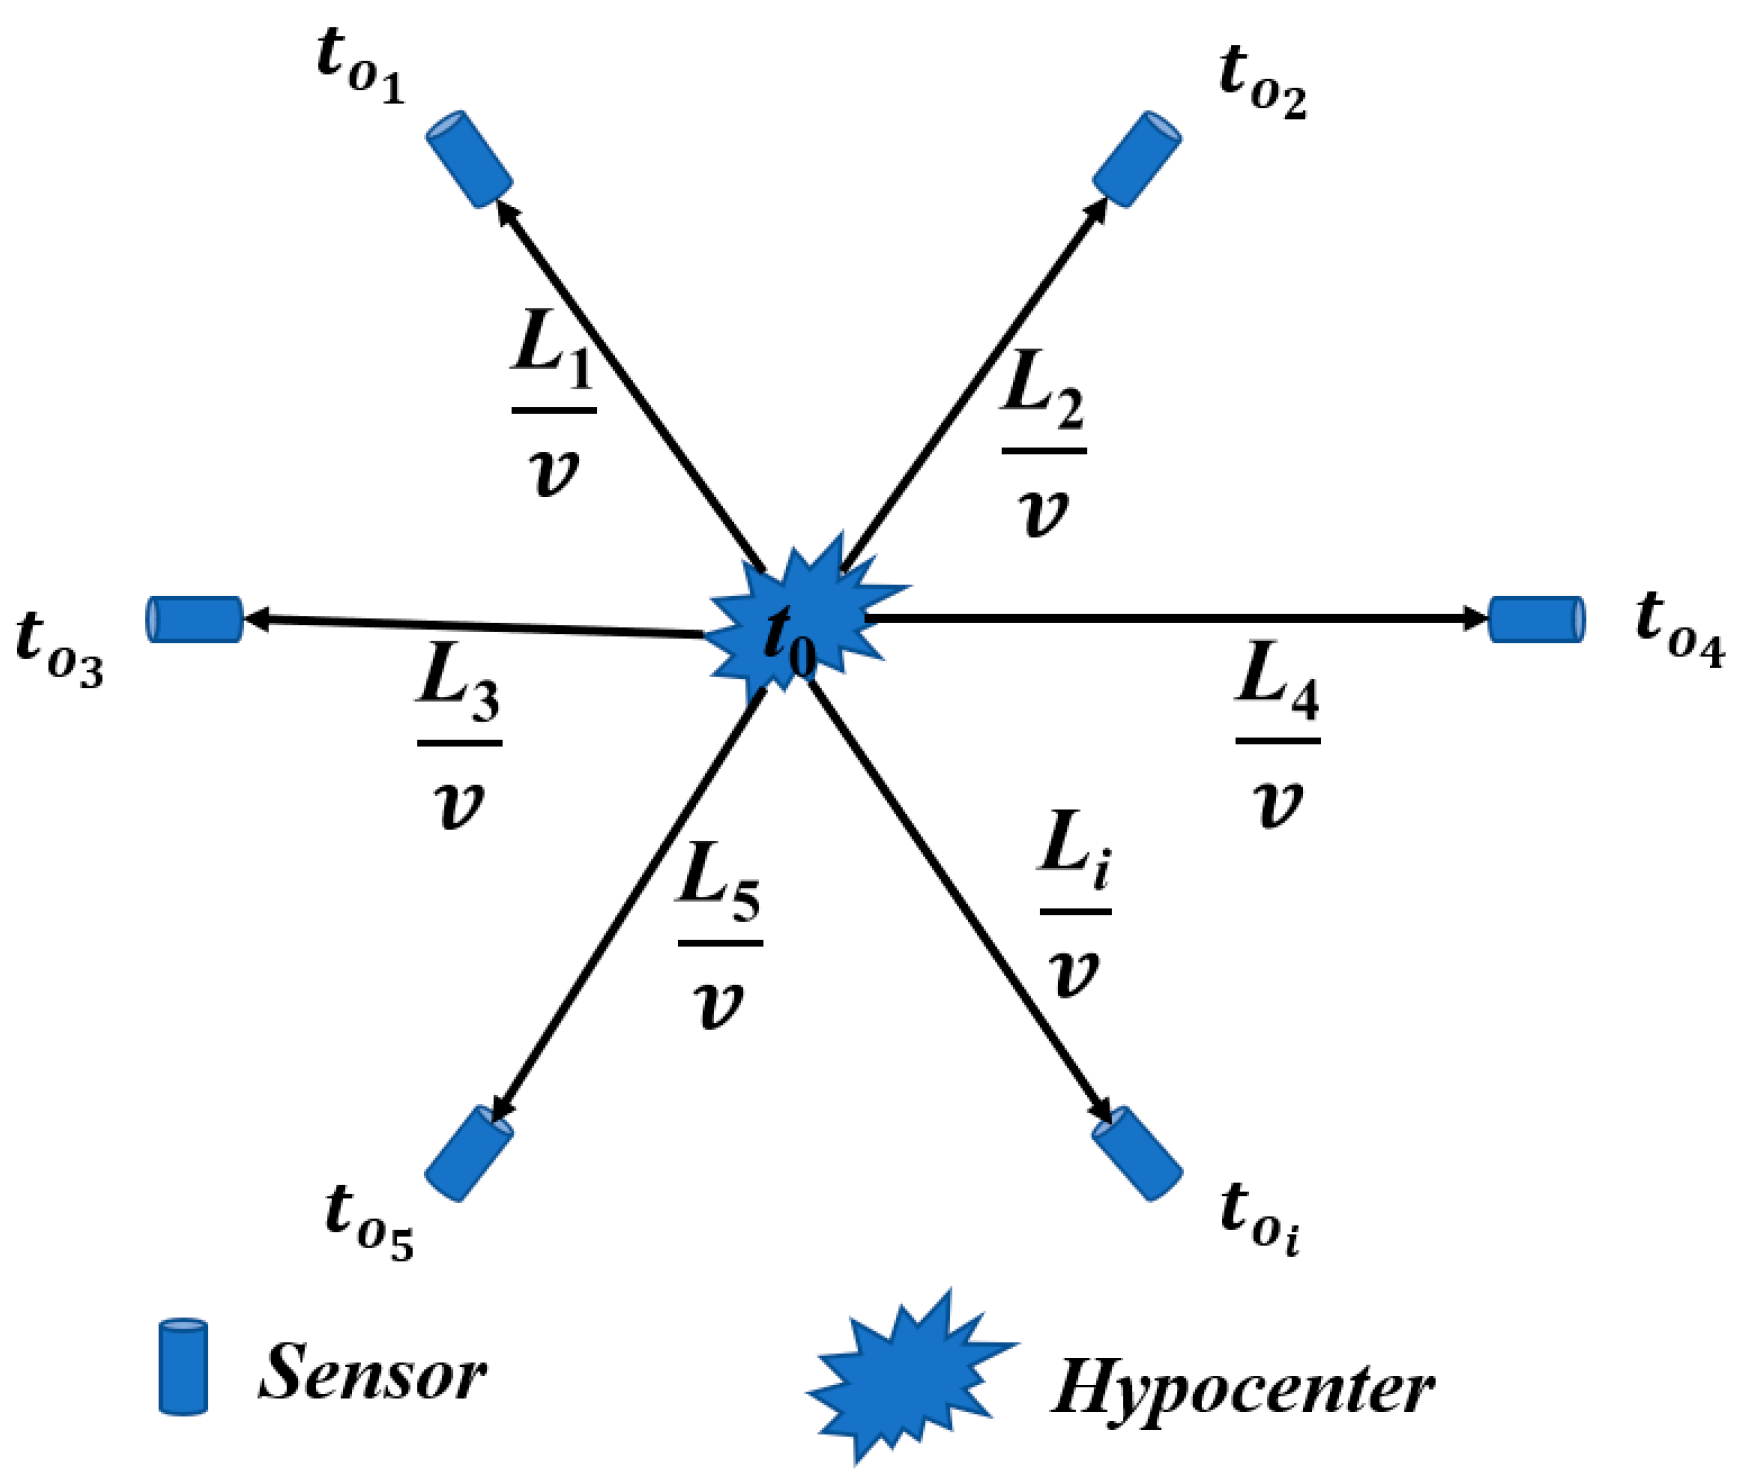
2.4. Microseismic Location Detection Technology

The microseismic location is the core link of microseismic monitoring technology, and the result of source solution is obtained from the microseismic location, which is related to the accuracy of microseismic monitoring and analysis. Research on more accurately determining the microseismic location has been a hotspot in the field of microseismic monitoring. The typical methods used for locating microseismic events mainly use the arrival time of the P-wave to locate the source. However, in a tunnel construction environment, because sensors are placed in limited locations, it is often difficult to cover the entire area where microseisms occur. In this scenario, it is necessary to use the S-wave arrival time for auxiliary location. In other words, two problems should be solved in determining the location of microseisms under tunneling construction: one is the S-wave arrival picking and the other is the location detection method based on the arrival times of the P- and S-waves.
Because the arrival time of an S-wave is not evident, it is difficult to pick. Because of the lack of a suitable algorithm, the S-wave arrival typically depends on manual picking. In recent years, with the development of deep learning methods, researchers have proposed a method for picking P- and S-waves based on the deep neural network (DNN). For example, Zheng et al. [25] proposed a microseismic or AE sample pickup algorithm based on the long-short term memory (LSTM) network. Their results showed a high picking accuracy and robustness under different signal-to-noise ratios. The arrival time selection method proposed by Zhu and Beroza [26] employs a three-component seismic waveform as input, uses a DNN based on U-net, and simultaneously predicts the probability distributions of P-arrival, S-arrival, and noise. Ross et al. (2018) [27] trained a CNN to estimate P-wave arrival times and first-motion polarities. The performance of the trained network was found to be on par with those of expert seismologists. The research results show that because of the higher accuracy of the picking results, the picking methods based on deep learning will replace conventional algorithms and become the mainstream in research and application.
Based on different design ideas, researchers have proposed various of positioning methods. One of the classical methods is to establish an optimization function based on the residual vector formed by the difference between the calculated and observed arrival times of microseismic waves, and to solve the test source to minimize the optimization function, that is, the result of microseismic location (shown in Figure 4). The i th calculated arrival time t c i is estimated by the wave velocity and hypothetical source coordinates, which is expressed as:
t c i = L i ( x 0 , y 0 , z 0 ) v + t 0
where L i is the distance from the i th observation point to the source; ( x 0 , y 0 , z 0 , t 0 ) is the coordinate of the test source; t 0 is the occurrence time of the test source; v is the wave velocity. The optimization function constructed by the L2 norm of the residual vector is expressed as follows:
Q ( x 0 , y 0 , z 0 , t 0 ) min = 1 n i = 1 n ( t o i L i ( x 0 , y 0 , z 0 ) v t 0 ) 2
where t o i is the i th observed arrival time; n is the total number of observed arrival times. For a tunnel environment, this includes not only the picked P-wave arrival time, but also the S-wave arrival time. This positioning method is simple and effective; the other positioning methods proposed can be considered as a derivative of this method.
In recent years, the methods for locating the source under tunneling and other engineering conditions have been optimized and improved, and many new results have been obtained. For example, in the method proposed by Dong et al. [28], the wave velocity is set as an unknown quantity and is used to solve the source coordinates, which is verified by AE testing and field monitoring. This method only requires the sensor coordinates and time difference, does not require pre-measuring the wave velocity, and significantly improves the applicability of positioning. However, for the straightening of the propagation path and the simplification of the propagation speed of the actual signal in the rock mass, the velocity error is high, which is different from the actual situation. Feng et al. [29] designed a piecewise velocity model along the tunnel axis and inverted the source location and cross-sectional velocity simultaneously, which significantly improved the positioning accuracy. The velocity model obtained by inversion has a good corresponding relationship with geological conditions and rockburst location. Peng et al. [30] considered the influence of the gap of the excavated tunnel on the wave propagation path and located the residual between the theoretical arrival time and the observed arrival time calculated using the fast-marching method (FMM). The test results showed that this method can locate microseismic events with a higher accuracy than that based on the single velocity model. Huang et al. [31] proposed a method to locate microseismic events based on interference imaging and cross-wavelet transform. This method does not require accurately picking the arrival time, but uses the cross-wavelet power function to obtain the difference in the arrival times of different sensors.
Different methods have their own applicable conditions. To improve the positioning accuracy, it is necessary to choose the appropriate positioning method based on the monitoring conditions, speed model, and picking accuracy. For example, if the calibration source can be generated at a specific location, such as the vault and floor by blasting, the P-wave velocity structure can be inverted, and the dynamic velocity model can be selected to determine the location. When the energy of the microseismic signal is low, or the monitoring environment noise is high, resulting in a low signal-to-noise ratio, it may not be able to ensure reliable picking time and the inversion accuracy of the velocity model. At this time, we can consider using a method that does not require the first break time or reduce the dependence on the velocity model as appropriate.

3. Microseismic Evolution Characteristics of Rockburst Formation Process

3.1. Evolution Stage of Microseismicity

The formation process of rockburst starts from the change in the stress field due to excavation unloading in the underground cavern to the re-stabilization of the surrounding rock after the rockburst, and the microseismicity in the rock mass is evidently periodic. During the unloading process of the underground cavern excavation, the surrounding rock mass microruptures to release energy under the action of high stress; therefore, the microseismic event can indirectly reflect the stress state of the rock mass. Ma et al. [14] reported statistics on the number of microseismic events occurring in the process of rockburst formation and found that the number of microseismic events has a certain regularity in the rockburst formation process. They divided the formation process of rockburst into three stages: (1) the transition period, which is the period of stress accumulation and when the number of microseismic events is relatively low; (2) the peak period, where large-scale destruction occurs in the rock mass, the high stress accumulated in the rock mass begins to release, and the number of microseismic events increases rapidly; (3) the quiet period, where a large amount of stress in the rock mass is released or transferred because of the occurrence of a rockburst. At this stage, the number of microseismic events in the rock mass is relatively low. However, in the actual monitoring process, not all the rockburst processes conform to the above evolution law. For example, when Liu et al. [17] studied the formation process of three consecutive strong rockbursts along the structural plane. They found that after the rockburst occurred, the microseismic event count continued to rise or remained at a high level, and then the next rockburst occurred. This may be because after a rockburst, the stress in the rock mass is not completely released and transferred to the rock mass in the adjacent area along the structural plane, which continues to accumulate rapidly under the influence of excavation disturbance, resulting in a large-scale failure of the rock mass.

3.2. Frequency–Domain Characteristics of Microseismic Waveforms

The analysis of microseismic data includes parameter analysis and waveform analysis. Waveform analysis can better reflect the rupture characteristics at the source. Based on the different fracture scales and research objects, microseismic monitoring or AE monitoring methods are adopted. Generally, microseisms with a low dominant frequency correspond to large-scale cracks in the engineering rock mass or large structures, and AE with a high dominant frequency corresponds to small-scale cracks in the rock in laboratory tests [32,33]. Microseism and AE are essentially elastic waves due to the microfracture of brittle materials, and they are the same in terms of their physical mechanism. Therefore, as a tool for the experimental study of rockbursts, AE monitoring can extend the meso-mechanism of the rockburst formation process to large-scale microseismic monitoring. The spectral characteristics of AE can effectively reflect the failure characteristics of macroscale structures [34]. Zhao and He [35] analyzed the characteristics of the AE spectrum in the process of granite rockburst experiment. They found that the dominant frequency value of AE had an evolution trend from low to high and then to low before a rockburst. Su et al. [36] conducted rockburst tests on granite specimens under true triaxial loading. The results showed that there was a “quiescence period” of AE before rockburst occurrence, and the sound amplitude continued to decrease. The dominant frequency of the AE signals showed a downward trend, and the spectrum distribution could be characterized by a low amplitude, wide band, and multiple peaks. He et al. [34] summarized the dynamic failure process and characteristics of limestone by simulating the rockburst process in a single-plane dynamic unloading test under true triaxial conditions. They found that as the stress increased, the AE signal gradually changed from high frequency and low amplitude to low amplitude and high frequency. Liang et al. [37] applied the wavelet transform to decompose the frequency of a complex microseismic waveform and to analyze precursor information related to rockbursts. The energy distribution of the microseismic frequency band shifted to the low frequency before rockburst occurrence. From the above research, the evolution characteristics of the acoustic signals or microseismic waveforms before rockburst occurrence can be used as useful information for rockburst prediction.

3.3. Special Types of Rockbursts

Because different types of rockbursts show different formation mechanisms and microseismic evolution laws, it is necessary to distinguish the different types of rockbursts for the early warning. However, scholars have not reached a consensus on the classification of rockbursts. Different classification criteria and results are often provided from different perspectives. Moreover, with the deepening of the understanding and research on rockbursts, some new types of rockbursts have been distinguished and defined. For example, Feng et al. [38] classified an intermittent rockburst as one that has the same or higher level and occurring several times within a certain duration in the same area. For tunnel engineering, there are two rockburst classification methods with the highest frequency: one is to divide rockburst into strainbursts and structure-type rockbursts [39] and the other is to divide rockbursts into immediate rockbursts and time-delayed rockbursts [40] (also known as delayed rockbursts [41]). By sorting out the related research results of structure-type and delayed rockbursts, this section summarizes the microseismic evolution characteristics and formation mechanism of these special types of rockbursts.

3.3.1. Structure-Type Rockburst

The structure-type rockburst often occurs in cave sections with a fault structure or structural plane development. Under the action of fault or structural plane, the magnitude and direction of the original ground stress vary, which affects the bearing capacity of the rock mass. The rockburst occurs because of the fault slip or shear fracture, which has a wider failure range and can result in a higher level of rockburst. Therefore, many scholars have conducted in-depth research on the influence and mechanism of the structural plane on rockbursts. Tang et al. [11] showed that the stress concentration near the structural plane is evident, and more attention should be paid to the influence of the structural plane in rockburst monitoring and early warning. Zhang et al. [42] studied two extremely strong rockbursts that occurred in the Jinping II Hydropower Station and found that the structure plays a key role in the occurrence of rockbursts. Zhou et al. [43] analyzed in detail the action mechanism of the structure on rockbursts under different conditions and divided structure-type rockbursts into fault-slip burst, shear rupture burst, and buckling burst. In addition, many scholars have conducted in-depth studies on the relationship between the seismogenic characteristics of structure-type rockbursts and the evolution of microseismicity. Feng et al. [44] found that the existence of a structural plane changed the evolution mode of microseismicity. Compared with strainbursts, high-energy microseismic events occurred in the early stage of the rockburst process, and the radiation energy of a microseismic event was lower before the rockburst. Liu et al. [17] analyzed the microseismic evolution characteristics of three consecutive strong rockbursts that occurred along the structural plane and obtained some unique precursors for structure-type rockbursts, such as the abnormal aggregation of a large number of microseismic events on one side of the tunnel, high and continuous increase in the energy index (EI), sharp increase in the cumulative apparent volume, and continuous decrease in the b value. Liu et al. [45] analyzed the relationship between the formation characteristics of structure-type rockbursts and the law of microseismic evolution. They proposed a series of rockburst prevention measures based on microseismic monitoring. The above studies obtained different results on the evolution law and formation mechanism of structure-type rockbursts, attributed to the difference in the geostress and occurrence state of the structural plane (occurrence, scale, combination, and surface roughness). In addition, the above researchers only studied the effect of small-scale structures on rockbursts; there are few reports on slip rockbursts due to large-scale structural planes. This type of slip rockburst often has a wider damage range and poses a greater threat to tunnel construction.
Because of the heterogeneity of rocks, a large number of microfractures are typically formed before a macroscopic failure. Therefore, by identifying the failure types of the microseismic events in the process of rockburst evolution, the evolution mechanism of the rockburst can be analyzed. Xiao et al. [46] used the moment tensor method and energy ratio method to study the fracture types of microseismic events in the process of rockburst formation. They found that in the formation process of a strainburst, the proportion of tensile failure events is >92.5%, and the average proportions of mixed failure events and shear failure events are 1.2% and 3.7%, respectively. In the formation process of a strain-structure slip rockburst (single structural plane), the proportion of tensile failure events decreased to less than 90%, whereas the proportion of mixed failure and shear failure events increased. In addition, with the increase in the number of structural planes, the proportion of mixed failure and shear failure events increased further. Liu et al. [17] used the energy ratio method to study the fracture types of microseismic events in the process of three consecutive strong rockbursts along the structural plane. The proportion of shear fracture events was 72.76%, and the proportion of tensile failure events was only 2.44%. This shows that the formation process of a structure-type rockburst is mainly shear fracture. The above studies showed that the existence of structural planes significantly influences the proportion of events of different fracture types in the process of rockburst formation. Therefore, in the early warning of rockbursts, the type of rockburst can be judged in advance by analyzing the proportion of events of different fracture types, for a more accurate early warning. Xue et al. [47] used the energy ratio method to study the formation process of rockbursts in underground caverns and found that the E S / E P value of microseismic events before a rockburst tends to decrease evidently, that is, the proportion of tensile failure events before the rockburst increases significantly. Therefore, the rockburst can be predicted by the change in the proportion of different failure types in the process of rockburst formation. The typical characteristics of strainburst and structure-type rockbursts in different studies are summarized, as shown in Table 1.

3.3.2. Delayed Rockburst

A delayed rockburst refers to rockbursts that occur outside the range of stress adjustment and has discontinuous microseismicity after excavation and unloading [41]. Because of the uncertainty in its occurrence time and location, it is difficult to provide an accurate early warning for delayed rockbursts, posing significant safety risks to construction personnel and equipment. So far, research on the time effect of delayed rockbursts and rock failure is lacking.
In terms of engineering research, Mendecki [48], Van Aswegen and Butler [49] observed that the microseismicity of hard rocks and the fracture process of the rock mass in high-stress areas are related to the time behavior of the stress migration process, which affects the long-term stability of the tunnel. Kaiser and Cai [50] proposed that the decrease in the rock strength under a constant stress is the condition for the formation of delayed strainbursts. Feng et al. [40] compared the microseismicity in the evolution process of delayed and immediate rockbursts. They observed that during the formation process of a delayed rockburst, the microseismicity gradually dominated by tensile ruptures, and before the occurrence of the delayed rockburst, the microseismicity exhibited an evident quiet period. By analyzing the intensity of the blasting disturbance and the delay time of a time-delayed rockburst, Zhao et al. [51] discussed the correlation between time-delayed rockbursts and blasting disturbance. Chen et al. [52] observed that during the excavation of the time-delayed rockburst area, microtremors were frequent and concentrated in space, the EI remained high and had a downward trend, and the changes in the apparent volume and EI were not evident during rockburst occurrence. Zhang et al. [41] observed that during the formation process of a delayed rockburst, the microseismic events and the sliding displacement of the microcracks decreased gradually; however, the microseismic events with a high energy density continued to occur. The phenomenon of delayed rockbursts shows that the early warning and prevention of rockbursts should not only be limited to the rockburst near the working face, but attention should also be paid to the microseismicity behind the working face. The potential risk of a delayed rockburst can be predicted by comparing with the microseismic evolution law of existing delayed rockbursts.
In the laboratory test, Jiang et al. [53] conducted a triaxial unloading test on sandstone, keeping the axial stress level unchanged and unloading with different confining pressure until failure. The results showed that, the higher the degree of unloading, the shorter the time delay of failure. Based on the results of a triaxial creep test on diabase in the dam foundation of Dagangshan Hydropower Station, Yang et al. [54] established an evolution equation for the nonlinear creep damage of the rock mass therein. It reflects the entire process whereby the damage increases with time and leads to the failure of the rock mass. Zhang et al. [55] studied the time-dependent behavior of creep failure through triaxial creep tests. Their results showed time-dependent failure and significant volume expansion in the last loading stage. With the increase in the confining pressure, the time-dependent behavior decreased significantly. Combined with on-site microseismic monitoring and laboratory tests, Zhang et al. [41] proposed that the time effect of rock failure is the time effect of crack propagation. When the failure accumulates to a certain extent, the rock mass becomes unstable and then triggers a delayed rockburst.
Overall, research on delayed rockbursts has made some progress, the law of delayed rockbursts and the characteristics of the microseismicity in the formation process have been summarized in detail, and the formation mechanism has been made clear. However, it remains difficult to predict the occurrence time, which should be focused on in future research for an accurate early warning.

4. Early Warning of Rockburst Based on Microseismic Indices

4.1. Commonly Used Microseismic Indices

The microfractures of different scales in the rock mass correspond to the microseismic events of different intensities. For a single microseismic event, many source parameters can be solved using different principles. Most of these parameters have a functional relationship, which is the derivation of two basic intensity parameters: the seismic moment and energy. The value of the individual source parameter is random, but overall, it shows a certain trend, such as accumulation in space, frequent occurrence in a short time, and gradual increase or decrease in energy. Therefore, microseismic indices can be used to reflect the evolution law of source parameters in a certain space–time range. In addition, affected by the ground stress, the integrity of the surrounding rock, the propagation path of the microseismic waves, the installation quality of the sensor, and the consistency of the channel, the amplitude and frequency attenuation of the microseismic signal vary to a certain extent, and the calculated source parameters also have some deviation. Even in the same project, the microseismicity rules of different cave sections are different; in other words, the source parameters are relative and can be compared only under similar conditions. Therefore, what type of microseismic statistical index is used to reflect the precursory law of rockbursts is a basic problem to be considered in the early warning of rockbursts. The commonly used early warning indices for microseismicity are the apparent stress, apparent volume, EI, and b value.

4.1.1. Apparent Stress

The apparent stress is defined as the radiated energy of inelastic deformation per unit volume [56]:
σ A = μ E M
where σ A is the apparent stress; μ is the shear modulus of the rock mass; E is the total energy contained in the seismic waveform radiated by the source, which is proportional to the energy released by the rock fracture; M is the seismic moment, which is equal to the work done to produce the inelastic deformation in the process of source tension or dislocation. The larger the seismic moment, the more serious the damage in the focal region. The apparent stress represents the stress level at the source. The greater the apparent stress of the microseismic event, the greater the energy released in the process of producing the same inelastic deformation. The apparent stress is a noncumulative parameter; however, the evolution trend in the apparent stress of microseisms over a time period can be counted. If the trend tends to increase, it indicates that stress accumulation occurs in this area, indicating an increase in the rock mass instability and increased risk of rockburst disasters. Zhang et al. [57] studied the microseismic evolution characteristics of an underground powerhouse during excavation and found that the apparent stress of the surrounding rock increased significantly before the appearance deformation. Ma et al. [58] established an EMS method for rockburst prediction using a combination of seismic energy, seismic moment, and apparent stress.

4.1.2. Apparent Volume

The volume of a rock mass in which microseisms produce a corresponding inelastic strain under the action of the apparent stress is measured using the apparent volume [59]. The calculation formula is as follows:
V A = M 2 σ A
The physical unit of the apparent volume is m3; therefore, it can be easily accumulated or analyzed in the form of a cloud map. Because of this accumulative advantage, many scholars have established a relationship between the cumulative apparent volume and the risk of rockbursts. They believe that a rockburst may occur when the cumulative apparent volume increases rapidly. By analyzing the microseismic evolution law of the rockburst in the diversion tunnel of the Jinping II Hydropower Station, Ma et al. [14] and Liu et al. [60] found that the cumulative apparent volume evidently increased a few days before the rockburst, which is related to the occurrence of large-scale cracks in the rock mass. Liu et al. [17] found a similar phenomenon in the study of rockburst evolution of the Hanjiang-to-Weihe River Diversion Project. However, from Equation (4), we find that the apparent volume is more sensitive to the change in the seismic moment, and if the seismic moment of the microseism increases, the apparent volume will increase accordingly. The increase in the seismic moment is only a necessary condition for increased rockburst risk. Therefore, the evaluation of rockburst risk using a single index based on the volume may lead to a misjudgment.

4.1.3. Energy Index

The EI is a practical analysis tool in seismology used to compare the radiation energy between microseismic events with similar seismic moments. It is defined as the ratio of the radiation energy E of a given microseismic event to the average radiation energy E ¯ ( M ) corresponding to the seismic moment M of the microseismic event:
E I = E E ¯ ( M )
The average radiation energy of a microseismic event is positively correlated with its seismic moment, which can be obtained from the following relationship:
log E ¯ ( M ) = c 1 log M + c 2
where c 1 and c 2 are constants, which can be obtained by fitting. Therefore, we have:
E I = 10 c 2 E M c 1
The EI is similar to the formula of the apparent stress. In particular, when c 1 = 1.0 , the EI is proportional to the apparent stress. Therefore, it can be considered that the mechanical behavior in the rock mass reflected by the EI is equivalent to the apparent stress. c 1 and c 2 should be fitted on the basis of the source parameters of all the microseismic events in the region when solving the EI. Typically, the average EI over a time period, or a certain number of microseismic events, is determined, and their evolution trend is observed. Liu et al. [45] analyzed the rockburst formation process of a TBM excavation tunnel and found that EI decreased before a rockburst, which is related to the local stress release in the rock mass before the rockburst. However, when Liu et al. [17] analyzed the characteristics of the microseismic evolution in the rockburst process, they found that the EI increased rapidly to a high level before the rockburst. In the process of rockburst formation under different geological conditions, the release and accumulation stages of the local stress in the rock mass are different, leading to different evolution modes of the EI.

4.1.4. b Value

Gutenberg and Richter [61] observed that there is a negative correlation between the moment magnitude and the frequency of earthquakes, and proposed the famous Gutenberg–Richter model.
log N ( M ) = a b M
where N(M) is the cumulative number of microseismic events with a greater magnitude than M; a and b are constants; and b value is the linear slope obtained by fitting the moment magnitude–frequency relationship in the region.
Laboratory studies, field observations, and numerical simulations have shown that the slope of the distribution curve is related to the stress condition and reflects the degree of microfracture activity in the rock mass. In the process of surrounding rock excavation and unloading, when the large-scale fracture in the rock mass increases gradually, the b value evidently decreases [47,60]. Because it can directly reflect the stability of a surrounding rock, the b value is often considered an important early warning index for rockbursts. However, its applicability is limited: (1) the b value is often insensitive to the weakening of the microseismicity; (2) in some strong rockburst caves, high-magnitude events are often accompanied by a large number of low-magnitude events, and there are almost no intermediate magnitude events, showing the characteristics of a typical bimodal model. In this scenario, the moment magnitude–frequency distribution relationship is no longer subject to the Gutenberg–Richter model; therefore, the b value becomes inapplicable.

4.2. Multi-Index Comprehensive Early Warning

By establishing the relationship between the microseismic index and the rockburst, the early warning of rockbursts can be quantitatively realized. However, because the microseismic indices are more or less incomprehensive or insufficient, it can easily cause misjudgment when used alone. Therefore, it is necessary to analyze the evolution law of the multiple microseismic indices and comprehensively judge the precursors for rockbursts. The realization of multi-index comprehensive early warning has become the mainstream research direction in the early warning of rockbursts.
Based on the relationship between the spatiotemporal evolution characteristics of microseismicity and rockbursts, Ma et al. [14] put forward four rockburst criteria based on the density of microseisms, the relationship between the magnitude and frequency of microseisms, the magnitude of microseisms, and the degree of energy concentration. Feng et al. [62] established a functional relationship between the microseismic index and rockburst through typical rockburst cases, and realized the real-time early warning of the occurrence probability of strainbursts and strain-structure slip rockbursts with weighted coefficients. The microseismic indices selected were the cumulative microseismic event number, cumulative microseismic energy, cumulative microseismic apparent volume, microseismic event rate (day or hour), microseismic energy rate, and microseismic apparent volume rate. Liu et al. [63] selected 74 examples of rockbursts as training samples and used the cumulative number of events, cumulative energy, and cumulative apparent volume as input indices to identify the scale of a rockburst. A neural network optimized by the genetic algorithm was used to predict the level of rockburst, and the prediction accuracy on the verification set was 83.9%. Based on a fuzzy model, Cai et al. [64] used the F score of the performance index in the confusion matrix to determine the weight of each microseismic index and combined the maximum membership principle with variable fuzzy pattern recognition to quantitatively predict rockbursts.
Summing up the methods and common elements used in these studies, they can be collectively referred to as multi-index comprehensive early warning. The multi-index comprehensive early warning for rockbursts involves establishing several mathematical models between the microseismic indices and rockburst law on the basis of rockburst mechanism research and field monitoring, to predict the location, level, and risk probability of rockburst. Moreover, it is necessary to correct the early warning model based on the actual rockburst feedback of a given project and realize the dynamic adjustment of the early warning results. In addition, through the introduction of fuzzy mathematics, neural network, and other mathematical methods for modeling, we can also achieve intelligent early warning.

4.3. Early Warning Cases of Multi-Index Machine Learning

Based on the idea of multi-index comprehensive early warning, taking the Lingnan TBM construction section of the Hanjiang-to-Weihe River Diversion Project as the engineering background, a machine learning model for the early warning of rockburst is established. Taking one day as a unit, the space from 10 m in front to 10 m behind the working face of the day was taken as the early warning area, and 6 input parameters were calculated and counted based on field data and microseismic data (as shown in Figure 5). The variance of the microseismic energy in the past day can be defined as:
D E = i = 1 n ( E i E ¯ ) 2 n
where E i is the energy of the ith microseismic event; E ¯ is the mean of E i . The data of n consecutive days are connected to generate a sequence with day as the stepping unit. Taking the occurrence and level of rockburst on the n + 1 day as two output parameters, the LSTM layers are used to establish a deep neural network model. Figure 5 shows the model structure and number of neurons.
The rockburst records, construction records, and microseismic monitoring data from 15 April 2019 to 24 December 2019 were obtained. A total of 252 samples were created taking n = The previous 80% of the samples were used as the training set, and the last 20% of the samples were used as the verification set to train the model 50 times. Finally, the accuracy of the validation set for predicting the occurrence of rockburst was found to be 92.2%, and the accuracy of the validation set for predicting the level of rockburst was 82.4%.
Table 2 shows part of the performance of the trained neural network model in the early warning of rockbursts. A comparison between the actual rockburst situations and the prediction results of the model shows that the prediction result of the model is reliable, indicating that the established DNN model can be applied to the early warning of rockbursts.

5. Rockburst Warning Based on a Mechanical Model

The early warning of rockbursts based on microseismic indices depends on the relationship between microseismic and rockburst reflected by a certain amount of statistical data. This means that rockburst early warning takes a period of time to learn. Moreover, because of the lack of consideration of the rockburst formation period and the mechanical interaction between a rockburst and the external environment, this early warning method is more suitable for predicting rockbursts due to unloading in the process of excavation. For special types of rockbursts, such as rockbursts occurring in the process of stress adjustment after the completion of a support, or rockbursts occurring again after rockburst, it is necessary to analyze and provide warning based on a mechanical model.

5.1. Mechanism of Two-Body Interaction

After the surrounding rock is excavated and unloaded, the surrounding rock shows an increase in the tangential stress. Because of the heterogeneous characteristics of the rock mass, the loading stress will be concentrated in the relatively weak position, resulting in microfracture precursors. When the local microfracture accumulates to a certain extent, the elastic energy accumulated in the local damaged area and around the relatively intact rock mass is released together, resulting in a rockburst. This process can be explained by a two-body interaction system [65]. The intact surrounding rock mass in the elastic deformation stage is called Body I, and the local damaged area that interacts with Body I is called Body II. When a load P is applied to the two-body system, in the loading process, Body I is always in an elastic state, while Body II undergoes a softening process. The two-body system can be represented by a spring with stiffness k and deformation a u (as shown in Figure 6a):
P = k ( a u )
The load of Body II can be expressed as:
F ( u ) = λ u e u / u 0
where λ is the initial stiffness; u 0 is the deformation value corresponding to the peak load.
The instability conditions of the system are as follows:
d F ( u ) d u + k < 0
The stability of the two-body interaction system can be divided into three stages, as shown in Figure 6b. In the 0-A stage, both Body I and Body II are in the stage of elastic energy storage. Because of the low stress level, the microcracks propagate steadily, resulting in some low-intensity microseismic events. In the A-B stage, the load gradually increases to the maximum, the Body II is in the inelastic deformation stage, and Body I is still in the elastic stage or has a slight inelastic deformation. At this stage, d F ( u ) d u gradually decreases to 0, and d F ( u ) d u + k > 0 , Therefore, the system is stable at this stage. Because the stress level is close to the bearing capacity of Body II, microcracks propagate and accumulate rapidly in the local damaged area, resulting in a large number of high-intensity microseismic events; therefore, the second stage can be used as an early warning period for the rockburst. In the B-C stage, the tangent slope of the F ( u ) - u curve in the local damaged area decreases to an absolute value equal to the stiffness of the surrounding rock. When d F ( u ) d u + k = 0 , the two-body interaction system begins to lose stability. As the local damaged area gradually loses its bearing capacity and begins to rupture, the release of elastic energy in the surrounding rock drives the severe destruction of the local damaged area; therefore, the third stage can be considered the rockburst period.

5.2. 3S Theory of Stress Adjustment Process

The formation of a rockburst is a complex mechanical process, and a microfracture is a manifestation of the geostress disturbance. In studies on earthquake formation, stress buildup, stress shadow, and stress transference (3S) are the three stress states [66]. Similar to the earthquake principle, in the process of rockburst formation, stress adjustment requires a certain period. From statistical data on moderate and above moderate rockbursts, it can be found that microseismicity has a certain periodicity and regularity before and after a rockburst. From this regularity, the 3S phenomenon in seismology can be related to the process of stress adjustment.
After accumulating to a certain extent in a certain area, the microseismic events peak, indicating that the rock mass is in the stress accumulation stage. Based on the monitoring data and geological conditions, the corresponding early warning should be made in time. If a rockburst occurs during the peak period, the stress accumulated in the rock mass is released (corresponding to the stress shadow). The rockburst may change the state of the stress field around the source. After the rockburst occurs, the stress can be generally divided into two cases: complete release and incomplete release. If the stress and energy in the rock in this area are completely released, the frequency of microseismicity decreases rapidly, and little or no microseismic events occur. For the latter, a part of the stress is released, while the other part of the stress is transferred, which is reflected in the migration form of the microseismicity. The stress tends to transfer to the weak structural plane of the rock mass or other locations where stress concentration can easily occur. The next rockburst is likely to occur in these stress concentration areas. Therefore, the next possible rockburst area can be predicted with the help of the spatial migration of the microseismicity.
Before the initial support of the surrounding rock is completed, if a rockburst risk is observed, measures such as stress relief drilling and hydrofracturing can be adopted to reduce the strength of the rock mass and release part of the elastic strain energy artificially. This corresponds to the stress release process in the 3S model. After the initial support of the surrounding rock is completed, the stress accumulation and rockburst risk should be judged again. For the tunnel constructed using the drilling and blasting method, when a rockburst risk is observed, rockburst prevention and control measures can be adopted, such as borehole stress release and installing anchor bolts. The risk of a rockburst is judged again after adopting the measures. For the tunnel constructed using the TBM method, it is difficult to adopt stress relief or strengthening measures after the completion of the support. Therefore, when a rockburst risk is observed, steel arches are recommended to reduce the impact of the rockburst.

5.3. Warning Method and Application Cases

The two-body interaction model and 3S model complement each other in describing the mechanical process and stress evolution cycle of rockburst formation. Combining the two methods, a rockburst warning system based on a mechanical model is proposed. Based on the source parameters, the rock stability stage is determined using the two-body interaction model, and the risk and formation period of the rockburst are obtained. According to the 3S theory, the stress adjustment process of the surrounding rock is analyzed to predict the evolution trend of a rockburst, or to evaluate the effectiveness of rockburst prevention measures. Figure 7 shows the flowchart.
Taking the Lingbei TBM construction section of the Hanjiang-to-Weihe River Diversion Project as the engineering background, two rockbursts occurred successively on the right wall of the tunnel on 6 and 7 January. Figure 8 shows the evolution characteristics of the number of microseismic events and cumulative energy before and after their occurrence. Before 5 January, the number of microseismic events and microseismic energy were low. On 5 January, the number of microseismic events and cumulative energy increased rapidly, indicating a rapid stress accumulation in the rock mass, which resulted in a large number of fissures. Based on the microfracture activity, the rock mass was judged to be in the second stage of the two-body interaction theory, and the risk of a rockburst was significantly high; therefore, a warning report was issued. On 6 January, a moderate rockburst occurred on the right side of the tunnel. After the rockburst, the microseismic events and cumulative energy continued to increase, indicating that the stress in the surrounding rock had not been effectively released or transferred. The continued accumulation of the stress indicates that the risk of a rockburst remained high; therefore, a warning report was issued again. Subsequently, a strong rockburst occurred on the right side of the tunnel on 7 January. After this rockburst, the number of microseismic events decreased rapidly, and the cumulative energy increased gradually. This showed that the stress in the surrounding rock was effectively released and that the risk of rockburst was alleviated.
Another aspect is the evaluation of the stress relief boreholes for rockburst prevention. Figure 9 shows the microseismic events and energy characteristics at Chainage K39+210—K39+240 in 4# sub-tunnel of Hanjiang-to-Weihe River Diversion Project from 6:00 AM on 6 September to 6:00 AM on 12 September from 6:00 on 6 September to 6:00 on 7 September, 80 microseismic events were distributed at Chainage K39+210—K39+240, among which 21 events had an energy of over 1000 J and the maximum energy was 6848.8 J. The abnormal aggregation of a large number of high energy microseismic events indicates that stress is accumulated in the surrounding rock and that the risk of rockburst is high. Based on the early warning advice, a radial stress relief drilling was applied in the section on 7 September. From 6:00 on 7 September to 6:00 on 12 September, a total of 50 microseismic events were generated in the K39+210-K39+240, and only 11 events had an energy of over 1000 J, and the maximum energy was 3891.4 J. The number and energy of the microseismic events decreased evidently, indicating that stress relief drilling successfully released a part of the elastic strain energy. Finally, this measure effectively prevented the occurrence of rockbursts in the area where microseismic events were concentrated.

6. Present Situation and Development Trend of Rockburst Early Warning

6.1. Suggestions on Early Warning of Rockbursts

During the construction of the diversion tunnel of the Jinping II Hydropower Station, the rockburst disaster is prominent, and extremely strong rockbursts occur from time to time. During the construction period, there was no distinguishing between the microseismic index method and the mechanical model method for the early warning of rockbursts. In recent years, with the application of microseismic monitoring technology and the continuous development of support technology, there has been considerable progress in rockburst prevention and control. Taking the construction site of the Hanjiang-to-Weihe River Diversion Project as an example, most of the rockbursts in the TBM construction occurred before the completion of the support; however, there has rarely been any occurrence of the above moderate rockburst strong enough to destroy the supporting structure. To better ensure construction safety, rockburst early warning systems should adapt to the new changes. Existing data pertaining to the early warning of rockbursts from the Hanjiang-to-Weihe River Diversion Project show that it is necessary to distinguish between the microseismic index method and mechanical model method, and different methods should be adopted for different rockburst warning purposes.
For a rockburst in the excavation unloading stage, based on the microseismicity near the working face, the early warning method based on microseismic indices should be adopted to predict the risk and level of the rockburst and form a daily report, so as to provide a basis for the adjustment of support measures and tunneling speed. For rockbursts that may occur after the completion of the support, based on the microseismicity behind the working face, the rockburst warning method based on a mechanical model should be adopted to evaluate the support effect and predict the potential rockburst area and rockburst probability. Once it is observed that the rockburst is approaching, an emergency warning should be issued in time to guide the construction personnel to avoid the risk.

6.2. Present Situation of Rockburst Early Warning

By summarizing the early warning methods for rockbursts and combined with the practical experience gained from project sites, the following three urgent problems should be addressed for a more accurate early warning of rockbursts:
(1)
Are the precursory information and rockburst law of universal significance? Before a rockburst, there will be a microseismic active period, during which the cumulative energy and apparent volume of microseisms increase rapidly, indicating the onset of a rockburst. However, in field observations, it is difficult to define the time range of the active period, and the above trends are often common in the active period; however, rockbursts do not necessarily occur. The microseismicity is significantly affected by the tunneling speed; often, as soon as the work is stopped, the microseismicity weakens, starts again, and becomes active again. These factors eventually lead to uncertainties in the early warning of rockbursts. In addition, the changes in the geostress, geological conditions, and other factors may lead to changes in rockburst precursory information and laws, resulting in similar microseismic laws with different rockburst levels. How to adapt to these changes and adjust the early warning model in time is a problem that must be considered to improve the early warning accuracy.
(2)
Can the microseismic index for the early warning of rockbursts meet the requirements of early warning? A microseismic event reveals information regarding the change in the mechanical state at the source during a rock mass microfailure, which is reflected in a series of source parameters. The microseismic indices commonly used for early warning are the number of microseismic events, moment magnitude, energy, EI, apparent volume, and b value. These indices reflect the evolution law of the microseismicity from different aspects; however, there is a strong correlation between them. Which index combination is more effective for the early warning of rockbursts is a problem worthy of further study. In addition, source parameters, such as the dominant frequency, E S / E P , static stress drop, dynamic stress drop, focal radius, and moment tensor, are related to rockbursts. How to quantify these parameters and use them as a basis for early warning is also a matter of concern.
(3)
How to evaluate the early warning effect of rockbursts scientifically? So far, there has been no unified and rigorous evaluation standard for an accurate early warning of rockbursts in engineering and academic circles. On the one hand, because of the uncertainty in the time, location, and level of rockburst, the prediction results of rockburst location and rockburst level obtained via microseismic precursors are relatively reliable in a certain range; whether a rockburst occurs or not, particularly in terms of the occurrence time, is associated with a strong randomness. On the other hand, as a risk control issue, warning report should be avoided as far as possible from underreporting (the occurrence of rockbursts without warning report), even if it may cause excessive vigilance and more misreporting (early warning is issued but no rockburst occurs). Reasonable early warning effect evaluation criteria can be used to optimize the early warning results and provide an evaluation basis for a parallel comparison of early warning results and optimization of intelligent early warning results.

6.3. Development Trend of Rockburst Early Warning

Conventional microseismic monitoring equipment require cable communication between the sensor and the acquisition instrument and between the acquisition instrument and the data analysis center. In the environment of continuous tunneling, if cables are not arranged appropriately, they can easily undergo damage, posing significant problems to system maintenance and continuous monitoring and early warning. In the future, microseismic sensors will be developed in the direction of telemetry and intelligence, with capabilities such as self-calibration, self-adaptation, self-organization, and self-diagnosis. They can be integrated with other monitoring systems to form a regional automatic monitoring network.
Until now, the early warning of rockbursts has been limited to predicting the location, level, and risk probability of potential rockbursts, and it remains difficult to predict the occurrence time. On the one hand, it is limited by monitoring means and monitoring technology; on the other hand, the occurrence of a rockburst is the result of the combined effect of many factors. Although the early warning of rockbursts based on microseismic indices can help quantitatively predict the rockburst risk, it considers only the statistical relationship between the microseismicity and rockburst; the complex interaction between the rockburst area and the surrounding rock mass is ignored. Based on the quantitative warning provided through a mechanical analysis, multiple factors can be synthesized to predict the rockburst time. However, rockburst warning based on the mechanical model still lacks a quantitative means. By establishing a fine mechanical model and using numerical simulation, combined with microseismic and other monitoring data, the microfracture evolution, stress field, and damage process can be combined to realize monitoring-based simulation and simulation-based warning, which will become the development trend for rockburst warning.
In recent years, with the rapid development of artificial intelligence research, deep learning and other methods have been gradually applied to microseismic signal waveform classification, arrival picking, and rockburst early warning. With the help of the relevant methods based on artificial intelligence, early warning methods may overcome discontinuous artificial early warning and realize intelligent continuous monitoring, analysis, and prediction. However, artificial intelligence-based rockburst early warning is still in the exploratory stage, and on-site monitoring is far more complex than the sample set method. How to adapt to the complex engineering environment and realize large-scale applications on the premise of ensuring accuracy is an important research direction.

7. Conclusions

This article systematically summarized the latest research results obtained by rockburst early warning methods proposed in recent years. Combined with the new practice in the early warning approaches, early warning methods based on microseismic indices, and a mechanical model were summarized, and the respective application scenarios of the two methods were explored. Combined with the practical problems encountered in the early warning of rockbursts, the development directions for future research were pointed out. The main conclusions are as follows:
(1)
Rockburst is a disaster induced by the progressive destruction under the action of excavation unloading, stress adjustment, external disturbance, and other factors, exhibiting an evident microseismic evolution process and precursory characteristics. With the help of microseismic monitoring technology, the stress change and microfractures in the surrounding rock during excavation can be monitored continuously and in real time. By observing the microseismic evolution characteristics of the rockburst formation process, the precursory laws of rockburst were summarized, and finally, the dynamic early warning of rockbursts was realized on the basis of these precursory laws.
(2)
Tunnel engineering is an unfavorable environment for microseismic monitoring systems. The P- and S-wave arrival times should be used in positioning. In the selection of the location detection algorithm, the effects of the pickup error and velocity model accuracy on the location results should be considered.
(3)
The formation process of a rockburst can be divided into three stages: transition period, peak period, and quiet period. Before a rockburst, the dominant frequency of the microtremors tends to decrease. The special type of rockburst has its unique formation process and microseismic evolution law. For structure-type rockbursts, high-energy microseismic events often occur in the early stage of the rockburst process, and shear rupture is the dominant microseismic mechanism in the rockburst formation process. At the initial stage of surrounding rock excavation, the microseismicity of the delayed rockburst is intense, but then gradually decreases. On the eve of a delayed rockburst, the precursory characteristics are not evident. By judging the type of rockburst, the accuracy of early warning can be improved.
(4)
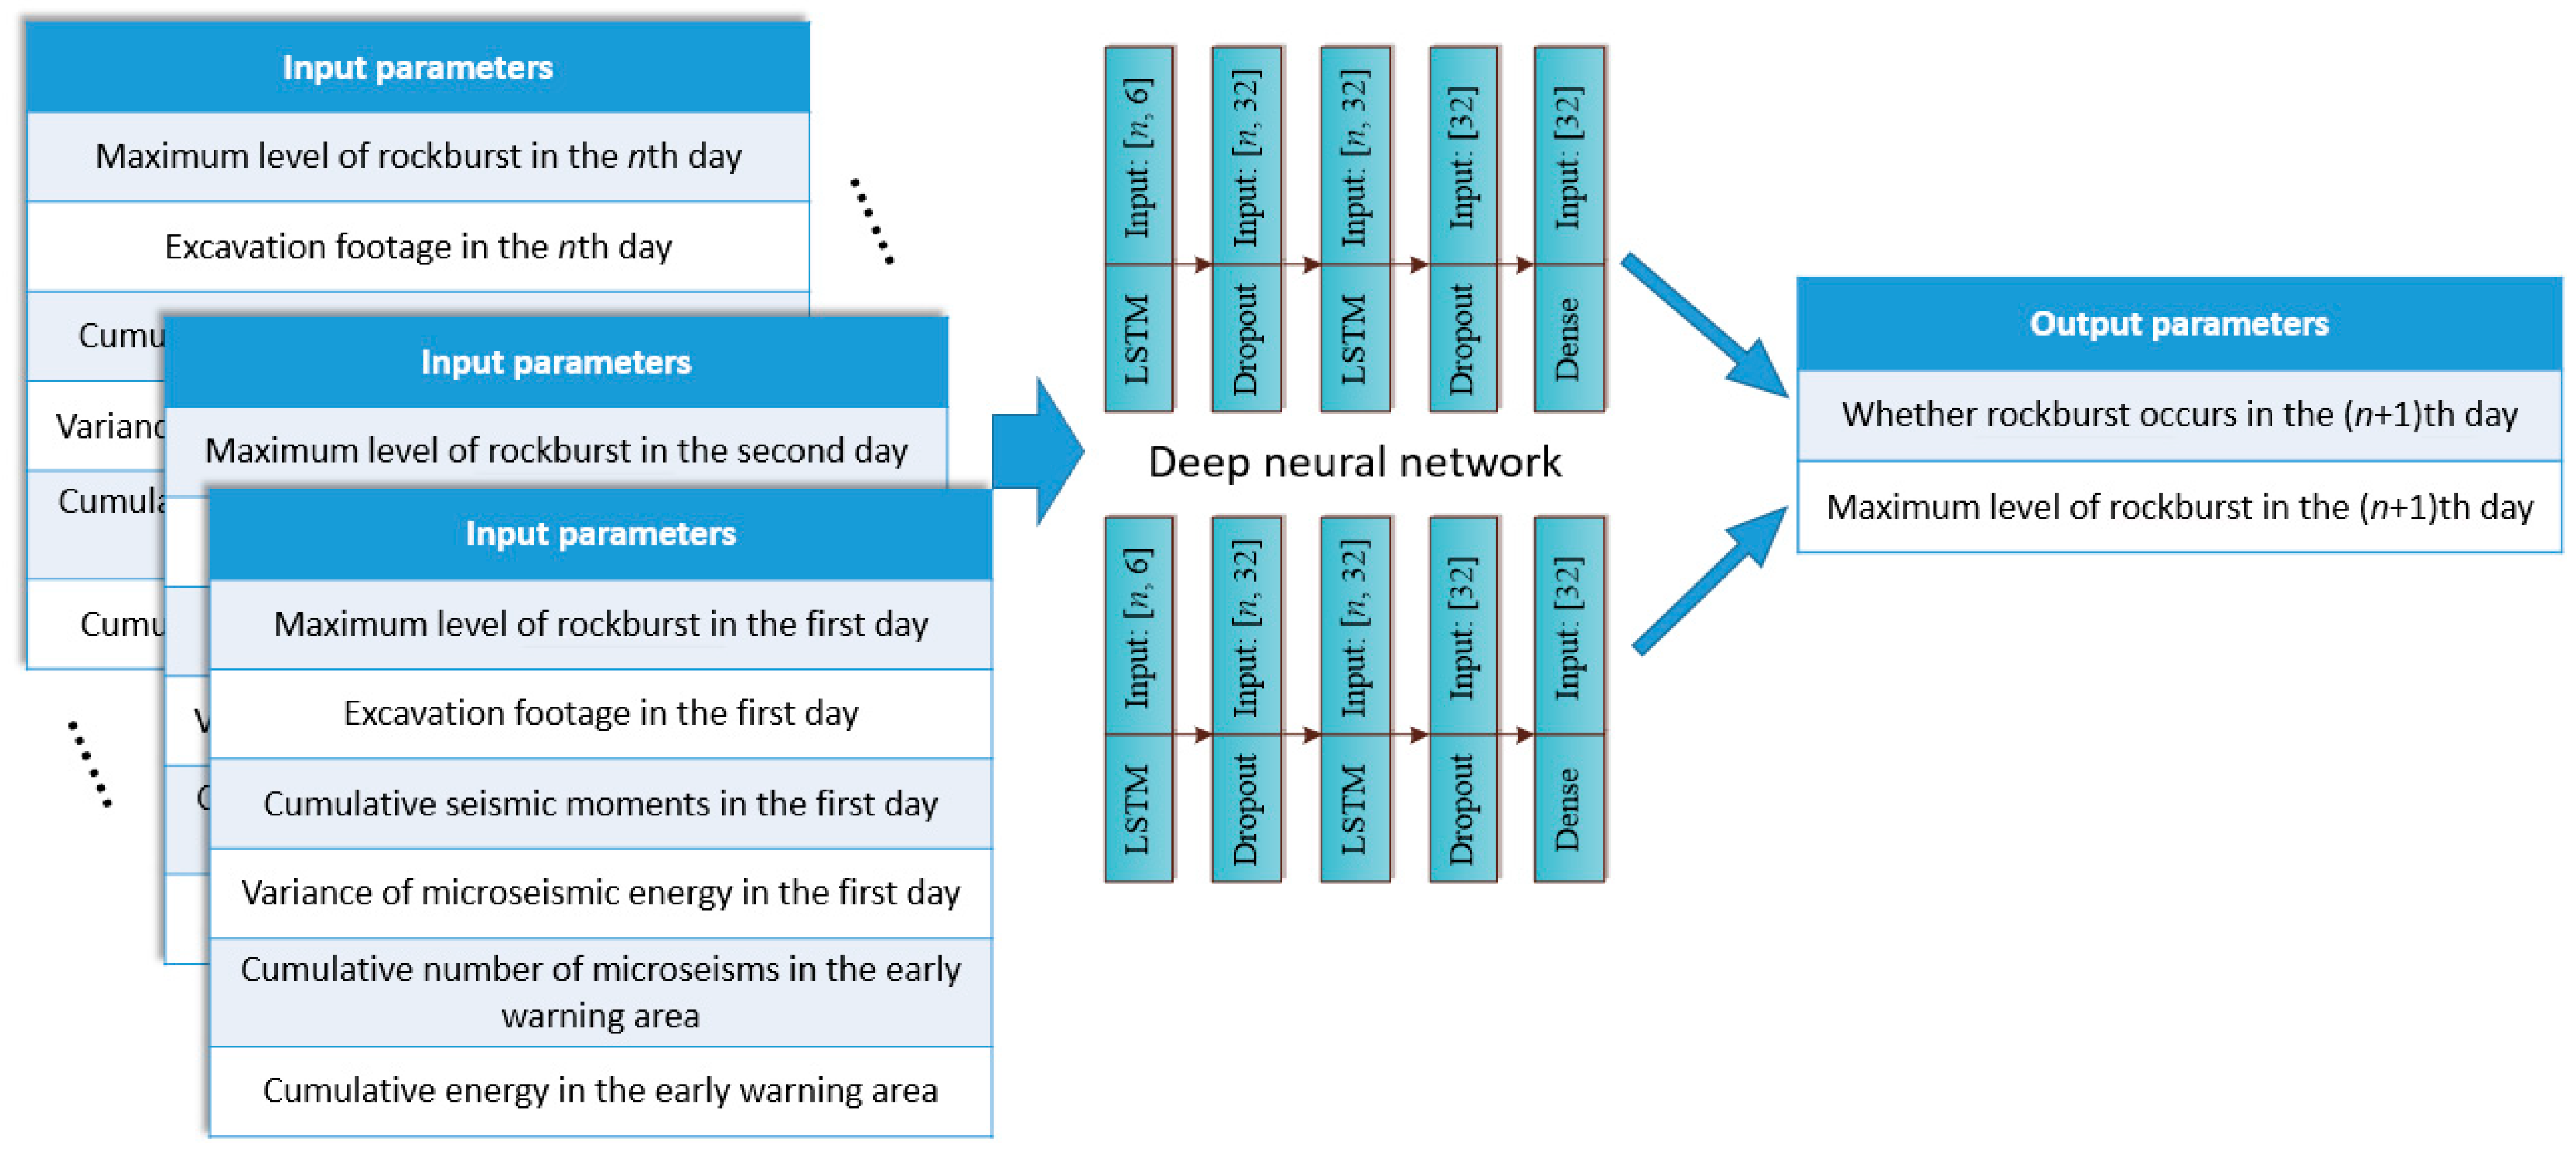
Because the intensity of a single microseismic event is random, but shows an overall trend, the microseismic index that can reflect this evolution trend has become the focus of early warning research. Different microseismic indices have their own advantages and scope of application. To improve the early warning effect and avoid the misjudgment of a single index, a multi-index comprehensive prediction of rockburst risk and rockburst level is typically applied. Using the DNN and establishing functional relationships from the microseismic indices for the prediction of rockbursts, an intelligent early warning of rockbursts can be realized.
(5)
By solving the source parameters, judging the stage of rock mass stability according to the two-body interaction theory, determining the rockburst risk and rockburst formation stage, and analyzing the stress adjustment process of the surrounding rock with the 3S theory, the early warning of rockbursts based on a mechanical model can be realized. The development and evolution trend of rockbursts can be predicted.
(6)
For the rockburst in the excavation unloading stage, the early warning method based on microseismic indices should be used to predict the risk and level of rockbursts, and for rockbursts that may occur after the completion of the support, the early warning method based on the mechanical model should be adopted. The support effect should be evaluated, and the potential rockburst area and risk probability should be predicted.

Author Contributions

Conceptualization, S.Z. and C.T.; methodology, S.Z.; writing—original draft preparation, S.Z. and J.L.; investigation, S.Z., Y.W. and K.W.; writing—review and editing, C.T. and T.M.; supervision, C.T. All authors have read and agreed to the published version of the manuscript.

Funding

This research received no external funding.

Acknowledgments

This study was supported by the National Natural Science Foundation of China (No.41941018) and the Special-funded Programme on National Key Scientific Instruments and Equipment Development (No.51627804), which are greatly appreciated.

Conflicts of Interest

The authors declare that they have no conflicts of interest.

References

  1. Stacey, T.R. Dynamic rock failure and its containment. In Rock Mechanics and Engineering; CRC Press: Boca Raton, FL, USA, 2017; Volume 2, pp. 317–344. [Google Scholar]
  2. Fujii, Y.; Ishijima, Y.; Deguchi, G. Prediction of Coal Face Rockbursts And Microseismicity in Deep Longwall Coal Mining. Int. J. Rock Mech. Min. 1997, 34, 85–96. [Google Scholar] [CrossRef]
  3. Ma, C.S.; Chen, W.Z.; Tan, X.J.; Tian, H.M.; Yang, J.P.; Yu, J.X. Novel rockburst criterion based on the TBM tunnel construction of the Neelum–Jhelum (NJ) hydroelectric project in Pakistan. Tunn. Undergr. Space Technol. 2018, 81, 391–402. [Google Scholar] [CrossRef]
  4. Wu, K.; Shao, Z.; Qin, S.; Wei, W.; Chu, Z. A critical review on the performance of yielding supports in squeezing tunnels. Tunn. Undergr. Space Technol. 2021, 115, 103815. [Google Scholar] [CrossRef]
  5. Li, S.; Feng, X.T.; Li, Z.; Chen, B.; Zhang, C.; Zhou, H. In situ monitoring of rockburst nucleation and evolution in the deeply buried tunnels of Jinping II hydropower station. Eng. Geol. 2012, 137, 85–96. [Google Scholar] [CrossRef]
  6. He, S.; Lai, J.; Zhong, Y.; Wang, K.; Xu, W.; Wang, L.; Zhang, C. Damage behaviors, prediction methods and prevention methods of rockburst in 13 deep traffic tunnels in China. Eng. Fail. Anal. 2021, 121, 105178. [Google Scholar] [CrossRef]
  7. Zhou, J.; Li, X.; Mitri, H.S. Evaluation method of rockburst: State-of-the-art literature review. Tunn. Undergr. Space Technol. 2018, 81, 632–659. [Google Scholar] [CrossRef]
  8. Xu, C.; Liu, X.; Wang, E.; Zheng, Y.; Wang, S. Rockburst prediction and classification based on the ideal-point method of information theory. Tunn. Undergr. Space Technol. 2018, 81, 382–390. [Google Scholar] [CrossRef]
  9. Ghasemi, E.; Gholizadeh, H.; Adoko, A.C. Evaluation of rockburst occurrence and intensity in underground structures using decision tree approach. Eng. Comput. 2020, 36, 213–225. [Google Scholar] [CrossRef]
  10. Skrzypkowski, K. Case studies of rock bolt support loads and rock mass monitoring for the room and pillar method in the legnica-głogów copper district in Poland. Energies 2020, 13, 2998. [Google Scholar] [CrossRef]
  11. Tang, C.A.; Wang, J.M.; Zhang, J.J. Preliminary engineering application of microseismic monitoring technique to rockburst prediction in tunneling of Jinping II project. J. Rock Mech. Geotech. 2010, 2, 193–208. [Google Scholar] [CrossRef] [Green Version]
  12. Sun, J.S.; Zhu, Q.H.; Lu, W.B. Numerical simulation of rock burst in circular tunnels under unloading conditions. J. China Univ. Min. Technol. 2007, 17, 552–556. [Google Scholar] [CrossRef]
  13. Yu, Q.; Tang, C.A.; Li, L.; Cheng, G.; Tang, L.X. Study on rockburst nucleation process of deep-buried tunnels based on microseismic monitoring. Shock Vib. 2015, 2015, 685437. [Google Scholar] [CrossRef] [Green Version]
  14. Ma, T.H.; Tang, C.A.; Tang, L.X.; Zhang, W.D.; Wang, L. Rockburst characteristics and microseismic monitoring of deep-buried tunnels for Jinping II Hydropower Station. Tunn. Undergr. Space Technol. 2015, 49, 345–368. [Google Scholar] [CrossRef]
  15. Liang, Z.; Xue, R.; Xu, N.; Dong, L.; Zhang, Y. Analysis on microseismic characteristics and stability of the access tunnel in the main powerhouse, Shuangjiangkou hydropower station, under high in situ stress. Bull. Eng. Geol. Environ. 2020, 79, 3231–3244. [Google Scholar] [CrossRef]
  16. Hu, L.; Feng, X.T.; Xiao, Y.X.; Wang, R.; Feng, G.L.; Yao, Z.B.; Niu, W.J.; Zhang, W. Effects of structural planes on rockburst position with respect to tunnel cross-sections: A case study involving a railway tunnel in China. Bull. Eng. Geol. Environ. 2020, 79, 1061–1081. [Google Scholar] [CrossRef]
  17. Liu, F.; Ma, T.; Tang, L. Characterizing rockbursts along a structural plane in a tunnel of the Hanjiang-to-Weihe river diversion project by microseismic monitoring. Rock Mech. Rock Eng. 2019, 52, 1835–1856. [Google Scholar] [CrossRef]
  18. Zhao, Z.; Gross, L. Using supervised machine learning to distinguish microseismic from noise events. In SEG Technical Program Expanded Abstracts 2017; Society of Exploration Geophysicists: Houston, TX, USA, 2017; pp. 2918–2923. [Google Scholar]
  19. Yıldırım, E.; Gülbağ, A.; Horasan, G.; Doğan, E. Discrimination of quarry blasts and earthquakes in the vicinity of Istanbul using soft computing techniques. Comput. Geosci. 2011, 37, 1209–1217. [Google Scholar] [CrossRef]
  20. Shang, X.; Li, X.; Morales-Esteban, A.; Chen, G. Improving microseismic event and quarry blast classification using artificial neural networks based on principal component analysis. Soil Dyn. Earthq. Eng. 2017, 99, 142–149. [Google Scholar] [CrossRef]
  21. Dong, L.; Wesseloo, J.; Potvin, Y.; Li, X. Discrimination of mine seismic events and blasts using the fisher classifier, naive bayesian classifier and logistic regression. Rock Mech. Rock Eng. 2016, 49, 183–211. [Google Scholar] [CrossRef]
  22. Bi, L.; Xie, W.; Zhao, J. Automatic recognition and classification of multi-channel microseismic waveform based on DCNN and SVM. Comput. Geosci. 2019, 123, 111–120. [Google Scholar]
  23. Tang, S.; Wang, J.; Tang, C. Identification of Microseismic Events in Rock Engineering by a Convolutional Neural Network Combined with an Attention Mechanism. Rock Mech. Rock Eng. 2021, 54, 47–69. [Google Scholar] [CrossRef]
  24. Peng, P.; He, Z.; Wang, L.; Jiang, Y. Automatic classification of microseismic records in underground mining: A deep learning approach. IEEE Access 2020, 8, 17863–17876. [Google Scholar] [CrossRef]
  25. Zheng, J.; Lu, J.; Peng, S.; Jiang, T. An automatic microseismic or acoustic emission arrival identification scheme with deep recurrent neural networks. Geophys. J. Int. 2018, 212, 1389–1397. [Google Scholar] [CrossRef]
  26. Zhu, W.; Beroza, G.C. PhaseNet: A deep-neural-network-based seismic arrival-time picking method. Geophys. J. Int. 2019, 216, 261–273. [Google Scholar] [CrossRef] [Green Version]
  27. Ross, Z.E.; Meier, M.A.; Hauksson, E. P-wave arrival picking and first-motion polarity determination with deep learning. J. Geophys. Res. Solid Earth 2018, 123, 5120–5129. [Google Scholar] [CrossRef]
  28. Dong, L.; Sun, D.; Li, X.; Du, K. Theoretical and experimental studies of localization methodology for AE and microseismic sources without pre-measured wave velocity in mines. IEEE Access 2017, 5, 16818–16828. [Google Scholar] [CrossRef]
  29. Feng, G.L.; Feng, X.T.; Chen, B.R.; Xiao, Y.X.; Jiang, Q. Sectional velocity model for microseismic source location in tunnels. Tunn. Undergr. Sp. Technol. 2015, 45, 73–83. [Google Scholar] [CrossRef]
  30. Peng, P.; Jiang, Y.; Wang, L.; He, Z. Microseismic event location by considering the influence of the empty area in an excavated tunnel. Sensors 2020, 20, 574. [Google Scholar] [CrossRef] [Green Version]
  31. Huang, L.; Hao, H.; Li, X.; Li, J. Source identification of microseismic events in underground mines with interferometric imaging and cross wavelet transform. Tunn. Undergr. Space Technol. 2018, 71, 318–328. [Google Scholar] [CrossRef]
  32. Ding, Y.; Dou, L.; Cai, W.; Chen, J.; Kong, Y.; Su, Z.; Li, Z. Signal characteristics of coal and rock dynamics with micro-seismic monitoring technique. Int. J. Min. Sci. Technol. 2016, 26, 683–690. [Google Scholar] [CrossRef]
  33. Zhang, J. Investigation of relation between fracture scale and acoustic emission time-frequency parameters in rocks. Shock Vib. 2018, 2018, 3057628. [Google Scholar] [CrossRef] [Green Version]
  34. He, M.C.; Miao, J.L.; Feng, J.L. Rock burst process of limestone and its acoustic emission characteristics under true-triaxial unloading conditions. Int. J. Rock Mech. Min. 2010, 47, 286–298. [Google Scholar] [CrossRef]
  35. Zhao, F.; He, M.C. Size effects on granite behavior under unloading rockburst test. Bull. Eng. Geol. Environ. 2017, 76, 1183–1197. [Google Scholar] [CrossRef]
  36. Su, G.; Shi, Y.; Feng, X.; Jiang, J.; Zhang, J.; Jiang, Q. True-triaxial experimental study of the evolutionary features of the acoustic emissions and sounds of rockburst processes. Rock Mech. Rock Eng. 2018, 51, 375–389. [Google Scholar] [CrossRef]
  37. Liang, Z.; Xue, R.; Xu, N.; Li, W. Characterizing rockbursts and analysis on frequency-spectrum evolutionary law of rockburst precursor based on microseismic monitoring. Tunn. Undergr. Space Technol. 2020, 105, 103564. [Google Scholar] [CrossRef]
  38. Feng, G.L.; Feng, X.T.; Xiao, Y.X.; Yao, Z.B.; Hu, L.; Niu, W.J.; Li, T. Characteristic microseismicity during the development process of intermittent rockburst in a deep railway tunnel. Int. J. Rock Mech. Min. 2019, 124, 104135. [Google Scholar] [CrossRef]
  39. Hoek, E.; Kaiser, P.K.; Bawden, W.F. Support of Underground Excavations in Hard Rock; CRC Press: Boca Raton, FL, USA, 2000. [Google Scholar]
  40. Feng, X.; Chen, B.; Li, S.; Zhang, C.; Xiao, Y.; Feng, G.; Ming, H. Studies on the evolution process of rockbursts in deep tunnels. J. Rock Mech. Geotech. 2012, 4, 289–295. [Google Scholar] [CrossRef]
  41. Zhang, S.; Ma, T.; Tang, C.; Jia, P.; Wang, Y. Microseismic monitoring and experimental study on mechanism of delayed rockburst in deep-buried tunnels. Rock Mech. Rock Eng. 2020, 53, 2771–2788. [Google Scholar] [CrossRef]
  42. Zhang, C.; Feng, X.T.; Zhou, H.; Qiu, S.L.; Wu, W.P. Rockmass damage development following two extremely intense rockbursts in deep tunnels at jinping ii hydropower station, southwestern china. Bull. Eng. Geol. Environ. 2013, 72, 237–247. [Google Scholar] [CrossRef]
  43. Zhou, H.; Meng, F.; Zhang, C.; Hu, D.; Yang, F.; Lu, J. Analysis of rockburst mechanisms induced by structural planes in deep tunnels. Bull. Eng. Geol. Environ. 2015, 74, 1435–1451. [Google Scholar] [CrossRef]
  44. Feng, G.L.; Feng, X.T.; Chen, B.R.; Xiao, Y.X.; Zhao, Z.N. Effects of structural planes on the microseismicity associated with rockburst development processes in deep tunnels of the Jinping-II Hydropower Station, China. Tunn. Undergr. Space Technol. 2019, 84, 273–280. [Google Scholar] [CrossRef]
  45. Liu, Q.S.; Wu, J.; Zhang, X.P.; Tang, L.X.; Bi, C.; Li, W.W.; Xu, J.L. Microseismic monitoring to characterize structure-type rockbursts: A case study of a TBM-excavated tunnel. Rock Mech. Rock Eng. 2020, 53, 2995–3013. [Google Scholar] [CrossRef]
  46. Xiao, Y.X.; Feng, X.T.; Li, S.J.; Feng, G.L.; Yang, Y. Rock Mass Failure Mechanisms During The Evolution Process of Rockbursts in Tunnels. Int. J. Rock Mech. Min. 2016, 83, 174–181. [Google Scholar] [CrossRef]
  47. Xue, R.; Liang, Z.; Xu, N.; Dong, L. Rockburst prediction and stability analysis of the access tunnel in the main powerhouse of a hydropower station based on microseismic monitoring. Int. J. Rock Mech. Min. 2020, 126, 104174. [Google Scholar] [CrossRef]
  48. Mendecki, A.J. Keynote address: Real time quantitative seismology in mines. In Proceedings of the 3rd International Symposium on Rockbursts and Seismicity in Mines, Kingston, ON, Canada, 16–18 August 1993; pp. 287–295. [Google Scholar]
  49. Van Aswegen, G.; Butler, A.G. Applications of quantitative seismology in South African gold mines. In Proceedings of the 3rd International Symposium on Rockbursts and Seismicity in Mines, Kingston, ON, Canada, 16–18 August 1993; Volume 93, pp. 261–266. [Google Scholar]
  50. Kaiser, P.K.; Cai, M. Design of rock support system under rockburst condition. J. Rock Mech. Geotech. 2012, 4, 215–227. [Google Scholar] [CrossRef] [Green Version]
  51. Zhao, Z.N.; Feng, X.T.; Chen, T.Y.; Feng, G.L.; Liu, G.F.; Duan, S.Q. Correlation between time-delayed rockburst and blasting disturbance in deep-buried tunnel. In Proceedings of the ISRM SINOROCK 2013, Shanghai, China, 18–20 June 2013. [Google Scholar]
  52. Chen, B.R.; Feng, X.T.; Ming, H.J.; Zhou, H.; Zeng, X.H.; Feng, G.L.; Xiao, Y.X. Evolution law and mechanism of rockburst in deep tunnel: Time delayed rockburst. Chin. J. Rock Mech. Eng. 2012, 31, 561–569. (In Chinese) [Google Scholar]
  53. Jiang, Q.; Li, J.; Luo, Z.; Xu, X.; Assefa, E.; Deng, H. Study on the time-lag failure of sandstone with different degrees of unloading damage. Period. Polytech. Civ. Eng. 2019, 63, 206–214. [Google Scholar] [CrossRef] [Green Version]
  54. Yang, W.; Zhang, Q.; Li, S.; Wang, S. Time-dependent behavior of diabase and a nonlinear creep model. Rock Mech. Rock Eng. 2014, 47, 1211–1224. [Google Scholar] [CrossRef]
  55. Zhang, Y.; Shao, J.; Xu, W.; Jia, Y. Time-dependent behavior of cataclastic rocks in a multi-loading triaxial creep test. Rock Mech. Rock Eng. 2016, 49, 3793–3803. [Google Scholar] [CrossRef]
  56. Wyss, M.; Brune, J.N. Seismic moment, stress, and source dimensions for earthquakes in the california-nevada region. J. Geophys. Res. 1968, 73, 4681–4694. [Google Scholar] [CrossRef] [Green Version]
  57. Dong, L.; Yang, Y.; Qian, B.; Tan, Y.; Sun, H.; Xu, N. Deformation analysis of large-scale rock slopes considering the effect of microseismic events. Appl. Sci. 2019, 9, 3409. [Google Scholar] [CrossRef] [Green Version]
  58. Ma, C.; Li, T.; Zhang, H. Microseismic and precursor analysis of high-stress hazards in tunnels: A case comparison of rockburst and fall of ground. Eng. Geol. 2020, 265, 105435. [Google Scholar] [CrossRef]
  59. Mendecki, A.J. Seismic Monitoring in Mines; Springer Science & Business Media: Berlin/Heidelberg, Germany, 1996. [Google Scholar]
  60. Liu, F.; Ma, T.; Tang, C.; Chen, F. Prediction of Rockburst in Tunnels at The Jinping II Hydropower Sstation Using Microseismic Monitoring Technique. Tunn. Undergr. Space Technol. 2018, 81, 480–493. [Google Scholar] [CrossRef]
  61. Gutenberg, B.; Richter, C.F. Frequency of Earthquakes in California. Bull. Seismol. Soc. Am. 1944, 34, 185–188. [Google Scholar] [CrossRef]
  62. Feng, G.; Feng, X.; Chen, B.; Xiao, Y.X.; Yang, Y. A Microseismic Method for Dynamic Warning of Rockburst Development Processes in Tunnels. Rock Mech. Rock Eng. 2015, 48, 2061–2076. [Google Scholar] [CrossRef]
  63. Liu, G.F.; Jiang, Q.; Feng, G.L.; Chen, D.F.; Chen, B.R.; Zhao, Z.N. Microseismicity-based method for the dynamic estimation of the potential rockburst scale during tunnel excavation. Bull. Eng. Geol. Environ. 2021, 80, 3605–3628. [Google Scholar] [CrossRef]
  64. Cai, W.; Dou, L.; Zhang, M.; Cao, W.; Shi, J.Q.; Feng, L. A fuzzy comprehensive evaluation methodology for rock burst forecasting using microseismic monitoring. Tunn. Undergr. Space Technol. 2018, 80, 232–245. [Google Scholar] [CrossRef]
  65. Ma, T.H.; Tang, C.A.; Tang, S.B.; Liang, K.; Yu, Q.; Kong, D.Q. Rockburst mechanism and prediction based on microseismic monitoring. Int. J. Rock Mech. Min. 2018, 110, 177–188. [Google Scholar] [CrossRef]
  66. Tang, C.; Ma, T.; Ding, X. On stress-forecasting strategy of earthquakes from stress buildup, stress shadow and stress transfer (SSS) based on numerical approach. Earthq. Sci. 2009, 22, 53–62. [Google Scholar] [CrossRef] [Green Version]
Figure 1. Microseismic signal acquisition and data processing.
Applsci 11 10965 g001
Figure 2. Topology diagram of a typical microseismic monitoring system in a tunneling environment.
Applsci 11 10965 g002
Figure 3. Typical signals received from different sources.
Applsci 11 10965 g003
Figure 4. Schematic of locating the source based on the arrival time difference approach.
Applsci 11 10965 g004
Figure 5. Schematic of early warning model for rockbursts based on machine learning.
Applsci 11 10965 g005
Figure 6. Two-body interaction model (a) and constitutive curve (b).
Applsci 11 10965 g006
Figure 7. Flowchart of rockburst warning system based on a mechanical model.
Applsci 11 10965 g007
Figure 8. Evolution process of the microseismicities in theLingbei TBM construction section.
Applsci 11 10965 g008
Figure 9. Microseismic events and energy characteristics during the measurement of stress relief boreholes.
Applsci 11 10965 g009
Table 1. Comparison of typical characteristics between strainbursts and structure-type rockbursts.
StrainburstStructure-Type Rockburst
Microseismic energy and rockburst levelFor rockbursts with similar microseismic radiation energy, the rockburst level is relatively lower.The damage range is wide, and the rockburst level is relatively higher.
Spatial distribution of microseismsFrom dispersion to local concentration.Concentrated distribution along the structural plane.
Microseismic evolution with timeThe activity of microseisms increases, and the energy and magnitude increase gradually.Microseisms are frequent, and there are high-energy microseismic events in the early stage of excavation.
Rupture mechanism of microseismic eventsThe proportion of tension rupture events is dominant.The proportion of shear failure events is dominant.
Rockburst failure characteristicsRockburst pits are usually arc shaped or V shaped. The exfoliated rock has plate-like or lamellar characteristics.The pit boundary is affected by the structural planes and is usually larger in depth and range.
Table 2. Comparison of the real performance of the model applied to the early warning of rockbursts (a part).
DateTotal Rockburst RangeMaximum Rockburst LevelModel Prediction RangeRockburst Level Predicted by the ModelRisk Level Predicted by the Model
2020/3/9K40+688.0~694.0StrongK40+680~700StrongExtremely high
2020/3/10K40+694.0~697.0StrongK40+687~707StrongExtremely high
2020/3/11K40+697.0~700.0StrongK40+690~710StrongExtremely high
2020/3/12K40+700.0~704.0StrongK40+693~713StrongHigh
2020/3/13K40+704.0~710.0StrongK40+696~716ModerateHigh
2020/3/14K40+710.0~717.0ModerateK40+703~723ModerateExtremely high
2020/3/15K40+717.0~723.2StrongK40+712~732StrongExtremely high
2020/3/16K40+723.0~727.0StrongK40+717~737StrongExtremely high
2020/3/17K40+726.8~730.0StrongK40+721~741StrongExtremely high
2020/3/18K40+730.0~734.0StrongK40+724~744ModerateExtremely high
2020/3/19K40+734.0~738.0StrongK40+727~747StrongExtremely high
2020/3/20K40+738.0~741.0StrongK40+731~751StrongExtremely high
2020/3/21K40+741.0~744.4StrongK40+734~754StrongExtremely high
2020/3/22K40+746.4~751.4StrongK40+737~757StrongExtremely high
2020/3/23K40+751.4~755.0StrongK40+742~762StrongExtremely high
2020/3/24K40+755.0~759.4StrongK40+746~766StrongExtremely high
2020/3/25——No rockburstK40+751~771MildLow
2020/3/26——No rockburstK40+755~775No rockburstNo rockburst
2020/3/27——No rockburstK40+759~779No rockburstNo rockburst
2020/3/28K40+771.9MildK40+764~784MildHigh
2020/3/29——No rockburstK40+768~788No rockburstNo rockburst
Publisher’s Note: MDPI stays neutral with regard to jurisdictional claims in published maps and institutional affiliations.

