1. Introduction
With the acceleration of urbanization, tunnel construction projects are recently increasing in China. In the construction of tunnel engineering, the contour and size of the excavation section should be accurate, and the disturbance to surrounding rock should be small. Smooth blasting has been widely used in tunnel blasting construction because of its good controlled blasting profile and small disturbance to surrounding rock [
1,
2,
3]. However, a large number of structural planes and structural bodies in the rock mass exist, which are arranged and combined in different manners to form different rock mass structures; rock mass structure is also an important cause of overbreak and underbreak of smooth blasting [
4,
5,
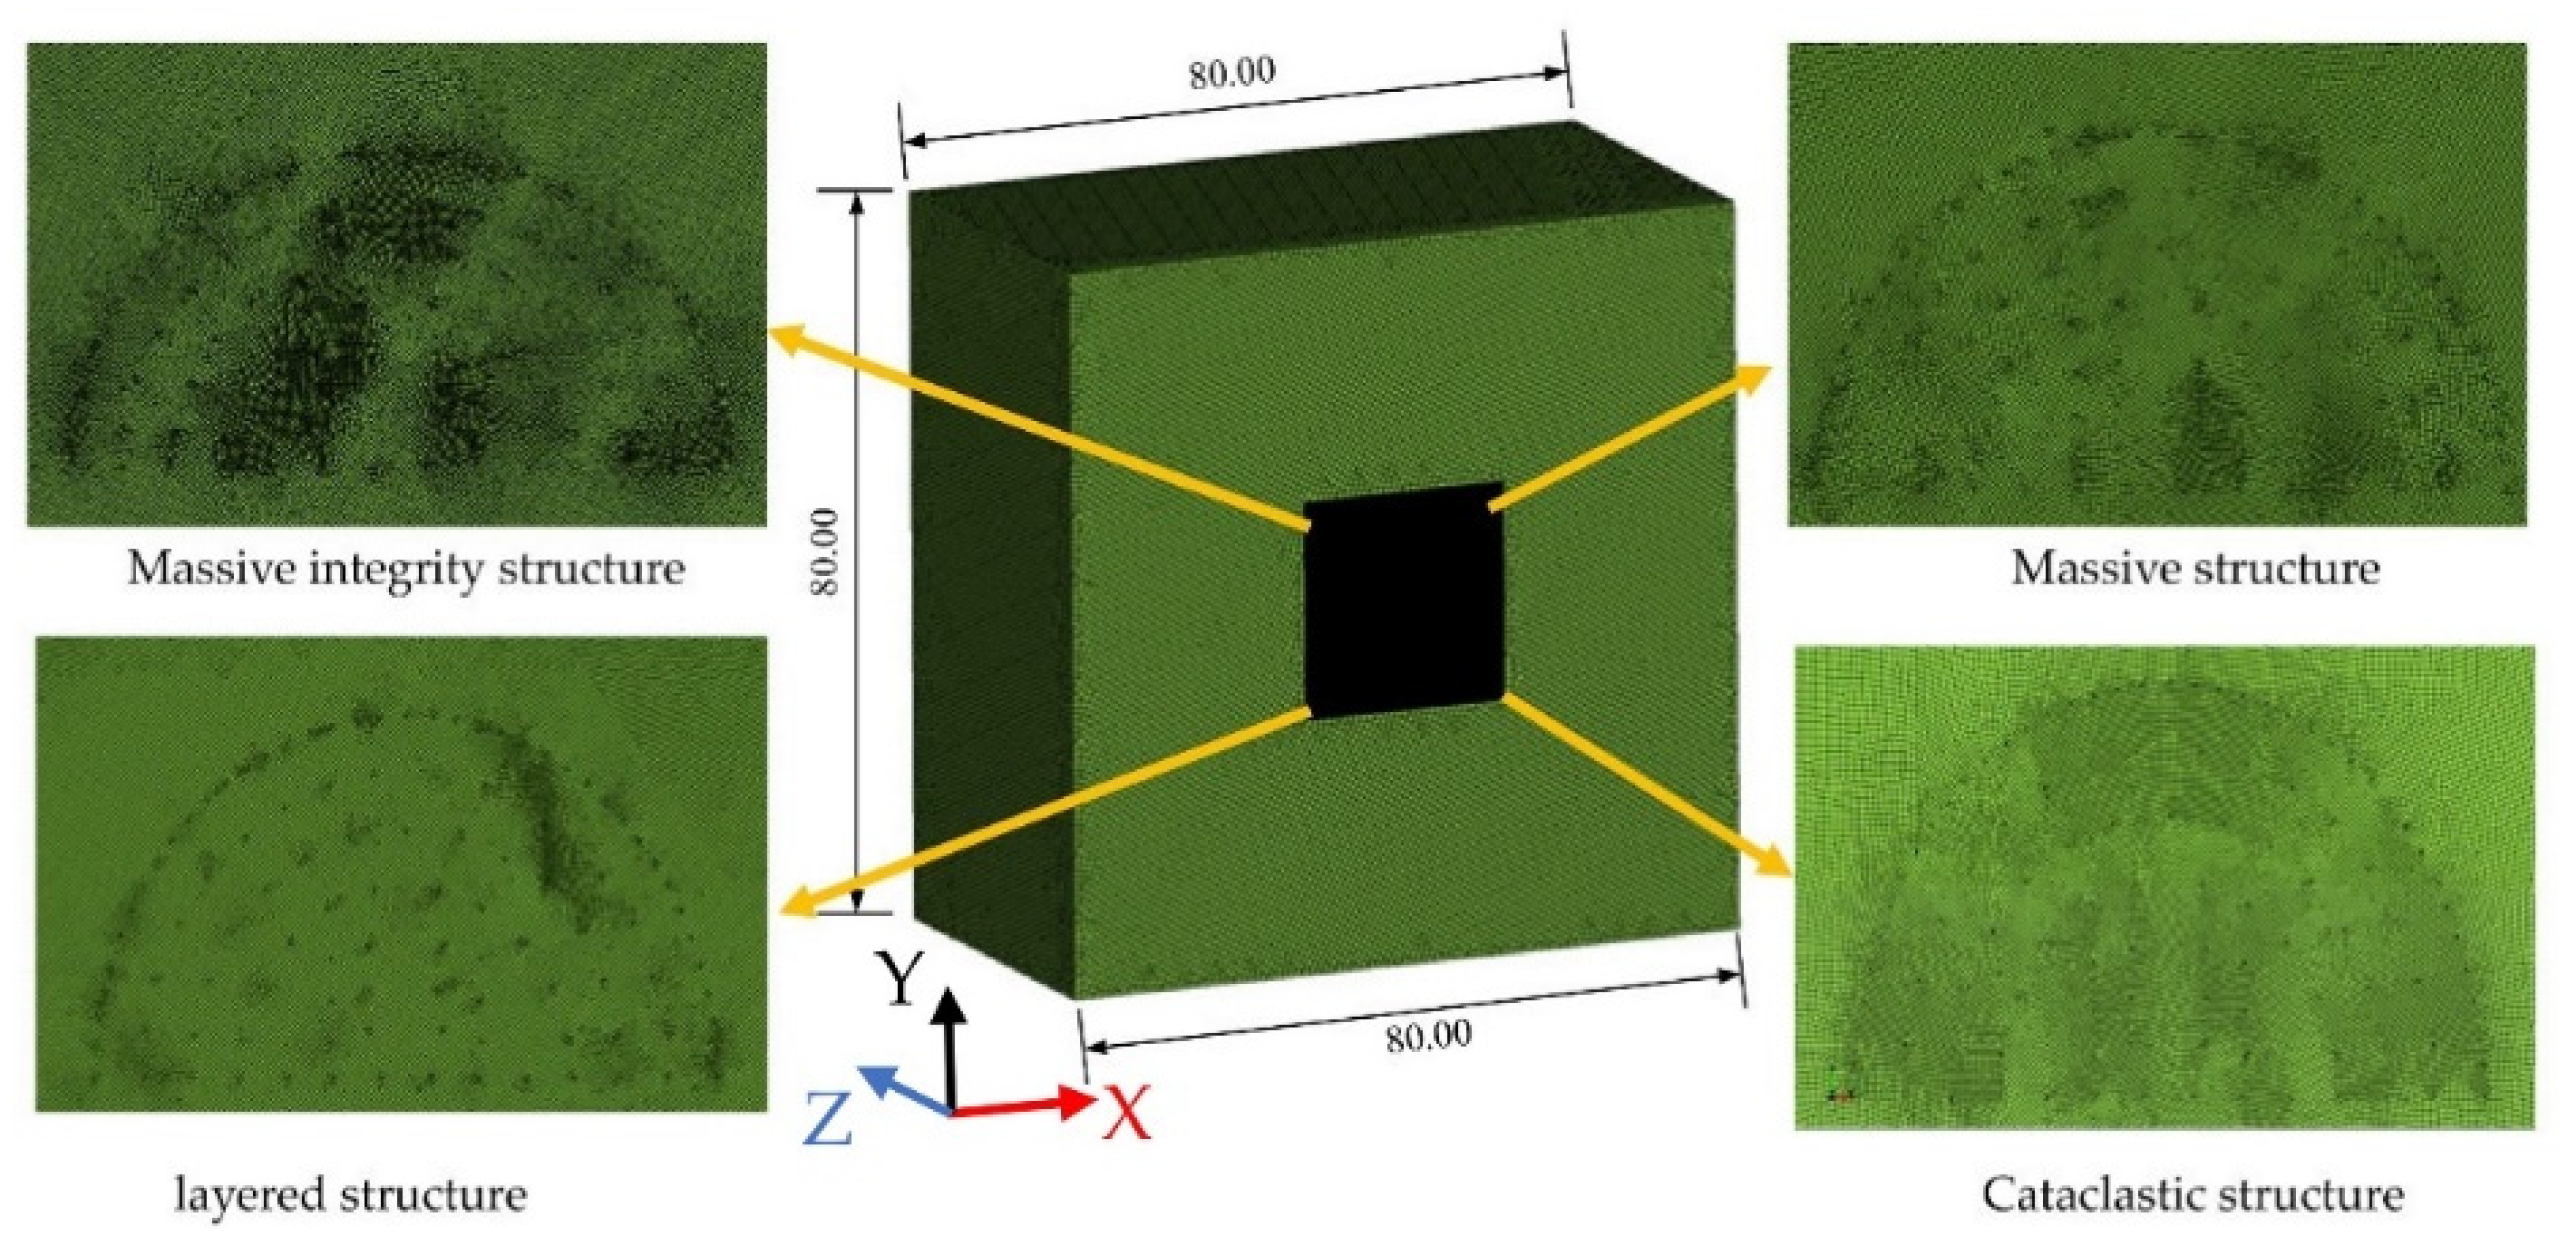
6]. At present, rock mass structure is mainly divided into five types: massive integrity structure, massive structure, layered structure, cataclastic structure, and granular structure [
7,
8]. The overbreak and underbreak in smooth blasting affect the work efficiency of subsequent processes, such as ballast transportation and tunnel maintenance, and increase the cost of tunnel excavation. Therefore, research on the effect of rock mass structure in the smooth blasting of tunnels has become an indispensable part of scientific research and production.
Many factors affect the quality of tunnel smooth blasting, which is difficult to control. How to correctly and reasonably control the quality of tunnel smooth blasting has attracted the attention of researchers, and fruitful studies have been carried out. During the construction of the Fuling highway long tunnel, Liu et al. [
9] conducted 18 field smooth blasting tests and studied the influence of rock-saturated uniaxial compressive strength, peripheral hole spacing, pressure relief hole spacing, the minimum charge amount of peripheral holes, and linear charge concentration on the quality of tunnel smooth blasting. On the basis of the three-dimensional blasting model of LS-DYNA, Zou et al. [
10] simulated tunnel smooth blasting. Meanwhile, the orthogonal test design method was used to study the effects of seven factors on the over- and under-excavation of the tunnel, including peripheral hole spacing, least resistance line, charge density, charge form, rock mass type, detonation speed, and borehole inclination. The study revealed that the rock mass type has the greatest effect on the blasting quality, while the charge density and detonation velocity could be regarded as secondary factors under specific site conditions. On the basis of model tests and field investigation, Chakraborty et al. [
11,
12] evaluated the joint direction and rock mass quality affecting tunnel overbreak and considered that blasting quality was related to the average rock mass size, depth, and geometric dimensions of the cross-sectional profile. Mei et al. [
13] used the horizontal layered rock mass large-section tunnel as the research object and proposed the cutting methods of “center holes and four-wedge cutting holes”, “empty holes, long holes, short holes, and additional relief holes”, and the fine excavation mode of the maximum single hole charging scheme. Meng et al. [
14] improved smooth blasting parameters and construction technology in large dip tunnels in accordance with the actual construction situation on site, the rock, and the explosive properties. In smooth blasting, Kim et al. [
15] proposed a controlled blasting method using pilot holes to smooth the smooth fracture surface and reduce the blasting damage zone. Gao et al. [
16] studied the blasting method of slotted tube charging structure in fault stratum through a field test. The research showed that the circumferential hole with a slotted tube charging structure significantly improved the overbreak phenomenon in the fault stratum. Yang et al. [
17] adopted self-made uniform similarity materials and digital image correlation methods and found that with the increase in buried depth, the ground stress exhibited a significant effect on smooth blasting, and the fracture surface tended to be flat with the increase in in situ stress. Qi et al. [
18] used the finite element numerical simulation software ANSYS/LS-DYNA to simulate the blasting process of the coupled charge in the peripheral holes in smooth blasting. The results showed that when the peripheral hole spacing was 0.6 m, the surrounding rock stress and spalling were the smallest, which could improve the efficiency of smooth blasting.
Besides the studies in field tests, laboratory tests and numerical simulation on the quality improvement of smooth blasting, over- and under-excavation prediction model, random model, and comprehensive optimization control model were used to select the best blasting scheme. Taking the smooth blasting of Koyna Lake Tap Tunnel in India as an example, Murthy et al. [
19] compared the prediction model calculated by the peak particle velocity (PPV) of blasting particles with the measured overbreak and underbreak. They proposed the overbreak and underbreak BIRD prediction model and calculated the crack development state and the PPV threshold of overbreak and underbreak. Thereafter, Dey and Murthy et al. [
20] adopted the BIRD prediction method on the basis of the measured data of the tunnel to control the overbreak and underbreak errors of the four tunnels within 10%, thus verifying the feasibility of the BIRD overbreak and underbreak prediction model. Monjezi et al. [
21] proposed a prediction model of overbreak and underbreak on the basis of fuzzy set theory, which controlled overbreak and underbreak by adjusting the four parameters of blockage length, hole depth, charge amount, and hole spacing. Sari et al. [
22] established a Monte Carlo stochastic model on the basis of controllable parameter adjustment to predict overbreak and underbreak. Zou [
23] et al. proposed the constructing method of tunnel smooth blasting quality control index system and established the smooth blasting quality control index system with levels of geological conditions, explosive properties, borehole parameters, charging parameters, initiation method, tunnel parameters, and construction factors as indices.
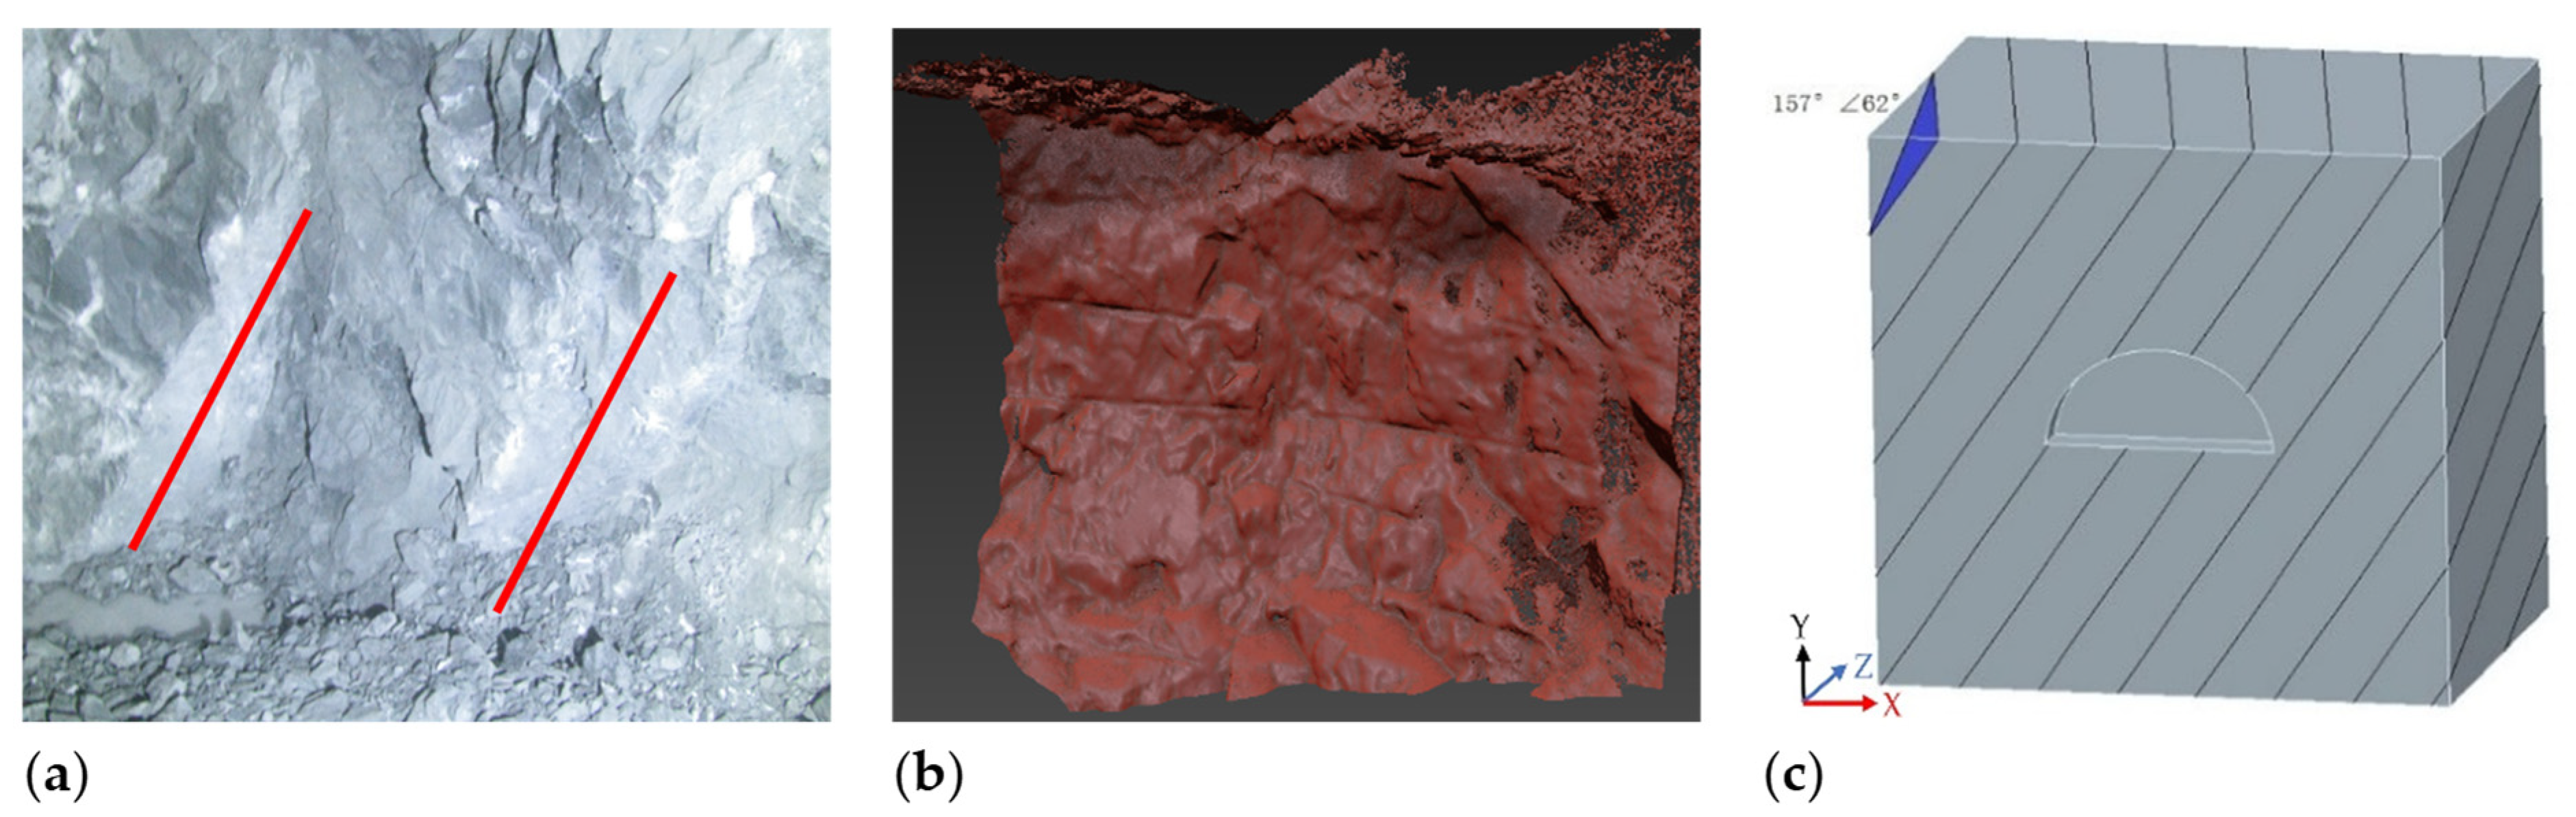
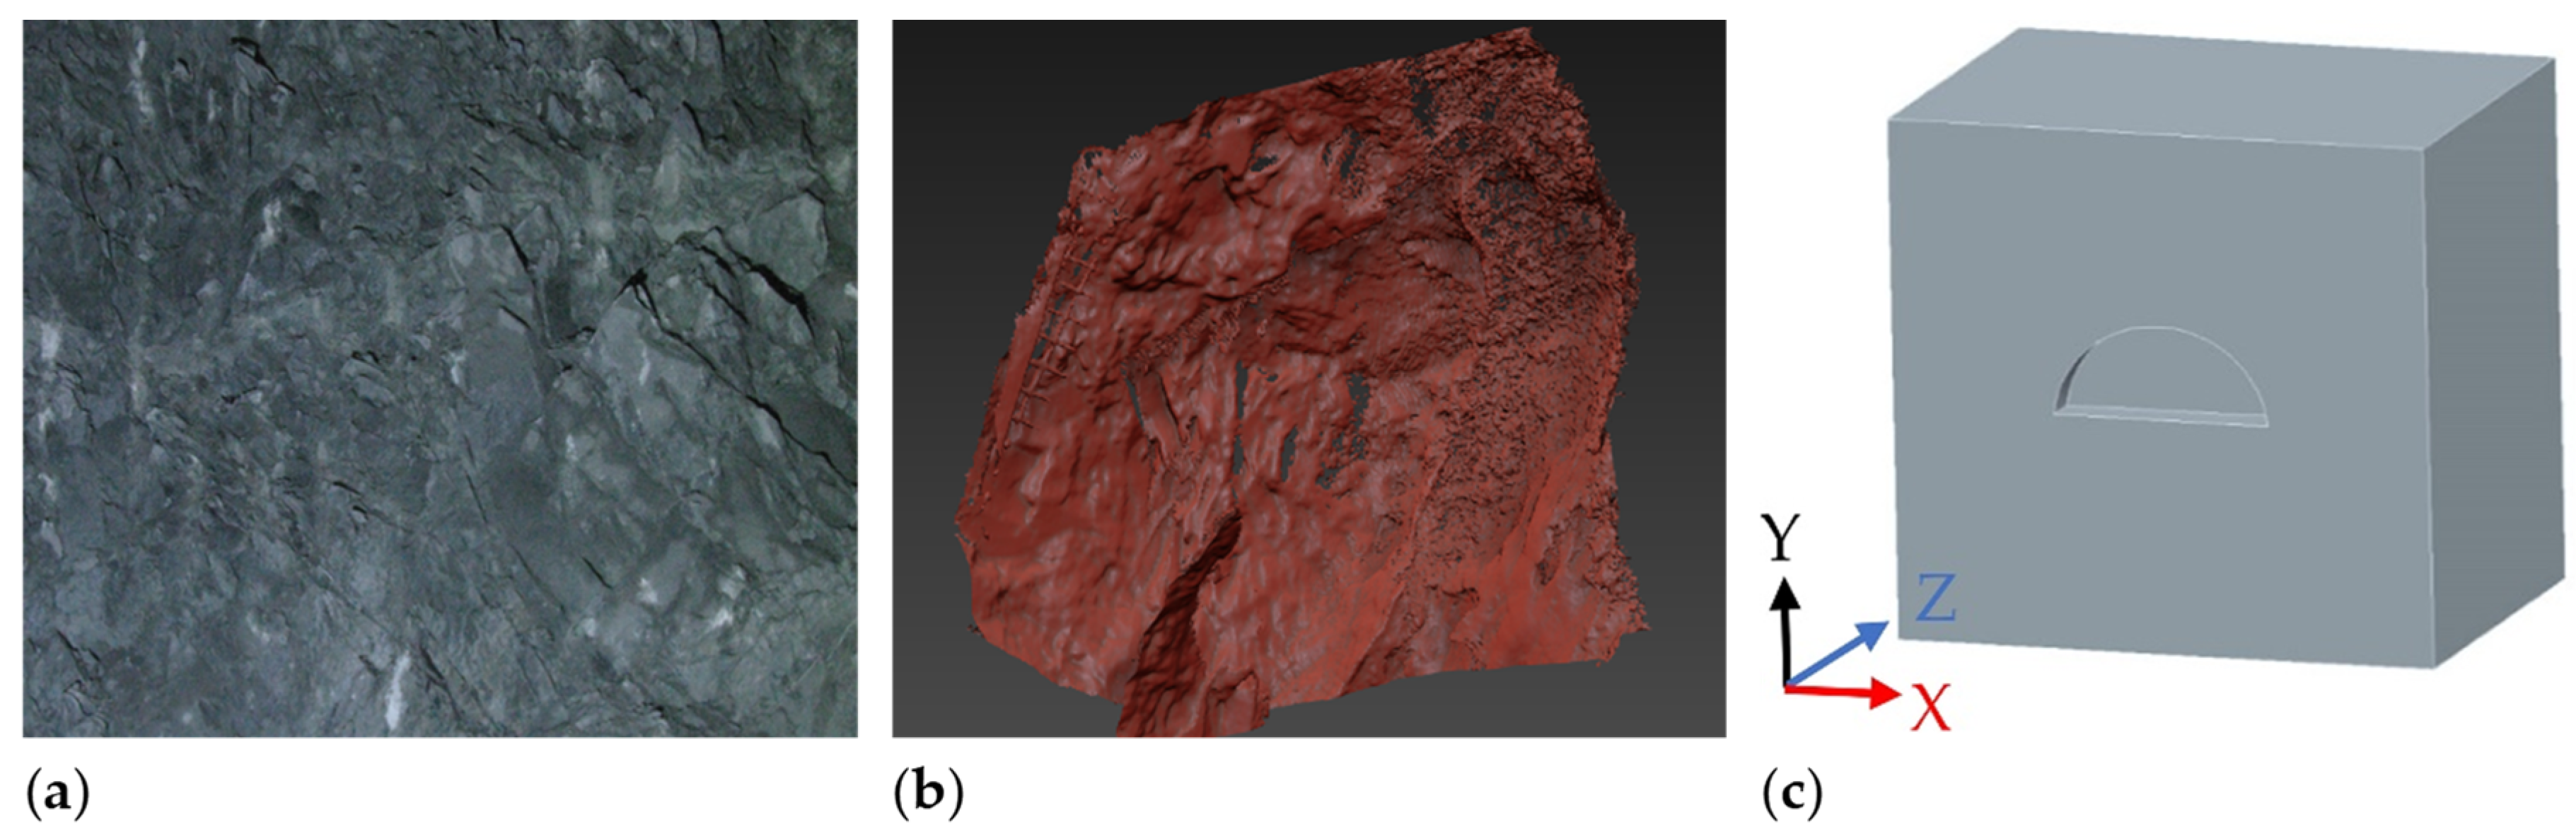
The predecessors mainly considered the physical and mechanical properties of rock mass, explosive properties, charging parameters, and construction methods in researching the quality of tunnel smooth blasting. However, the influence of the types of rock mass structure on tunnel overbreak and underbreak is not fully considered. Besides, the current research on the influence of rock mass structure on the overbreak and underbreak of tunnel smooth blasting is mostly focused on a single rock mass structure; it rarely involves different rock mass structures. Therefore, on the basis of field tests, this paper adopted the method of orthogonal numerical tests to study the influence of the rock mass structures, such as massive integrity structure, massive structure, layered structure, and cataclastic structure, on the quality of tunnel smooth blasting.
3. Results and Discussions
The influence of various factors on the quality of tunnel smooth blasting was quantitatively analyzed using a single factor with the overbreak and underbreak rate of tunnel smooth blasting (the ratio of overbreak and underbreak area of tunnel section to design area). On the basis of the theory of fuzzy mathematics, the fuzzy orthogonal analysis method was introduced to analyze the main effect of the test results to study the influence and function of various factors. The construction steps of the fuzzy orthogonal analysis refer to the literature [
35].
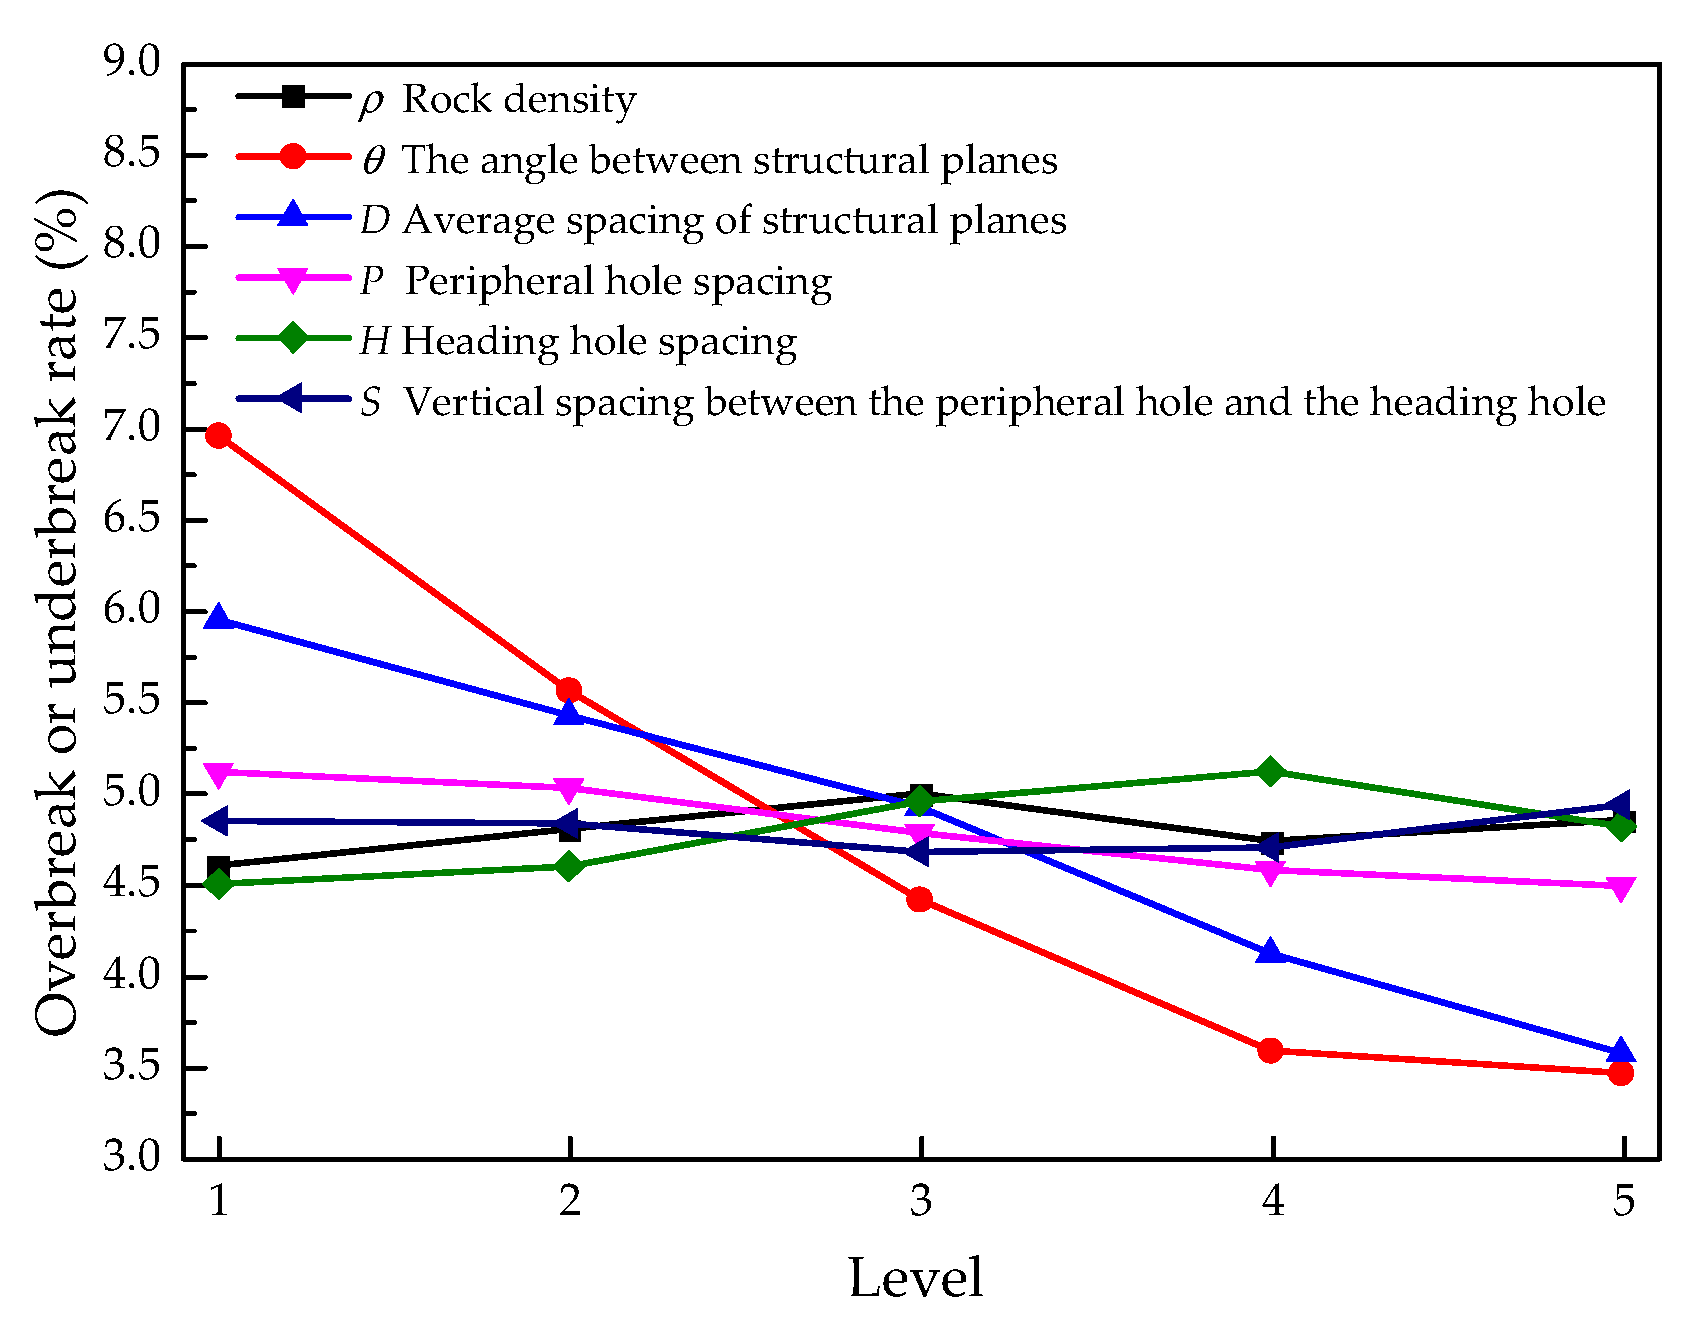
3.1. Massive Integrity Structure Rock Mass
The overbreak or underbreak rate of smooth blasting under different levels of each factor was sorted, and the single factor influence test results of each factor were obtained, as shown in
Figure 11.
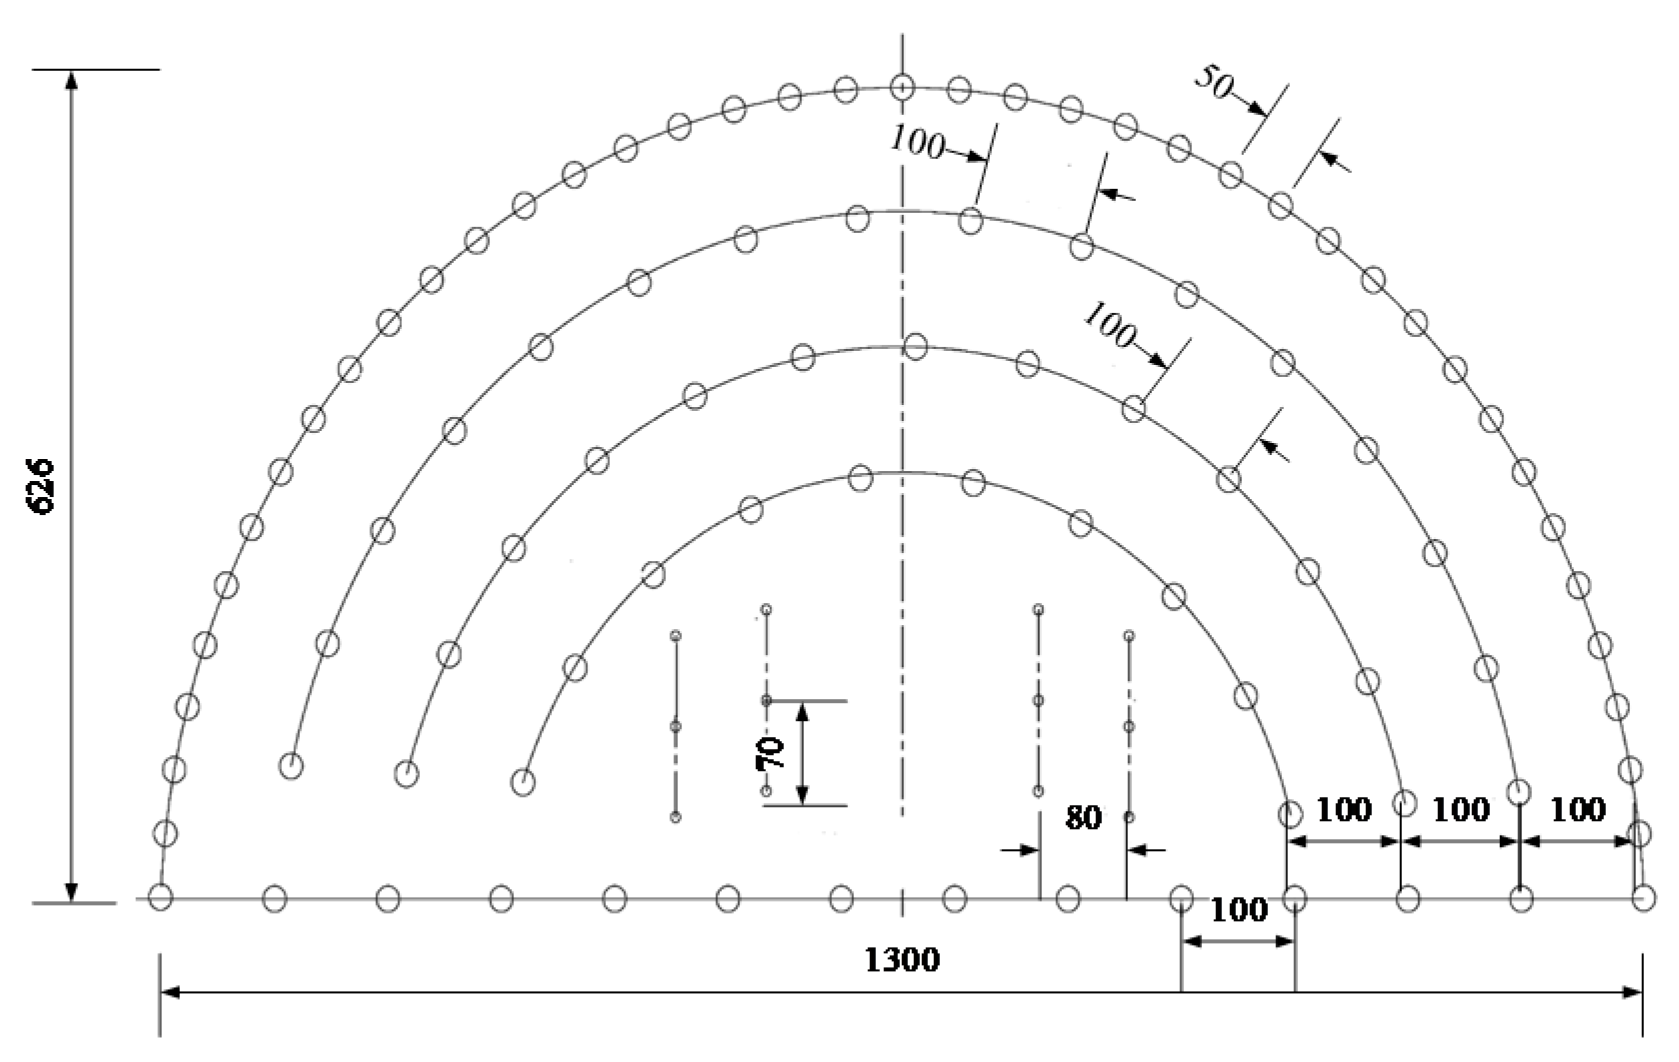
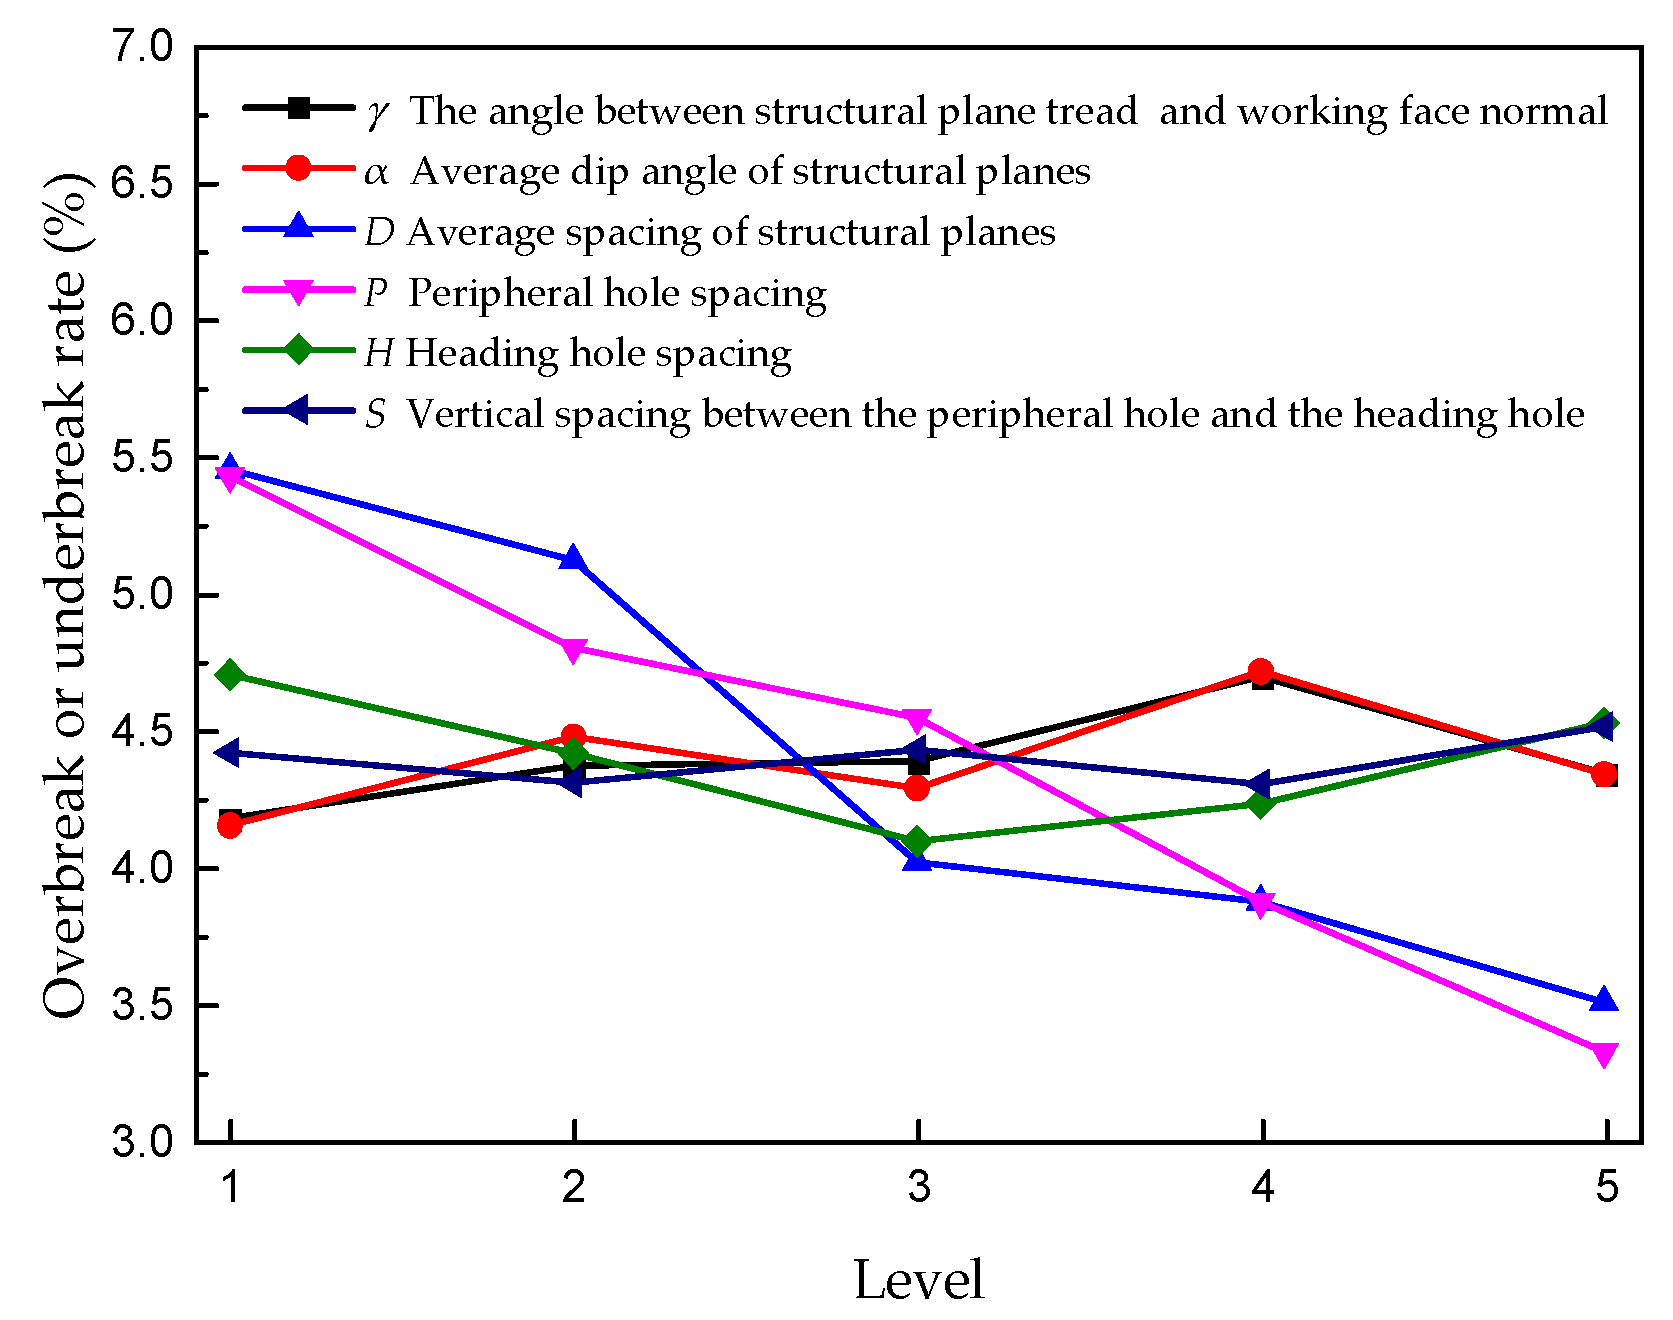
Among the six test factors, the peripheral hole spacing had the most significant impact on the smooth blasting overbreak rate, and the overbreak percentage decreased steadily with the increase in peripheral hole spacing. When the peripheral hole spacing increased from 40 cm to 80 cm, the overbreak rate decreased from 5.43% to 3.32%. The influence of the average spacing of structural planes was second only to the peripheral hole spacing. When the average spacing of structural planes was 3.0 m, the overbreak rate was 5.45%, and when the average spacing of structural planes increased to 4.0 m, the overbreak rate decreased to 4.01%, with a decrease of 35.91%. Thus, the average spacing of structural planes had a more obvious influence on the overbreak rate. The smaller the average spacing of structural planes was, the denser the structural planes, and the greater the overbreak rate. However, when the average spacing of structural planes was increased from 4.0 m to 5.0 m, the overbreak rate dropped from 4.01% to 3.50%, which was only 14.57%, and the decline of the curve greatly slowed down. When the average spacing of structural planes was greater than 4.0 m, its influence on the overbreak rate of smooth blasting was small. The influence of the angle between the structural plane trend and working face normal ranked third. The overbreak rate increased slightly with the increase in the angle between the structural plane trend and working face normal. When the angle between the structural plane trend and working face normal was 60°, the overbreak rate was the largest. The overbreak rate increased with the increase in the dip angle of the structural plane, but the variation range was very small. The influence of the dip angle of the structural plane on the overbreak rate was much less than that of the average spacing of structural planes. The heading hole spacing and vertical spacing between the peripheral hole and the heading hole had a slight influence on the overbreak rate, and the curves were generally stable, which were not the main control factors of overbreak rate.
Taking the overbreak rate of smooth blasting as the research object, the membership value of each factor index and the fuzzy comprehensive evaluation value are shown in
Table 9.
According to the main effect analysis of fuzzy mathematics theory, the maximum membership degree of the angle between structural plane trend and working face normal, average dip angle of the structural plane, average spacing of structural planes, peripheral hole spacing, heading hole spacing, the vertical spacing between the peripheral hole and the heading hole was , , , , , and , respectively. The maximum membership degree represented the influence of the specified factor on the evaluation index, and the value ranges from 0 to 1. The larger the value, the more obvious the influence of the factor on the evaluation index. Considering that , the order of the influence weights of these six factors was as follows: peripheral hole spacing, average spacing of structural planes, the angle between structural plane trend and working face normal, heading hole spacing, average dip angle of the structural plane, and vertical spacing between the peripheral hole and the heading hole. The peripheral hole spacing was the most influential factor with the weighted factor, and its maximum membership degree was 0.258, much greater than the maximum membership degree of the heading hole spacing and vertical spacing between the peripheral hole and the heading hole. For the massive integrity structure rock mass, the influence of the peripheral hole spacing on the overbreak rate of smooth blasting was much greater than that of the layout spacing of the blast holes inside the section, and the peripheral hole spacing should be paid special attention to. In addition, the maximum degree of membership of the average spacing of structural planes was second only to the peripheral hole spacing, reaching 0.257, indicating that the spacing between structural planes also had a great influence on the overbreak rate.
3.2. Massive Structure Rock Mass
Through single factor analysis, the influence curves of various factors in the massive structure rock mass could be obtained, as shown in
Figure 12. Among the six numerical test factors, the angle between structural planes had the most significant influence on the overbreak rate of smooth blasting, and the overbreak rate decreased rapidly with the increase in the angle between the structural planes. When the angle between the structural planes increased from 30° to 90°, the overbreak rate decreased from 6.96% to 3.46%. The slope of the influence curve of the average spacing of structural planes was obviously smaller than that of the angle between structural planes, indicating that the influence of the average spacing of structural planes was second only to the angle between structural planes. For massive structural rock mass, the smaller the angle between structural planes was, the more serious the fragmentation degree of rock mass was. Furthermore, the influence of the angle between structural planes on the fragmentation degree was greater than that of the spacing between structural planes. The influence of peripheral hole spacing was the third, and the smooth blasting overbreak rate decreased slowly with the increase in peripheral hole spacing. The curves of rock density, heading hole spacing, and vertical spacing between the peripheral hole and the heading hole were relatively stable on the whole. They exhibited a relatively slight influence on the overbreak rate, hence not the main control factors of overbreak rate, and have relatively slight influence on the overbreak rate, which were not the main control factors of overbreak rate.
Through the main effect analysis, the maximum membership degree of rock density, the angle between structural planes, the average spacing of structural planes, the peripheral hole spacing, the heading hole spacing, and the vertical spacing between the peripheral hole and the heading hole were obtained, where , , , , , and , respectively. Considering , the influence weight of these six factors were ordered as the angle between structural planes, average spacing of structural planes, peripheral hole spacing, rock density, heading hole spacing, and vertical spacing between the peripheral hole and the heading hole. The maximum membership degree of the angle between structural planes was 0.287, much higher than the maximum membership degree of other factors, indicating that the angle between structural planes was the biggest influencing factor of the weight. The influence degree of the average spacing of structural planes was the second, and its maximum membership degree was 0.246. Due to the cutting of two groups of structural planes, the smaller the angle between the two groups of structural planes was, the smaller the spacing of structural planes, the more fragmented the rock mass, and the more serious the overbreak was. The peripheral hole spacing with the third largest membership was only 0.222, which was far less than the former two, indicating that the influence of rock mass structure on massive rock mass was far greater than that of blast hole layout.
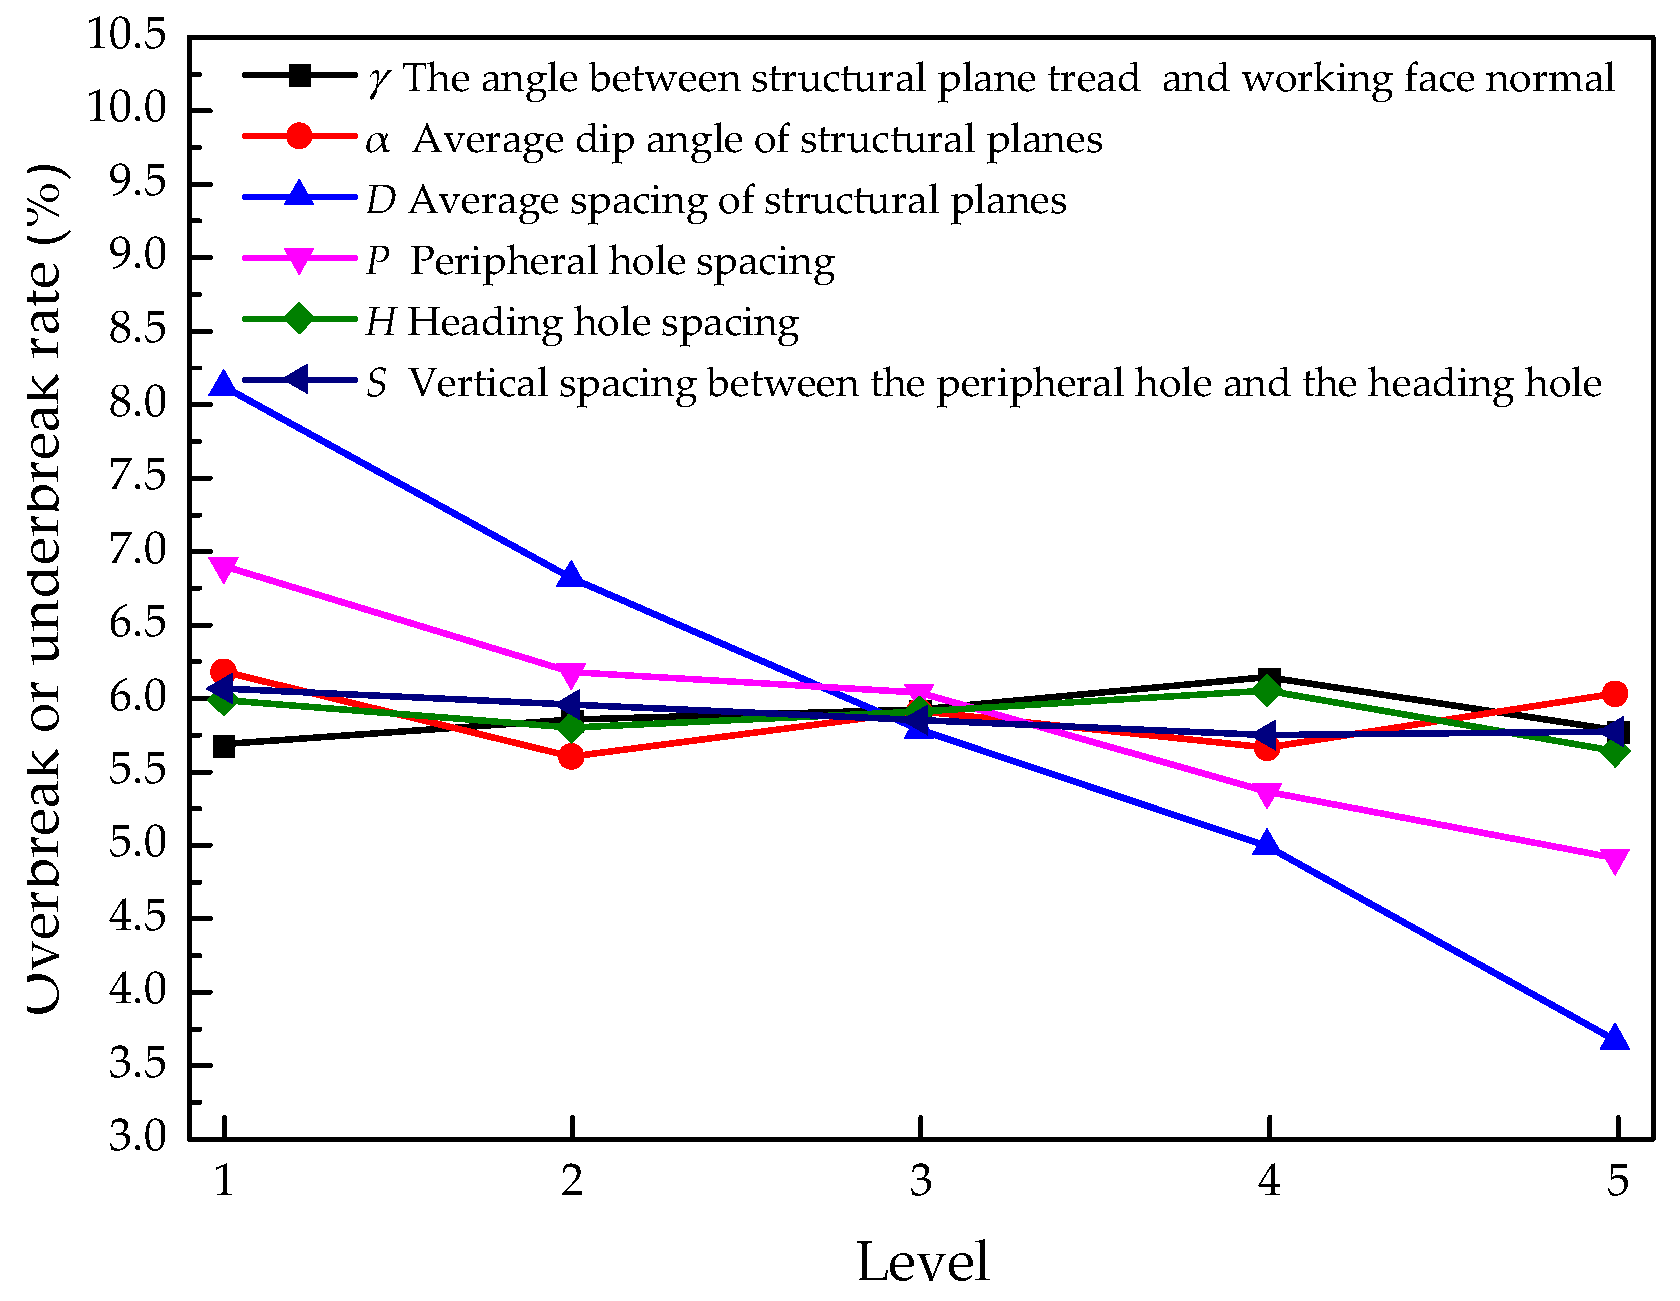
3.3. Layered Structure Rock Mass
Figure 13 shows the influence curve of various factors of the layered rock mass. Among the six numerical test factors, the average spacing of structural planes had the most significant influence on the overbreak rate of smooth blasting, and the overbreak percentage decreased rapidly with the increase in the average spacing of structural planes. When the average structural planes spacing increased from 1.0 m to 2.0 m, the overbreak rate decreased from 8.11% to 3.65%. The influence of peripheral hole spacing was second only to the average spacing of structural planes. When the peripheral hole spacing was 40 cm, the overbreak rate was 6.89%, and when the peripheral hole spacing increased to 80 cm, the overbreak rate decreased to 4.90%. When the peripheral hole spacing increased by 10 cm, the overbreak rate decreased by 0.71%. The influence of the angle between structural plane trend and working face normal ranked third. With the increase in
γ, the overbreak rate also increased. When the angle was 60°, the overbreak rate was the largest.
Through the main effect analysis, the maximum membership degree of the angle between structural plane trend and working face normal, the average dip angle of the structural plane, the average spacing of structural planes, the peripheral hole spacing, the heading hole spacing, and the vertical spacing between the peripheral hole and the heading hole were obtained as follows: ,, , , , and , respectively. Considering that , the influence weight of these six factors was ordered as the average spacing of structural planes, peripheral hole spacing, average dip angle of the structural plane, the angle between structural plane trend and working face normal, heading hole spacing, and vertical spacing between the peripheral hole and the heading hole. The maximum membership degree of the average spacing of structural planes reached 0.284, which was much greater than that of other factors, indicating that the average spacing of structural planes was the most influential factor. The results showed that the smaller the structural plane spacing of the layered structure was, the greater the degree of rock mass fragmentation, and the more serious the overbreak of smooth blasting was.
3.4. Cataclastic Structure Rock Mass
Through single factor analysis, the influence curves of various factors of cataclastic structure could be obtained, as shown in
Figure 14. The peripheral hole spacing had the most significant effect on the overbreak rate of smooth blasting. When the peripheral hole spacing increased from 40 cm to 50 cm, the overbreak rate of the tunnel decreased from 14.98% to 10.07%, with a decrease of 32.77%. However, when the peripheral hole spacing increased from 50 cm to 80 cm, the overbreak rate decreased by only 4.68%, which reflected that the overbreak rate decreased with the increasing peripheral eye spacing, and the decrease was slower. When the peripheral hole spacing was greater than 50 cm, its influence on the overbreak rate was relatively small. For cataclastic structure rock mass, the overbreak rate was generally serious when the peripheral hole spacing was less than 50 cm. Thus, the peripheral hole spacing should not be less than 50 cm. When the rock density increased from 1.5 g/cm
3 to 1.8 g/cm
3, the overbreak rate decreased from 14.91% to 14.27%, with a decrease of only 4.09%. However, when the rock density increased from 1.8 g/cm
3 to 2.1g/cm
3 and from 2.1 g/cm
3 to 2.4 g/cm
3, the reduction of overbreak rate reached 23.57% and 45.39%, respectively. When the rock density was less than 1.8 g/cm
3, the density had a limited influence on the blasting overbreak rate. When the density was greater than 1.8 g/cm
3, the overbreak rate decreased rapidly as the density increased. Therefore, for cataclastic structure rock mass, the density of less than 2.0 g/cm
3 had a great influence on smooth blasting overbreak. Thus, special attention should be paid to blasting design and construction. The influence of the
Q classification index on smooth blasting overbreak was less than that of rock density. The curve showed that the overbreak rate decreased with the increase in
Q, and the decreasing range was relatively stable. In the cataclastic structure rock mass, the structural planes were extremely developed, and
Q was a characterization method of the development degree of the structural plane. The smaller the
Q was, the more fragmented the rock mass was, resulting in the overbreak rate increasing with the decrease in
Q.
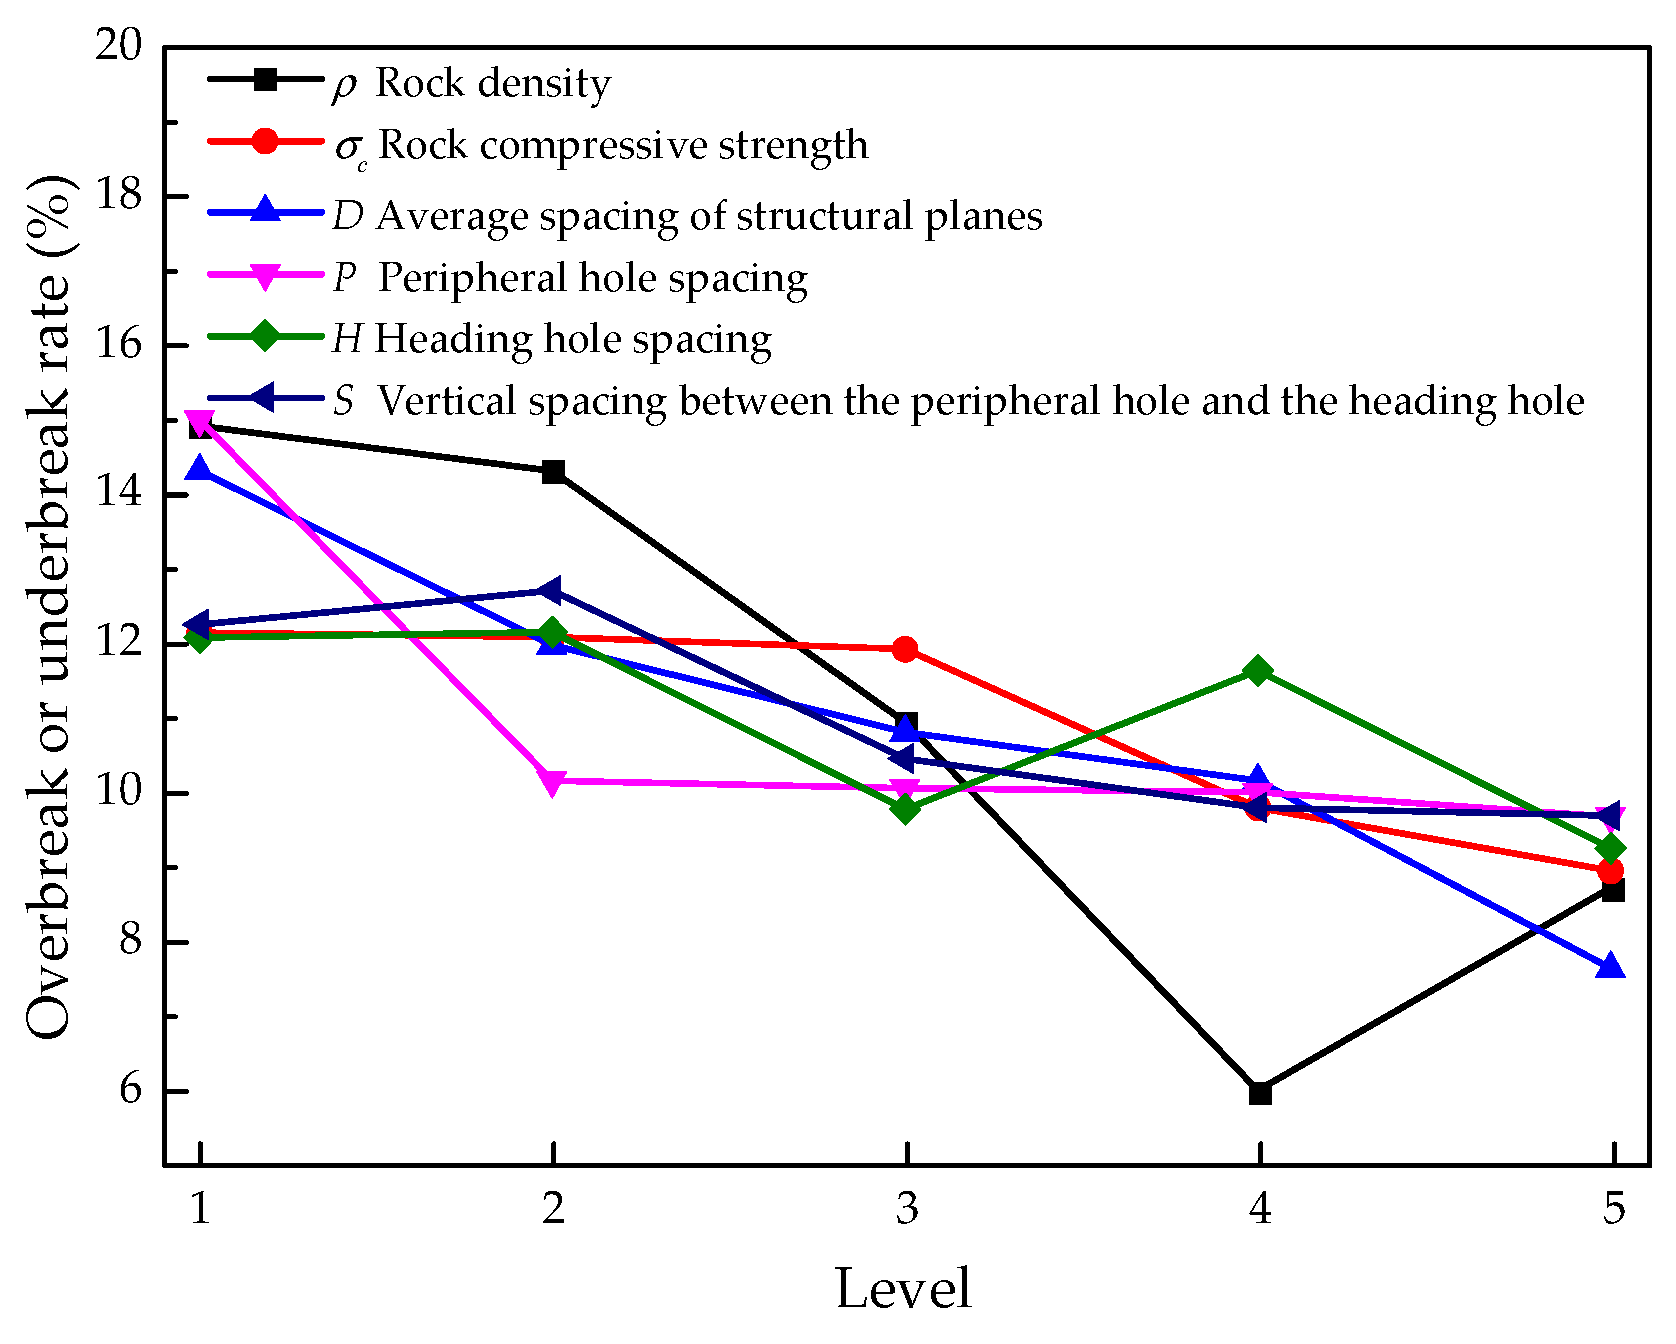
According to the main effect analysis of fuzzy mathematics theory, the maximum membership degree of the rock density, rock compressive strength, Q classification index, peripheral hole spacing, heading hole spacing, and the vertical spacing between the peripheral hole and the heading hole was , , , , , and , respectively. Given that , the order of the influence weights of these six factors was peripheral hole spacing, rock density, Q classification index, the vertical spacing between the peripheral hole and the heading hole, rock compressive strength, and heading hole spacing. The maximum degree of membership of the peripheral hole spacing was 0.274, and the peripheral hole spacing was the most influential factor. For cataclastic structure rock mass, to reduce the overbreak rate in smooth blasting, the peripheral hole spacing should be strictly controlled, and the peripheral hole spacing should not be less than 50 cm. The maximum membership degree of the Q classification index was 0.261, with a large weight, indicating that the development degree of the structural plane had a great influence on smooth blasting. The more fragmented the rock mass was, the more prone it was to overbreak.
4. Conclusions
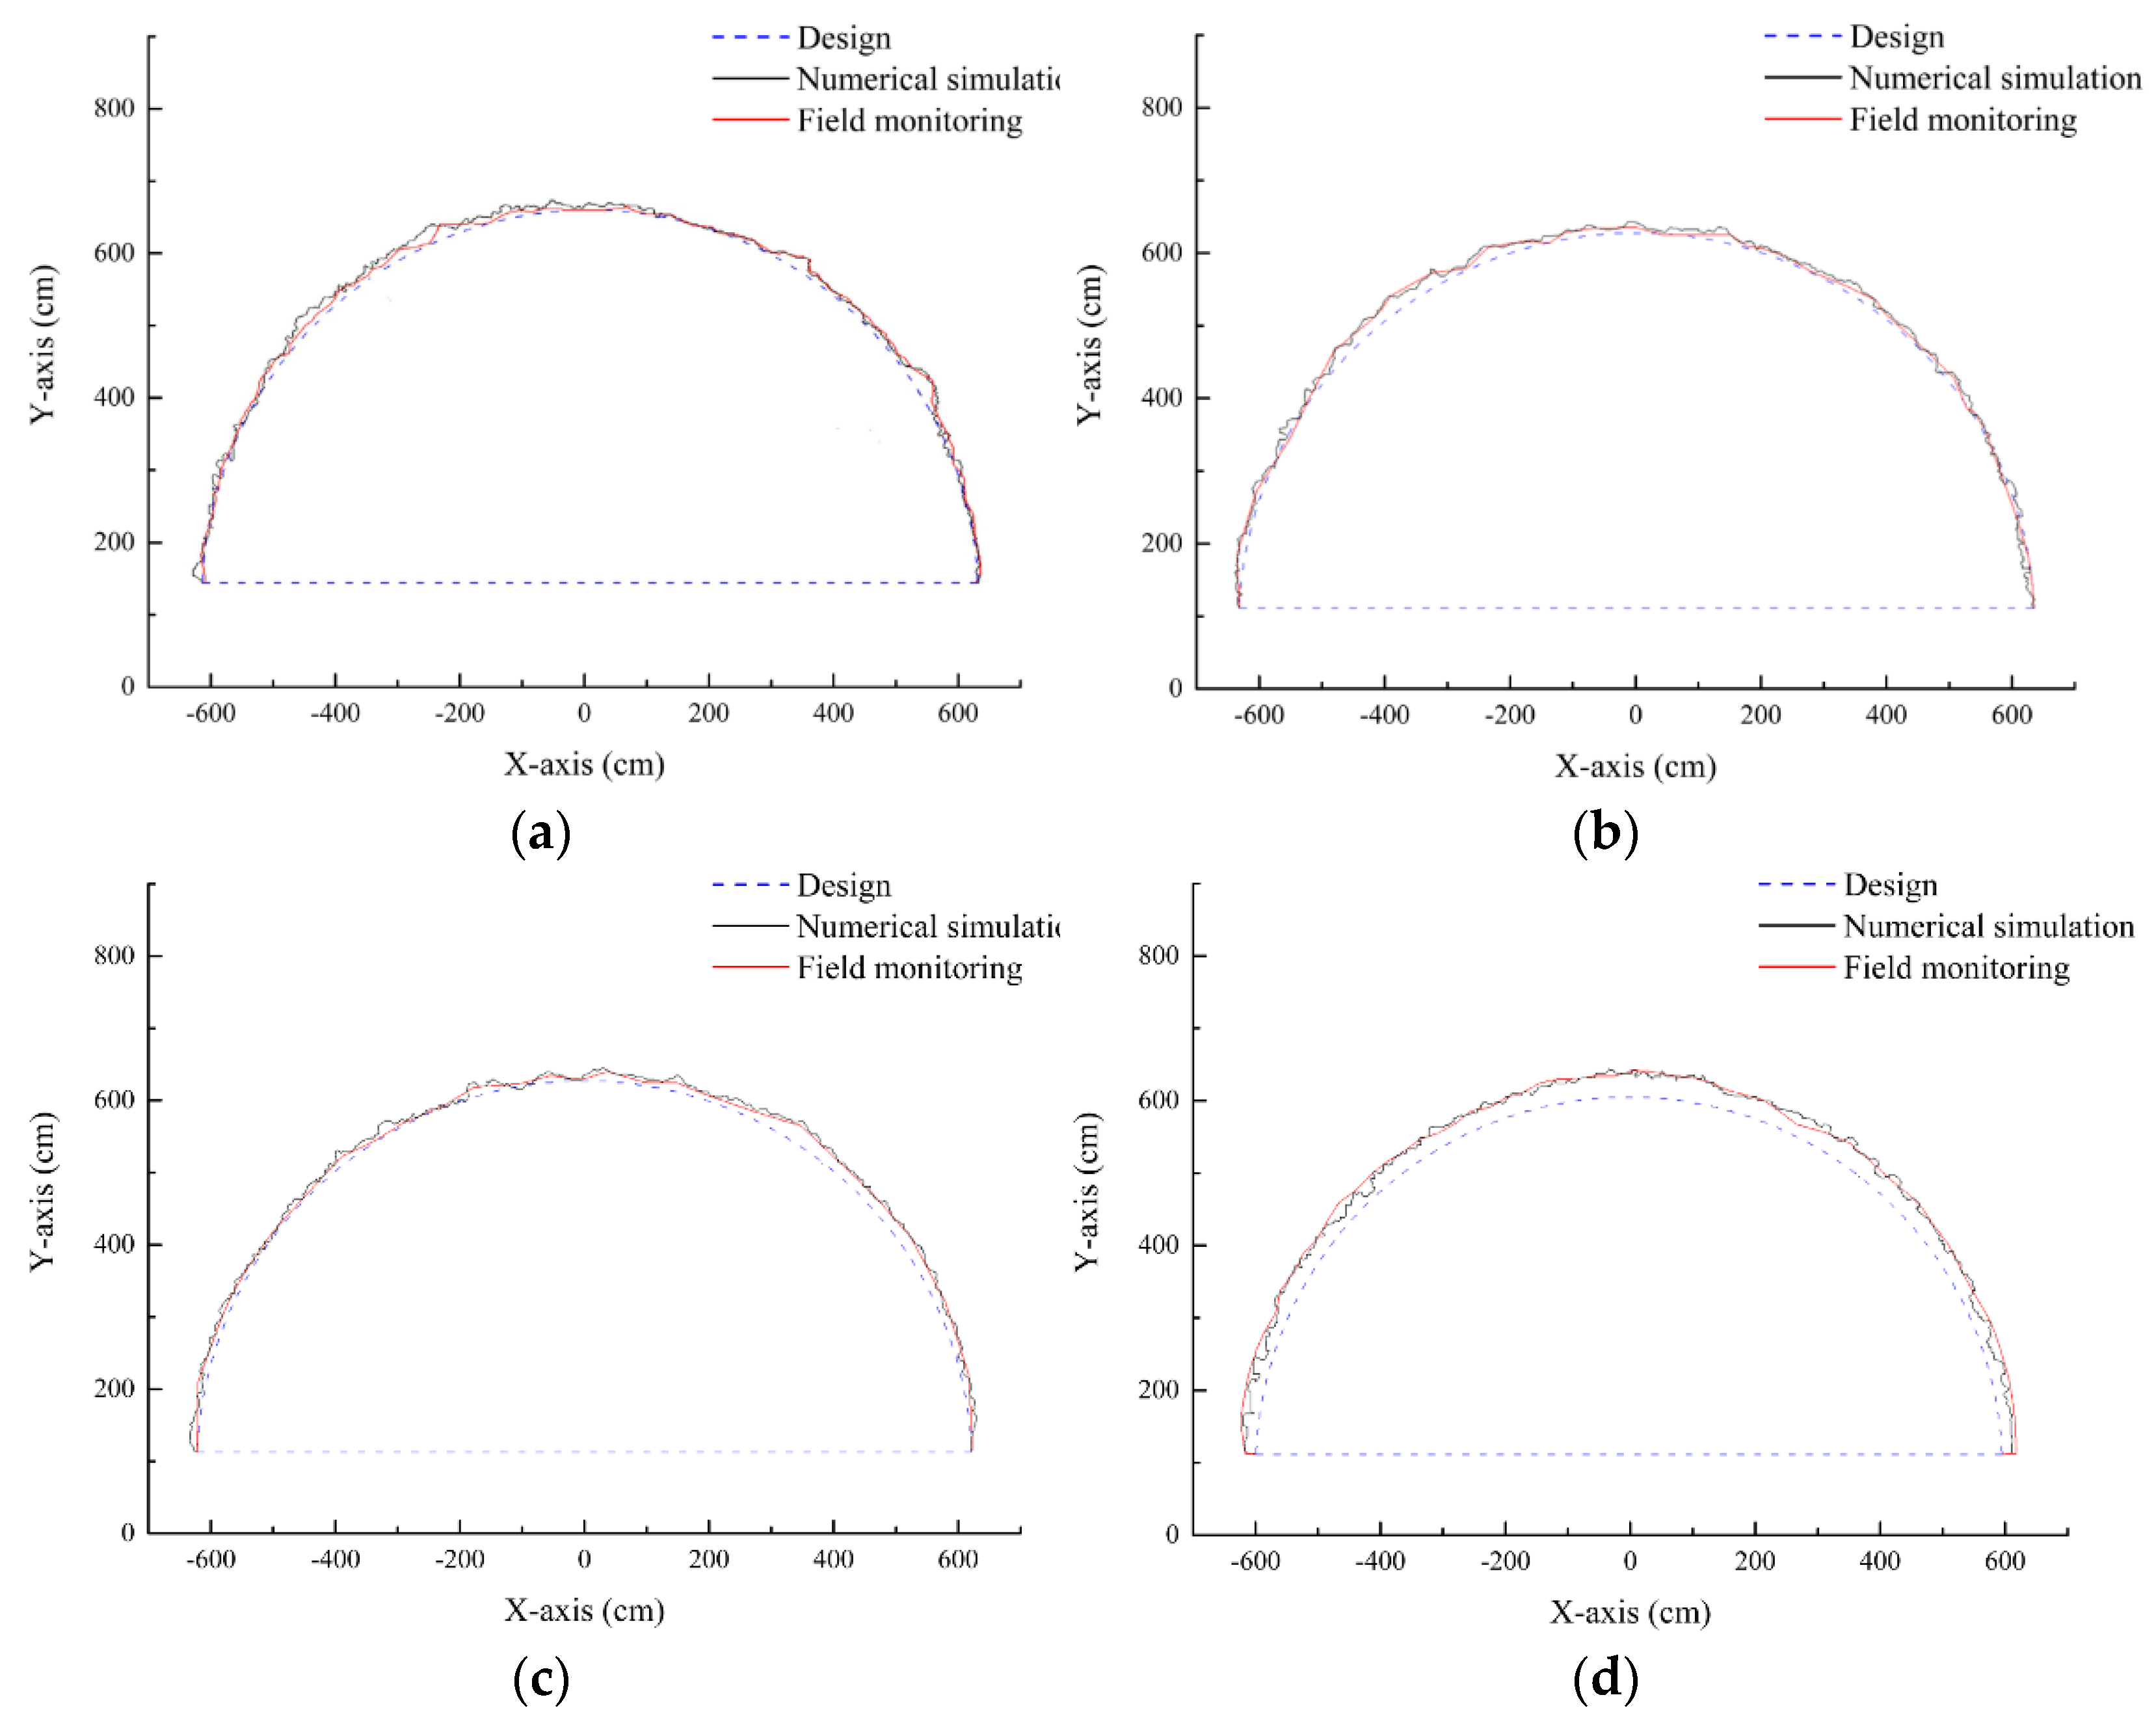
(1) With Zigaojian tunnel as background, the rock mass structure effect of smooth blasting quality in tunnels was analyzed. Onsite information collection, field monitoring, rock mass structure reconstruction in software, numerical verification and orthogonal numerical tests were performed to evaluate the rock mass structure effect.
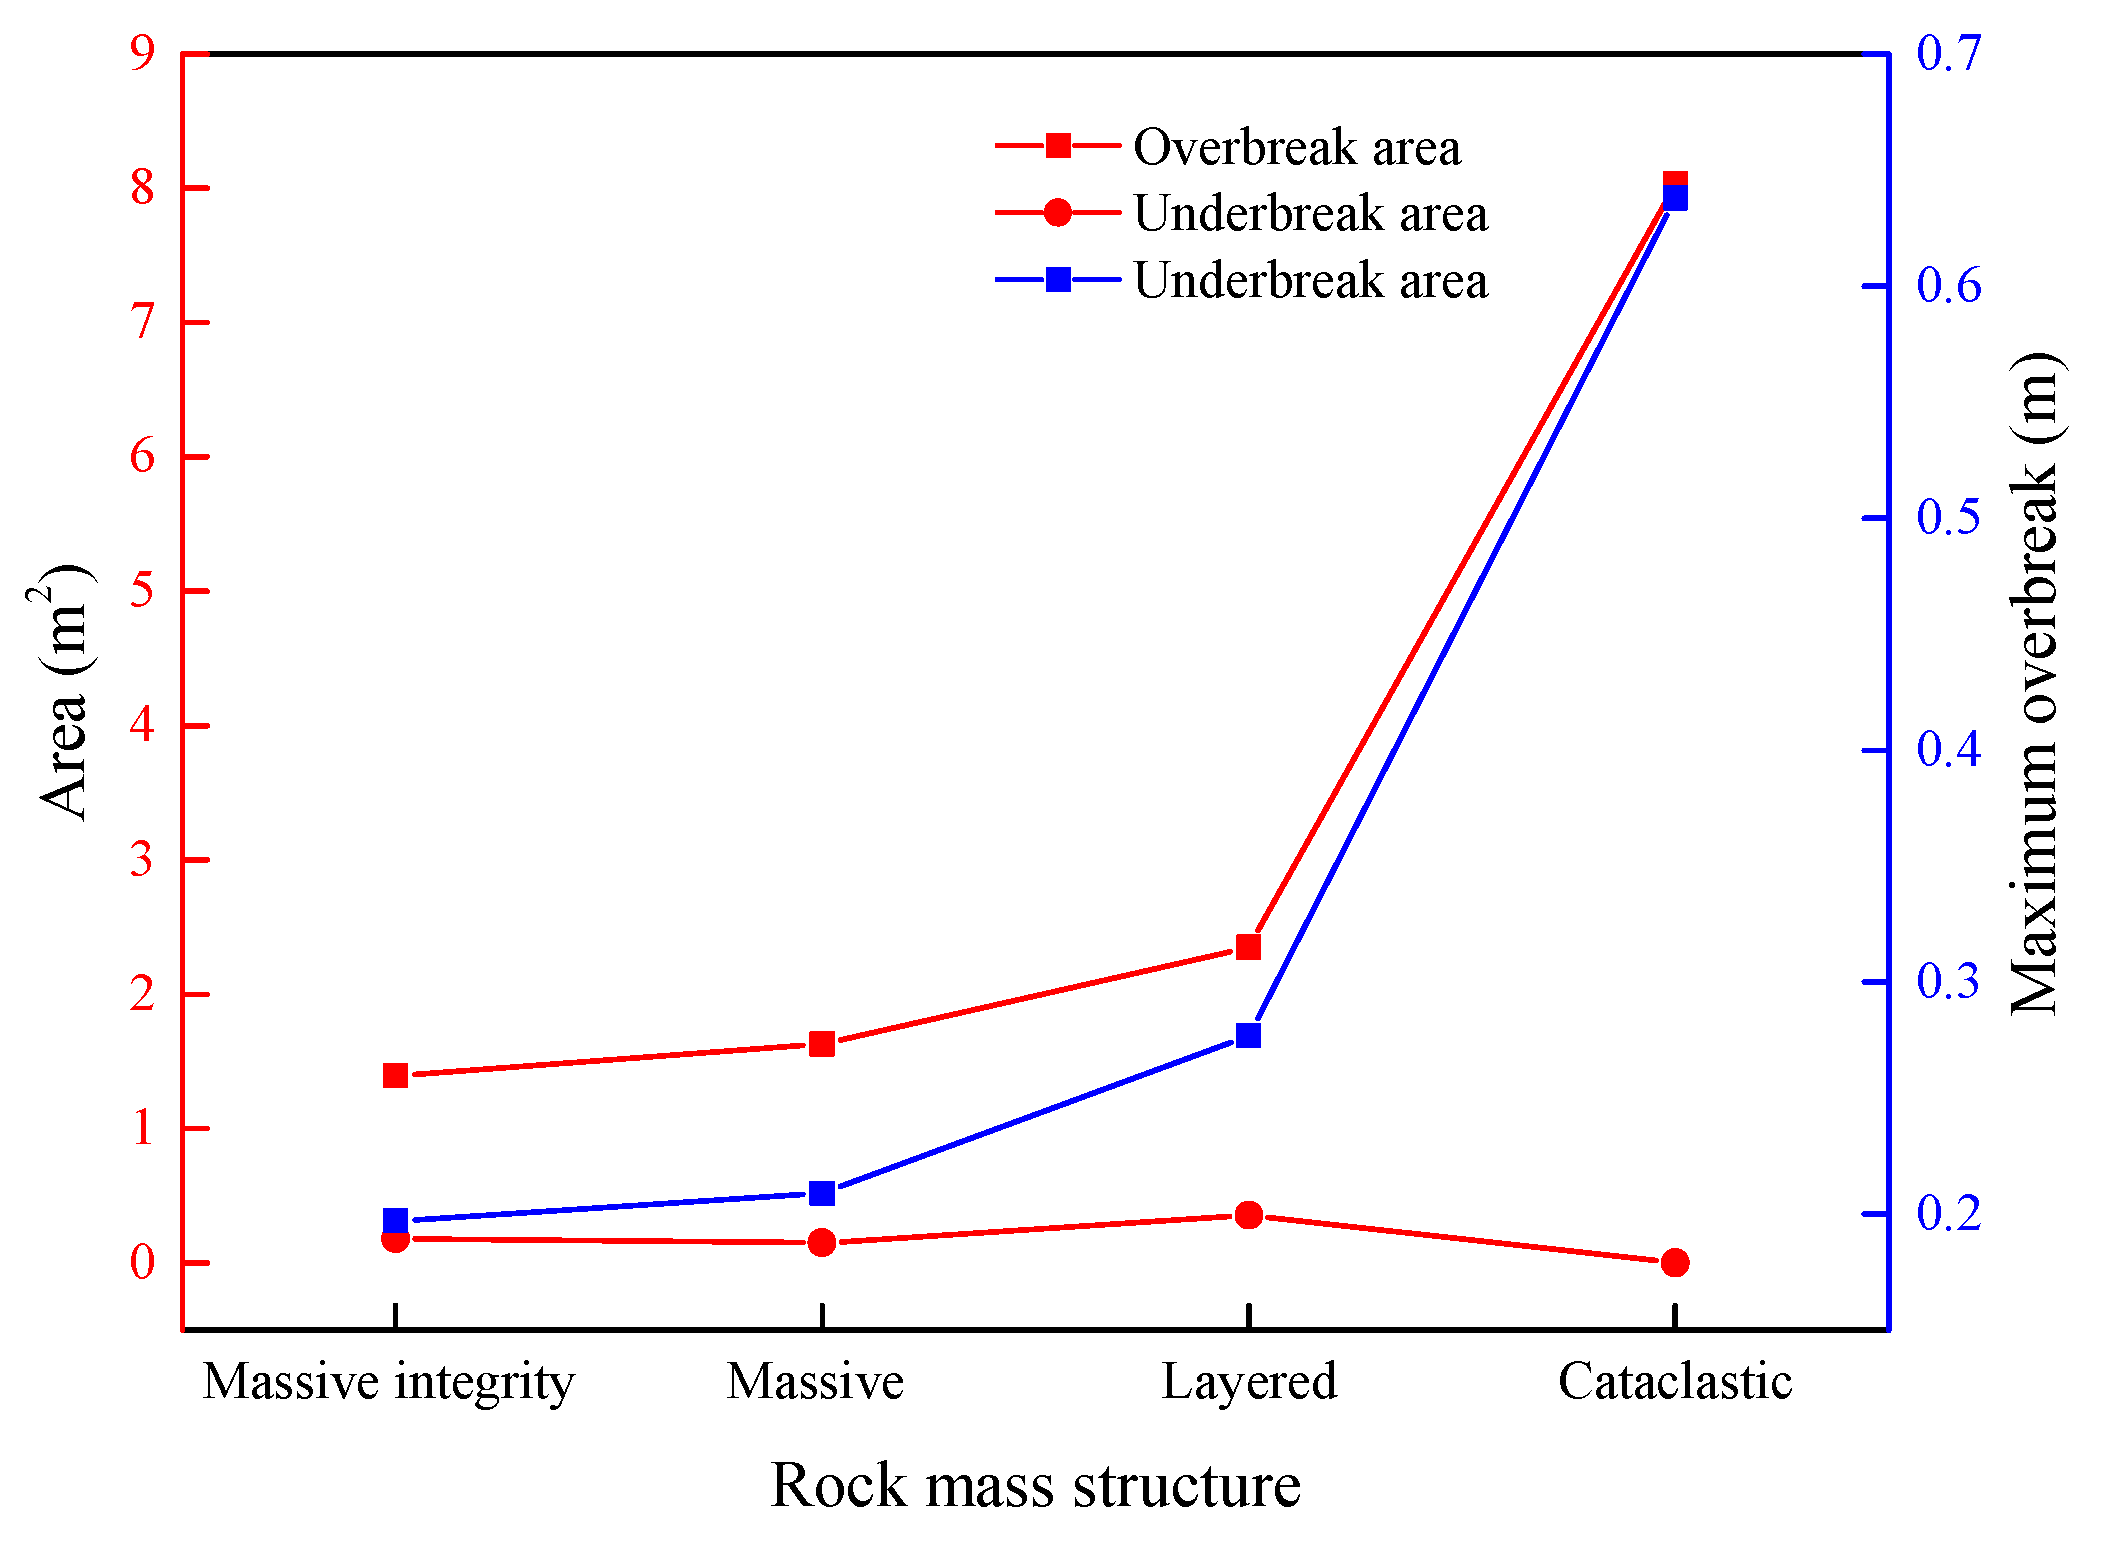
(2) The rock mass structure effect influenced the smooth blasting quality of a tunnel obviously.
(3) The tunnel smooth blasting quality decreased with the decrease in rock mass integrity. The influencing factors of rock mass structure effect depended on the rock mass structure types.
(4) The peripheral hole spacing was the most important factor affecting the smooth blasting quality of massive integrity structure rock mass and cataclastic structure rock mass. Strictly controlling the peripheral hole spacing can reduce the overbreak rate of smooth blasting.
(5) The angle between structural planes was the most important factor affecting the smooth blasting quality of massive structure rock mass, and the average spacing of structural planes was the main factor affecting the smooth blasting quality of layered structure rock mass, which was much greater than the peripheral hole spacing.
(6) The rock mass structure effect of smooth blasting quality in the tunnel can provide a reference for the rock mass structure effect of other similar cases.


 ,
, 


