Abstract
This work presents a simulation model developed with the aim to represent and study the thermal behavior of cyclotron liquid targets. Understanding and improving the thermal behavior of the target system is fundamental to improving the target overall performance, especially when using thick target windows, for which a larger amount of heat generated can be limiting. ANSYS CFX and SRIM software were used to develop a simulation model representing the IBA Nirta® Ga-68 liquid target system, to study the use of thick niobium target windows. The model was validated by comparing the results with experimental data obtained for the same liquid target system. In the present study, simulation results and temperature distributions of the main target components were obtained by studying the main parameters of interests, such as the initial temperature and mass flow rate of the coolants, and also distinct target windows with different thicknesses.
1. Introduction
Recent years have witnessed growing interest in radiopharmaceuticals labeled with several radiometals of clinical interest, such as 68Ga and 64Cu [1,2]. With the aim of improving routine supply of these relevant radiometals with enhanced ease, efforts have been made from several authors of the field in last few years to develop processes for the production of radiometals from the irradiation of liquid targets in biomedical cyclotrons [3]. Production of radiometals in liquid targets has proven to be a cost-effective, reliable technique with several practical advantages, presenting itself as a complementary alternative to the more conventional irradiation of solid targets. For instance, the technique has been successfully implemented for GMP-production of 68Ga-based radiopharmaceuticals [4].
However, as the optimal impinging energy to minimize or even prevent the co-production of undesired radionuclidic impurities depends on each production route, the fixed energy of biomedical cyclotrons is usually inadequately too high, since it was originally intended for the routine production of 18F. Therefore, in order to decrease the beam energy down to the optimal energy characteristic of each production route, there is sometimes a necessity to degrade the initial energy of the beam (e.g., the production of 68Ga or 89Zr [5,6]), by implementing thicker target windows with respect to the conventional case of the 18F liquid target [5,7]. For instance, the IBA Nirta® Ga-68 liquid target (IBA, Louvain-La-Neuve, Belgium), developed for the production of 68Ga from the proton irradiation of a 68Zn-based liquid target solution, uses thick niobium target windows instead of the conventional thin havar window used for the production of 18F. Niobium was used since its chemical inertness avoids the introduction of additional metallic impurities in the target solution [5]. The irradiation of such thicker target windows also comes, unfortunately, at the expense of significantly higher heat generated in the window, due to an increased loss of beam energy, with the potential to lead to fast material degradation or even rupture [3]. Besides, niobium is also mechanically less resistant than havar [8]. As a result, when increasing the target current, the overall target system performance can potentially be limited by the beam current withstood by these more sensitive thick target windows, rather than by high pressure generated inside the liquid target cavity. It is thus crucial to study and understand the thermal performance of the liquid target system in order to improve its capacity to remove heat, which will allow for the increase in the beam current reaching the target, and therefore will improve the overall target performance.
However, available data on the subject is scarce, due to the difficulty to experimentally measure the temperatures of the target components during irradiation. One way to overcome this problem is to develop simulations representing the thermodynamic performance of the target system by coupling the heat generated by the beam energy deposition to the temperature volumetric distributions. With the purpose of studying solid/liquid targets in cyclotrons, several works developed thermal models relying on computational fluid dynamics (CFD) software, coupled with the energy deposited by incident particle calculated through Monte Carlo simulations [9,10,11,12,13,14,15]. The main thermal and physical properties of the target components are determined, and, in some cases, the influence of the coolant mass flow rate is studied.
In the present work, a simulation platform representing the thermal performance of the IBA Nirta® Ga-68 liquid target system was developed to study the influence of the use of thick Niobium target windows when compared to the standard use of thin havar. Validation of the model developed was achieved by comparing the results obtained to temperatures experimentally measured in the same liquid target system by do Carmo et al. [16]. Multiple simulation runs were also carried out, aiming to study the influence of the main relevant parameters on the output results.
2. Materials and Methods
The thermodynamic behavior of the IBA Nirta® Ga-68 liquid target system was implemented on the ANSYS-CFX (v. 19.2, ANSYS, Inc., Canonsburg, PA, USA) software based on the governing equations and finite element method (FEM). This software proves to be a reliable tool to simulate transient states of thermal and flow physics, and it is often used in the nuclear, mechanical, and aeronautical industries [17,18,19]. The components composing the liquid target system were designed as represented in Figure 1, and their discretization was performed using a mesh consisting of tetrahedron elements the properties listed in Table 1.
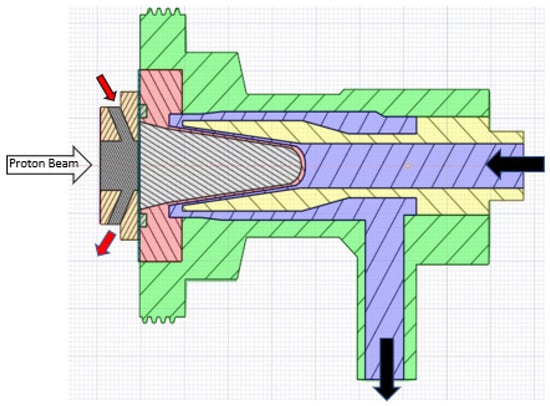
Figure 1.
Schematic of the liquid target system composed by the niobium conical target (red), the target window (dark green), the aluminum diffuser (yellow), the aluminum target support (light green), the aluminum window spacer (orange), the titanium entrance window (blue), the fluid domains, water cooling channels (purple), the helium cooling domain (dark grey), and the liquid target cavity (light grey). The inlet and outlet of both the coolants domains are represented by the black arrows (cooling water) and red arrows (cooling helium).

Table 1.
Parameters for the evaluation of the mesh quality and correspondent standard deviation, as used in the less demanding mesh.
As represented in Figure 1, the 18 MeV proton beam reaches the titanium window, passes through a 9.5 mm diameter collimator containing the cooling helium domain, then through the target window, before finally reaching the liquid target. For a routine irradiation, the proton current it is approximately 60 µA, resulting in a total deployed power of approximately 1000 W. The mechanisms responsible for removing the generated heat in the target system are gaseous helium (with a typical flow of about 1–3 L/s) flowing between the two windows and directed to impinge on the inner target window, and also the cooling water (with a typical flow known to be about 2 L/min), which enters at the back of the target, flows between the conical insert and the diffuser, and finally, between the diffuser and the support, until leaving the target system (Figure 1). The heat generated by the beam is transferred to the cooling helium and refrigerated water by convection.
The distribution of energy deposited by the proton beam was calculated by relying on the stopping-powers calculated using the Stopping and Range of Ions in Matter (SRIM-2013) software, in which the density of the liquid target was selected so that the Bragg peak of the proton beam matched, and was located at the very end of the liquid target cavity geometry. The shape of the distribution of stopping-power, i.e., the heat generated by the proton beam, was implemented on the simulation platform by defining several distinct energy sources on the ANSYS model developed. Due to the nearly constant stopping power at the windows, a cylindrical energy source was defined in the target window with a diameter of 9.5 mm, corresponding to the diameter of the beam, due to the collimator located before the titanium window. The energy lost in the target window was uniformly distributed on this energy source. For the liquid target, considering the variable energy deposition of the incident beam characterized by the shape of the Bragg peak, the local mean deposited energy was distributed in eight cylinders (i.e., eight energy sources) distributed along the liquid target in order to approximate the Bragg Curve, as represented in Figure 2. The diameter of the first two cylinders correspond to the beam 9.5 mm diameter, whereas the size of the remaining cylinders was reduced and defined so that the heat generated by the beam was still located inside the liquid target (as the diameter of the cavity decreases at the end).
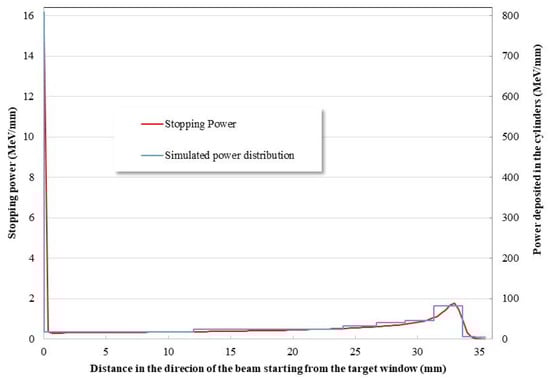
Figure 2.
Stopping power of the proton beam along its trajectory (grey curve) and simulated matching power distribution used in the simulations (black curve).
The developed method does not include gas phase transitions and boiling/condensation of the water inside the target, in order to keep computational requirements within standard specifications (a commercial PC). The target cavity was considered to be full of liquid water at constant atmospheric pressure with density 997 kg/m3 and specific heat capacity at constant pressure of 4181.7 J/(kg.K). Gravity and density differences were considered through buoyance, and turbulence was modeled by the k-ε model. Both helium and the cooling water were implemented as a fluid domain, with inlets and outlets defined as shown in Figure 1. The external surface of the target components in contact with the surrounding air was defined with a boundary condition with a constant temperature. On the other hand, the titanium window surface located on the vacuum side was defined as an adiabatic wall.
Standard initial conditions for the simulations were established as a reference to provide means of comparison for further simulation results. This latter corresponds to the liquid target system equipped with 35 µm thin havar foil as an entrance window in order to match the experimental system used by do Carmo et al. [16], whose results are further used for validation. These standard initial conditions care presented in Table 2.
Table 2.
Standards initial conditions of the simulations.
Furthermore, several simulations were performed with distinct initial conditions for the main cooling characteristics of the target system in order to evaluate their influence and to validate the model developed. The parameters with impact on the thermodynamic behavior of the target chosen for these studies were:
- the mass flow rates of the helium and the cooling water;
- the initial temperatures of the helium and the cooling water;
- the current of the proton beam (i.e., the energy deposited).
Considering that both the target window and the conical insert are expected to reach significantly high temperatures, it is important to take into account the temperature dependence of the thermodynamic properties of the material involved, such as the specific heat, , and thermal conductivity, . Since the temperature dependence of and were not available in the literature for the specific case of havar, both of these properties were estimated based on data for similar cobalt-based alloys [20,21]. These characteristics were defined for havar and niobium by the following expressions (represented in Figure 3), as in [20,22]:
where the superscripts and stand for havar and niobium, respectively, is the temperature in Kelvin, the specific heat comes in [J kg−1 K−1], and the thermal conductivity in [W m−1 K−1].
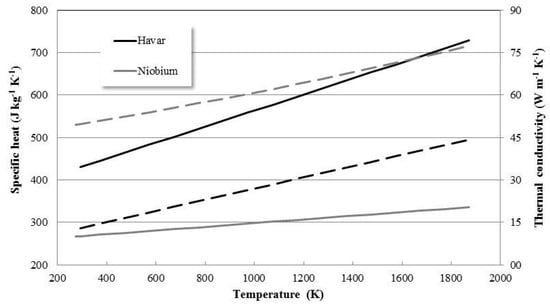
Figure 3.
Specific heat (full lines) and thermal conductivity (dash lines) of havar (black lines) and niobium (grey lines) as a function of the temperature.
Considering that CFD simulations are time step- or mesh-dependent, the influence of these parameters was studied by using finer meshes and reduced time steps. Simulations of 90 iterations with a time step of 2 s (enabling to reach equilibrium) and the mesh specified in Table 1 were found to present consistent results, while requiring less demanding computational efforts. More details can be found in [23].
3. Results
3.1. Standard Target Window
The ANSYS CFX software allows the 3D graphical representation of the several variables of interest that can be retrieved, in any of the components and at any time, as represented in Figure 4, Figure 5, Figure 6, Figure 7, Figure 8 and Figure 9.
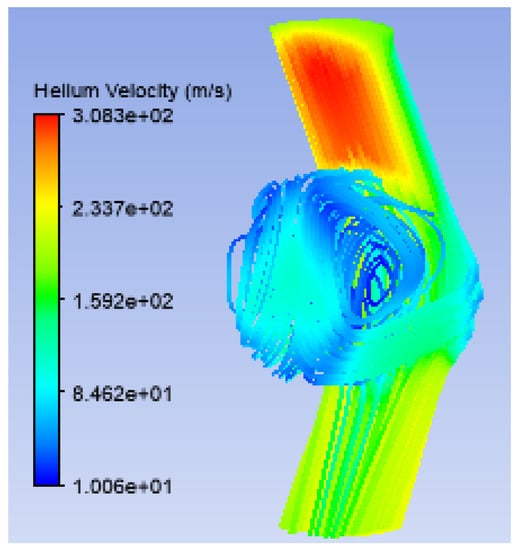
Figure 4.
Velocity of helium inside its domain between the two windows, with standard initial conditions.
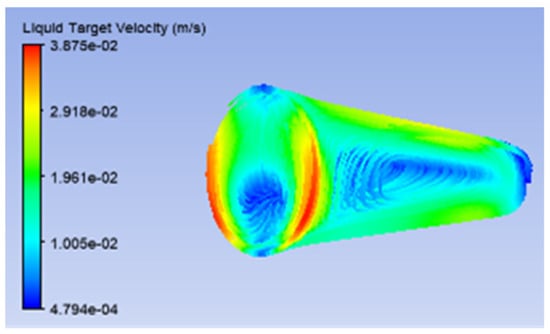
Figure 5.
Velocity of the liquid target inside the target cavity with standard initial conditions.
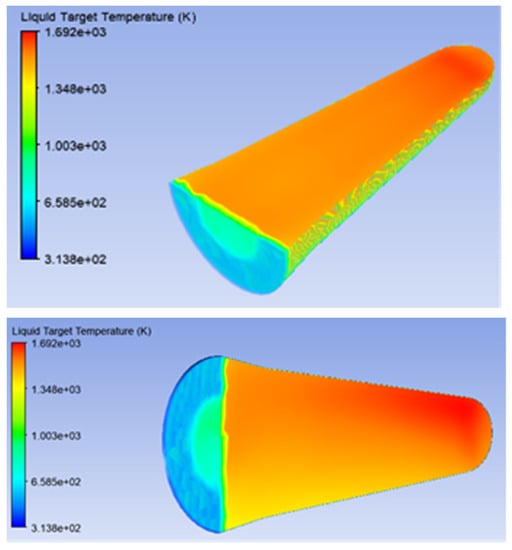
Figure 6.
Temperature of the liquid target in horizontal (top) and vertical (bottom) cuts.
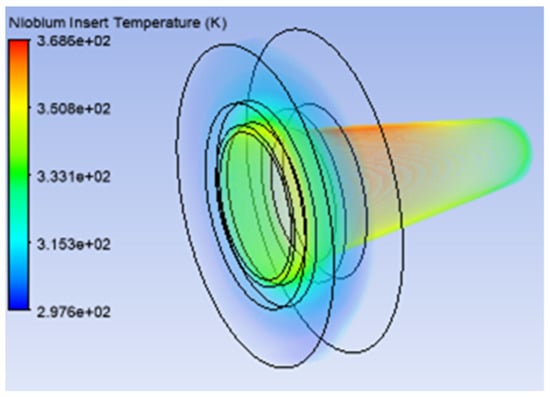
Figure 7.
Temperature of the surface of the niobium insert in contact with the cooling water.
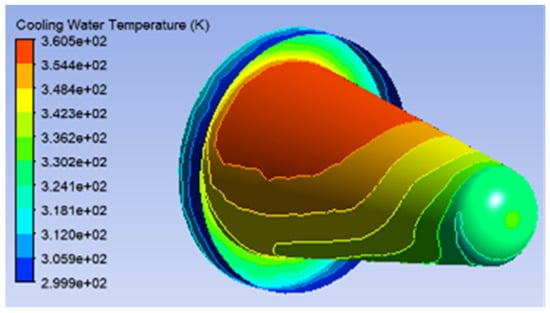
Figure 8.
Temperature of the surface of the cooling water in contact with the niobium insert.
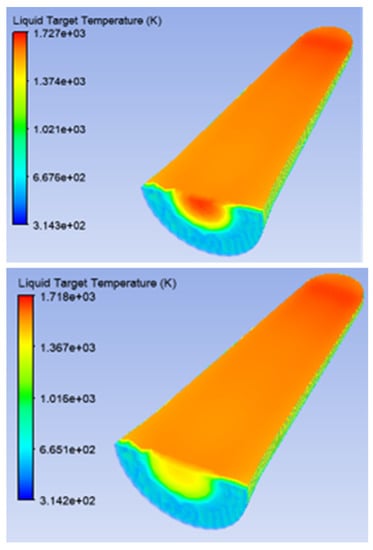
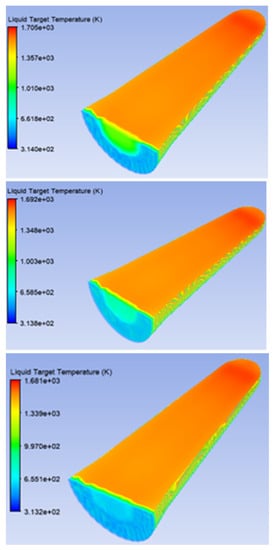
Figure 9.
Temperature of the liquid target for helium mass flow rates of 0.1, 0.3, 1, 3 and 8 L/s (from top to bottom).
Figure 6 shows that the temperatures in the liquid target are higher in the very end of the liquid target, precisely at the location of the Bragg peak. This result shows that the energy deposited by the beam is implemented as intended. Moreover, Figure 6 shows that, for a given depth inside the liquid target, temperatures are higher in the upper part of the liquid target because of the effect of gravity. This is also observed in Figure 7 and Figure 8, where the temperatures of the conical insert and cooling water are higher in the upper location of both domains. However, the maximum temperature in these domains is closer to the target window than to the end of the cavity where the Bragg peak occurs, due to the contribution of the heating of the target window.
Figure 9 shows that increasing the helium mass flow rate impinging on the target window results in a significant reduction of the temperatures of the liquid target on the location at the window surface. It is also possible to visualize that the helium flow has, as expected, no effect on the remaining locations of the liquid target, i.e., away from the window surface.
Quantitative study of the thermodynamics behavior of the simulated system is also possible, as any variable of interest can be retrieved in any of the components at any time. For instance, Figure 10 illustrates the fact that the temperature of the liquid target increases along the beam patch inside the liquid target, reaching its maximum close to the end of the liquid target cavity, i.e., where the Bragg peak occurs. The temperature of the liquid target decreases significantly at its extremities: (i) first, in the vicinity of the target window, as the liquid target is in contact with the target window cooled by the helium flux; and also (ii) at the very end of the cavity as the liquid target then contacts with the niobium cooled by the refrigerated water. Figure 11 shows the cross section of the temperature of the target window in the direction of gravity, i.e., in a direction perpendicular to the beam patch. Figure 11 illustrates that the temperature of the target window is considerably lower outside the beam spot, and also confirms that reducing the helium mass flow rate from 3 down to 0.1 L/s significantly reduces the heat removal, as the temperature of the window then increases considerably. Another possible observation is that the cross section of the temperature is asymmetric for the standard helium mass flow rate, with higher temperatures in the upper half of the window. This is a consequence of the gravity effect, where the heat transferred to liquid target and conical insert leads to higher temperatures in this location (as illustrated for other domains in Figure 6, Figure 7 and Figure 8). However, this effect of gravity becomes negligible for the lower flow rate of 0.1 L/s, i.e., when higher temperatures are achieved in the window due to the reduction of heat removal, leading then to a symmetric distribution of the temperature along the window’s height.
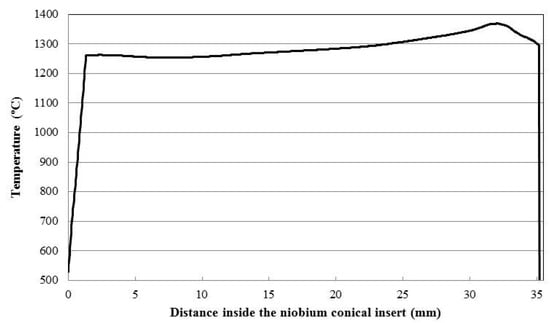
Figure 10.
Temperature of the liquid target at the axis of the cavity, along the beam patch.
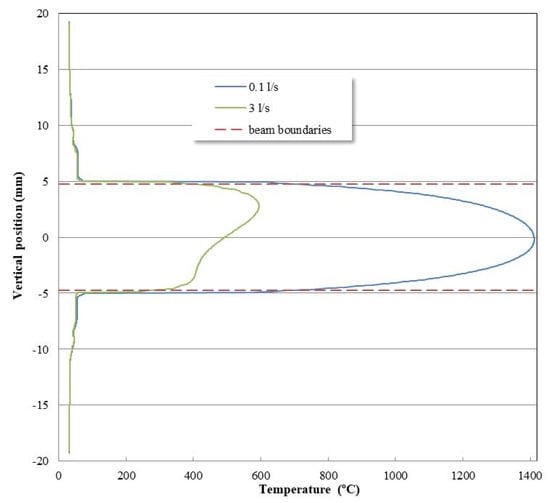
Figure 11.
Temperature of the target window on its surface in contact with the liquid target for helium cooling fluxes of 0.1 and 3 L/s.
Multiple simulations runs were realized with different values of power, namely 250, 500, 750, and 1000 W, to simulate distinct target currents. These runs were made for two different values of the mass flow rate of the cooling water, of 1 and 3 L/min. Figure 12 shows that the maximum temperatures reached in the liquid target, target window, and niobium insert increase linearly with the target current for both mass flow rates. As expected, the temperature increments in the niobium insert are small, when compared to the increments verified in the target window and liquid target. This fact is explained as the beam deposits its energy on the target window and the liquid target. Concerning the mass flow rate, it is possible to conclude that it has relevant influence on the temperatures of the niobium insert and liquid target. On the other hand, it has almost no influence on the maximum temperature achieved in the target window, as expected, considering that the cooling water flows at a greater distance from the window. As shown in Figure 13, the temperature of the cooling water at the outlet also increases linearly with the target current/deposited power, due to the increasing heat transferred to the cooling water. Figure 13 also indicates that the increment in temperature of the cooling water at the outlet is quantitatively dependent on the water mass flow rates. Such results are in agreement with experimental data collected by do Carmo et al. [16], not only because a linear temperature increment in the cooling water of about 1 °C per 10 µA was experimentally measured, but also because such empirical value (achieved with a mass flow rate known to be around 1–2 L/min) is quantitatively in agreement with the results presented in Figure 13 for the simulated flows of 1 and 3 L/min (corresponding to increments of about 1.5 and 0.5 °C per 10 µA respectively).
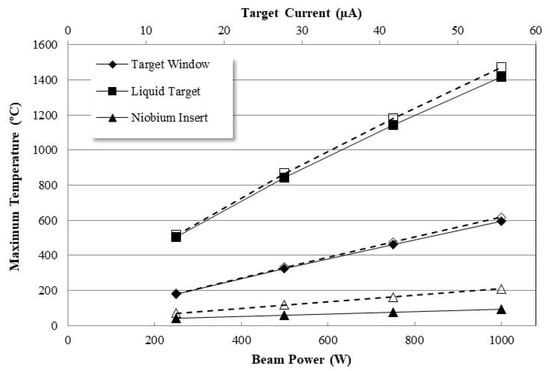
Figure 12.
Maximum temperature of the target window, liquid target, and niobium insert, as a function of the beam power (and corresponding target current), for two flow rates of the cooling water of 1 (open symbols) and 3 L/min (full symbols).
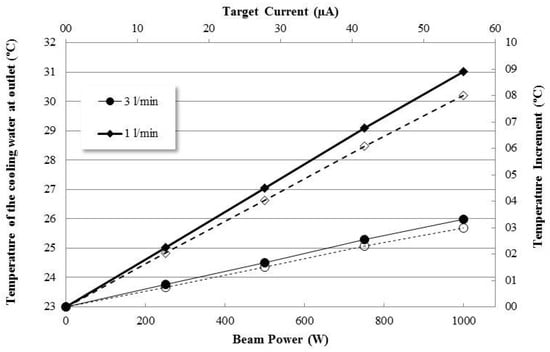
Figure 13.
Absolute temperature at outlet (full symbols) and temperature increment (open symbols) for the cooling water as a function of the beam power (and corresponding target current), for two flow rates of the cooling water.
Simulations runs were also conducted with different mass flow rates of the cooling water, to test the influence of the cooling water on the temperatures of the several components of the liquid target system. Figure 14 shows that decreasing the mass flow rate of the cooling water below about 3 L/s results in a significant increase of the maximum temperatures of the liquid target, the niobium insert, and, even further away, the target window. This result confirms the importance of the cooling water in removing heat from the target system. Figure 14 also shows that increasing the mass flow rate beyond the standard established of 3 L/s only allows a slight reduction in the maximum temperatures in the niobium insert and liquid target temperatures, whereas almost no improvement is then observed in the maximum temperature reached in the target window. This result is expected, since the cooling water flows in contact with the external surface of the niobium insert, which, in turn, is in contact with the liquid target, but away from the window. These simulations also enable to confirm that the outlet temperature of the cooling water increases significantly as its mass flow rate decreases, as illustrated in Figure 15.
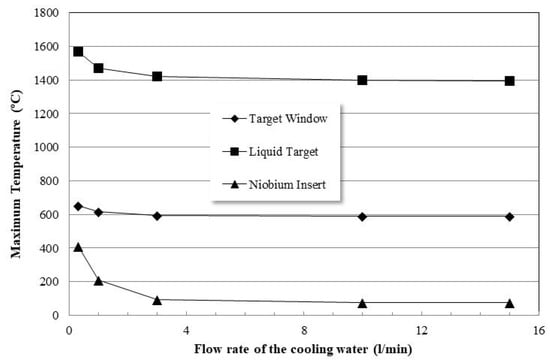
Figure 14.
Maximum temperatures of the target window, liquid target and niobium insert as a function of the flow rate of the cooling water.
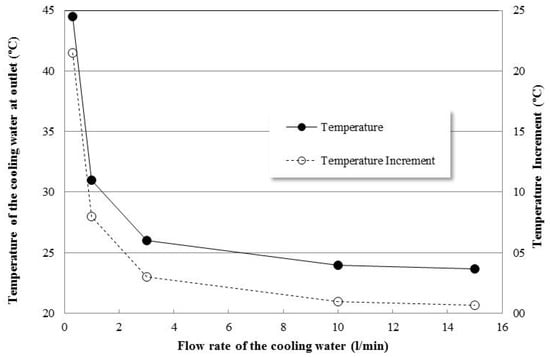
Figure 15.
Absolute temperature at outlet (full symbols) and temperature increment (open symbols) of the cooling water as a function of the flow rate of the cooling water.
Simulations runs were also conducted to study the influence of the initial temperature of the cooling water in removing the heat from the target system. As shown in Figure 16, the initial temperature of the cooling water presents almost no influence in the maximum temperatures of the target components. The behavior is identical for the two mass flow rates simulated. As expected, Figure 17 shows that the temperature of the cooling water at the outlet increases accordingly with its initial temperature, showing identical behavior for the two mass flow rates simulated. It is also worst notice that Figure 17 confirms that the temperature increment is naturally higher for smaller values of mass flow rate. Figure 17 also indicates that the higher the initial temperature, the smaller the increment in the temperature of the cooling water. This result can be explained by the fact that the higher the initial temperature of the cooling water, the closer its temperature is to the temperature of the niobium insert, resulting in a decrease of the heat transferred to the water. Such a result is also in agreement with experimental observations obtained by do Carmo et al. [16] (p. 6) for distinct initial temperatures of the cooling water and with fixed mass flow rate, as a higher initial temperature of the cooling water also led to smaller temperature increments (although the narrower 23–32 °C range of initial temperatures in this latter led to smaller variations in the temperature increments).
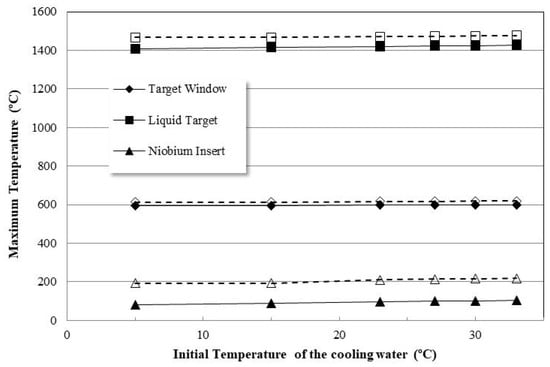
Figure 16.
Maximum temperatures of the target window, liquid target and niobium insert as a function of the initial temperature of the cooling water, for two flow rates of the cooling water of 1 (open symbols) and 3 L/min (full symbols).
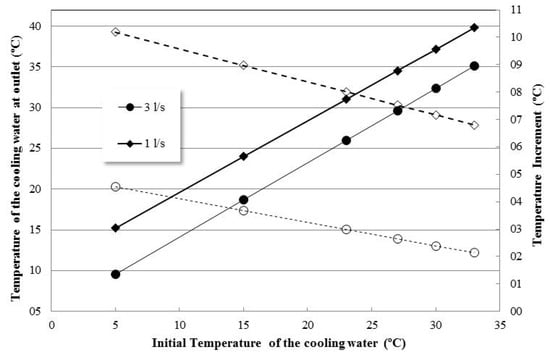
Figure 17.
Absolute temperature at outlet (full symbols) and temperature increment (open symbols) of the cooling water as a function of the initial temperature of the cooling water, for two different flow rates.
In analogy to the studies conducted to analyze the influence of the cooling water on the target system, simulations were carried out to verify the influence of the helium responsible for removing the heat from the target windows by using different values for its initial temperature and its mass flow rate. Figure 18 confirms that the maximum temperatures of the niobium insert and liquid target are not influenced by the initial temperature of the helium. On the other hand, the temperature of the target window is slightly influenced by the helium initial temperature, although the differences are almost negligible. These results allowed us to conclude that reducing the temperature of the cooling helium does not improve the capacity to remove heat from the target system, not even on the target foil where this latter impinges.
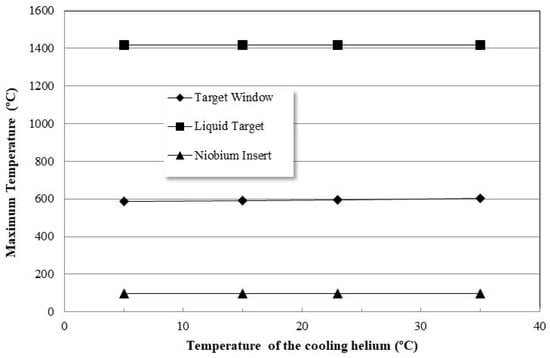
Figure 18.
Maximum temperatures of the target window, liquid target, and niobium insert as a function of the initial temperature of the cooling helium.
Concerning the influence of the helium mass flow rate, Figure 19 shows that the maximum temperatures of the niobium insert and liquid target are both almost non-influenced. On the contrary, the latter presents significant influence on the maximum temperature achieved in the target window, as expected. For instance, improving the mass flow rate of helium from 1 to 3 L/s allows for the reduction of the maximum temperature in the window from 800 to approximately 600 °C. It is also possible to observe that a smaller values of the mass flow rate result in a much larger increase of the temperature of the window, emphasizing that the helium flow plays a crucial role in removing the capacity to remove heat from the target window. Finally, the helium temperature at the outlet follows the trend of the maximum temperature of the target window.
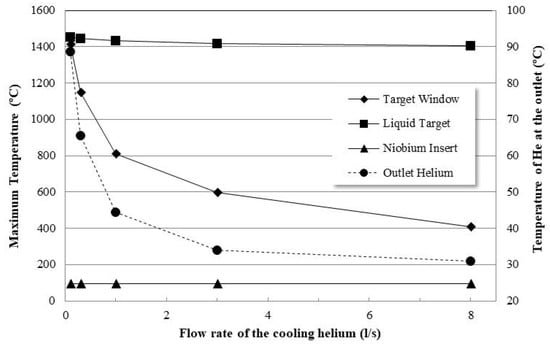
Figure 19.
Maximum temperatures of the target window, liquid target, niobium insert (full lines) and temperature of the cooling helium at outlet (dashed line) as a function of the flow rate of the cooling helium.
Since the heat generated at the window is proportional to the energy deposited, a distinct simulation, with 250 W of deployed power instead of the standard 1000 W, was realized, with the purpose to study the importance of the helium cooling, depending on the target current simulated. As shown in Figure 20, the larger the energy deployed and, consequently, the heat generated at the window, the more influent the mass flow rate of the cooling helium is in reducing the temperature of the target window. This result proves the growing importance of the helium mass flow rate to effectively remove the heat from the target system as larger target currents are used.
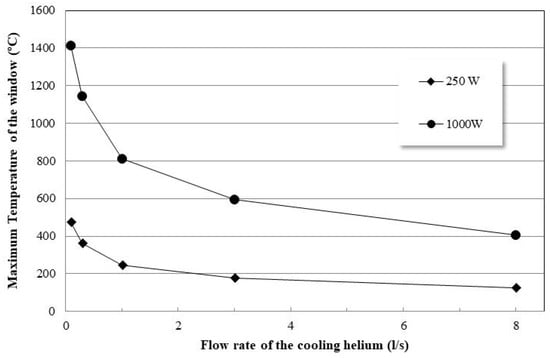
Figure 20.
Maximum temperatures of the target window as a function of the flow rate of the cooling helium, for two distinct powers of 250 and 1000 W.
3.2. Thick Niobium Target Windows
As previously mentioned, thick niobium windows were implemented on the IBA Nirta® Ga-68 liquid target system, therefore bringing performance challenges associated with larger amounts of heat generated at the target windows. Hence, with the aim to study the thermodynamic behavior of the target system in such conditions, various simulations with multiple target windows of niobium of distinct thickness were performed. Table 3 shows the significantly increasing energy loss (heat generated) in the windows considered as its thickness increases. On the other hand, the energy lost in the liquid target consequently decreases, leading, therefore, to lower temperatures of the liquid targets, as illustrated in Figure 21 and Figure 22. For thicker windows, the heat generated by the beam in the target window is increasingly significant, leading, therefore, to larger temperatures, as shown in Figure 23. Such behavior is highlighted in Figure 21 and Figure 22, where it is possible to observe that the temperature of liquid target in the vicinity of the target window also increases as the thickness of this latter increases, especially when compared with the standard case of the havar window. Figure 23 shows that the temperature slightly increases in the windows depth towards the window surface contacting with the liquid target. This behavior is a consequence of the larger temperatures on this side on the windows, since the heat generated on the opposite side is transferred to the cooling helium flowing and to the window spacer surface.
Table 3.
Beam energy loss in the target window and the liquid target for the different target windows used.
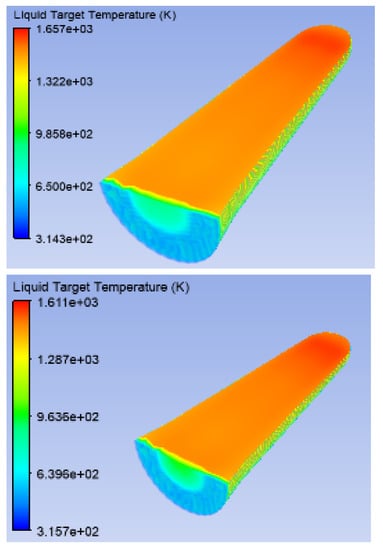
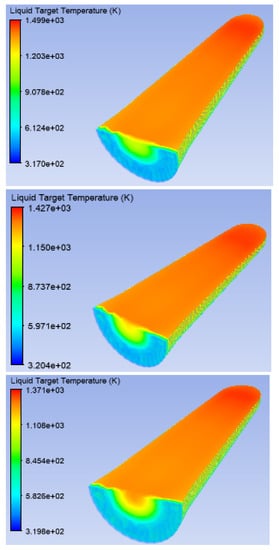
Figure 21.
Temperature of the liquid target for niobium target windows of 75, 125, 250, 325, and 375 µm (from top to bottom).
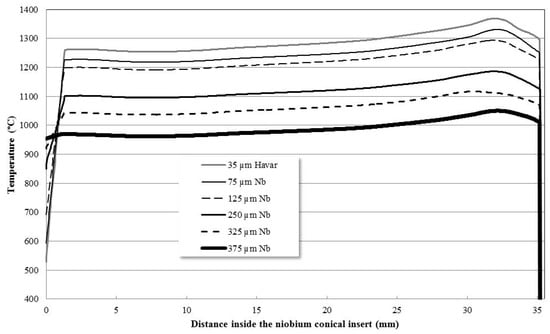
Figure 22.
Temperature of the liquid target at the axis of the cavity, along the beam patch, for the different target windows considered.
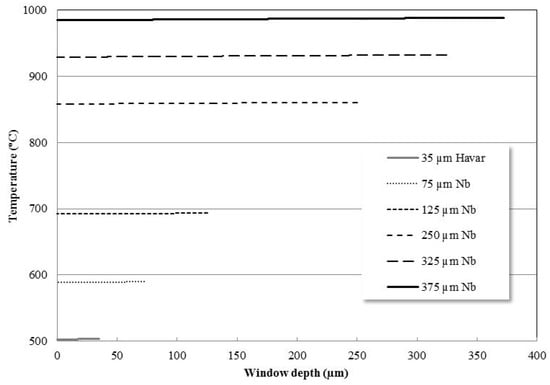
Figure 23.
Temperature of the distinct niobium target windows along their depth axis.
For all windows, the maximum temperature inside the horizontal plane of the liquid target is still always located at the end of the niobium conical insert (Bragg peak location). Figure 22 also shows that the greater the thickness, the closer the temperature of the liquid target in the vicinity of the target window is to the maximum temperature obtained.
As illustrated in Figure 24, the temperature profiles of the different windows along the vertical axis and on the surface in contact with the liquid target are very different. Figure 24 shows that the asymmetric profile of temperature observed in the havar foil due to gravity no longer occurs for thicker niobium windows. This result can be explained by the much larger heat generated that overlaps the effect of gravity, thus exhibiting a behavior similar to that observed for lower mass flow rates of He (Figure 11). Figure 24 also shows that, contrary to the case of the havar window for which the temperature drops rapidly outside the area of the window intersected by the beam, the temperature decreases more gradually in the case of thick niobium windows. Such behavior is not only due to the larger temperatures achieved with thicker niobium windows, but also to the fact that larger heat transfer by conduction from the window to the window spacer then occurs, since niobium presents larger thermal conductivity than havar, as discussed below.
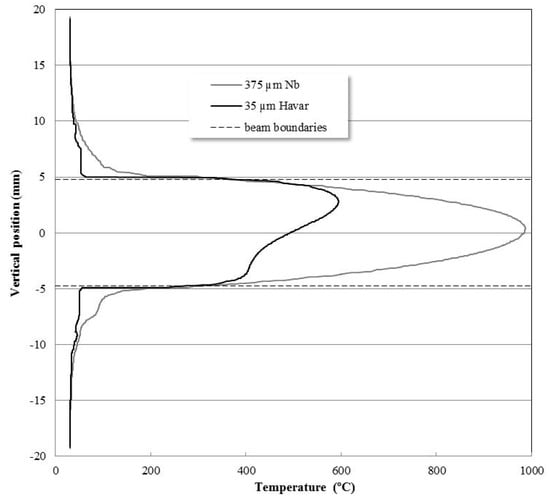
Figure 24.
Temperature of the 35 µm thick havar and 375 µm thick niobium target windows, on its surface in contact with the liquid target.
Figure 25 presents the average and maximum temperatures of the target window and the liquid target for the distinct niobium windows considered. It is possible to verify that both the average and maximum temperatures of the liquid target decrease as the thickness of the window increases. Regarding the temperatures of the niobium windows, although both the average and maximum values increase with the window thickness, only the maximum temperature is strongly influenced This confirms the fact that the heat generated in the window leads to a local increase of the temperature of target window, in the beam patch, whereas the rest of the window remains almost unaffected. Such effect is also evidenced in Figure 21, since the surface of the liquid target in contact with the target window also shows such radial temperature gradient. Figure 25 also shows that the maximum temperature of the window increases with the thickness to a point that it even surpasses the temperature average of the liquid target, and almost reaches the maximum temperature of this latter, showing that the target foil becomes a more and more critical component for the performance of the target system for thicker target windows.
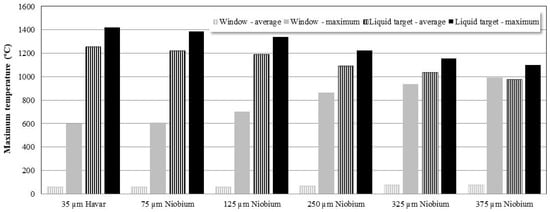
Figure 25.
Average (dashed filling) and maximum (full filling) temperatures of the target window (grey symbols) and liquid target (black symbols) for different target windows.
Additionally, simulations with multiple mass flow rates of cooling helium were conducted for all niobium windows, considered with the purpose of studying the influence of the cooling helium system as the thickness of the niobium window increased. As expected, decreasing the mass flow rate of the cooling helium leads to a significant increase in the maximum temperature for all the windows. Figure 26 shows, although the behavior for the thinner 75 µm niobium window is almost identical to the case of the havar window, that thicker niobium windows present systematically much larger maximum temperatures than the havar window. Nevertheless, comparing the case of havar with the data collected for the niobium windows for lower flow rates, it can be seen that the maximum temperatures reached in the havar window increase considerably more, to a point that these even surpass the maximum temperatures obtained in the thicker niobium windows. This result is a consequence of the smaller thermal conductivity of havar when compared with niobium (Figure 3), an effect which is dominant when helium cooling becomes almost inexistent.
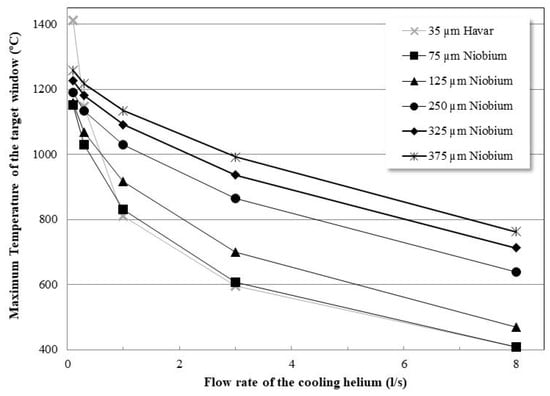
Figure 26.
Maximum temperatures of the target window as a function of the flow rate of the cooling helium, for different target windows.
Such behavior is also pointed out in Figure 27, where it is possible to confirm that the temperature of the window spacer increases more significantly with the niobium windows than in the case of havar. Indeed, Figure 27 shows that the temperature of the window spacer (initially of 31 °C for 1000 W considered, as shown in Table 2) not only almost stay unaltered with the beam, but also that it is almost independent of the helium mass flux rate. On the contrary, for the cases of the niobium windows, the maximum temperature of the window spacer increases significantly, an effect more pronounced as the mass flow rate of helium decreases, confirming thus that a part of the heat generated in the window is then transferred to this component.
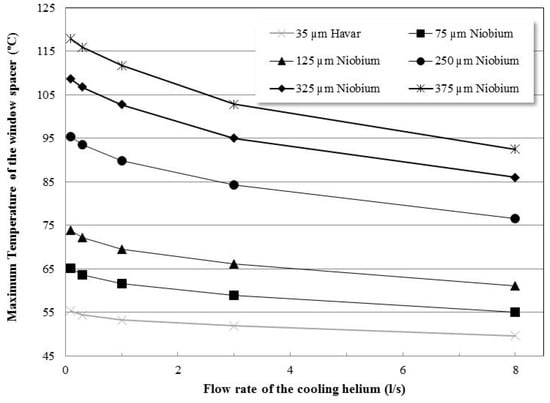
Figure 27.
Maximum temperatures of the window spacer as a function of the flow rate of the cooling helium, for different target windows.
4. Conclusions
This work presents the development of a simulation model representing the thermal behavior of the IBA Nirta® Ga-68 liquid target, by coupling the energy deposited by the beam and the thermal physics involved in the irradiation of a cyclotron liquid target. The results were compared with experimental data, allowing validation of the model. The developed model allows to obtain the temperature distributions for the main components of the liquid target system and to study the influence of the main parameters on the thermal performance of the target.
The simulation results showed that although the initial temperature of both the coolants, i.e., gaseous helium and cooling water, present almost no influence on the temperature of the target components, their mass flow rate is extremely relevant for the capacity to remove heat from the system. Increasing the mass flow rate of the cooling water results in decreasing temperatures of the niobium insert and the liquid target. On the other hand, increasing the mass flow rate of the gaseous helium significantly decreases the temperature of the target window, especially for thicker windows. Moreover, as the heat generated in the target window increases with its thickness, the effect of the cooling helium becomes more significant as the target current increases for thicker windows.
The present simulation model allowed to obtain important results related to the thermal performance of cyclotron liquid target systems. These results are particularly relevant as not possible to measure or to acquire experimentally.
Author Contributions
Conceptualization, F.A.; methodology, F.A. and S.J.C.d.C.; software, P.M.d.O.; validation, S.J.C.d.C. and F.A.; formal analysis, P.M.d.O. and S.J.C.d.C.; writing—original draft preparation, P.M.d.O.; writing—review and editing, S.J.C.d.C. and F.A.; supervision, S.J.C.d.C. and F.A. All authors have read and agreed to the published version of the manuscript.
Funding
This research received no external funding.
Institutional Review Board Statement
Not applicable.
Informed Consent Statement
Not applicable.
Conflicts of Interest
The authors declare no conflict of interest.
References
- McQuade, P.; McCarthy, D.W.; Welch, J. Metal Radionuclides for PET Imaging. In Positron Emission Tomography; Bailey, D., Townsend, D.W., Valk, P.E., Maisey, M.N., Eds.; Spinger: London, UK, 2005; pp. 237–250. [Google Scholar]
- Pagani, M.; Stone-Elander, S.; Larsson, S.A. Alternative positron emission tomography with non-conventional positron emitters: Effects of their physical properties on image quality and potential clinical applications. EJNM 1997, 24, 1301–1327. [Google Scholar] [CrossRef] [PubMed]
- do Carmo, S.J.C.; Scott, P.J.H.; Alves, F. Production of radiometals in liquid targets. EJNMMI 2020, 5, 1–21. [Google Scholar] [CrossRef] [PubMed]
- Alves, V.H.P.; Alves, F.; Abrunhosa, A. Process for Producing Gallium-68 through the Irradiation of a Solution Target. EP15170854.2. U.S. Patent 20160358683A1, 8 December 2016. [Google Scholar]
- Alves, F.; Alves, V.H.; Neves, A.C.B.; do Carmo, S.J.C.; Nactergal, B.; Hellas, V.; Kral, E.; Gonçalves-Gameiro, C.; Abrunhosa, A.J.; Gonçalves-gameiro, C. Cyclotron production of Ga-68 for human use from liquid targets: From theory to practice. AIP Conf. Proc. 2017, 1845, 020001(1)–020001(9). [Google Scholar] [CrossRef]
- Oehlke, E.; Hoehr, C.; Hou, X.; Hanemaayer, V.; Zeisler, S.; Adam, M.J.; Ruth, T.J.; Celler, A.; Buckley, K.; Benard, F. Production of Y-86 and other radiometals for research purposes using a solution target system. Nucl. Med. Biol. 2015, 42, 842–849. [Google Scholar] [CrossRef] [PubMed]
- Alves, F.; Alves, V.H.; do Carmo, S.J.C.; Neves, A.C.B.; Silva, M.; Abrunhosa, A.J. Production of copper-64 and gallium-68 with a medical cyclotron using liquid targets. Mod. Phys. Lett. A 2017, 32, 1740013. [Google Scholar] [CrossRef]
- Cyclotron Produced Radionuclides: Operation and Maintenance of Gas and Liquid Targets; IAEA Radioisotopes and Radiopharmaceuticals Series nº4; International Atomic Energy Agency: Vienna, Austria, 2012; Available online: https://www.iaea.org/publications/8783/cyclotron-produced-radionuclides-operation-and-maintenance-of-gas-and-liquid-targets (accessed on 24 May 2021).
- Dury, T.V. Heat transfer to a heavy liquid metal in curved geometry: Code validation and CFD simulation for the Megapie lower target. Nucl. Instr. Meth. A 2006, A562, 859–862. [Google Scholar] [CrossRef]
- Čomor, J.J.; Stevanović, Z.; Rajčević, M.; Košutić, D. Modeling of thermal properties of a TeO2 target for radioiodine production. Nucl. Instr. Meth. A 2004, A521, 161–170. [Google Scholar] [CrossRef]
- Steyn, G.F.; Nortier, F.M.; Mills, S.J. Helium cooling of a double-foil window for external cyclotron beams. Nucl. Instr. Meth. A 1990, A292, 35–44. [Google Scholar] [CrossRef]
- Harutyunyan, G.S. Theoretical justification of the possibility of cryocooling of a solid target at irradiation with proton beam from cyclotron C18. J. Comtemporary Phys. 2016, 51, 102–107. [Google Scholar] [CrossRef]
- Grahn, A.; Kliem, S.; Rohde, U. Coupling of the 3D neutron kinetic core model DYN3D with the CFD software ANSYS-CFX. Ann. Nucl. Energy 2015, 84, 197–203. [Google Scholar] [CrossRef]
- Faugl, M.; Stokely, T.A.; Wieland, M.; Bolotnov, B.W.; Doster, I.A.; Peeples, J.; Poorman, J.L. Modeling a water target with proton range and target density coupling. In Proceedings of the 15th International Workshop on Targetry and Target Chemistry, Prague, Czech Republic, 18–21 August 2015. [Google Scholar]
- O’Brien, E.M.; Doster, J.M.; Nortier, F.M.; Olivas, E.R.; Stokely, M.H. Two-way multi-physics coupling for modeling high power RbCl isotope production targets. Nucl. Instr. Meth. A 2018, 433, 15–22. [Google Scholar] [CrossRef]
- do Carmo, S.J.C.; de Oliveira, P.M.; Alves, F. A Target-Temperature Monitoring System for Cyclotron Targets: Safety Device and Tool to Experimentally Validate Targetry Studies. Instruments 2018, 2, 9. [Google Scholar] [CrossRef] [Green Version]
- Frank, T.; Shi, J.-M.; Burns, A.D. Validation of Eulerian multiphase flow models for nuclear safety application. In Proceedings of the Third International Symposium on Two-Phase Modelling and Experimentation, Pisa, Italy, 22–25 September 2004; pp. 22–25. [Google Scholar]
- Langtry, R.B.; Menter, F.R. Transition modeling for general CFD applications in aeronautics. In Proceedings of the 43rd AIAA Aerospace Sciences Meeting and Exhibit, Reno, NV, USA, 10–13 January 2005. AIAA 2005-522. [Google Scholar]
- Frank, T.; Lifante, C.; Prasser, H.M.; Menter, F. Simulation of turbulent and thermal mixing in T-junctions using URANS and scale-resolving turbulence models in ANSYS CFX. Nucl. Eng. Des. 2010, 240, 2313–2328. [Google Scholar] [CrossRef] [Green Version]
- Goodwin, F.; Guruswamy, S.; Kainer, K.U.; Kammer, C.; Knabl, W.; Koethe, A.; Leichtfried, G.; Schlamp, G.; Stickler, R.; Warlimont, H. Metals. In Springer Handbook of Condensed Matter and Materials Data; Martienssen, W., Warlimont, H., Eds.; Springer: Berlin/Heidelberg, Germany, 2005; pp. 161–430. [Google Scholar]
- Davis, J.R. (Ed.) ASM Specialty Handbook: Nickel, Cobalt, and Their Alloys; ASM International: Materials Park, OH, USA, 2000. [Google Scholar]
- Shabalin, L. Ultra-High Temperature Materials I: Carbon (Graphene/Graphite) and Refractory Metals, 1st ed.; Springer: Dordrecht, The Netherlands, 2014. [Google Scholar]
- de Oliveira, P.M. Thermal Simulation Studies of a Cyclotron Liquid Target with Thick Niobium Window. Master’s Thesis, Physics Department, University of Coimbra, Coimbra, Portugal, 2019. [Google Scholar]
Publisher’s Note: MDPI stays neutral with regard to jurisdictional claims in published maps and institutional affiliations. |
© 2021 by the authors. Licensee MDPI, Basel, Switzerland. This article is an open access article distributed under the terms and conditions of the Creative Commons Attribution (CC BY) license (https://creativecommons.org/licenses/by/4.0/).