Article

Radiation Protection Evaluations Following the Installations of Two Cardiovascular Digital X-ray Fluoroscopy Systems

by
Ibrahim I. Suliman
1,*,
Abdelmoneim Sulieman
2 and
Essam Mattar
3
1
Department of Physics, College of Science, Imam Mohammad Ibn Saud Islamic University (IMSIU), Riyadh 11642, Saudi Arabia
2
Radiology and Medical Imaging Department, College of Applied Medical Sciences, Prince Sattam Bin Abdulaziz University, Alkharj 11942, Saudi Arabia
3
Department of Radiological Sciences, College of Applied Medical Sciences, King Saud University, P.O. Box 10219, Riyadh 11433, Saudi Arabia
*
Author to whom correspondence should be addressed.
Appl. Sci. 2021, 11(20), 9749; https://doi.org/10.3390/app11209749
Submission received: 18 September 2021 / Revised: 12 October 2021 / Accepted: 14 October 2021 / Published: 19 October 2021
(This article belongs to the Special Issue Nuclear and Radiation Physics in Medicine)

Abstract

:
Acceptance testing and commission are essential elements of the quality assurance program for imaging equipment. We present the results of a performance evaluation of Flat Panel-Based Cardiovascular Fluoroscopy X-ray Systems as a part of acceptance testing and commissioning. Measurements were obtained using a calibrated dose rate meter, patient equivalent phantoms, and Leeds image quality test tools. The results were compared with the manufacturer and European acceptability criteria. The entrance surface air kerma (ESAK) rate ranged from 8.0 to 12.0 mGy min−1 in the continuous mode and from 0.01 to 0.04 mGy fr−1 in the pulsed mode of operation. Detector-input air kerma rates ranged from 0.29 to 0.39 mGy min−1 in continuous mode and from 0.02 to 0.07 µGy fr−1 in pulsed mode. Fluoroscopy device half-value layer (HVL) ranged from 2.5 to 3.0 mm Al, and the low resolution ranged from 0.9 to 1.3%. The spatial resolution limit was double that of the image intensifier (2.4 to 3.6) lp/mm. Flat-panel fluoroscopy demonstrated superior image quality and dose performance as compared to conventional image intensifier-based fluoroscopy. The quality assurance measurements presented are essential in the rapid evaluation of the imaging system for acceptance testing and commissioning.

1. Introduction

Digital radiology is gaining importance in routine radiological procedures, mainly due to its ability to generate images that can be processed, archived, and transmitted electronically [1]. Indirect conversion and scintillator-based flat detectors are the primary types of flat detectors in use, replacing image intensifiers in cardiac and angiographic procedures [2,3]. In flat panel detectors (FPDs), X-ray detection and the readout are done simultaneously. Compared to image intensifier-based fluoroscopy, direct conversion of the X-ray photons into digital information results in lower dispersion of X-ray photons, which reduces spatial resolution. In other words, flat-panel digital fluoroscopy is expected to show a better spatial resolution limit compared to image intensifier-based fluoroscopy. Another advantage of the FPD is its wide dynamic range that improves contrast throughout the image and allows better visualization of the low-contrast regions [2,3,4]. Despite this advantage, fluoroscopically guided procedures are considered high dose modalities with doses that often exceed the deterministic effect threshold [5]. Reported diagnostic reference levels (DRLs) vary from 42 to 75 mGy.cm2 in diagnostic coronary angiography (CA) and from 84 to 213 mGy.cm2 in percutaneous coronary interventions [5]. Furthermore, the maximum entrance surface air kerma (ESAK) rate limits from 25 to 100 mGy min−1 are used to limit the radiation dose from X-ray fluoroscopic equipment used during international procedures [6]. These dose limits are verified during quality assurance (QA) measurements and are used as quality control parameters to monitor equipment performance.
International radiation protection advisory bodies have suggested implementing QA—a vital optimization tool in medical imaging [7,8,9,10]. QA measurement can help identify any equipment malfunction well in advance; this can contribute to minimizing imaging costs and ensuring radiation protection in patients and staff. Several studies have been performed to evaluate the FP fluoroscopy X-ray system’s dose and image quality performance [11,12].
The present study reports the measurement results of the acceptance and commissioning of two biplane digital fluoroscopy systems based on FPDs at a University Hospital in Oman. The study aimed to determine the norms of acceptable practice for fluoroscopy systems using FPDs and will provide baseline data for future performance monitoring and QA.

2. Materials and Methods

The medical physics section of the College of Medicine & Health Sciences, Sultan Qaboos University, is responsible for providing radiation protection and QA services to the radiology imaging facilities at the Sultan Qaboos University Hospital. Regular QA is required for quality management and radiation safety. In addition to acceptance testing and commissioning, the QA program includes administrative procedures and routine quality control (QC) measurements. This study presents the results of QC measurements performed during the acceptance testing of two biplane fluoroscopy systems. Measurements were carried out using QC protocols published in the literature [13,14]. These measurements were compared with the manufacturer’s claimed specifications and in some cases with the European acceptability criteria [8].

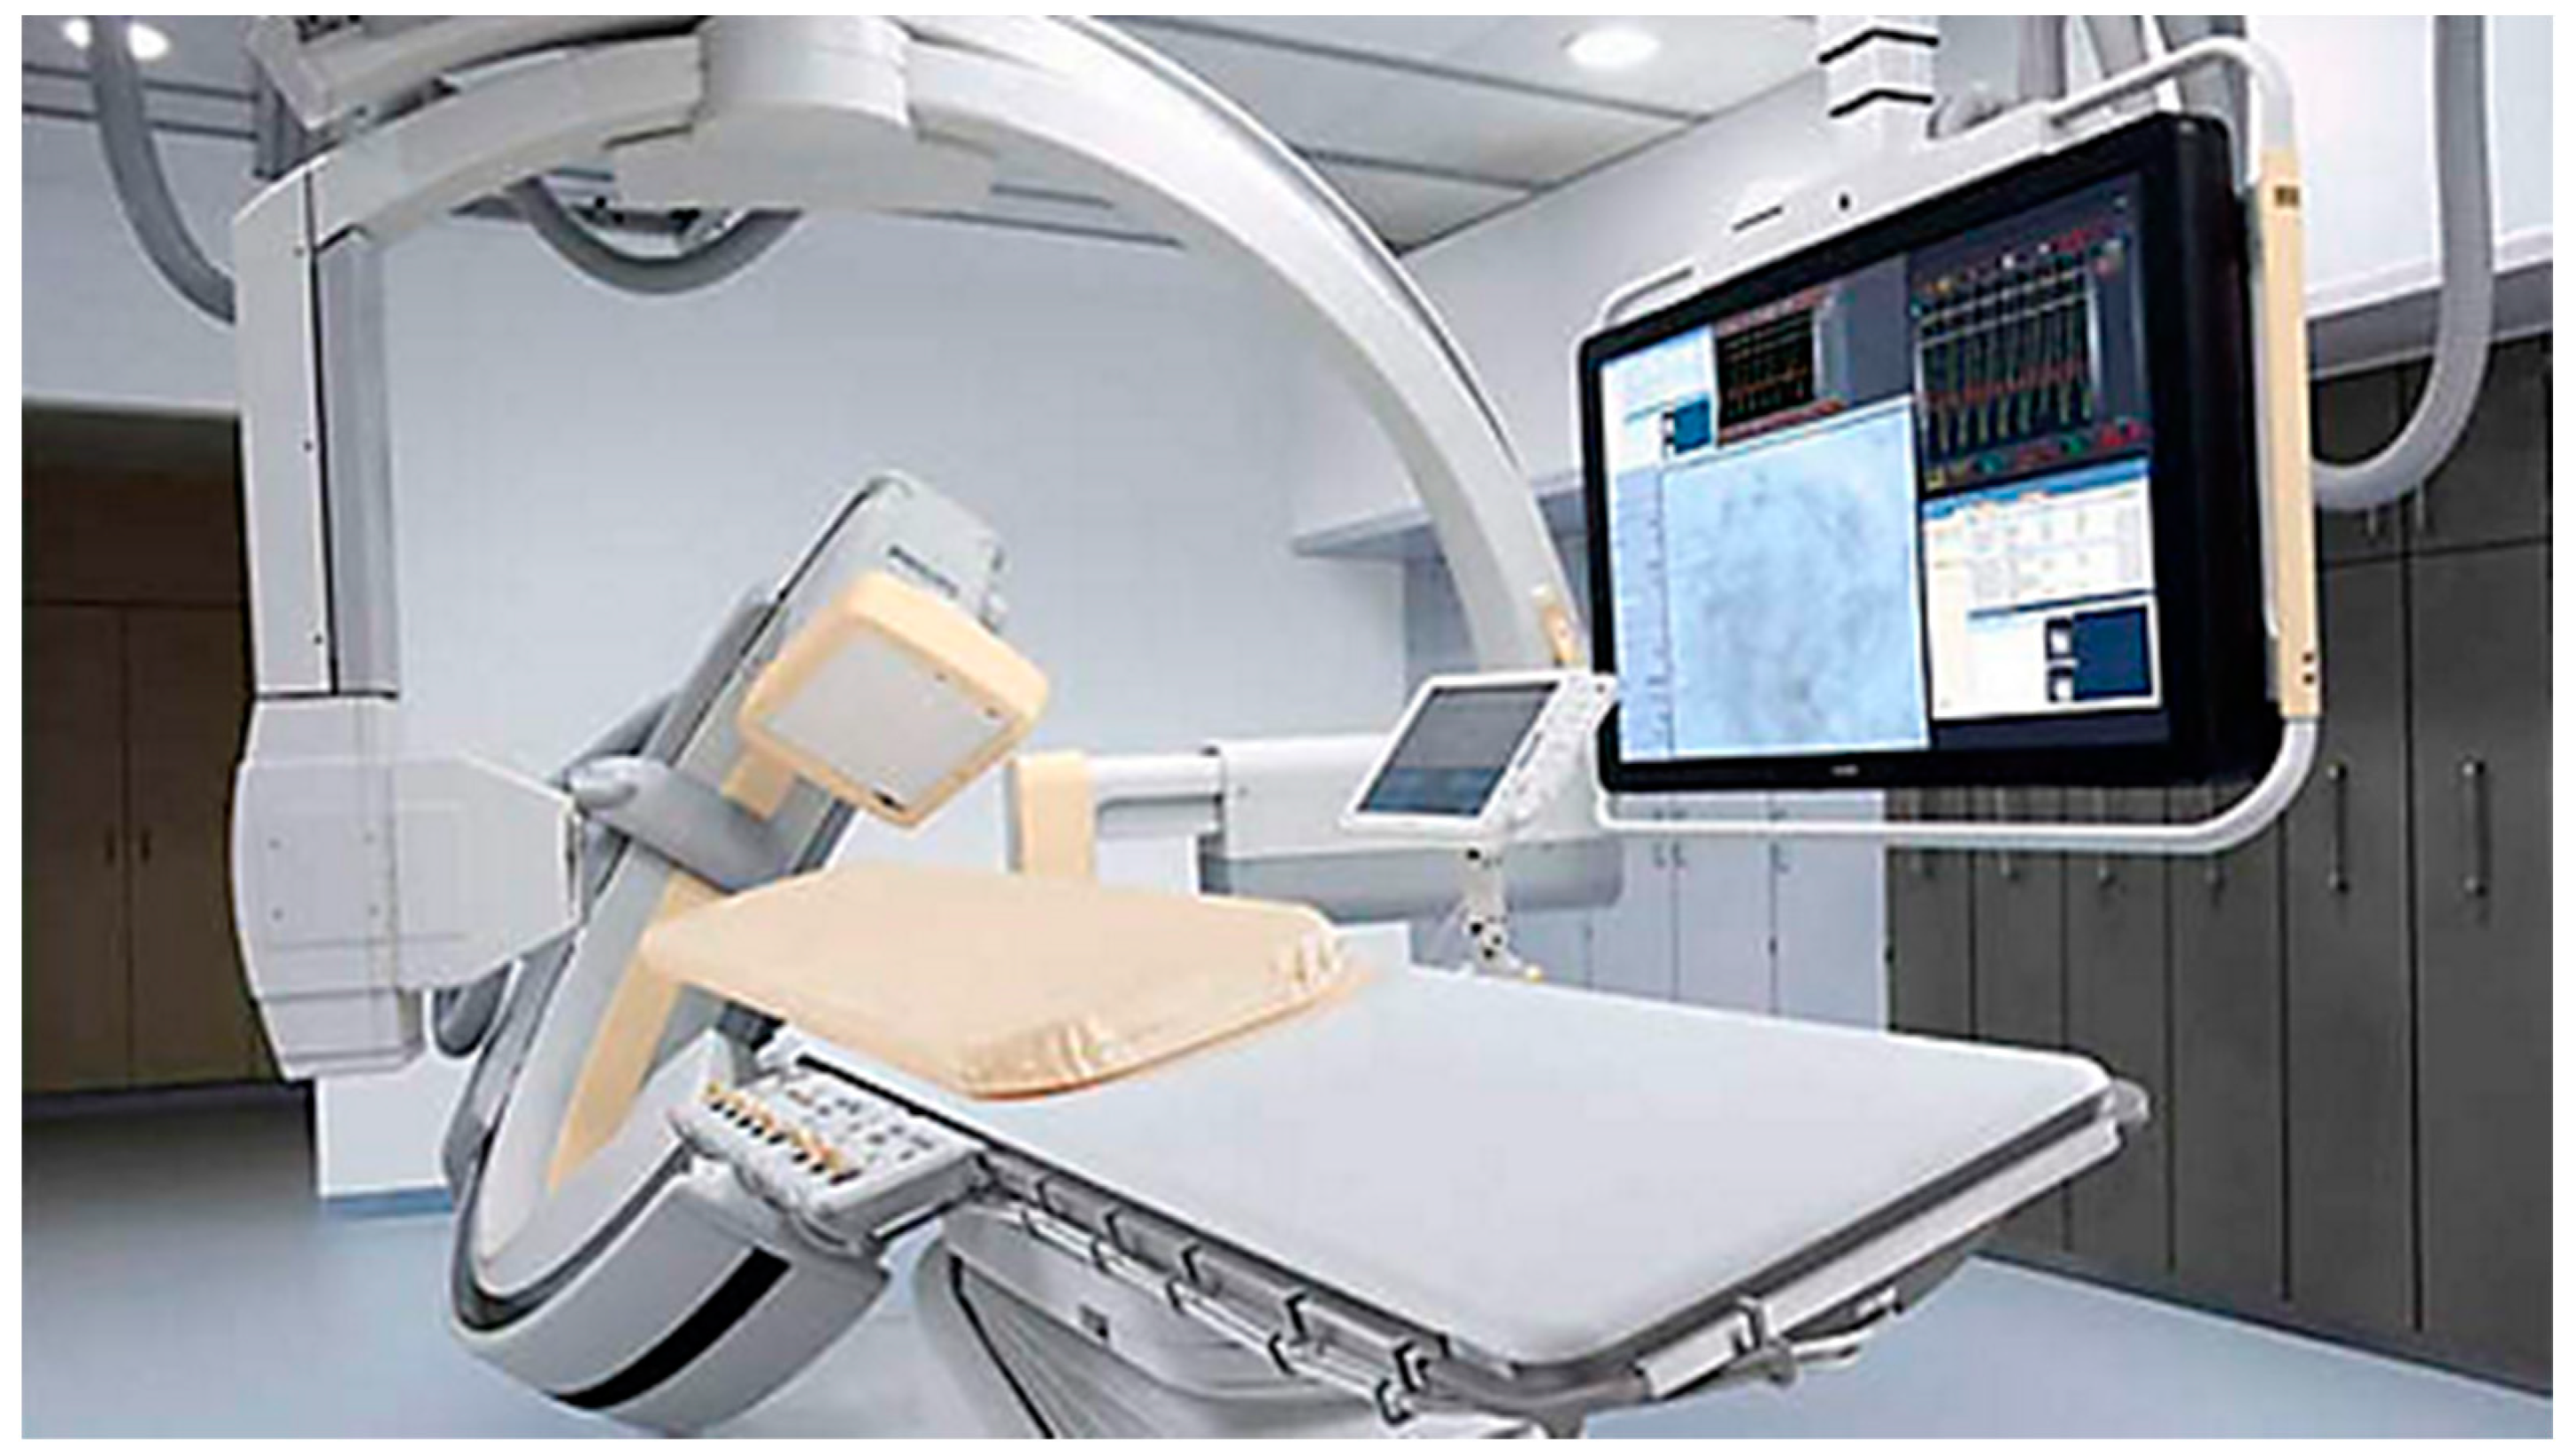
2.1. Fluoroscopy X-ray Systems

The fluoroscopy system models AlluraXper FD20/10 and AlluraXper FD20/20 include two digital biplane systems with FPDs (Philips Medical Systems, Best, the Netherlands) as shown in Figure 1.
AlluraXper FD20/10, referred hereafter as Unit I, comprises two fluoroscopy units: one is horizontally mounted (lateral) with a 10-inch FPD, while the other is mounted vertically (frontal) with a 20-inch FPD.
AlluraXper FD20/20, referred hereafter as Unit II, comprises two fluoroscopy units: one unit is horizontally mounted (lateral), while the other is vertically mounted (frontal). Both units have 20-inch FPDs.

2.2. Quality Control Tools

Radiation exposure was measured using the RaySafe Xi multimeter (Unfors RaySafe AB, Billdal, Sweden); Star test pattern for focal spot size; Leeds University image quality test tools (FG18) for low- and high-contrast measurement and TO.10 for minimum contrast detail detectability measurements; and Radcal 1800 cc ionization chamber for scatter radiation measurements. Moreover, the variable thicknesses of Al, Cu, and PMMA patient equivalent phantoms were measured.

2.3. KAP and CAK Accuracy

The current fluoroscopy equipment must display both the kerma area product (KAP) and the cumulative air kerma (CAK) values at the console. These dose parameters are measured using radiation detectors integrated into the fluoroscopic unit head [13,15,16]. Thus, it is vital to calibrate the console displayed KAP and CAK dosemeters and compare their performance with the recommended practice.
Measurements were carried out with the fluoroscopic unit mounted in its vertical configuration, and air kerma ( k air ) free in the air was measured using the calibrated dose rate meter at the center of the radiation beam field. KAP was determined from the measured ( k air ) according to [17,18,19]:
KAP = k air . A   ( Gy . cm 2 )
where k air is the air kerma measured free in air and A is the beam area. CAK was derived from the measured k air using the inverse square law as shown in [17,18]:
CAK = k air . ( FDD d ref ) 2   ( Gy )
where FDD is the focus-to-detector distance used for k air measurements and d ref is the reference point where CAK is defined (15 cm back from the isocentre towards the focal spot) [17,18,19]. Measured KAP and CAK values were compared with the indicated fluoroscopic values.

2.4. Dosimetry

The ESAK rate and image-receptor dose rate measurements were performed with fluoroscopy in its vertical configuration and a focus-to-image receptor distance of 100 cm—a configuration that was previously used for the image intensifier-based fluoroscopy systems [13,14]. The set-up for the ESAK is shown in Figure 2 and that for image-receptor dose rates measurements is shown in Figure 3.
ESAK measurements were performed using an equivalent patient phantom of 5 mm Al + 5 mm Cu, which is an approximately 24 cm PMMA patient equivalent phantom. A 20 cm PMMA phantom is the recommended standard thickness for ESAK measurements in order to compare with the DRLs; a 24 cm PMMA patient equivalent phantom is used here to represent an obese patient that would allow measurement of the maximum ESAK for comparison with the recommended dose limits. This is particularly necessary for acceptance testing and commissioning to provide the best possible radiation protection. The patient equivalent phantom (5 mm Al + 5 mm Cu) was used for acceptance testing.
The image-receptor input dose rate was measured with 2 mm Cu attached at the fluoroscopy image receptor (FPD).

2.5. Image Quality

Measurements were carried out with the equipment in the vertical configuration and a focus-to-image receptor distance of 100 cm following the recommendations of the European project DIMOND II [13].

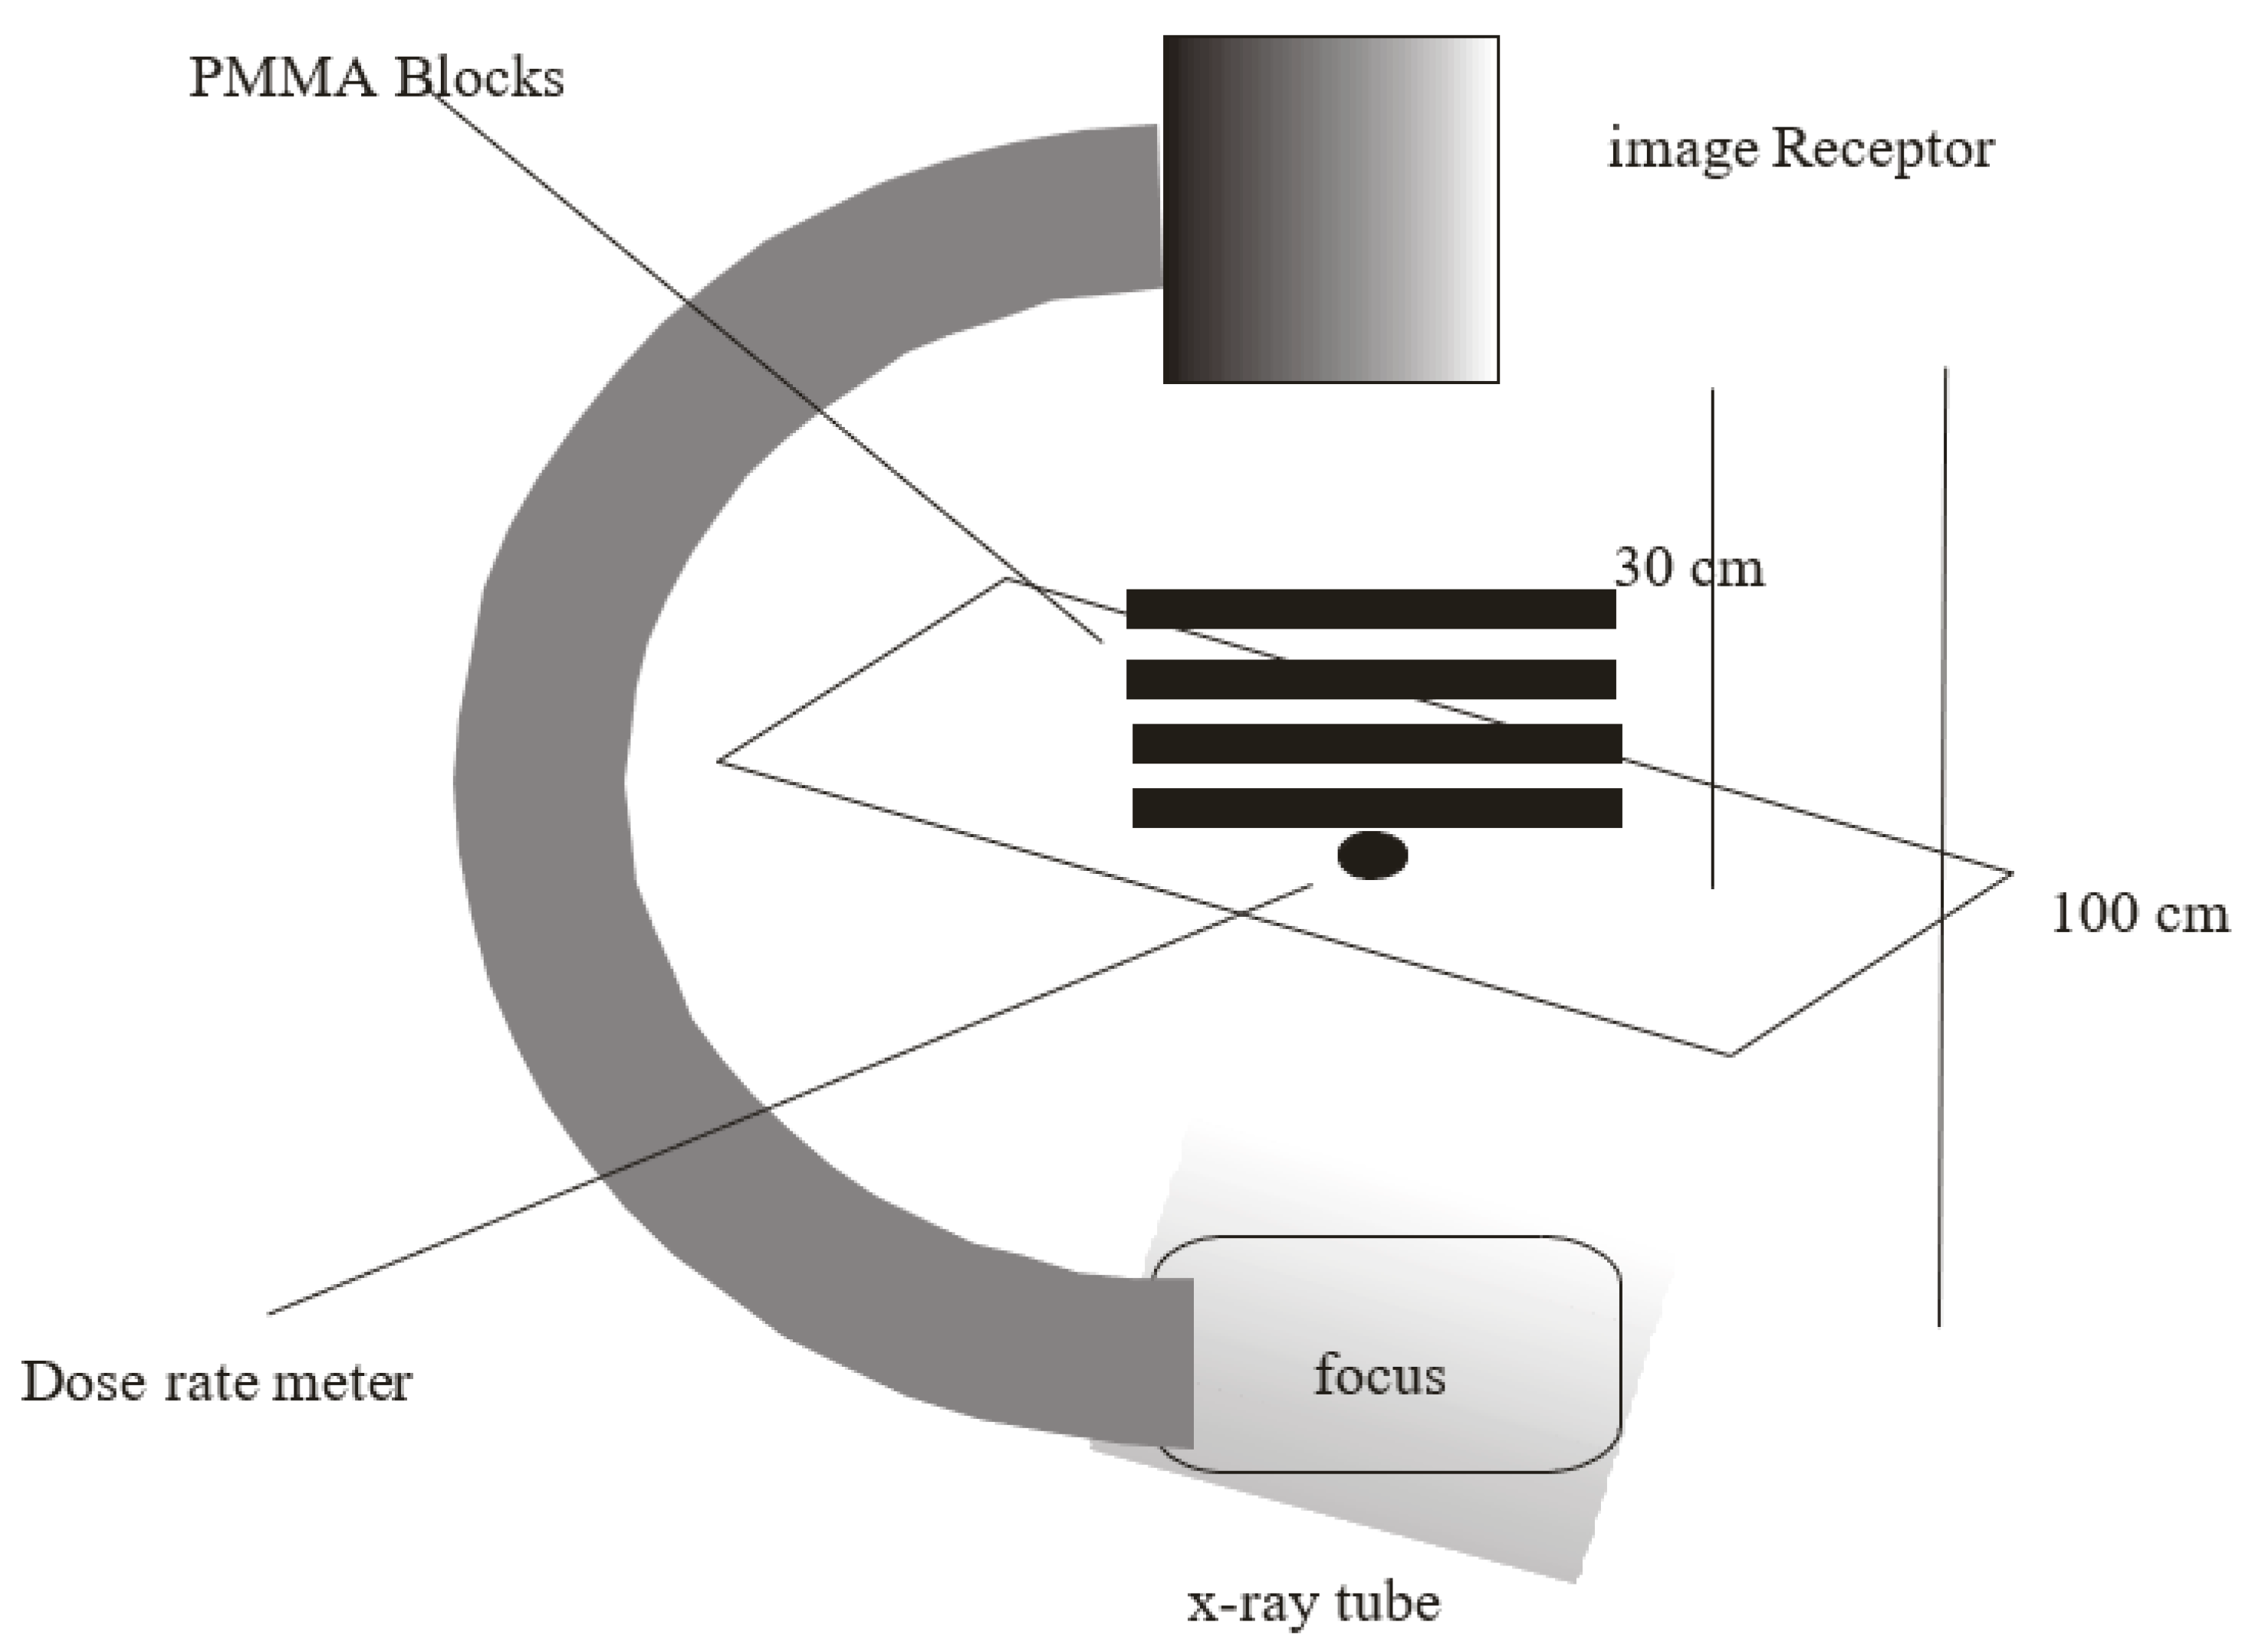
2.5.1. High- and Low-Contrast Resolution

High- and low-contrast resolution measurements were performed using the Leeds University test objects: TOR [18FG]. The phantom was positioned close to the image receptor surface to translate the imaging characteristics of the detector. A 1 mm Cu filter was placed at the collimator for low-contrast measurements and was removed for spatial resolution measurements. This was carried out to measure both resolutions at worst-case scenarios. On the contrary, removing the Cu filter reduced spatial resolution. All images were evaluated as a soft copy on computer screens according to the evaluation criteria described in test objects that were accompanied by an instruction manual [13,14].

2.5.2. Threshold Contrast Detail Detectability (TCDD)

Threshold contrast detail detectability (TCDD) measurements were performed using Leeds TO.10. The TO.10 test objects were attached to the external surface of the FPD and imaged with a 1 mm Cu sheet placed at the collimator. The images of the TO.10 test objects were examined on computer screens by three observers. With CT being the threshold contrast (%), the TCDD curve was plotted on log-log scale showing threshold detection indices (HT) as a function of the square root of the detail area ( A ) , as follows [13,14]:
H T ( A ) = 1 / ( C T A )

2.6. Radiation Protection

2.6.1. Light Field Radiation Beam Congruence

It is essential to ensure that the X-ray beam is restricted to the useful area of the image receptor to prevent an image cut-off and to avoid unnecessary tissue radiation. The Unfors ruler that was imaged at the four boundaries of the light indicated the radiation field. The acceptance value for the congruence of the X-ray and light-field should be ≤±2% of FFD. X-ray/light beam alignment exceeding ±3% FFD should be suspended [13,14].

2.6.2. Minimum Source-to-Skin Distance (SSD)

Radiation doses in interventional radiology (IR) can exceed the onset for deterministic effects. Therefore, regulations limit the minimum source-to-skin distance (SSD) that is to be achieved during an IR procedure to 45 cm. This requirement was tested by placing plastic spacers on the surface of the X-ray tube collimator assembly [14].

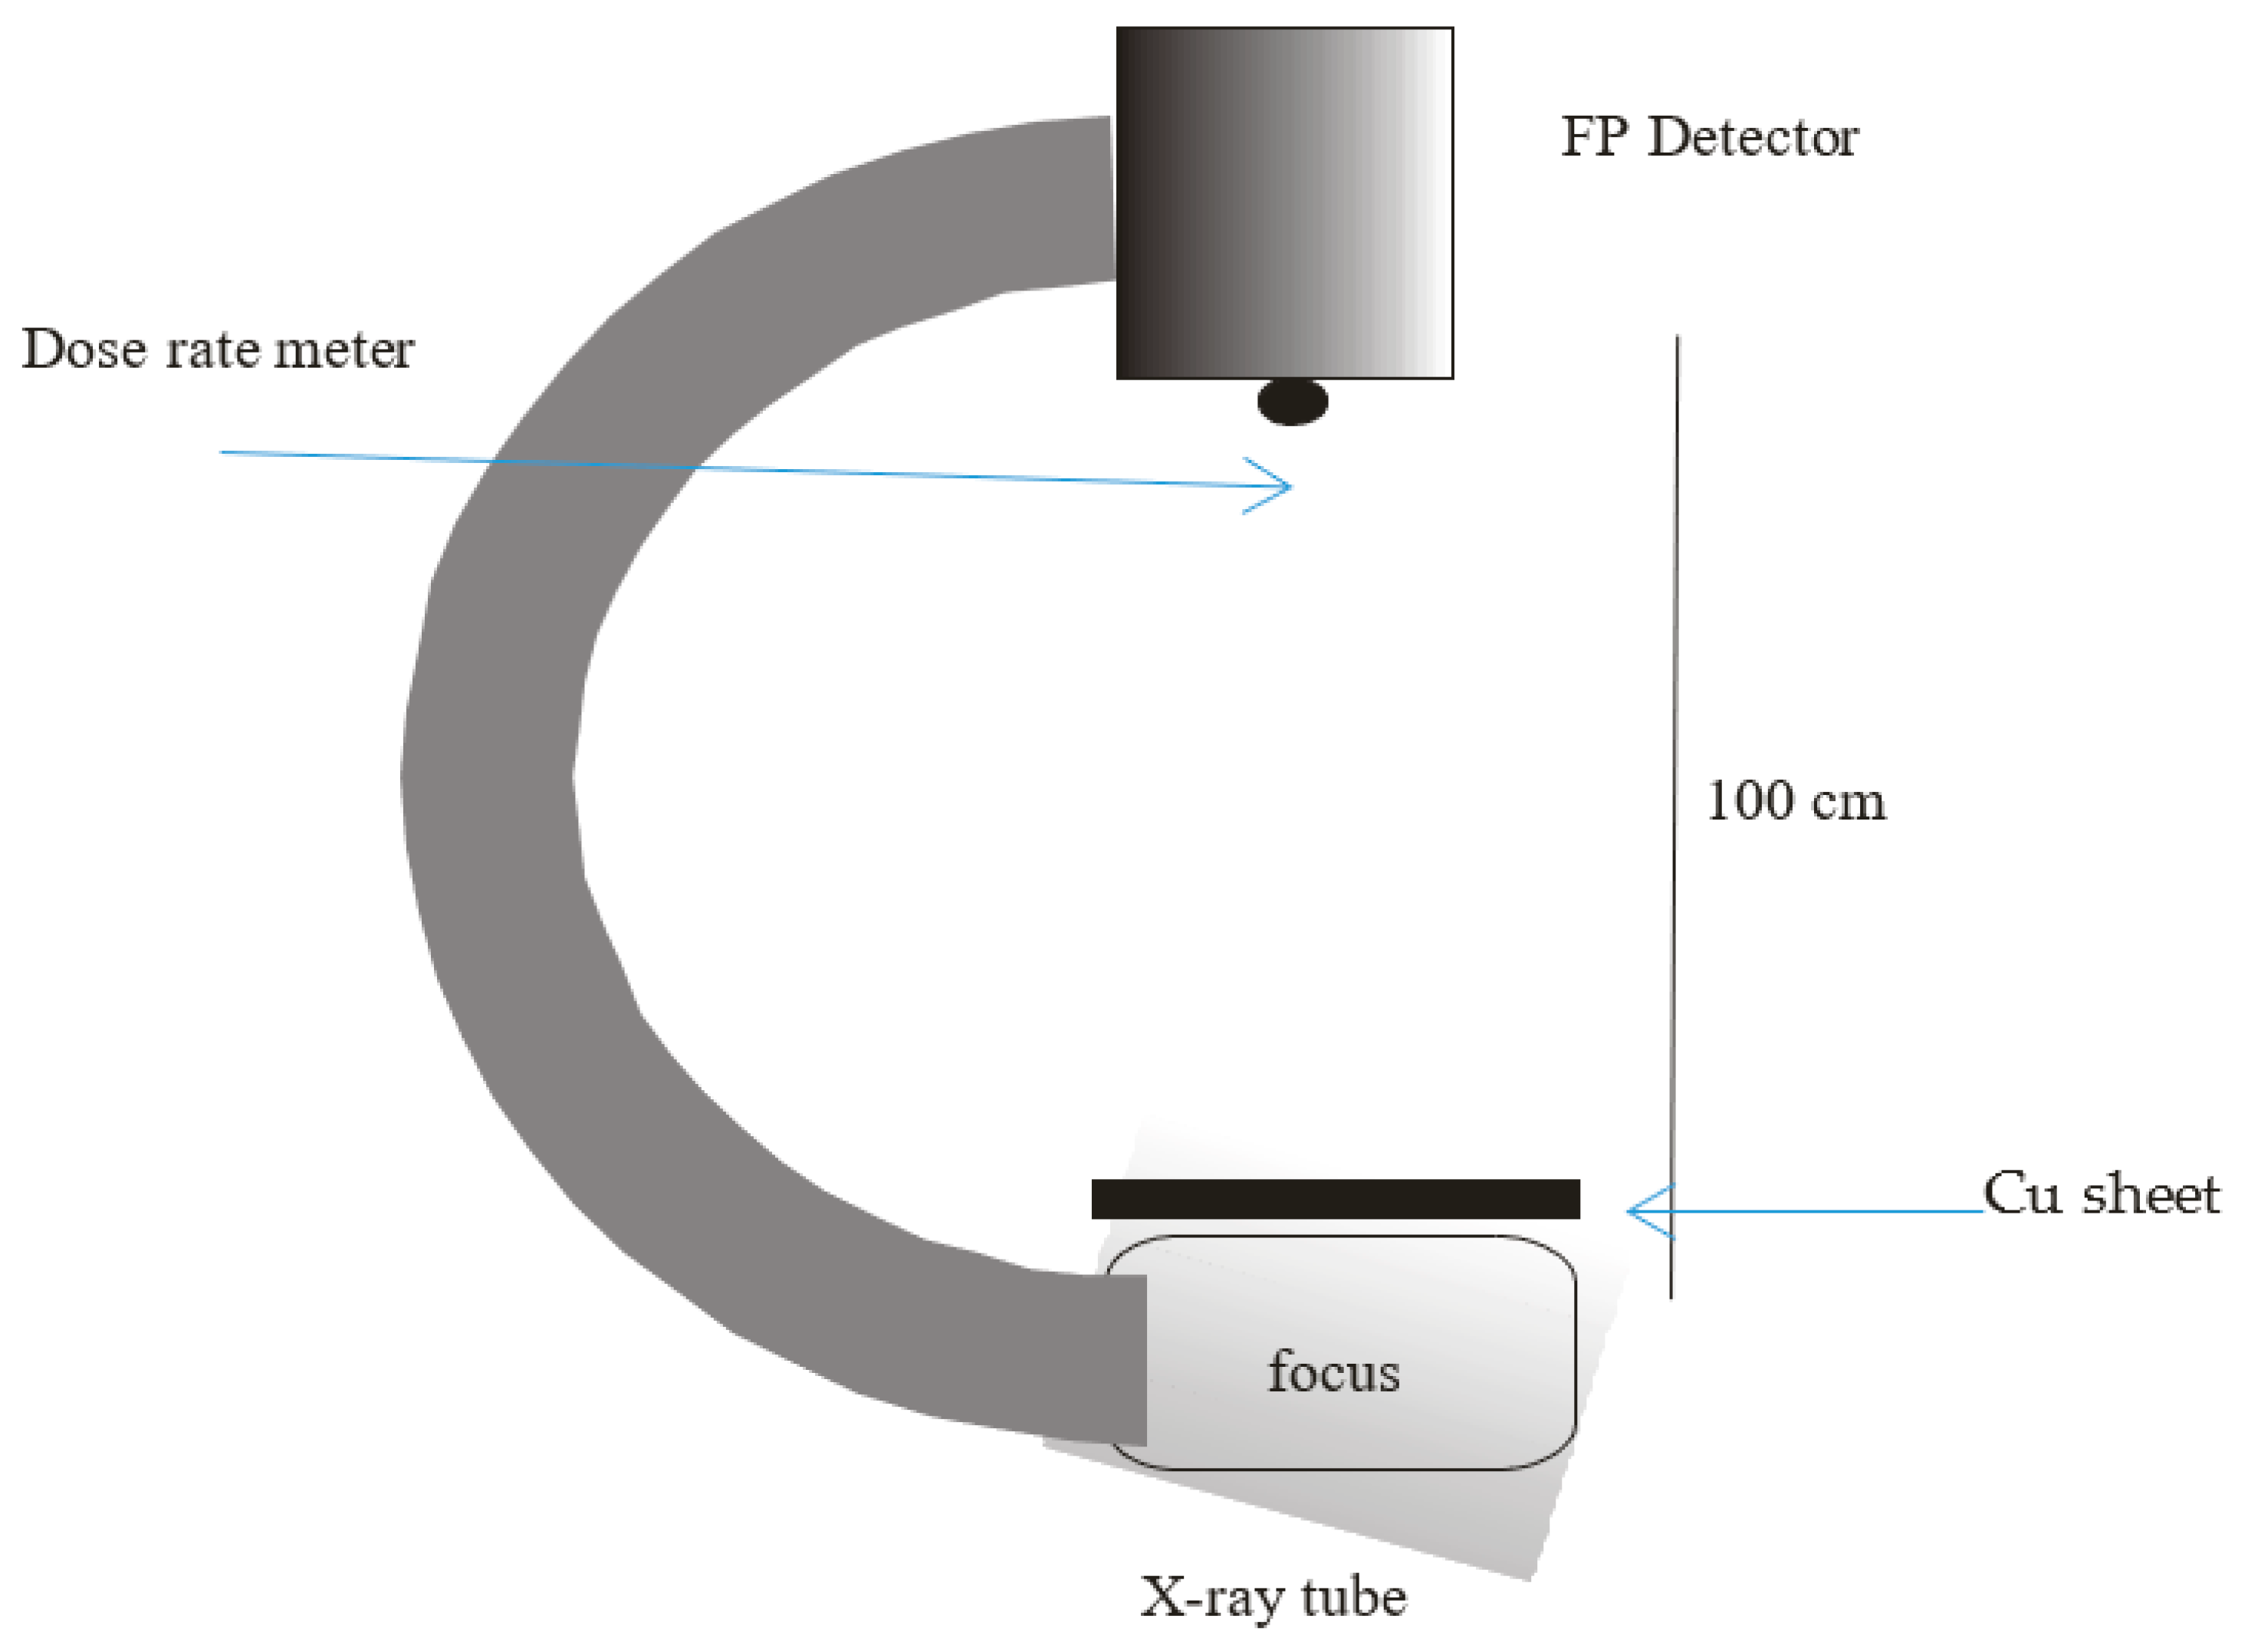
2.6.3. Scattered Radiation Levels

For measurement of radiation leakage, the lead absorber was placed at the X-ray tube collimator. With fluoroscopy operating at maximum tube loading, the air kerma rate was measured at 1 m around the fluoroscopy head using the Unfors dose rate meter. The adequacy of structural shielding was tested by air kerma rate measurements in a controlled and supervised area using the Unfors ionization chamber [14].

3. Results

3.1. X-ray Tube and Generator Parameters
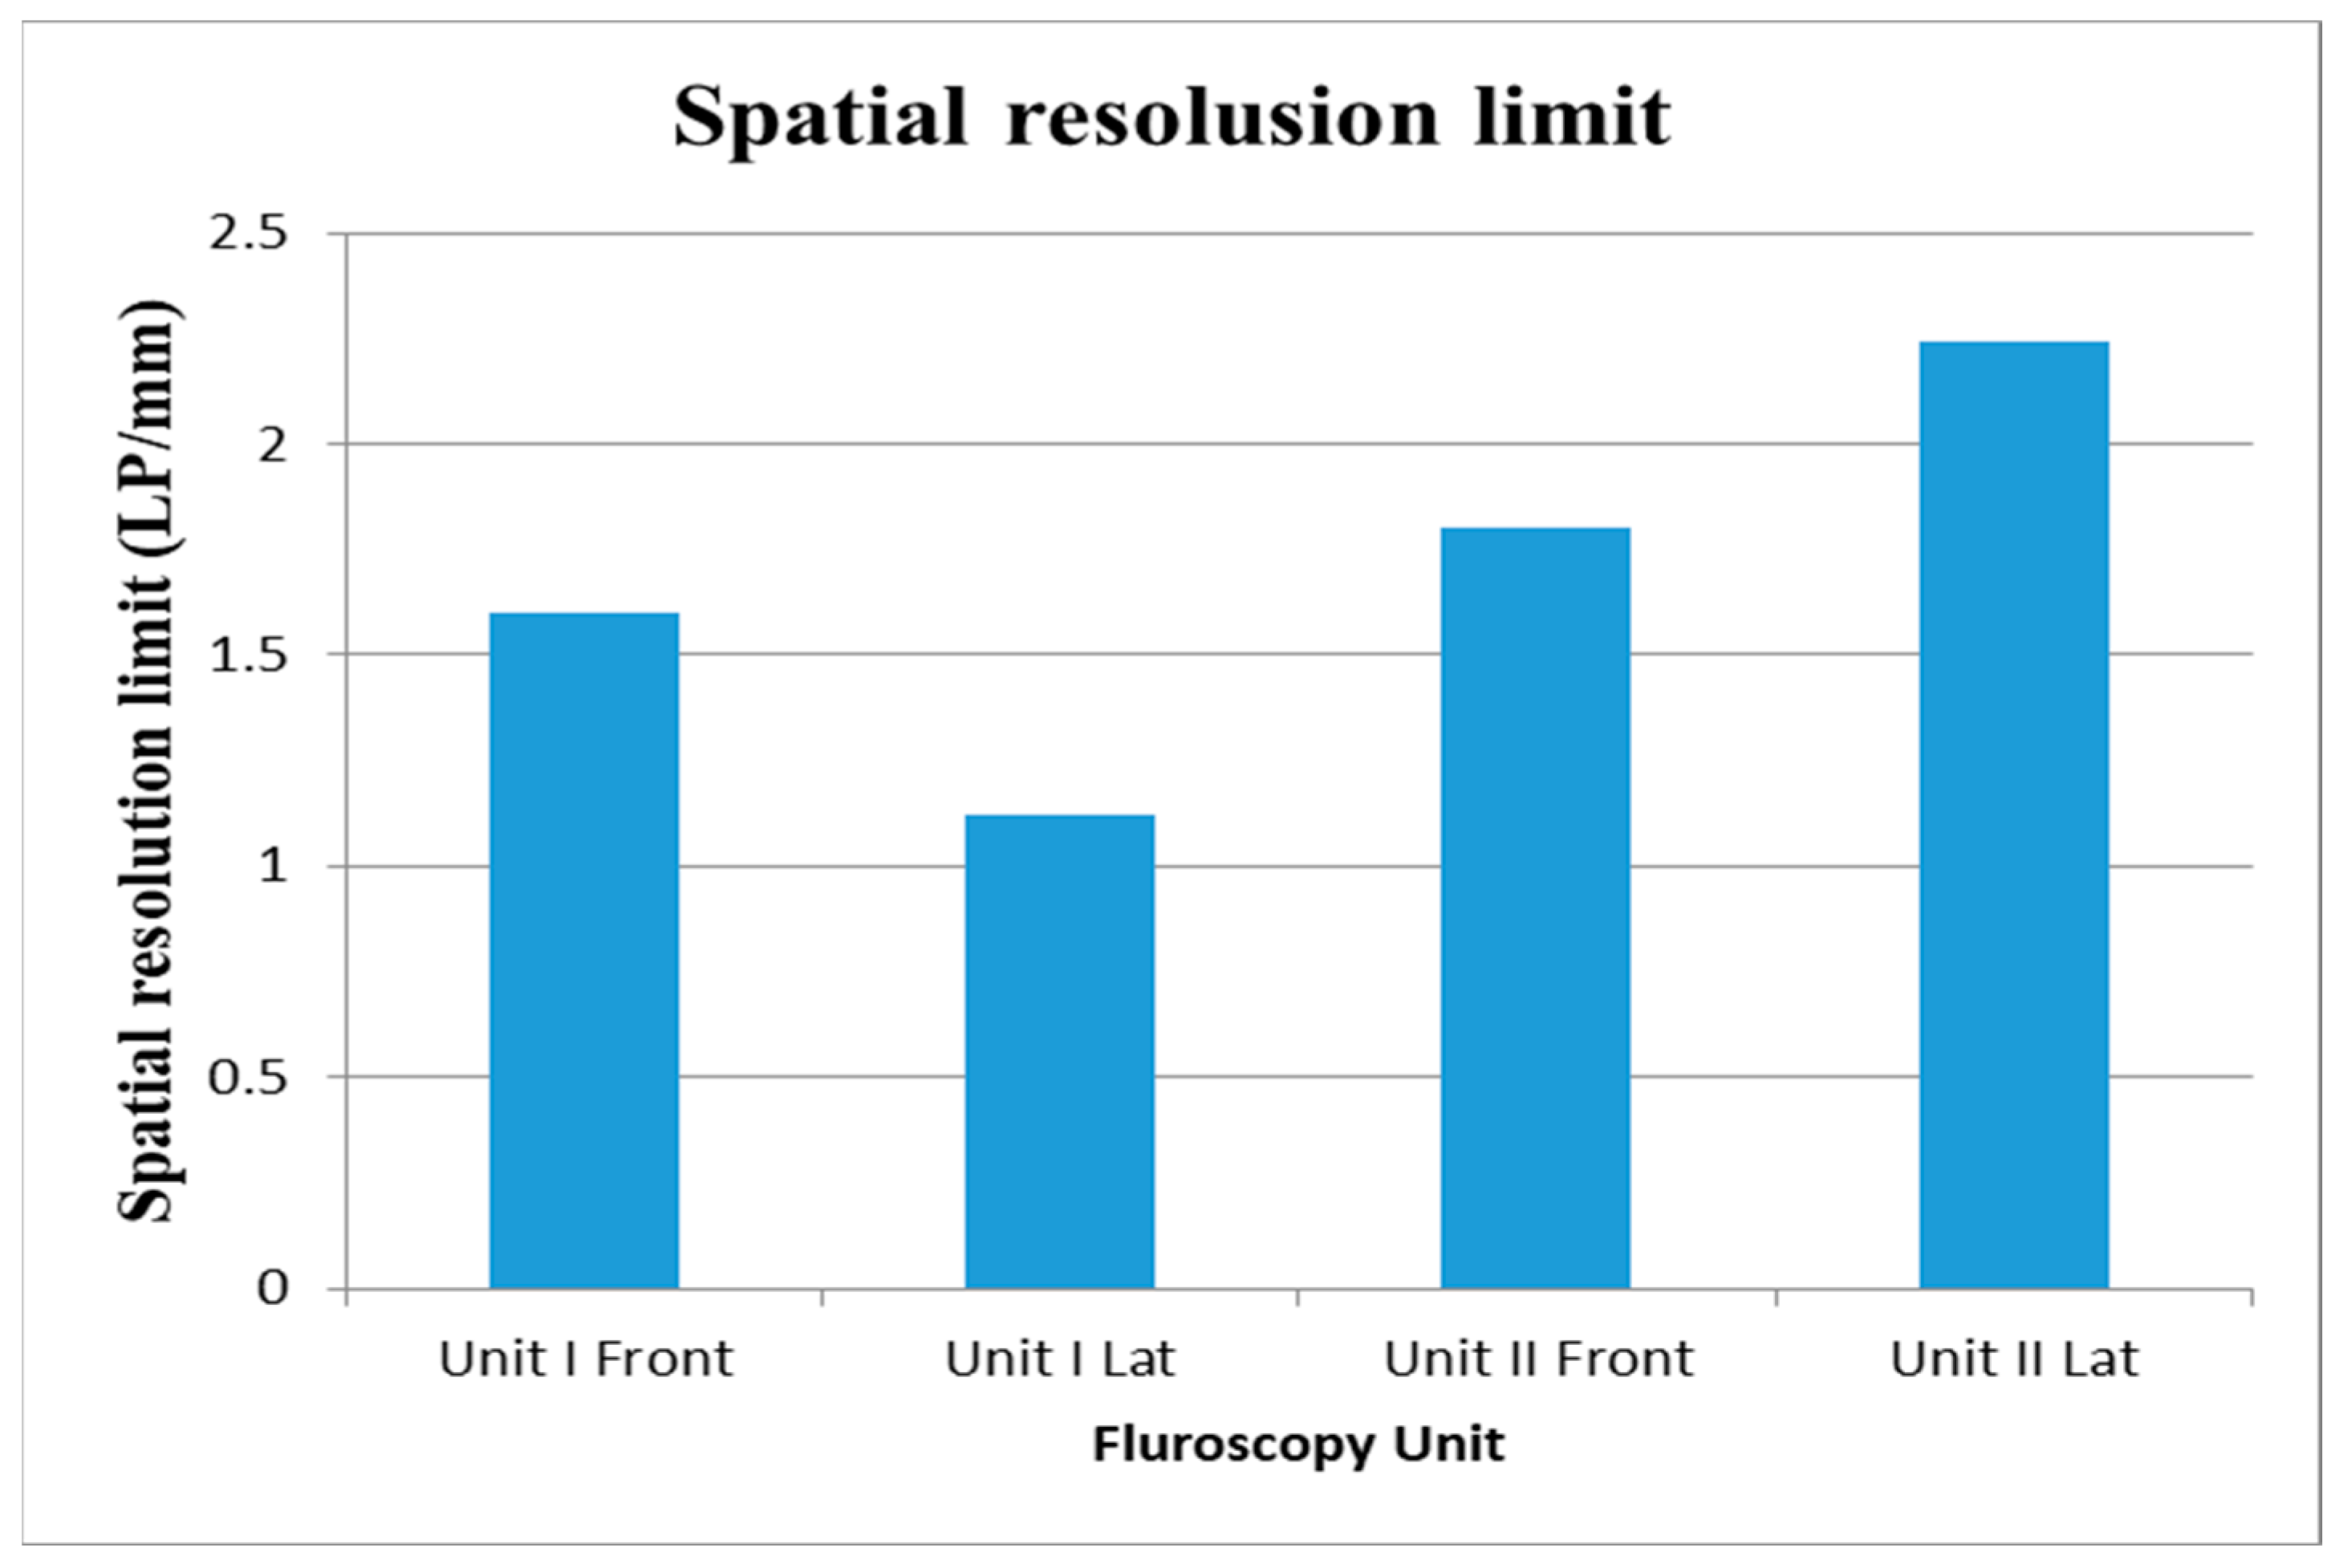
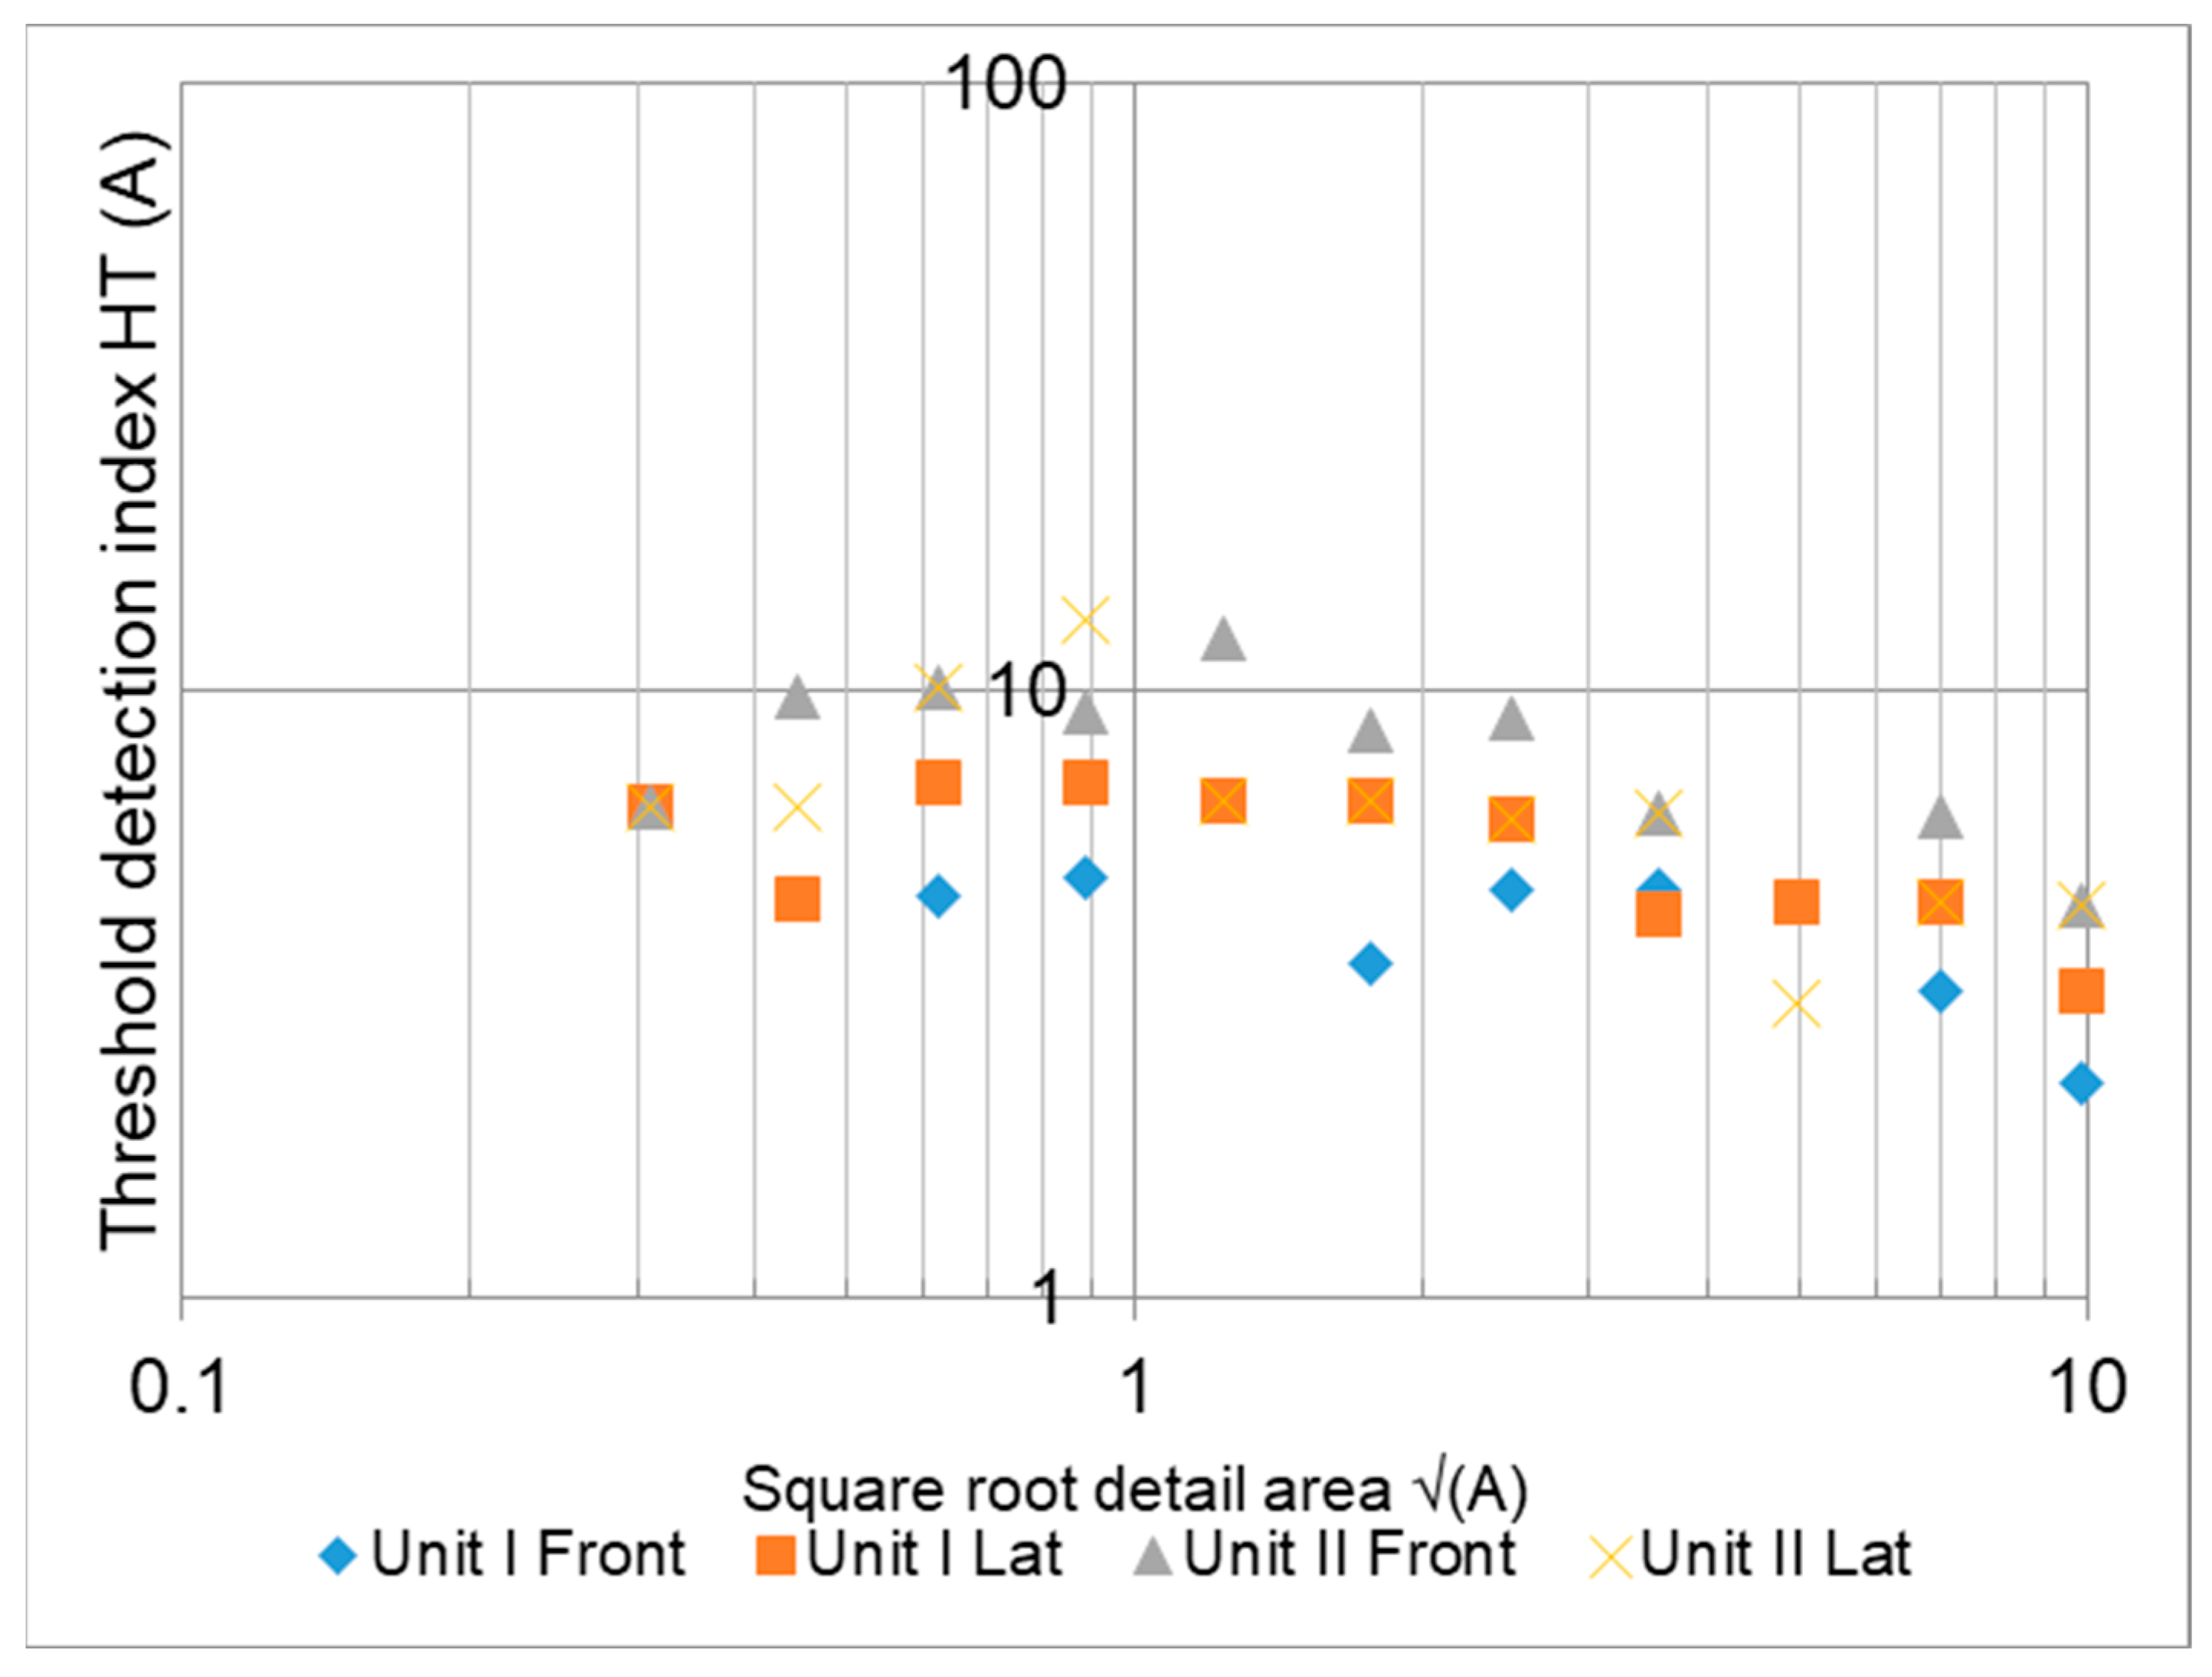
Table 1 presents the results of the QC measurements for the X-ray tube and generator parameters. The performance of the equipment under study was well within the manufacturer’s claimed specifications. These parameters were not different to those previously used for image intensifier-based fluoroscopy, but they can be used as baseline data to monitor future performance [20,21]. The results of measurements for the KAP and CAK meter accuracy determinations are shown in Table 2. They were within the tolerance level stated by the manufacturer (Table 3) and kVp accuracy with fluoroscopy operated in automatic exposure dose rate mode.
The kV accuracy patient equivalent phantom up to 18 PMMA + 2.5 mm Al was used to vary the tube voltage. A maximum kV deviation of 7.5% was observed when fluoroscopy was operated at 54 kV. This value was within the recommended tolerance level of ±10% [20,21].
Table 4 shows the maximum ESAK and image-receptor input air kerma rates. ESAK is used in diagnostic radiology as an indicator for radiation deterministic effects. The manufacturer claimed that the maximum ESAK values for fluoroscopic units used for interventional procedures should not exceed 9 mGy min−1 and 0.01 mGy frame−1 in continuous and pulsed fluoroscopy, respectively [10]. The measured results were well within the manufacturer’s specifications and were far below the previously recommended 25 mGy min−1 in the normal operating mode for image intensifier-based fluoroscopy [6].

3.2. Image Quality

Figure 4 shows the spatial resolution limits for the four fluoroscopy units, whereas Figure 5 presents the results of the minimum contrast detail detectability measurements performed using Leeds TO.10. The graphs show an improved image quality for fluoroscopy with FPDs compared to image intensifier-based fluoroscopy.

4. Discussion

The radiation safety recommendation requires that the accuracy of both KAP and CAK meters are within ±25% [15]. The FDA requires that the displayed CAK not deviate from the actual value by more than ±35% [20]. The results of both PKA and CAK meters were within the recommended limits.

4.1. Patient Dose

In Table 5, the ESAK values obtained in this study for the standard-sized patient equivalent phantom were compared with those reported in the literature. For FP fluoroscopy, our results were slightly higher than those presented by O’Connor et al. [2], but are lower than those presented by Chida et al. [22]. It is important to note that both of these studies used a standard patient equivalent phantom thickness of 20 cm, whereas, in the present study, we used a maximum patient equivalent of 24 cm and 28 cm. In general, our results are comparable to those reported in the literature and are far lower than those reported for image intensifier-based fluoroscopy. In agreement with the current findings, Sjöholm et al. [23] reported that patient doses could be reduced by a factor of four when using FPDs with no significant difference in image quality. These results advocate the need for revised tolerance levels. The results of ESAK and the image-receptor input dose rates shown in Table 6 are well within the recommended specifications.
Regarding image-receptor input dose rates, the manufacturer recommends that the detector dose rate should be less than 1.0 mGy s−1 and should never exceed 2.0 mGy s−1 [10]. Thus, the current results fell within the stated recommendations. Incident air kerma to the image receptor is essential to protect the detector surface from excessive radiation exposure that might degrade its performance.
Table 6 shows the results of radiation protection and safety measurements. Scatter radiation-absorbed dose levels ranged from 4.0 to 4.7 µGy min−1, which were well within the recommended tolerance levels. Similarly, ambient dose levels in the controlled and supervised areas were below the recommended weekly dose rates.

4.2. Image Quality

According to the Institute of Physics and Engineering in Medicine (IPEM), UK, the tolerance spatial resolution limits are as follows: 0.8 lp/mm for FoV of 30–35 cm and 1.0 lp/mm for FoV of 23–25 cm [19,20]. When comparing our results with the IPEM recommended values, we see that the current results for FP fluoroscopy provide a much better resolution—giving a spatial resolution limit of 1.2–1.8 for the 20-inch (50 cm) diagonal FPD and 1.6–2.24 for the 10-inch (25 cm) diagonal FPD. In accordance with our results, improved spatial resolution on the FPD system was shown by O’Connor et al. [2], who reported a spatial resolution limit of (1.4 lp/mm vs. 1.25 lp/mm on both II/TVs). Tolerance levels for TCDD are difficult to establish. However, measurement results at commissioning are considered baseline data to which future equipment performance should be compared.

4.3. Radiation Protection

On the other hand, fluoroscopy should collimate the X-ray beam within ±1% of the FDD. In addition to the skin area covered by the X-ray beam, radiation risk depends on the fluoroscopy dose rates [23]. Therefore, fluoroscopy beam collimation accuracy is essential to avoid unnecessary radiation exposure. Fluoroscopically-guided, interventional procedures are associated with high radiation doses that often exceed the threshold for deterministic effects. Hence, regulations limit the maximum source to a skin distance of 45 cm to prevent radiation skin reactions [14]. The fluoroscopy units tested in this study satisfy this requirement.

5. Conclusions

A comprehensive set of QA measurements are presented for biplane flat-panel digital fluoroscopy units. The results were compared with the EC quality criteria. The performance of the X-ray tube and parameters were used as baseline data to which future performance may be compared. Additionally, the equipment performance was well within the manufacturer’s specifications, and it provided valuable data for deriving recommendations concerning dose and image quality performance of flat panel fluoroscopy. The advancements in imaging technology have enhanced overall performance, which could imply a need for continuous revision of the acceptability criteria.

Author Contributions

Conceptualization, I.I.S.; methodology, I.I.S., E.M. and A.S.; validation, A.S.; formal analysis, I.I.S.; investigation, E.M. and A.S.; resources, I.I.S.; writing—original draft preparation, A.S. and E.M.; writing—review and editing, I.I.S. and A.S.; supervision, I.I.S.; funding acquisition, I.I.S. All authors have read and agreed to the published version of the manuscript.

Funding

The authors extend their appreciation to the Deanship of Scientific Research at Imam Mohammad Ibn Saud Islamic University for funding this work through Research Group No. RG-21-09-45.

Institutional Review Board Statement

Not applicable.

Informed Consent Statement

Not applicable.

Data Availability Statement

Data available on request.

Conflicts of Interest

The authors declare no conflict of interest.

References

  1. International Commission on Radiological Protection (ICRP). Managing patient dose in digital radiology. Ann. ICRP 2004, 34, 1–73. [Google Scholar]
  2. O’Connor, U.; Dowling, A.; Gallagher, A.; Gorman, D.; Walsh, C.; Larkin, A.; Gray, L.; Devine, M.; Malone, J. Acceptance testing of fluoroscopy systems used for interventional purposes. Radiat. Prot. Dosim. 2008, 129, 56–58. [Google Scholar] [CrossRef] [PubMed]
  3. Tsapaki, V.; Kottou, S.; Kollaros, N.; Dafnomili, P.; Kyriakidis, Z.; Neofotistou, V. Dose performance evaluation of a charge coupled device and a flat-panel digital fluoroscopy system recently installed in an interventional cardiology laboratory. Radiat. Prot. Dosim. 2004, 111, 297–304. [Google Scholar] [CrossRef] [PubMed]
  4. Suliman, I.I. Estimates of patient radiation doses in digital radiography using DICOM information at a large teaching hospital in Oman. J. Digit. Imaging 2020, 33, 64–70. [Google Scholar] [CrossRef] [PubMed]
  5. Al-Jabri, A.J.; Alzimami, K.; Alsafi, K.; Alaamer, A.S.; Al-Rajhi, M.A.; Suliman, I.I. Retrospective analysis of patient radiation doses in digital coronary angiography and interventions. Radiat. Prot. Dosim. 2019, 183, 497–502. [Google Scholar] [CrossRef] [PubMed]
  6. Faulkner, K. Dose displays and record keeping. Radiat. Prot. Dosim. 2001, 94, 143–145. [Google Scholar] [CrossRef] [PubMed]
  7. Valentin, J.; Boice, J.D., Jr.; Clarke, R.H.; Cousins, C.; Gonzalez, A.J.; Lee, J.; Lindell, B.; Meinhold, C.B.; Mettler, F.A., Jr.; Pan, Z.; et al. The 2007 Recommendations of the International Commission on Radiological Protection; Ann. ICRP 37; ICRP Publication 103; Pergamon Press: Oxford, UK, 2007; pp. 1–232. [Google Scholar]
  8. International Basic Safety Standards. General Safety Requirements Part 3; No. GSR Part 3; IAEA: Vienna, Austria, 2014. [Google Scholar]
  9. European Commission. Basic Safety Standards for Protection Against the Dangers Arising from Exposure to Ionising Radiation; Council Directive 2013/59/Euratom Directive; Official Journal of the European Communities: Luxembourg, 2013.
  10. Commission for European Communities. Criteria for Acceptability of Radiological, Nuclear Medicine and Radiotherapy Equipment; EC Radiation Protection Report No. 162; European Communities: Luxembourg, 2012.
  11. Zurcher, K.S.; Naidu, S.G.; Money, S.R.; Stone, W.M.; Fowl, R.J.; Knuttinen, G.; Oklu, R.; Coltvet, L.A.; Crawford, D.; Buras, M.R.; et al. Dose reduction using digital fluoroscopy versus digital subtraction angiography in endovascular aneurysm repair: A prospective randomized trial. J. Vasc. Surg. 2020, 72, 1938–1945. [Google Scholar] [CrossRef] [PubMed]
  12. Bjørkås, L.W.; Blø, S.; Rekdal, M.K.; Rusandu, A. Quality of radiation protection aprons and quality control routines at different diagnostic imaging modalities. Radiogr. Open 2020, 6, 64–74. [Google Scholar] [CrossRef]
  13. Zoetelief, J.; Van Soldt, R.T.; Suliman, I.I.; Jansen, J.T.; Bosmans, H. Quality control of equipment used in digital and interventional radiology. Radiat. Prot. Dosim. 2005, 117, 277–282. [Google Scholar] [CrossRef] [PubMed]
  14. American Association of Physicists in Medicine (AAPM); Diagnostic X-Ray Imaging Committee; Nickoloff, E.L. Cardiac Catheterization Equipment Performance; AAPM: Alexandria, Egypt, 2001. [Google Scholar]
  15. IEC. Report 60601 Medical electrical equipment. Part 2–43. In Particular Requirements for the Safety of X-ray Equipment for Interventional Procedures, 2nd ed.; International Electrotechnical Commission: Geneva, Switzerland, 2010. [Google Scholar]
  16. Food and Drug Administration (FDA). Public Health Advisory: Avoidance of Serious X-ray-Induced Skin Injuries to Patients during Fluoroscopically Guided Procedures; Center for Devices and Radiological Health: Rockville, MD, USA. Available online: http://www.fda.gov/MedicalDevices/Safety/AlertsandNotices/PublicHealthNotifications/ucm063084.htm (accessed on 12 January 2021).
  17. International Commission on Radiation Measurements and Units. Patient Dosimetry for X-Rays Used in Medical Imaging; ICRU: Bethesda, MD, USA, 2006. [Google Scholar]
  18. National Council on Radiation Protection and Measurements. Radiation dose Management for Fuoroscopically Guided Interventional Medical Procedures; Report No.168; National Council on Radiation Protection and Measurements: Bethesda, MD, USA, 2010. [Google Scholar]
  19. Honey, I.; Rose, A.; Baker, C.; Charnock, P.; Fazakerley, J.; Iball, G.; Koutalonis, M.; Price, M.; Renaud, C.; Shaw, D.; et al. IPEM Topical Report: An evidence and risk assessment based analysis of the efficacy of tube and generator quality assurance tests on general x-ray units. Phys. Med. Biol. 2018, 63, 245011. [Google Scholar] [CrossRef] [PubMed] [Green Version]
  20. Shaw, D.; Worrall, M.; Baker, C.; Charnock, P.; Fazakerley, J.; Honey, I.; Iball, G.; Koutalonis, M.; Price, M.; Renaud, C.; et al. IPEM Topical Report: An evidence and risk assessment based analysis of the efficacy of quality assurance tests on fluoroscopy units—part II; image quality. Phys. Med. Biol. 2020, 65, 225037. [Google Scholar] [CrossRef] [PubMed]
  21. Worrall, M.; Shaw, D.; Baker, C.; Charnock, P.; Fazakerley, J.; Honey, I.; Iball, G.; Koutalonis, M.; Price, M.; Renaud, C.; et al. IPEM Topical Report: An evidence and risk assessment based analysis of the efficacy of quality assurance tests on fluoroscopy units—part I; dosimetry and safety. Phys. Med. Biol. 2019, 64, 195011. [Google Scholar] [CrossRef] [PubMed]
  22. Chida, K.; Inaba, Y.; Saito, H.; Ishibashi, T.; Takahashi, S.; Kohzuki, M.; Zuguchi, M. Radiation dose of interventional radiology system using a flat-panel detector. Am. J. Roentgenol. 2009, 193, 1680–1685. [Google Scholar] [CrossRef] [PubMed]
  23. Sjöholm, B.; Geijer, H.; Persliden, J. Impact of digital imaging on radiation doses to the patient during X-ray examination of the urinary tract. Acta Radiol. 2005, 46, 657–661. [Google Scholar] [CrossRef] [PubMed]
Figure 1. Philips Allura Xper FD20/10 biplane X-ray system showing the lateral (mounted on the roof) and the frontal part (close to the couch).
Applsci 11 09749 g001
Figure 2. Set-up for entrance surface air kerma measurements.
Applsci 11 09749 g002
Figure 3. Set-up for image receptor input dose rate measurements.
Applsci 11 09749 g003
Figure 4. Spatial resolution limit for the four fluoroscopy devices.
Applsci 11 09749 g004
Figure 5. The threshold contrast detail detectability curves for the four fluoroscopy devices.
Applsci 11 09749 g005
Table 1. Summary for testing of major X-ray tube and generator parameters.
CodeOutput@
80 kVp
(µGy)
HVL
(mm ALeq)
Accuracy (%) aField Size bContrast Resolution
FluoroRadiographyXY
EC Criteria25–9070 kVp80 kVp105<1% of SID3%
Unit I
Frontal683.03.55.42<1<11.3
Lateral753.03.54.21.6<1<11.3
Unit II
Frontal562.93.34.53.0<1<11.3
Lateral592.83.23.62.2<1<11.3
a kVp accuracy (%) = 100 ( k V p s e t k V p m e a s ) / k V p s e t , where k V p s e t and k V p m e a s are the set and the measured kVp, respectively. b The Unfors ruler was imaged at the four boundaries of the light-indicated radiation field.
Table 2. KAP and CAK accuracy measurements.
UnitDose QuantityMeasuredIndicatedError %
UNIT I
FrontalKAP (mGy.cm2)111410922.0
CAK(mGy)2.212.0010.7
LateralKAP (mGy.cm2)10379627.7
CAK (mGy)2.983.00−0.8
UNIT II
FrontalKAP (mGy.cm2)13515613.0
CAK (mGy)1.021.216.0
LateralKAP (mGy.cm2)1711806
CAK (mGy)2.22.48.3
Table 3. kVp accuracy with fluoroscopy operated in automatic exposure dose rate mode.
PhantomUnit II FrontalUnit II Lateral
PMMA
cm
AL
mm
KilovoltageESAKKilovoltageESAK
(mGy/
min)
IndicatedMeasuredError %(mGy/
min)
IndicatedMeasuredError %
1.0 53.0056.837.230.6255.0055.350.64
3.0 58.1355.00−5.380.9459.0060.953.31
5.5 62.1759.00−5.102.0161.0061.911.490.88
10.5 66.1364.00−3.223.9663.0064.943.082.81
15.0 70.0068.00−2.866.4568.0069.802.655.77
18.0 74.3073.00−1.7510.1572.0075.805.2811.69
18.02.575.9075.00−1.1911.9975.0080.206.9310.30
Table 4. Maximum ESAK and Maximum image receptor input air kerma rates.
FluoroscopyMode of OperationFrontalLateral
VascularCardiacVascularCardiac
Maximum ESAK (5 mm Al + 5 mm Cu)
Unit IContinuous (mGy/min.)8.04-9.00
Pulsed (mGy/f)0.010.010.010.01
Unit IIContinuous (mGy/min.)20.640.419.539.2
Pulsed (mGy/f)0.020.040.020.04
Maximum FPD input air kerma rates (2 mm Cu)
Unit IContinuous (µGy/s)0.290.180.39-
Pulsed (µGy/f)0.020.010.0310.01
Unit IIContinuous (µGy/s)-0.720.100.94
Pulsed (µGy/f)0.0740.047-0.06
Table 5. Comparison of ESAK values obtained in this study for standard sized patient equivalent phantom with those reported in the literature.
PhantomESAK (mGy/min)IR Input (µGy/s)Digital Acquisition
(µGy/Frame)
Detector
Suliman, et al. * (This Study)5 mm Al + 5 mm Cu8.0–9.00.2–0.40.1FP
18 cm PMMA + 2.5 mm Al10.3–12.0----FP
O’Connor, et al. (2008)20 cm water4.60.62.6FP
Koichi Chida1, et al. (2009)20 cm water16.6 ± 7.9--0.20 ± 0.10FP
20 cm water17.8--0.20 ± 0.10II
II
* Note: 5 mm Al + 5 mm Cu used in this study is equivalent to 24 cm PMMA phantom.
Table 6. Radiation protection and safety measurements.
Minimum SIDScatter Radiation at 1 mAmbient Dose RatesWarning Signs
Controlled AreasSupervised Areas
Tolerance Ref. [10]45 cm20 µGymin−188 (µGy/wk)18 (µGy/wk)Availability
Unit I
Frontal584.0<10<10Available
Lateral464.7<10<10Available
Unit II
Frontal584.4<10<10Available
Lateral464.7<10<10Available
Publisher’s Note: MDPI stays neutral with regard to jurisdictional claims in published maps and institutional affiliations.

