Review

Systematic Literature Review on Machine Learning and Student Performance Prediction: Critical Gaps and Possible Remedies

Applied Artificial Intelligence Research Centre, Near East University, N. Cyprus, via Mersin 10, Nicosia 99138, Turkey
*
Author to whom correspondence should be addressed.
These authors contributed equally to this work.
Appl. Sci. 2021, 11(22), 10907; https://doi.org/10.3390/app112210907
Submission received: 27 September 2021 / Revised: 14 November 2021 / Accepted: 15 November 2021 / Published: 18 November 2021
(This article belongs to the Special Issue Advances in Artificial Intelligence Learning Technologies)

Abstract

:
Improving the quality, developing and implementing systems that can provide advantages to students, and predicting students’ success during the term, at the end of the term, or in the future are some of the primary aims of education. Due to its unique ability to create relationships and obtain accurate results, artificial intelligence and machine learning are tools used in this field to achieve the expected goals. However, the diversity of studies and the differences in their content create confusion and reduce their ability to pioneer future studies. In this study, we performed a systematic literature review of student performance prediction studies in three different databases between 2010 and 2020. The results are presented as percentages by categorizing them as either model, dataset, validation, evaluation, or aims. The common points and differences in the studies are determined, and critical gaps and possible remedies are presented. The results and identified gaps could be eliminated with standardized evaluation and validation strategies. It is determined that student performance prediction studies should be more frequently focused on deep learning models in the future. Finally, the problems that can be solved using a global dataset created by a global education information consortium, as well as its advantages, are presented.

1. Introduction

Rather than aiming to mimic human intelligence, artificial intelligence (AI) seeks to create a sequence of processes that can implement skills that are inaccessible to human intelligence. However, as the human brain is described as the most complex machine in the universe, all created AI models are consistently compared with human intelligence and efforts have increased to create machines that can think, speak, and make decisions as humans do. Nevertheless, even though the first quarter of the 21st century has almost ended, AI is still mainly used to support humans and appears to be far from being implemented comprehensively.
The application areas of AI and its sub-field, machine learning (ML), are not limited to the subjects in which people have existing knowledge, but have spread to every field that provides new knowledge and developments in different business [1] or scientific areas [2,3]. In almost every field of engineering, social, and medical science, AI research contributes to humanity, science, or artificial intelligence studies, resembling both large and small bricks used to construct a building. In recent years, there has been increased interest in studies on AI in Educational Sciences (ES) as this building remains incomplete.
Education is the most crucial element that facilitates the development and progress of individuals and, consequently, countries. Novel studies are continually being conducted in Educational Sciences to accelerate this development and progress, make it more efficient, and provide new services. At the same time, the importance of AI in research and applications in education is increasing, as AI and ML applications and research are being performed in different ES fields to drive education [4,5]. Updating course content for teachers [6], enabling students to receive personalized education [7,8], promoting smart course selection in higher education [9], and exam-paper preparation [10] are just a few examples of these applications.
In recent decades, attempts have been made to predict student performance, both during and at the end of term, employing the classification and regression skills of ML models by using the information obtained from questionnaires, demographic information [11,12], or stored Massive Open Online Courses (MOOCs), mobile autonomous school (MAS) and blended course information [13,14,15]. These studies aimed to increase student achievement levels, provide more effective and individualized teaching strategies for students, and improve their learning skills by predicting the performance of students at the end of term [16], during the active semester [17], or by determining the risk levels [18,19,20], drop-out probabilities [21,22], or the factors that are most influential on student performance [23].
However, different machine learning models, varied datasets, and different evaluation and validation criteria were reported in these studies, which has led to difficulties in determining the direction of future research, level of success and efficiency, and knowledge provided by the ML models for this field.
This study aims to provide a reference to researchers for developing more applicable prediction systems for real-life situations by identifying the developments and gaps in the existing student performance prediction studies from a broad perspective and proposing remedies to these gaps. Therefore, a summary of the ML models, validation techniques, and evaluation criteria commonly used in ML studies is presented.
Secondly, a systematic literature review was conducted in accordance with the PRISMA statement [24], covering the period between 2010 and 2020. The frequency of use of ML methods, evaluation criteria, and validation techniques obtained in the results were determined as percentages, and the general objectives of the research in this field, their effects in directing these objectives, and the datasets used are listed.
Considering the changing data and developing ML studies, gaps were determined. Possible solutions are presented to carry out student performance prediction studies at a standard level and develop more applicable systems in the future, particularly from the ML perspective.
The rest of the paper is organized as follows: Section 2 summarizes the basic principles of ML models and common metrics considered in the student performance evaluation studies. Section 3 presents the methodology and the results of a systematic literature review on student performance prediction studies. Section 4 presents a general discussion of the obtained results and potential remedies for the identified gaps. Finally, Section 5 presents the conclusions of the study.

2. Overview of Machine Learning Principles

This section summarizes the most widely used ML models in student performance prediction studies. In addition, the common evaluation metrics and validation strategies are reviewed.

2.1. Overview of Machine Learning Models

There are different types of machine learning. Student performance evaluation researchers mostly consider supervised learning [16,25,26], where the corresponding output data are fed to the classifier or regressor with input data.
The supervised learning applications in machine learning methods can be separated into two categories, namely classification and regression methods [27]. Classification tasks have a finite number of output classes, where the input data belong to one of the classes, while in regression tasks, an infinite number of outputs are represented as real-valued data.
Some of the supervised ML techniques can be used for a particular task, whereas others can be used for both classification and regression tasks by applying some modifications.
In supervised learning ML, only the inputs are sent to the model and the aim is to classify the data or divide them into clusters. Table 1 shows the ML models and the tasks that could be considered.
The following subsections summarize the machine learning models commonly used directly or indirectly for predicting student performance.

2.1.1. Decision Trees

A DT is the hierarchical representation of data instances and attributes. Decision trees (DTs) [28] are used for both regression and classification tasks [16,29]. A tree form is created with a starting node (root node), and decisions are performed in decision nodes. The main advantage of a DT is the low computational time required after its creation. However, various different DTs can be constructed by changing the root or decision nodes, and the determination of the sequences of these nodes is the main drawback of the DT [30].
The Gini and entropy algorithms are commonly used to construct decision trees for classification, whereas mean squared error (MSE) is frequently utilized for regression problems.

2.1.2. Random Forest

Random forest (RF) [31] is a tree-based ensemble method that constructs several DTs during data training and applies optimization by considering the mean regression of the constructed individual trees. It is widely used for both classification and regression applications [32,33].

2.1.3. Gradient Boosting

Gradient boosting is another kind of tree-based ensemble machine learning algorithm [34]. It optimizes the outputs by considering the loss obtained by the weak learners, which are also DTs. A newly constructed or modified DT is added to minimize the total loss using a gradient descent algorithm. The gradient boosting algorithm is effectively used for regression and classification tasks.

2.1.4. Extreme Gradient Boosting

Extreme gradient boosting [35] is also an ensemble tree method that applies the principle of boosting weak learners using the gradient descent algorithm, similar to the gradient boosting algorithm. However, XGBoost includes different regularization models (i.e., LASSO) to overcome overfitting problems during the learning process. In addition, built-in cross-validation is applied in each iteration to determine the exact number of iterations on a single run.

2.1.5. Support Vector Machine and Support Vector Regression

The support vector machine (SVM) [36] is a classifier, while its modified version, support vector regression (SVR), is used for regression tasks.
In SVM, support vectors, which are the closest data points of each class to each other, are assigned after mapping the data into hyperspace using a kernel function and then classifying them. Therefore, a subset created by the support vectors from the input data to minimize the distance between the input data points and hyperplane is used for the classification.
SVR uses real-valued data as inputs and produces real-valued outputs for prediction tasks, instead of binary outputs [37]. The mapping procedure of SVR is the same as that of SVM, and the projection of data into a higher dimension makes the classification and prediction of non-linear data possible.
Different kernel functions, such as quadratic, polynomial, linear, and radial basis functions, can be used in both SVM and SVR.

2.1.6. Artificial Neural Networks and Deep Neural Networks

Artificial neural networks (ANNs) try to simulate the human brain’s biological aspects and mimic human abilities on computers. They consist of input, hidden, and output layers, where all layers include different numbers of neurons depending on the application and the parameter tuning. The ANN output is compared to the target outputs in supervised learning and the calculated error propagates back to update weights and minimize error. These self-organization characteristics of ANNs enable the achievement of superior results in complicated and non-linear tasks.
An increase in the number of hidden layers (more than two hidden layers) causes an ANN to become a deep structure called a deep neural network. Generally, it is used for more complicated tasks and datasets with a higher number of instances and attributes [38].

2.1.7. Logistic Regression

Contrary to its name, logistic regression is a method that is only used for classification problems. Although it is characteristically similar to linear regression, it can only be considered in classification tasks since it uses the logistic function (Sigmoid) as the activation function to differentiate the data into certain classes. It is a widely used method in classification studies [39].

2.1.8. Linear Regression

Linear regression is the most common statistical method that is considered in regression tasks. It draws the best-fitting regression line through the observed data points. It is still one of the most popular regression methods since it achieves high prediction rates on datasets in which the attributes and instances have a linear correlation with each other [40].

2.1.9. Long Short-Term Memory Neural Network

A long short-term memory (LSTM) neural network is a special type of recurrent network that can be used for both problem domains. However, it is widely employed in regression problems [41]. There are four major components within the LSTM cell architecture, namely the cell, input gate, output gate, and forget gate. Input gates remove irrelevant information and forget gates add new information into the cell. The output gate fits the information obtained from other gates. The previous errors are remembered by the LSTM cells during the weights updates and enable effective convergence of the network.

2.2. Evaluation and Validation Strategies

The regression and classification tasks have different evaluation metrics since the outputs produced by the models are different. However, the validation of both problem domains has similar approaches related to the division of data for training and testing sets.

2.2.1. Evaluation Metrics for Classification Tasks

Classification studies of student performance prediction, in which the aim is to determine the student performance according to classes (i.e., Low/Medium/High, or Pass/Fail, etc.), generally consider accuracy based on correct and misclassified samples [42,43]. The accuracy is obtained by dividing the total number of correctly classified samples by the total number of samples within the test set. However, there are limitations in terms of accuracy if the dataset is imbalanced. If any class or output of the dataset has significantly more or fewer samples than the other classes, the obtained accuracy prevents the models’ ability from being evaluated [44,45]. The formula for accuracy is shown in Equation (1).
A c c u r a c y = T P + T N F P + F N + T P + T N
where T P , F P , T N , and F N denote the true positive, false positive, true negative, and false negative values obtained by the model.
Even though uncertainties remain in measuring the results obtained on imbalanced data, the receiver operating characteristics area under curve (ROC AUC) is one of the most commonly used metrics, especially for two-class imbalanced data [45]. It is used to measure the ability of the model using the area under the curve of the recall (sensitivity/true positive ratio) and the false positive ratio.
Another common metric is the F1 score. It is defined as the harmonic mean of precision and recall [45]. The F1 score is one of the metrics commonly used in both binary and multiclass problems with imbalanced data. The formula of the F1 score is shown in Equation (2):
F 1 S c o r e = T P T P + 1 2 ( F P + F N )
The other evaluation metrics of classification tasks can be listed as recall (sensitivity), specificity, and precision, which are used to measure the particular abilities of the models in detecting specific output classes. The formulae for recall, specificity, and precision are shown in Equations (3)–(5).
R e c a l l = T P T P + F N
S p e c i f i c i t y = T N T N + F P
P r e c i s i o n = T P T P + F P

2.2.2. Evaluation Metrics for Regression Tasks

The general aim of regression studies in student performance prediction is to predict the raw results of the students (i.e., Quiz: 8, Final: 67, Total: 87, CGPA: 2.89). Since the samples are not assigned to a specific class in regression problems, the evaluation of the models is based on real-valued data, usually considering the difference between the predicted and observed data. The most commonly used metrics are mean squared error (MSE), mean absolute error (MAE), and coefficient of determination ( R 2 score).
MSE considers outliers between the predicted and observed data more than other metrics by squaring the difference. However, tolerable errors may cause underestimation of the error [46]. The formula of MSE is shown in Equation (6).
M S E = 1 N i = 1 N ( y i y ¯ i ) 2
where N represents the samples in the dataset, and y i and y ¯ i denote the actual and predicted values, respectively.
MAE measures the magnitude of the errors between predicted and observed data. The direction of the error is not considered as in MSE. More consistent results might be obtained using MAE [29]. The formula of MAE is shown in Equation (7).
M A E = 1 N i = 1 N | y i y ¯ i |
The R 2 score is the scaled correlation level of predicted and observed data. This allows researchers to generally obtain and analyze the evaluation results more robustly [46]. The formula of the R 2 score is shown in Equation (8).
R 2 s c o r e = 1 ( y i y ¯ i ) ( y i y ^ i )
where y ^ i denotes the mean value of the samples in the dataset.

2.2.3. Validation Methods

ML models are validated using different techniques. Although these techniques vary considerably, studies have considered the hold-out, cross-validation [30], and data selection (data mining) approaches to validate models during the convergence of the models. Determining the instances or attributes with data mining methods enables the direct selection of data for training. However, if training data are not selected with any data mining method, it is known that the most effective method in this situation is the cross-validation method [47].
Small changes in training data could change the results significantly. In comparison, the hold-out method only uses certain dataset partitions in the training and testing phases separately (i.e., 70% training, 30% testing); the actual ability is revealed in cross-validation since all the data are used for both training and testing. Since cross-validation divides the dataset into k partitions and iteratively uses all partitions in the training and testing phases, it produces more realistic results on the skills of the models [47].
Additionally, another advantage of cross-validation is that it can be used for hyperparameter tuning. This provides a faster operation than the hold-out method in order to tune the parameters of the model.

3. Results of Systematic Literature Review
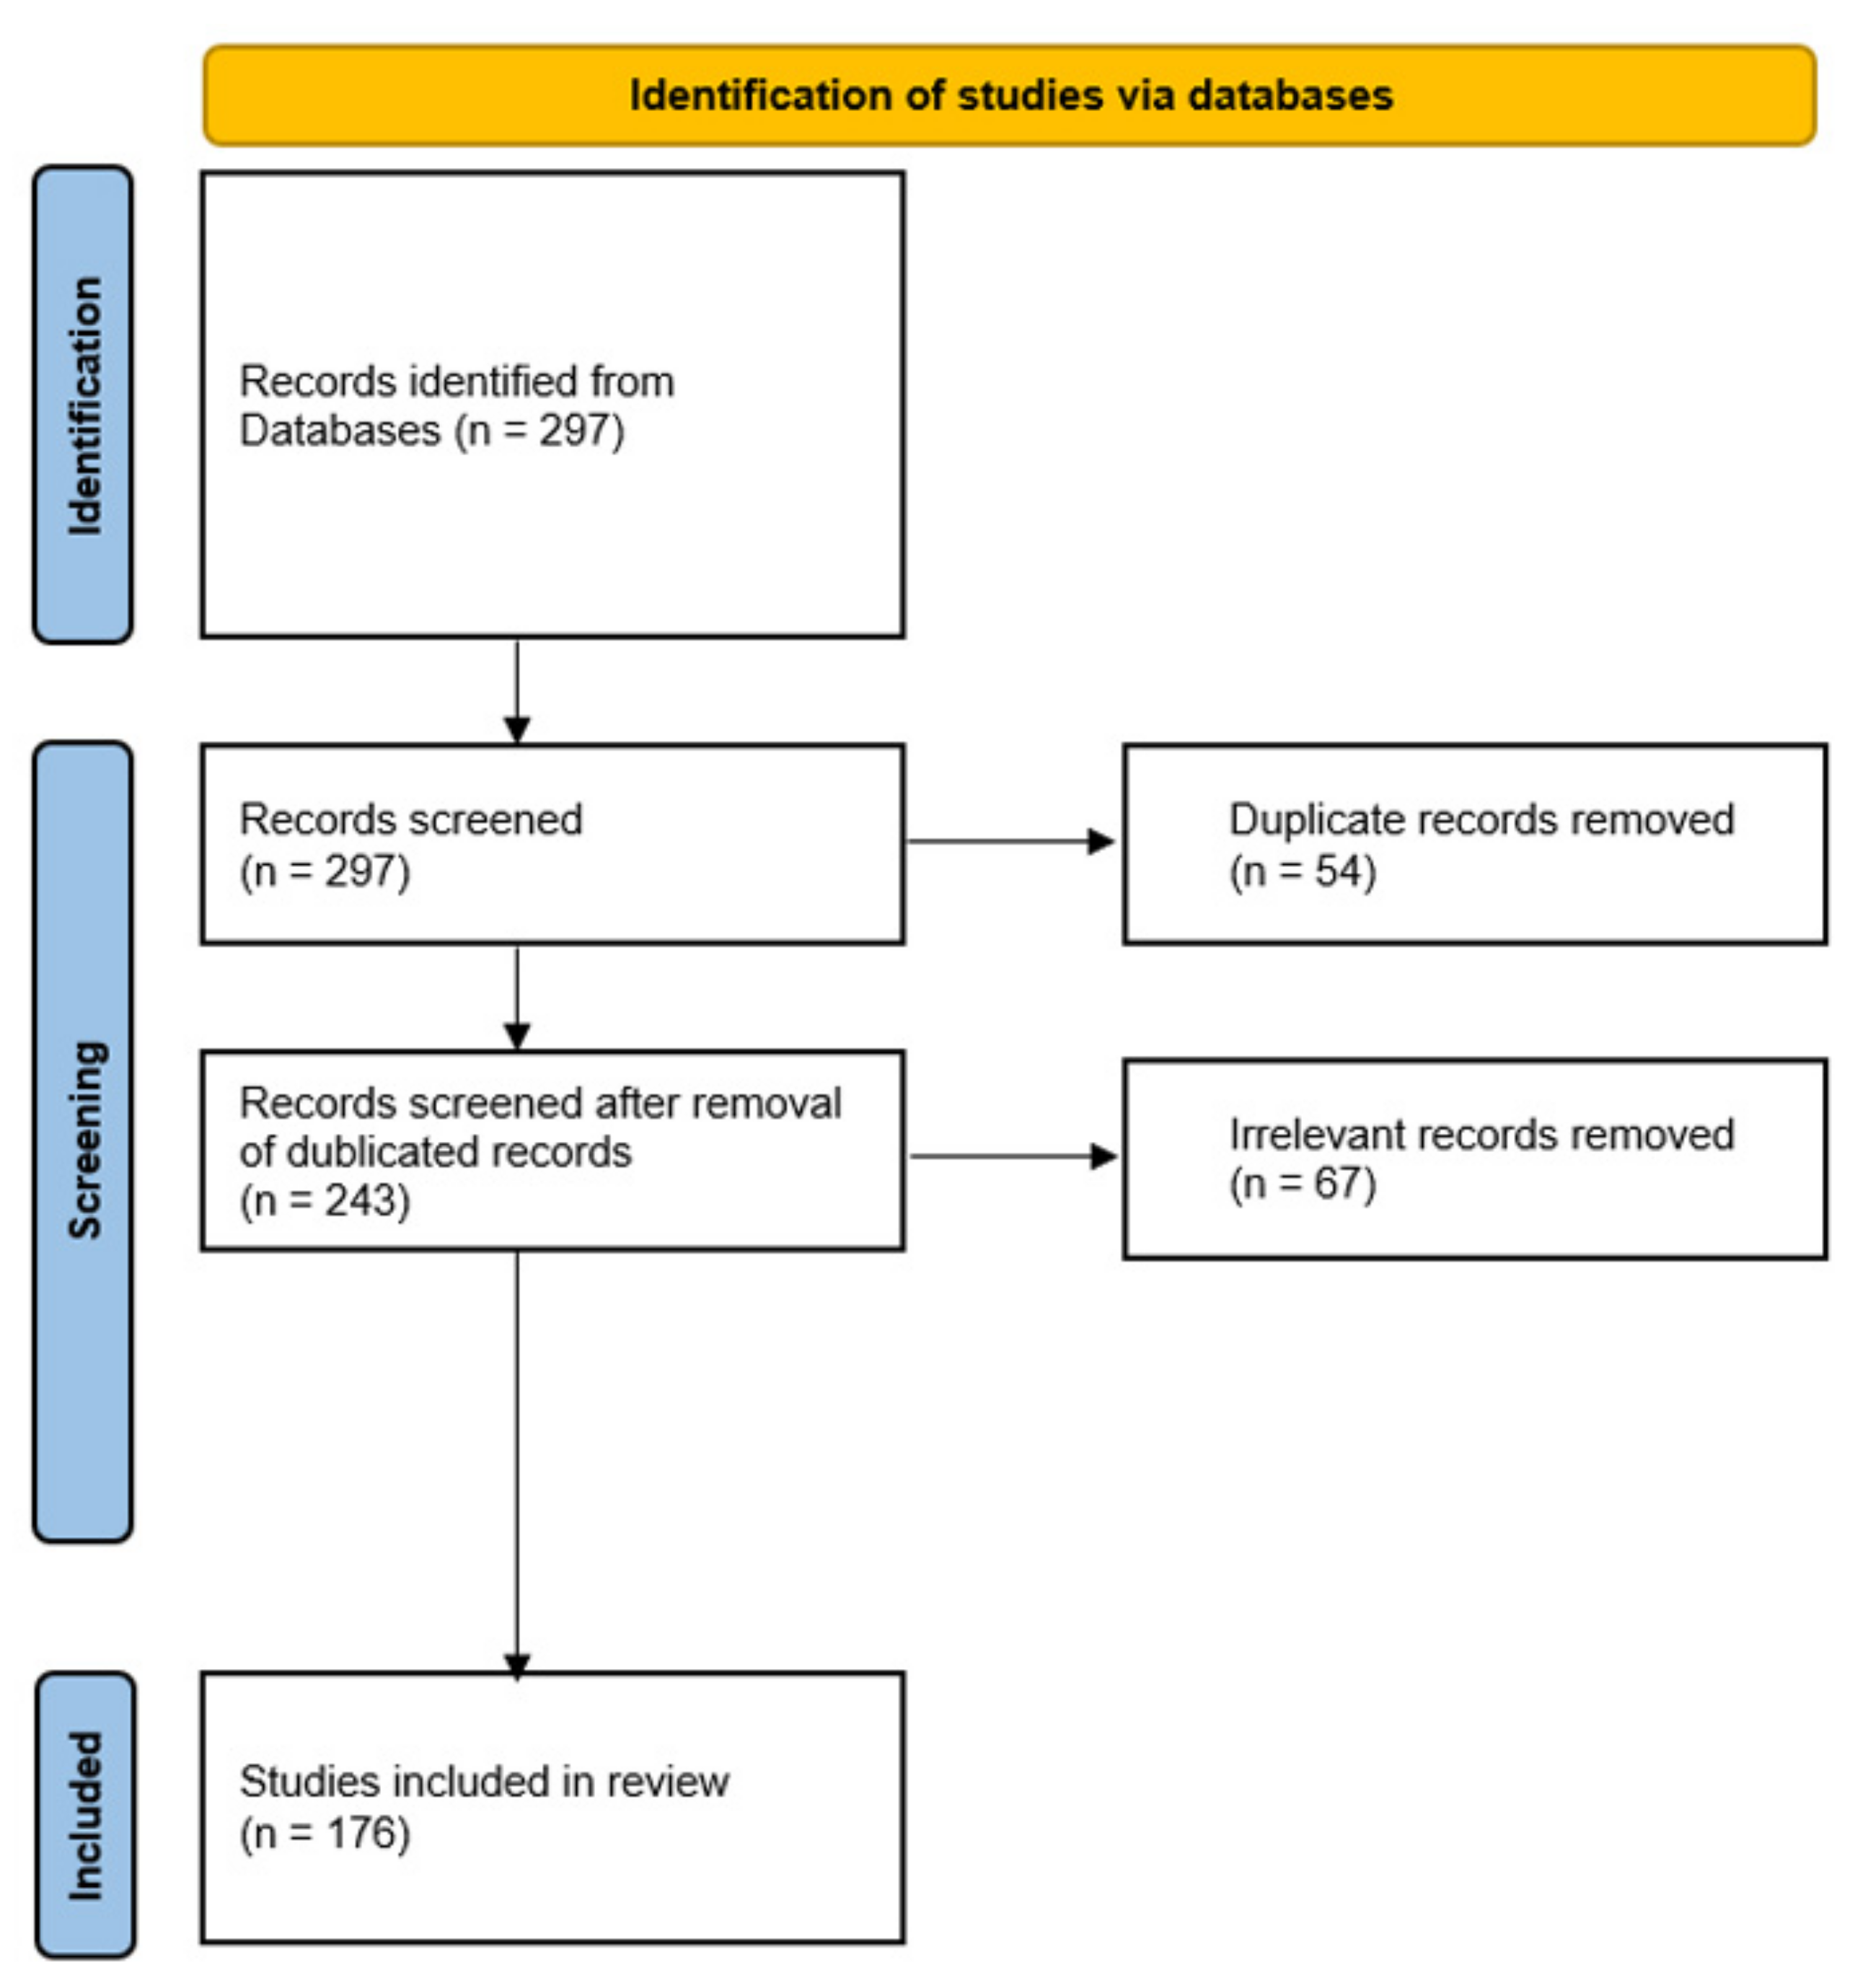
This section presents the methodology and results of the systematic literature review.

3.1. Methodology

3.1.1. Search Strategy

In this study, a systematic literature review was performed to present the frequencies of machine learning models, evaluation metrics, and validation methods used in student performance prediction studies in percentages. Thus, it was shown how the results could vary depending on the methods and datasets used. The number of publications in the considered databases was presented to demonstrate the increasing interest in student performance prediction studies.
This systematic literature review was performed in accordance with the PRISMA statement. A literature search was performed on three citation databases, namely Scopus, Web of Science, and IEEEXplore, for studies published between 1 January 2010 and 31 December 2020.
The literature search consisted of three search terms: “Student Performance”, “prediction”, and “machine learning”. The search query was applied as (Student Performance AND prediction OR machine learning) to extract all articles focused on the prediction of student performance using machine learning models.

3.1.2. Inclusion and Exclusion Criteria

The studies that satisfied the following criteria were included:
  • Research papers (published in scientific peer-reviewed journals);
  • Studies that implemented or proposed machine learning and/or deep learning models to predict student performance for all levels of education;
  • The research was reported in English.
The exclusion criteria were determined as:
  • Studies that focused on student performance but did not implement machine learning models;
  • Review studies, abstracts, commentaries, book chapters, or editorials.

3.1.3. Selection Procedure and Data Extraction

After removing duplicate studies, titles and abstracts were screened to select the relevant studies based on the inclusion and exclusion criteria. All authors participated in the selection of papers that met the exclusion criteria, and the remaining studies were assessed. Figure 1 presents a detailed flow chart of the study selection procedure.
Data were extracted based on five objectives: (1) aim of the study—regression or classification, (2) aims for educational expectations, (3) the methodology used—validation and evaluation of the studies, (4) datasets, and (5) considered machine learning models.
We included 29 studies for further investigation in this review. The studies were selected to cover and answer all the objectives of this study from a broad perspective, such as varied educational levels, objectives, different evaluation and validation techniques, and machine learning models. Table 2 presents the characteristics of the studies selected for further investigation.

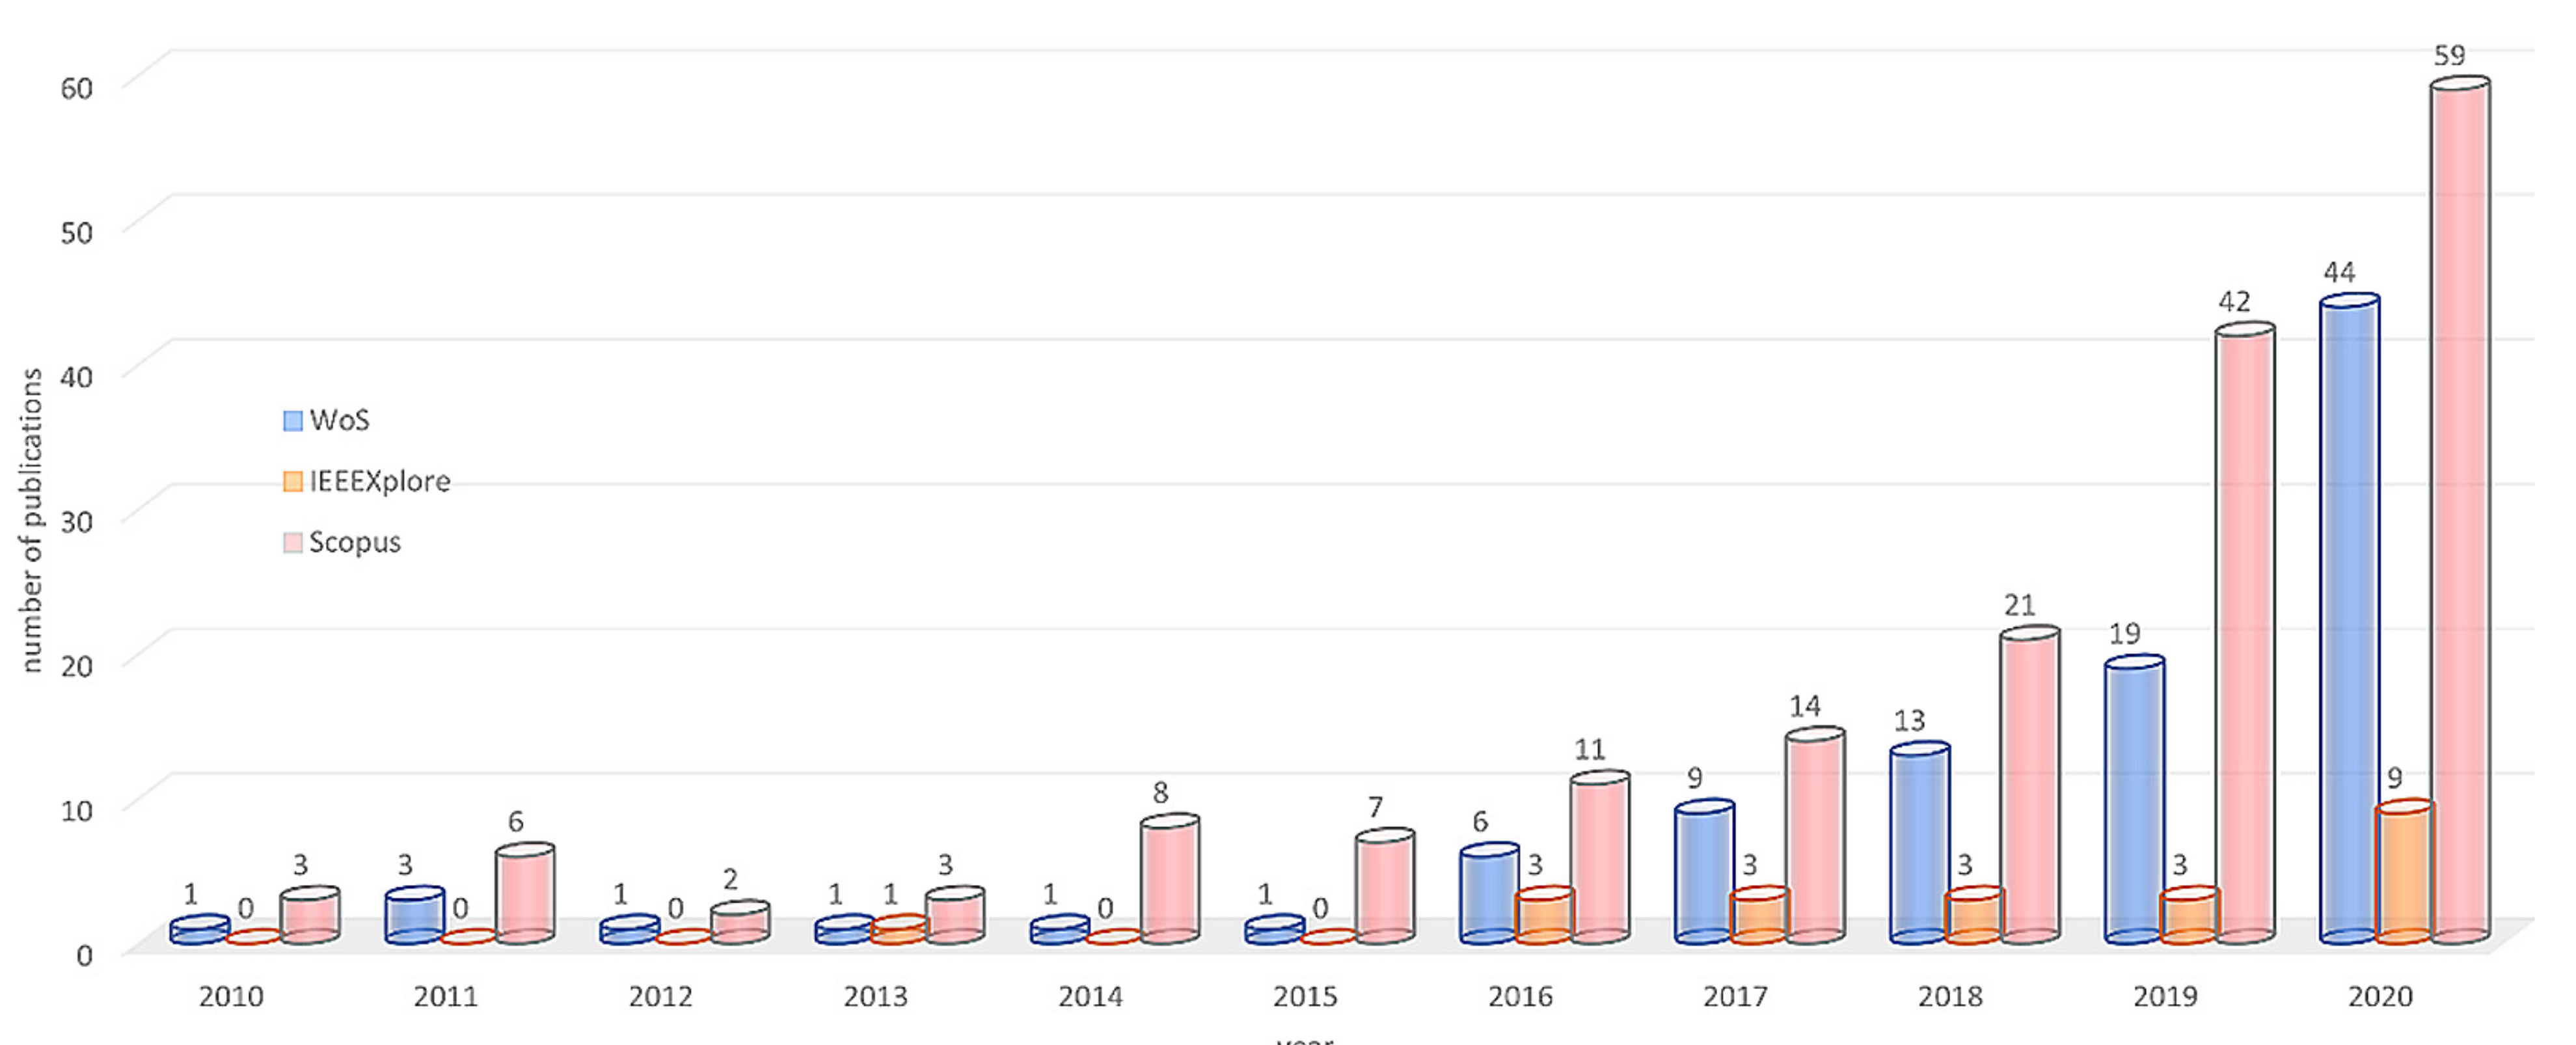
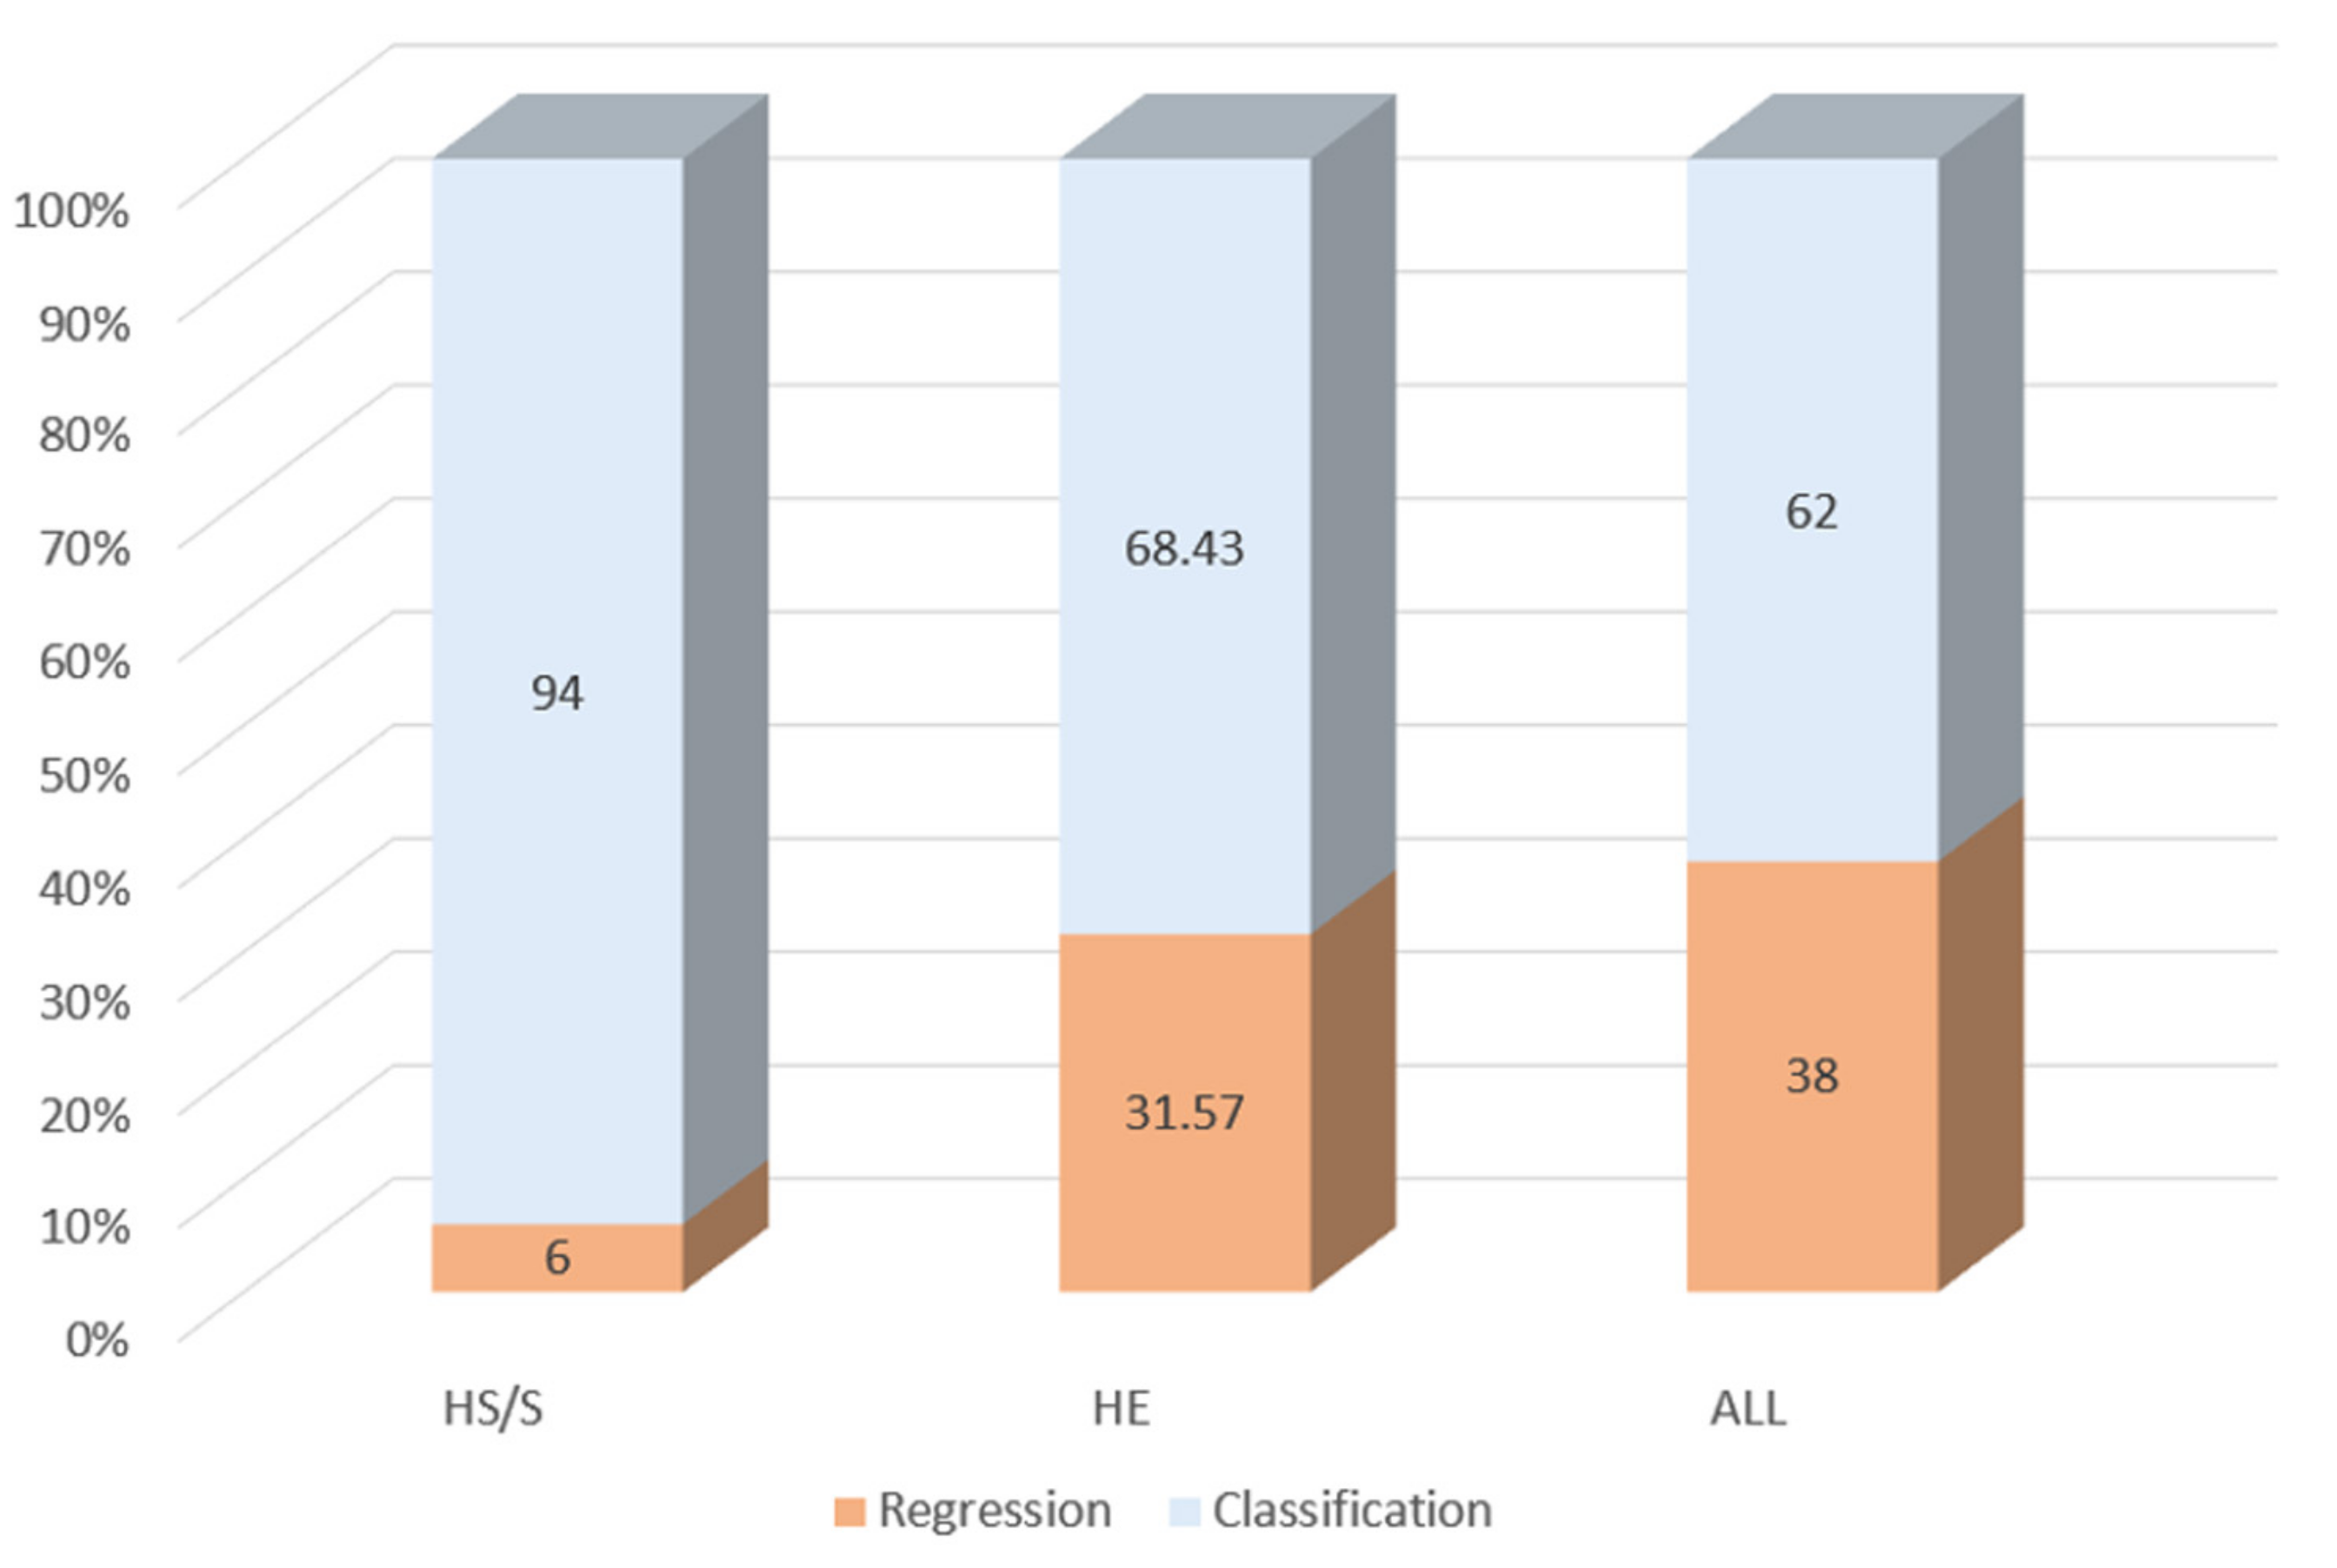
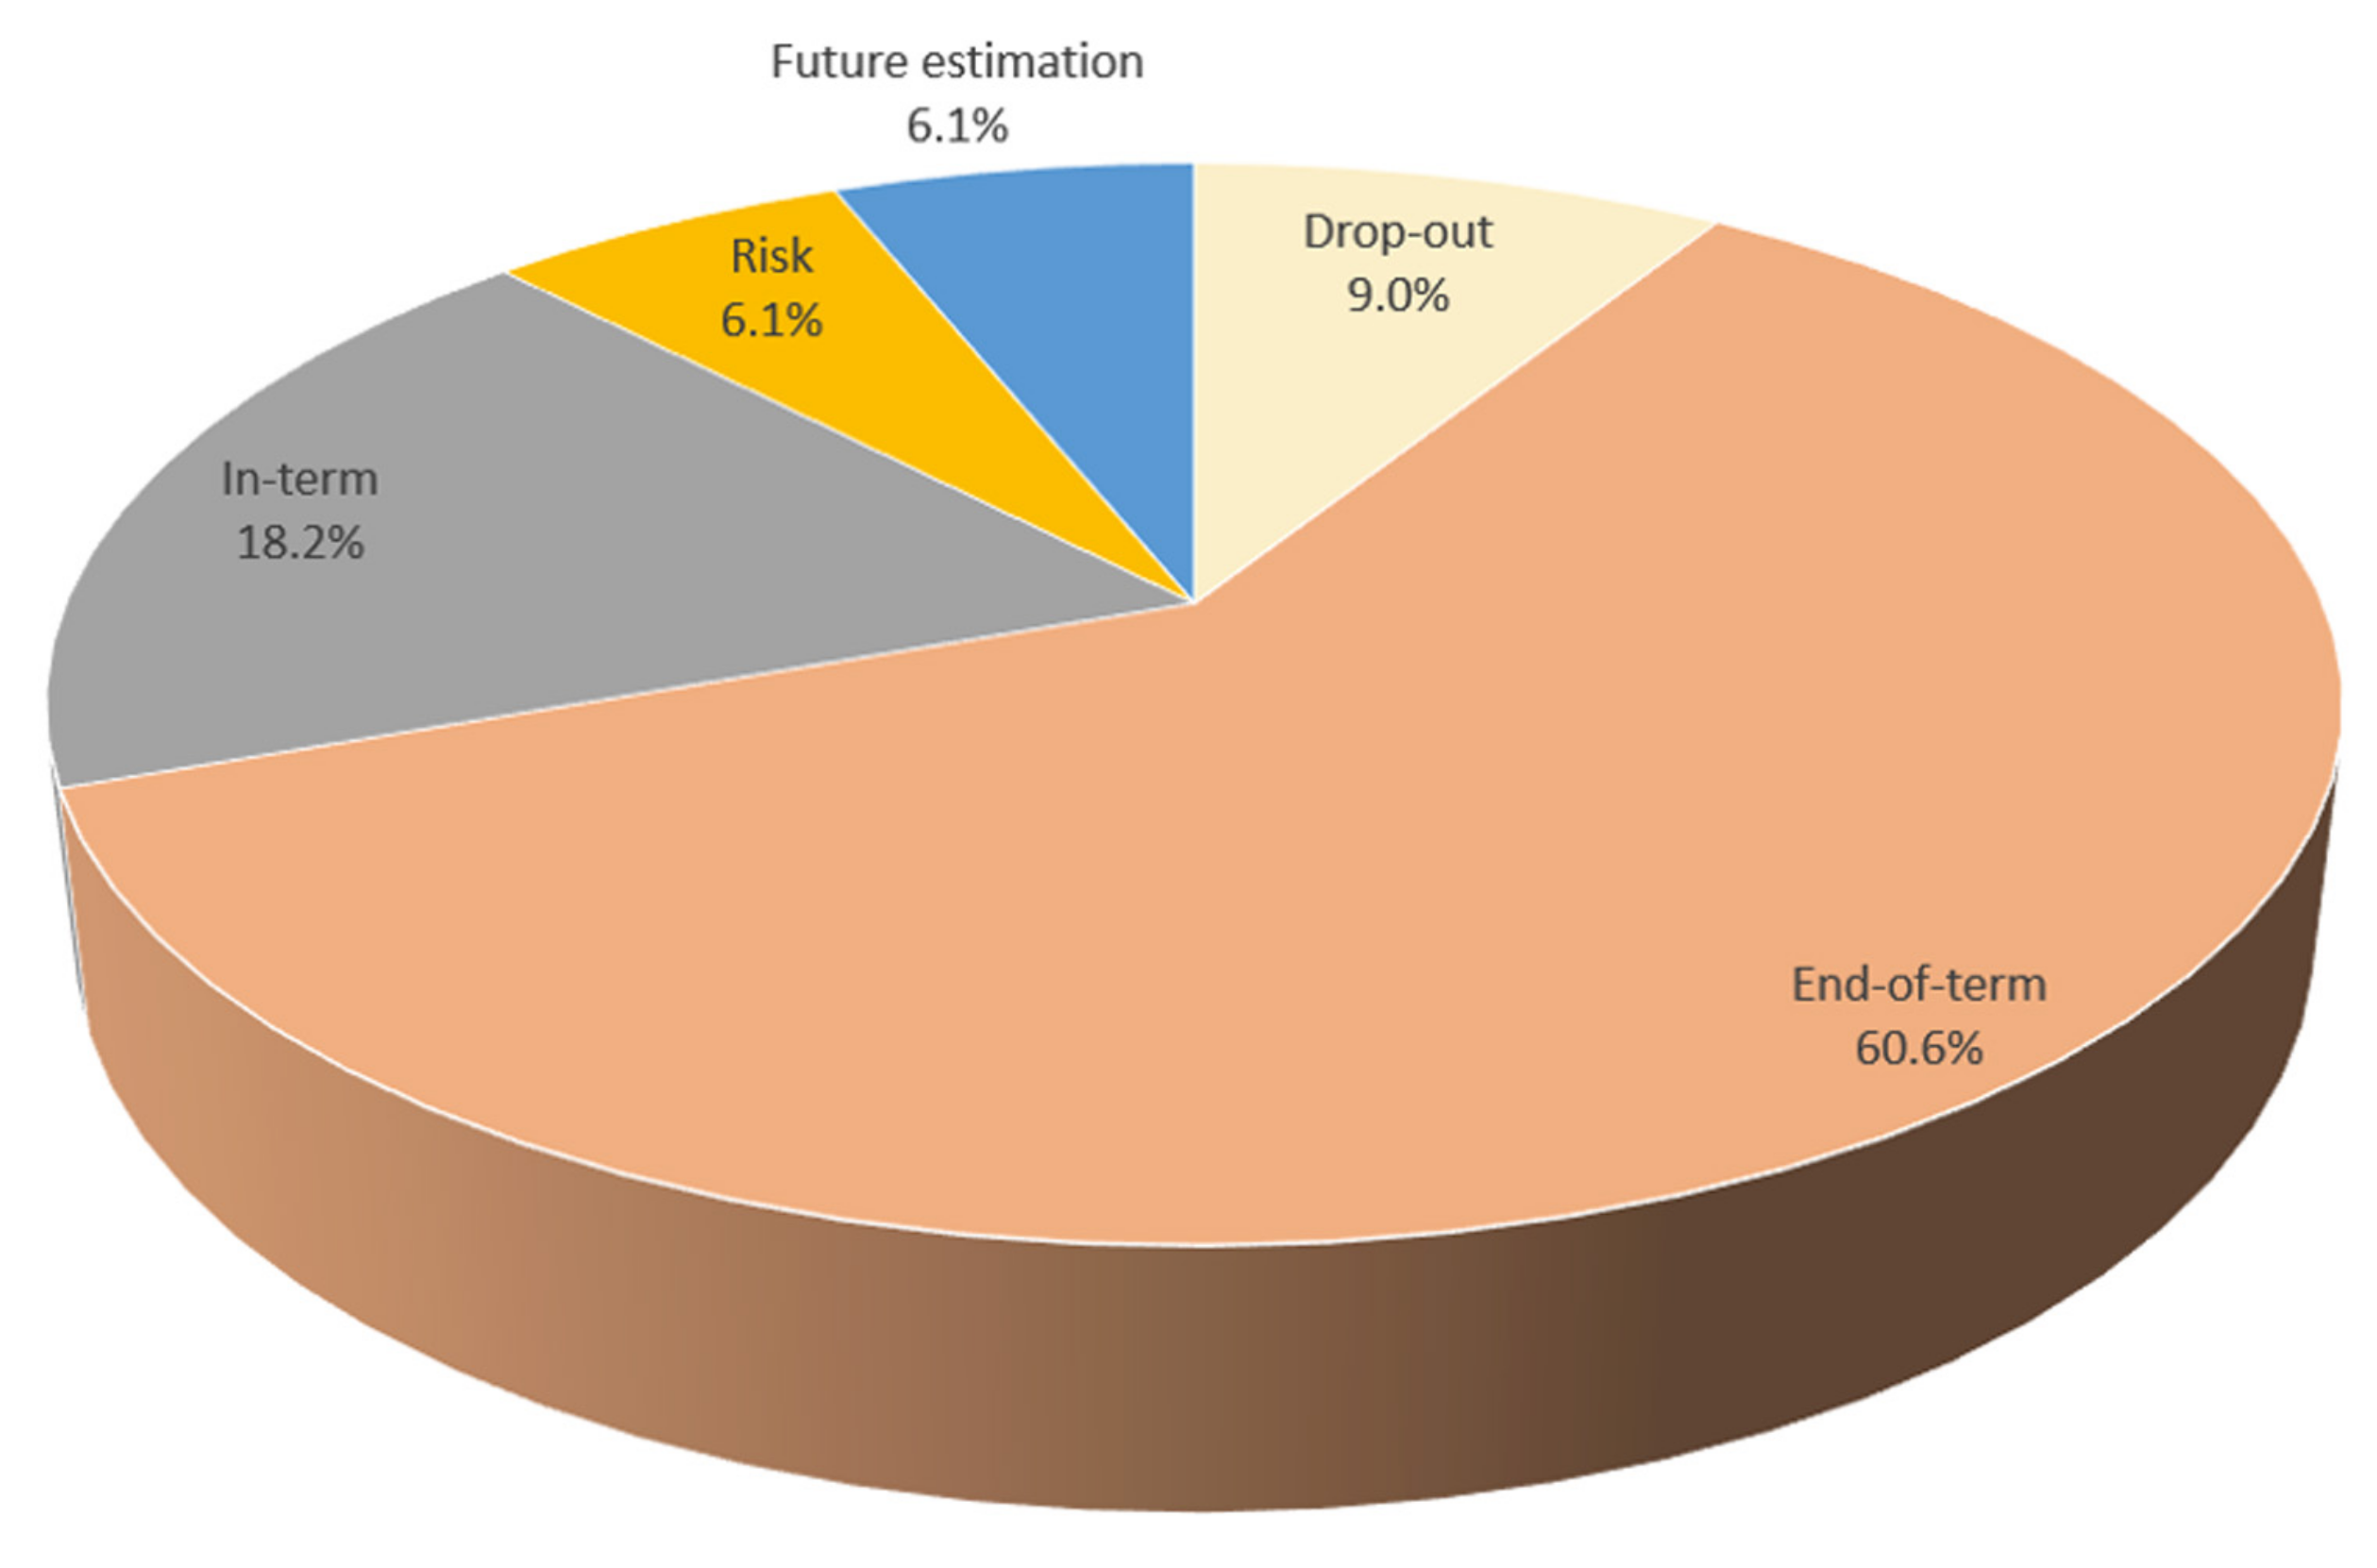
3.2. Publication Numbers and Aims

The total number of publications extracted by the literature research conducted between 2010 and 2020 from the three citation databases mentioned above was 297, but this number decreased to 176 when duplicate studies and the publications that met the exclusion criteria were excluded.
It was observed that studies on student performance prediction using artificial intelligence started to gain attention after 2015. While 83.5% (147/176) of the total number of unduplicated studies were published between 2016 and 2020, only 16.5% (29/176) were published between 2010 and 2015. Figure 2 demonstrates the number of publications in the citation databases per year and the publication ratios for the specified years.
We can evaluate the aims of the studies from many perspectives, such as machine learning properties or educational implications (i.e., performance evaluation using historical or current data of student records to predict end-of-term or in-term student performance).
When we consider the implementation of machine learning in studies, they can initially be categorized into regression and classification tasks. In contrast, regression implementations are aimed at predicting the raw end-of-term points that students can obtain (i.e., 85, 23, 98, etc.). Student achievement can be predicted according to categorized classes in classification applications (i.e., Low–Average–High, Passed–Failed, etc.). In this context, it was observed that the studies obtained in the literature review primarily focused on classification. A total of 62% (109/176) of the studies in the literature were on classification, whereas only 38% (67/176) were regression studies.
We can also categorize the studies according to their targeted education level as Higher Education (HE) and High School/Secondary Level (HS/S). The evaluation of the publications demonstrated that the research on student performance prediction primarily focused on the Higher Education level, although studies included both levels. The frequency of publications on the HE Level was 76.60% (135/176), while the frequency of HS/S Level studies was 23.40% (41/176). Figure 3 presents a bar chart showing the regression and classification studies for HS/S, HE, and all levels.
The main purpose of the studies should also be evaluated by considering the educational expectations that they directly target. The primary aims of the studies that stand out in the literature without differentiating as regression and classification applications can be generalized as estimation of course drop-outs [21,22], end-of-term/exam success level prediction [51,52,53], in-term success prediction [14], students’ risk identification [18,19,20], and the estimation of future success [54] for a particular course. Even though the studies were separated into five primary aims, the frequency of the end-of-term success prediction studies was the highest (60.60%—107/176). However, the studies on the prediction of students’ in-term success have gained importance in the last few years because of the increase in big data obtained from online platforms. The frequency of in-term prediction publications was 18.20% (32/176). These two primary applications were followed by drop-out estimation and student-at-risk studies (9.00%—15/176 and 6.10%—11/176, respectively). However, it should be noted that we can assign drop-out and student-at-risk studies to the end-of-term or in-term categories because these studies simultaneously focused on determining the drop-out probability of a particular course during or at the end of the semester.
The ability of ML models enables all studies to be implemented for estimating future success if they are expanded or modified. However, in this study, the publications focused directly on determining the student success for the following semesters are categorized into future success estimation. As a result, the frequency of these studies is only 6.10% (11/176) within all studies. Figure 4 shows the percentages for the identified aims of the student performance prediction studies in detail.

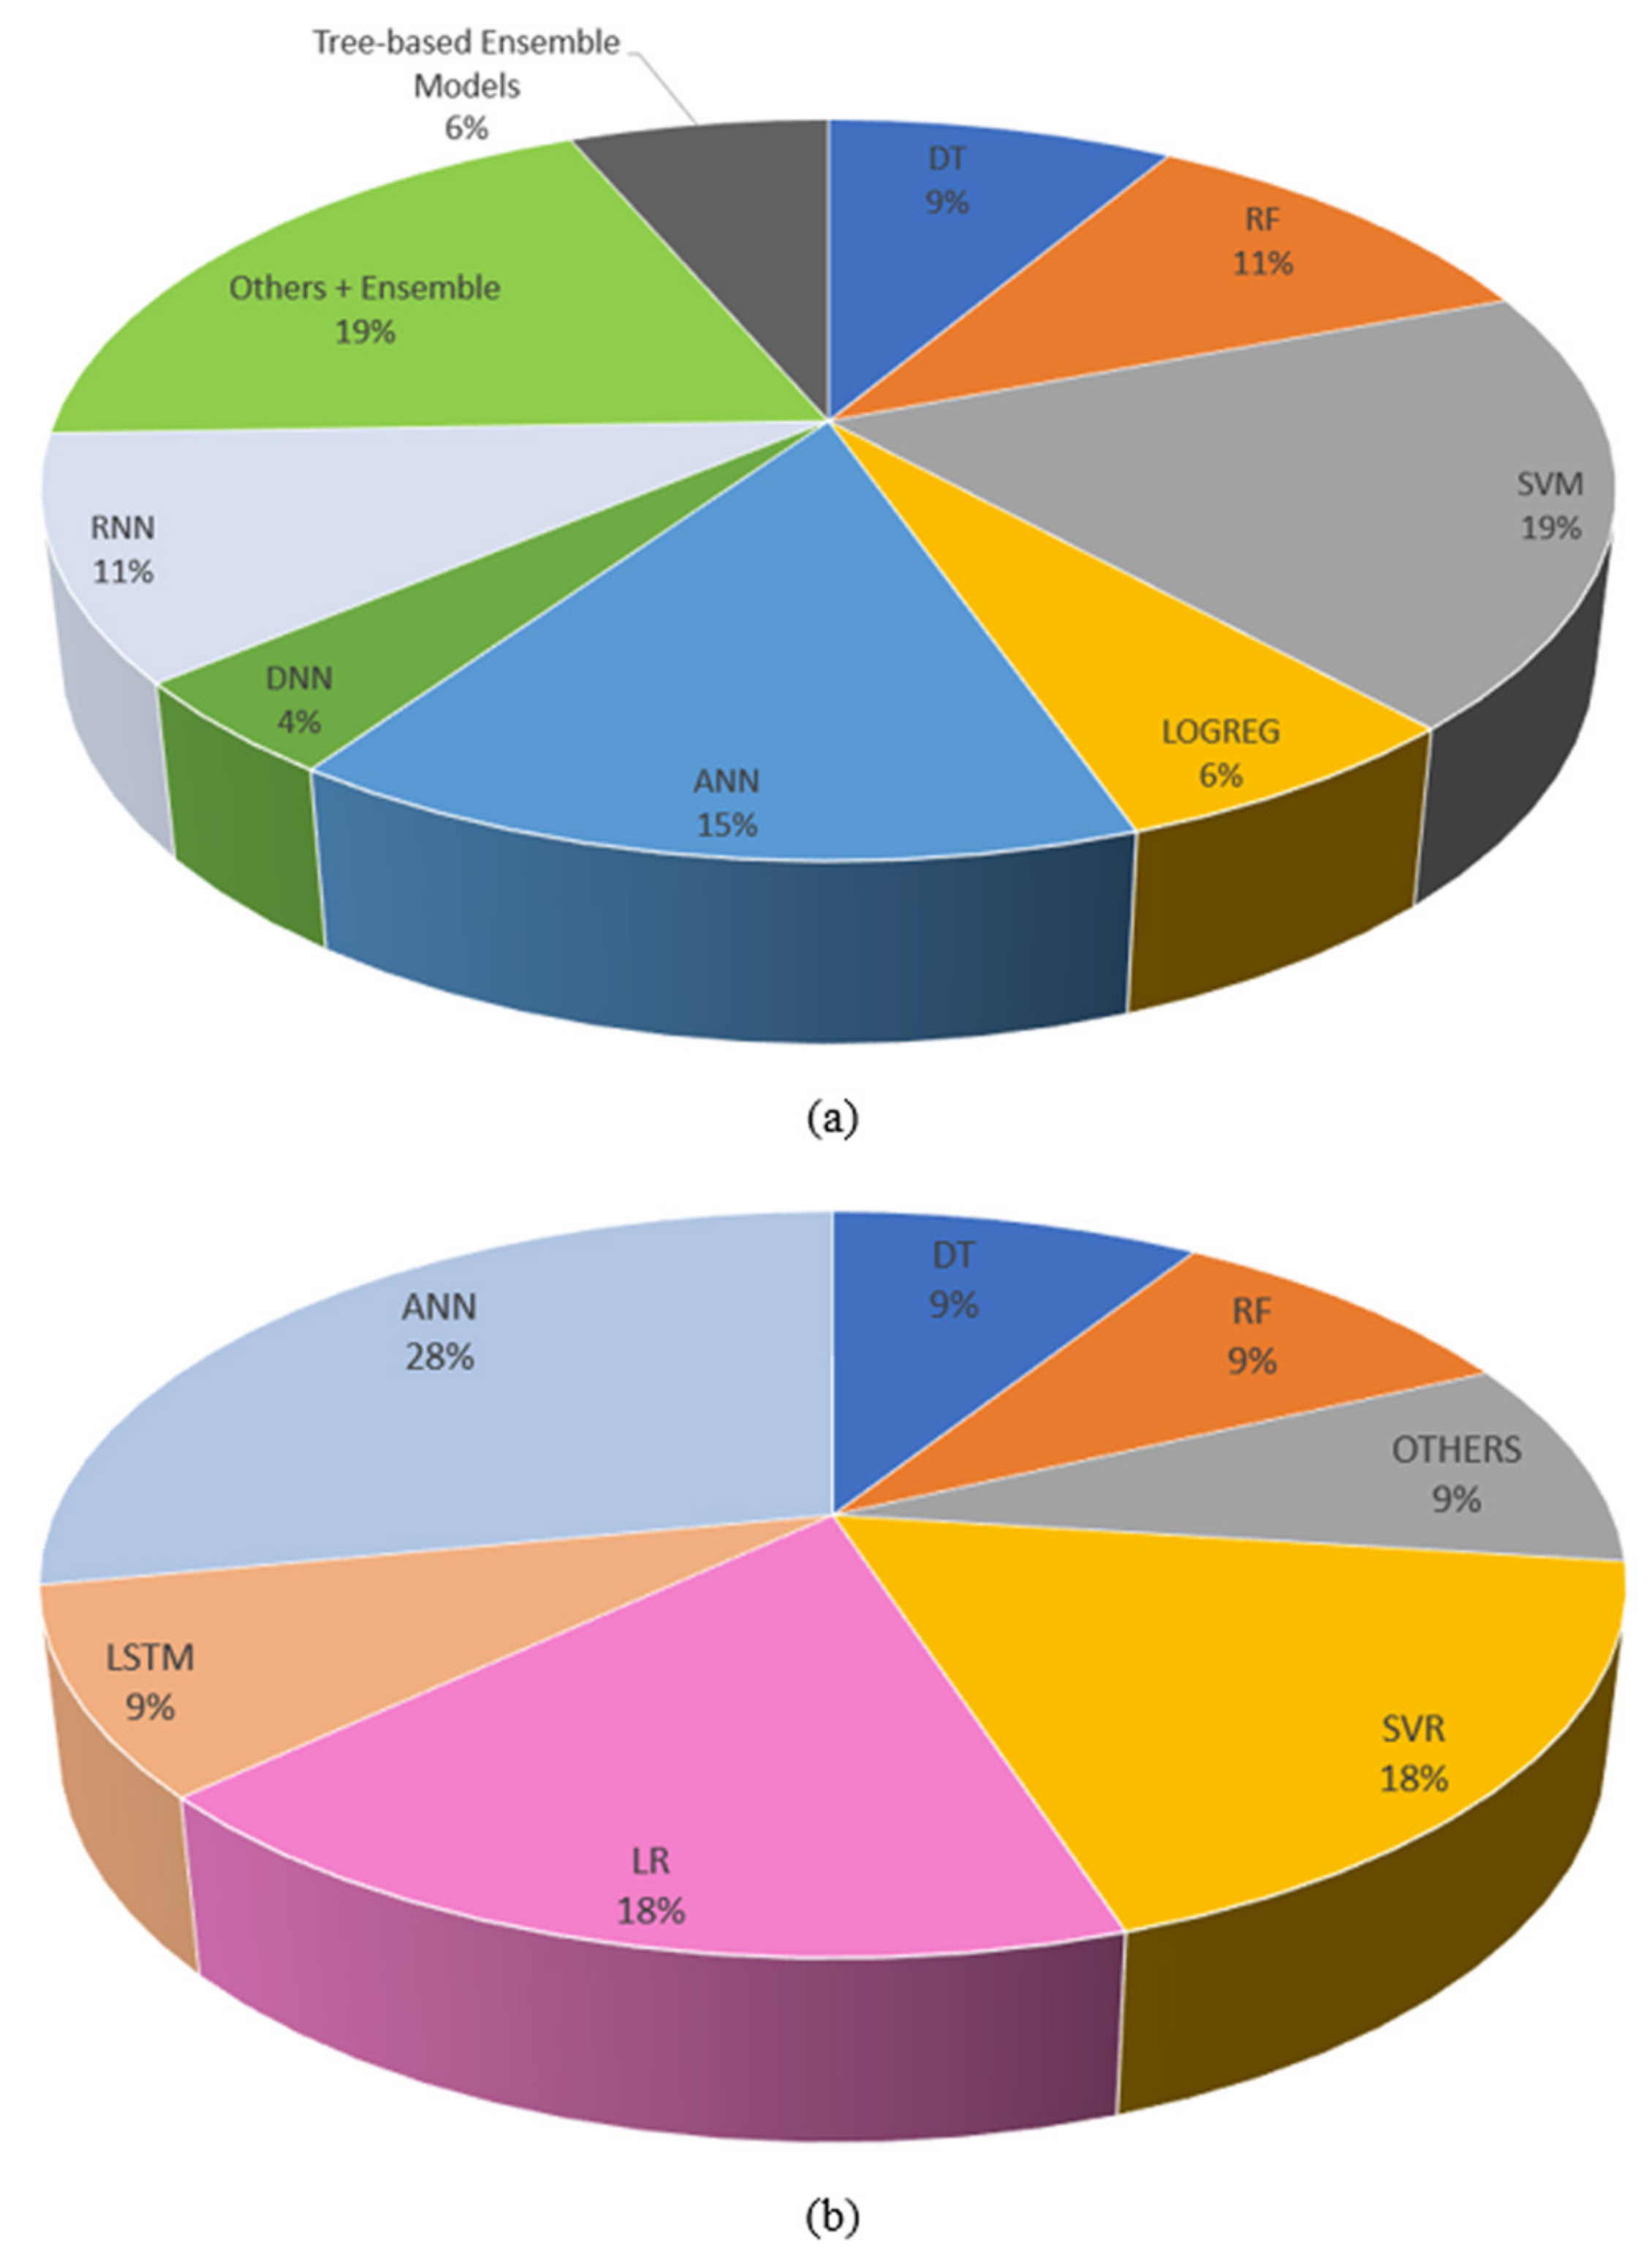
3.3. Model Selection in Studies

In the classification studies, it was seen that the most considered classifier was SVM (19%—21/109), followed by ANN (15%—16/109). When the models were considered independently of each other, the least considered models were DNN with 4% (5/109) and LOGREG with 6% (7/109). However, when we gathered the different neural network models (RNN, DNN, and ANN) into a single model, as neural-based models, it was observed that the total usage rate of neural-based models was 30% (33/109). Likewise, DT and RF had a lower usage rate compared to SVM and ANN when considered separately, but when we considered the two as tree-based models, it was found that the rate increased to 19% (20/109).
When all results were considered for the classification studies, it was observed that SVM and ANN were the most considered independent models in the studies, but, in general, neural-based models and tree-based models were also widely used.
In regression studies, the use of ANNs stands out significantly compared to other models (28%—19/67), followed by SVR and LR (18%—12/67 each). If we categorize the models as in the classification studies, neural-based models increase to 37% (25/67) with the participation of LSTM, while tree-based models (RF + DT) reach 18% (12/67).
If all results are considered without distinguishing between classification and regression and SVR and SVM are considered single models, neural-based models significantly take the lead in student performance prediction studies (32.95%—58/176). While SVR + SVM followed these models, tree-based models (RF + DT) also had a significant consideration rate. Figure 5 demonstrates the percentages of independent model usage in classification and regression studies.
Since predicting which model would achieve superior results in artificial intelligence and machine learning applications is difficult, it is impossible to determine a specific model that would lead to future studies. However, the data created through the development of computer and data storage technologies will make artificial neural networks and deep learning methods that can process and learn big data more widespread for regression and classification tasks. Furthermore, other conventional and tree-based models might be considered more frequently in student performance evaluation studies’ data analysis and data selection stages. However, the models’ abilities should not be underestimated for particular datasets with limited inputs and samples [46].

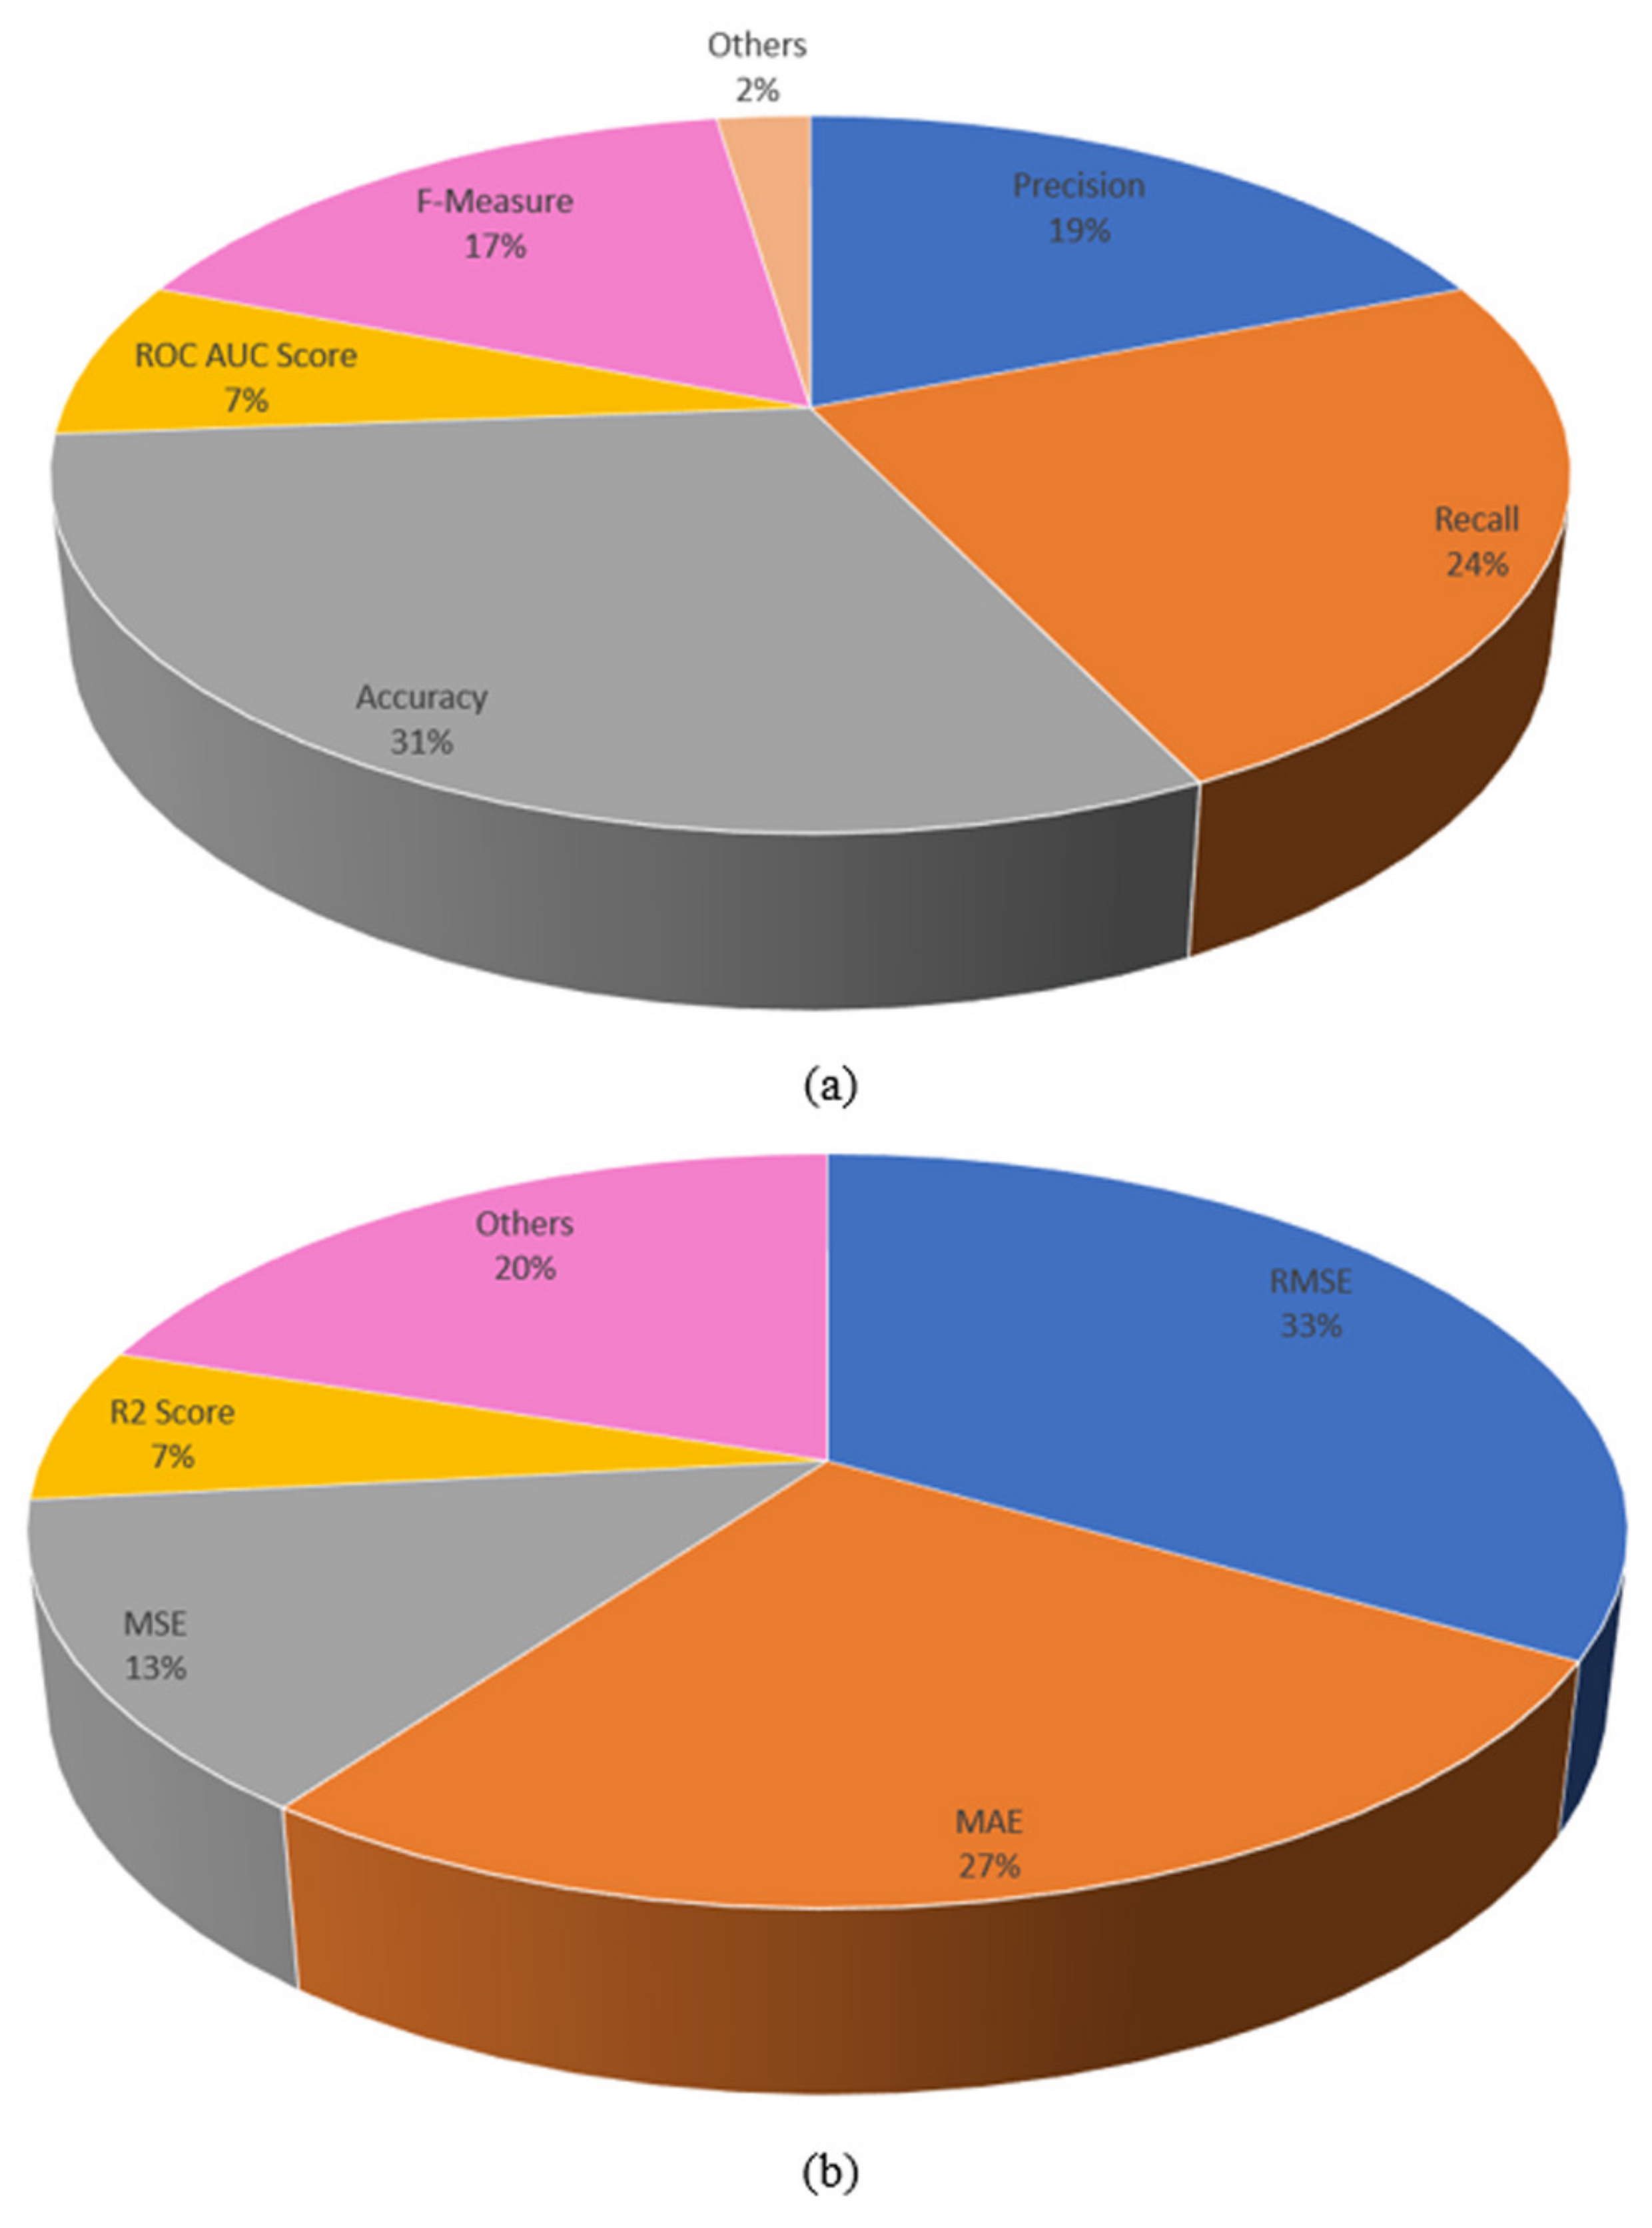
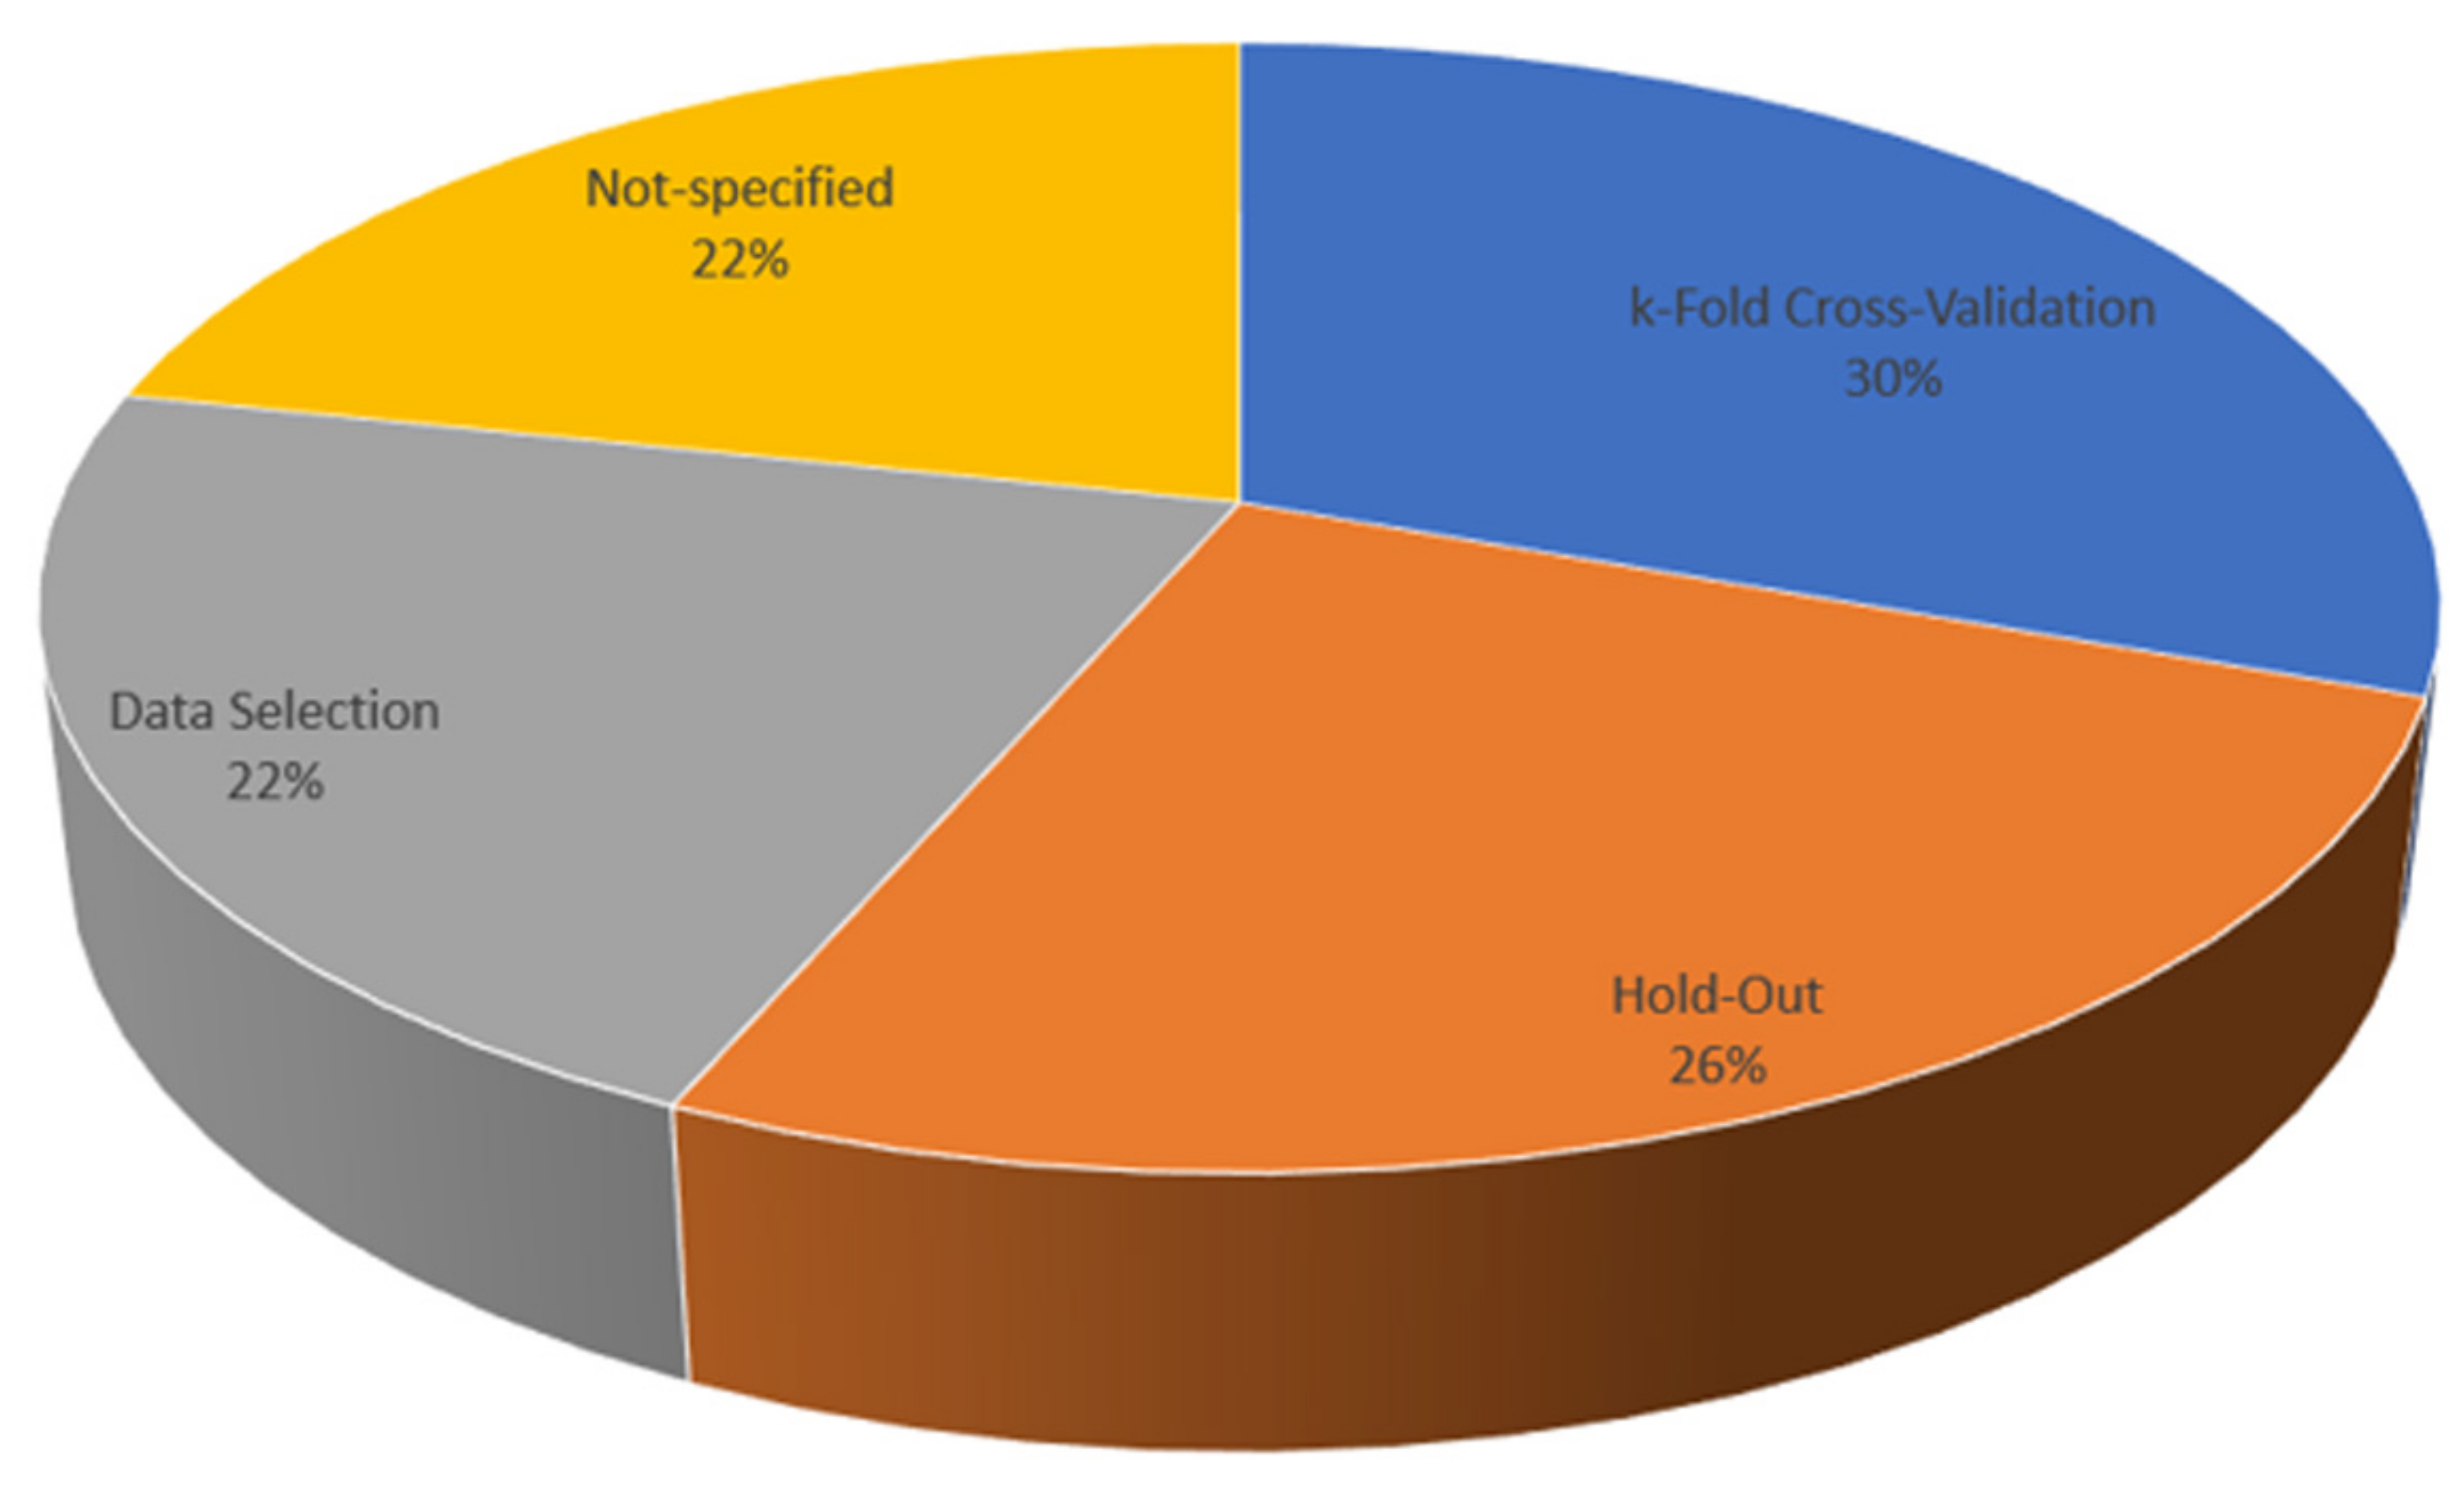
3.4. Evaluation and Validation Metrics in Studies

As mentioned above, regression and classification tasks have different evaluation metrics. In most of the classification studies, although similar metrics were used, variations were also observed. This diversity may have arisen from the balanced/imbalanced nature of the datasets or the characteristics of tasks such as binary classification, multi-classification, etc. Similar to model selection, even though more than one evaluation metric was considered in the studies, rates were determined based on the main evaluation criteria mentioned by the authors of these studies. The researchers considered accuracy, recall (sensitivity), precision, F1 score, and ROC-AUC score with the rates of 31% (33/109), 24% (26/109), 19% (21/109), 17% (18/109), and 7% (8/109), respectively, in classification studies.
Since each datum represents an independent output in regression studies, there is no balanced/imbalanced problem. Different evaluation metrics give researchers an insight into the ability of the models in terms of the different points that they consider. The most considered evaluation metrics in regression studies were RMSE with 33% (22/67) and MAE with 27% (18/67). Interestingly, the R 2 score, which is frequently used in regression studies and determines the model’s general regression ability, was one of the least used metrics in the student performance prediction studies (7%—5/67). Figure 6 presents the percentages of the evaluation metrics in the classification and regression studies.
Since training is performed in a similar way in regression and classification studies, no distinction was considered when analyzing validation metrics. Although k-fold cross-validation was implemented more frequently in the studies, the hold-out method, which does not include data mining applications, was still used frequently, despite the advantages stated above. While 30% (54/176) of the studies validated their results using k-fold cross-validation, 26% (46/176) used the hold-out method. The studies that applied data mining/training data selection and studies for which the validation strategies could not be determined both had a frequency of 22% (38/176). Figure 7 shows the percentages of the validation strategies considered in the studies.

3.5. Datasets

Several datasets have been used in different student performance prediction studies in the literature. Although some datasets are more commonly used, studies have generally been performed by considering their primary or current datasets. In this section, the datasets that form the basis of student performance prediction studies are analyzed and their relations are revealed. As mentioned above, datasets are the essential features that determine whether a study can be characterized as classification or regression, high school or HEI, online, on-campus or blended, or all. On the other hand, the dataset’s content significantly determines the target of the studies, such as end-of-term, drop-out, in-term, etc.
The most significant characteristic that distinguishes in-term and end-of-term studies from each other is that the datasets used in in-term studies contain records of online activities (assignments, quizzes, exams, logins, etc.) that students participate in at certain time intervals during the semester [61]. This makes it possible to predict student performance in the following period. These datasets are also used in end-of-term studies, and more accurate results could be achieved from the detailed information that they provide [18].
However, on-campus data contain less information than online data on student activities, and on-campus studies are therefore used to predict end-of-term performance [55]. Questionnaires are also an essential source of information for learning about students and focus on a different approach to end-of-term studies. In the questionnaires, student habits, family information, demographic information, etc., were used to predict the students’ general success in the courses [11,62]. Since these studies did not consider any continuous course information during the semester, they can be included in future prediction studies. However, the diversity of factors affecting a student’s success in a course limited the efficiency of such studies.
Cortez and Silva [62] developed the most widely used questionnaire dataset in the literature. The questionnaire results, including demographic, social, and educational questions, were collected in a Portuguese high school, and the dataset included 33 attributes and 649 instances (students). The effects of demographic, social, and educational habits on the prediction of student performance have been analyzed in many studies [50,56]. With the raw results provided, this dataset is considered in both regression and classification studies for end-of-term and future estimation purposes [27].
Another different dataset is the Kaggle MOOC drop-out prediction dataset available at: (https://www.kaggle.com/samyakjhaveri/mooc-final, accessed on 17 May 20021). The dataset consists of logs for more than 155,000 students for 247 courses conducted through MOOC at a Chinese University. This dataset has been used in drop-out and end-of-term performance prediction studies [63].
The WorldUC dataset (http://www.worlduc.com accessed on 20 August 2020) includes 10,523 records for three years of ten continuous lessons in an online course. The features are considered static, such as gender, age, and expectation score, and dynamic, such as the relevance of learning resources and content, duration time, etc.
The Liru dataset is obtained from Liru Online Courses web site (available at (https://moodle.scnu.edu.cn, accessed on 22 August 2020) and contains data on 1046 students for 18 consecutive lessons. In addition, the dataset includes both static features, such as grade, class, and college, and two dynamic features, namely knowledge level and assignment score, which are different from the WorldUC dataset.
The Junyi dataset is a publicly available (https://www.kaggle.com/junyiacademy/learning-activity-public-dataset-by-junyi-academy, accessed on 14 May 2021) dataset from the Junyi Academy e-learning platform. It contains data for 2063 students with 29 attributes, which are divided into six categories: student modeling, answer time duration, problem taken in exercises, answering accuracy, the user taking exercises, and user answering orders.
Another public dataset—the Open University Learning Analytics Dataset (OULAD) (available at https://analyse.kmi.open.ac.uk/open_dataset, accessed on 22 January 2021)—was released by Kuzilek et al. [61]. Demographic and registration information was used to create a student module that was linked to the results of the students’ assessments and logs of student interactions with VLE. The dataset includes information on 32,593 registered students for 22 modules.
Wang et al. [57] published dataset information that includes the daily campus activities and academic achievements of college students. The data obtained from the smart card system of a university and “books lending data”, “card data”, “dormitory open/close data”, “library open/close data”, and “students achievement data” were used to predict student success. Table 3 shows the properties of the mentioned dataset in detail.

4. Results and Discussion

Artificial intelligence and machine learning have been studied in educational sciences as well as in all areas of life. However, research differs in terms of its purpose, the models used, datasets, evaluation criteria, and validation strategy.
From the point of view of machine learning, although every study contributes to and accelerates student performance evaluations, the differences make it challenging to implement these studies in real life.
Discussions on various subjects have been performed to provide a broad perspective on student performance prediction studies based on the results presented above.
Datasets have a significant impact on the aims of studies and can directly affect the domain of the study, the choice of ML model, and the evaluation metrics used.
Questionnaires cannot generally be used for in-term estimations because of their reliability and discrete training events when they are obtained. However, they continue to be considered in research on the impact of family and personal preferences on student achievements.
Online data have been widely used in end-of-term, in-term, and drop-out studies. The recording of students’ interest in the courses at a certain level and as time-series in these datasets has enabled artificial intelligence and machine learning models to learn more meaningful data and produce more successful results. In addition, they have reduced the number of people that the surveys need to reach, the effort, and the financial costs by obtaining data in digital environments in the infrastructures of educational institutions.
Wang et al. [57] have taken the studies one step further by using a dataset that includes observations of students’ activities and educational habits on campus. Therefore, in the most basic way, where and how much time students spend, the effects of the books they buy from the library, and other aspects could be observed, and student performance predictions could be performed accordingly.
The implementation of classification and regression tasks in student performance prediction studies is also related to the characteristics of the data collected and the aims of the studies. The frequently used Student Performance Dataset [62] allows researchers to perform investigations in regression and classification domains with the raw exam results provided. On the other hand, in other datasets [11,61], the results were classified based on categorized performances or letter grades of students, which complicates the implementation of a regression study on these datasets. The data content might allow researchers to perform prediction studies in the classification domain (i.e., students’ withdrawal from the course, end-of-term success: pass/fail) or in the regression domain (i.e., end-of-term success: exam point).
Regardless of whether the studies are in regression or classification, when they are categorized under the five main headings identified above (estimation of course drop-outs, end-of-term success level prediction, in-term success prediction, students’ risk identification, and future success estimation), different questions might be asked from an educational perspective:
  • Do drop-out predictions contribute significantly to the student and their success levels?
  • When does the prediction of end-of-term success contribute to students’ self-development and their education?
  • Do the in-term performance predictions provide sufficient time to contribute to the students?
  • How early can risk predictions related to courses taken by students contribute to them?
In addition to the effect of the datasets on the studies, reduced errors and more interpretable results in classification studies make them more applicable in this field. However, the analysis of individual results in regression tasks complicates the evaluation of the results since each sample has a unique error.
The results obtained from the systematic literature review showed that all the reasons described above caused the implementation of classification research (62%) to be significantly higher than regression studies (38%).
The considered datasets and problem domain affect the ML model selection in these studies. When the ML models are considered, it can be concluded that the ability of neural-based models to process and learn a considerable amount of data and produce successful results is an essential factor for consideration in most student performance prediction studies [15,16,58]. Furthermore, it has been observed that the use of recurrent neural networks, which can learn by remembering past experiences while learning data, especially in time-series data such as online datasets, has become prevalent [18,57].
Even though the SVM and SVR models were frequently considered in the studies, the optimization of the classification/regression process is one of their crucial characteristics, while the projection of data into another feature space becomes more effective when the data are more informative. For this reason, SVM was generally considered in classification studies with a limited number of data, ensemble/hybrid models, comparative studies, or where attributes or instances were selected using data mining techniques [23,42,59]. Therefore, the classification and regression ability of SVM and SVR were optimized with minimized and selected data.
However, the uncertainties of neural-based models and SVM–SVR regarding interpretability led researchers to implement models with successful and interpretable results. At this point, DT and RF became the focus models of the researchers. Nevertheless, DT’s sensitive approach to data and the risk of obtaining low results highlighted the RF, which optimizes the DT results by producing a certain number of DTs. Thus, the researchers attempted to achieve significant results and identify the factors that directly affect student performance [25,43].
The contribution of all machine learning models to student performance prediction studies is undeniable. The direct use of models, their use in data analysis and selection, and their use in creating hybrid or ensemble models have directed each study to lead to further developments.
The literature review results showed that analysis using deep learning has gained importance in recent years [8,57]. Additionally, the success of artificial neural network models in transferring the obtained knowledge to other models has started to be investigated in student performance predictions [60].
Since predicting which model would achieve superior results in artificial intelligence and machine learning applications is difficult, it is impossible to determine a specific model that would lead to future studies. However, the data created by developing computer and data storage technologies will make artificial neural networks and deep learning methods, which can process and learn big data, more widespread for regression and classification tasks. Furthermore, other conventional and tree-based models might be considered more frequently in the data analysis and data selection stages of studies on student performance evaluation. However, the models’ abilities should not be underestimated for particular datasets with limited inputs and samples [46].
As mentioned above, the dataset, aims, and study domain directly affect the determination of evaluation metrics, which are different in both domains.
The most significant problem encountered in classification experiments is the accuracy obtained in experiments using imbalanced data. In a classification study, where a class with a large number of samples can be better learned, achieving a high accuracy result does not provide information about the efficiency of the other class results, and the accuracy causes misleading results. Therefore, the vast majority of students can be identified in classes, such as pass or fail, risky or not, etc. In imbalanced data, the F1 score and ROC AUC score are evaluated as metrics that show the model’s overall performance more efficiently. In contrast, recall and precision metrics show the success level for specific classes and offer insight for learning the relevant classes. For this reason, the use of the accuracy metric alone might lead to difficulties in the real-life implementation of studies.
The standardization of the F1 and ROC AUC scores in all studies would contribute significantly to the studies’ analysis, the success of models, and the trend of future studies for classification studies.
Similarly, the standardization of the R 2 score, which provides a scaled and consistent evaluation of the models, would provide a more effective evaluation of the proposed models. However, using additional metrics in regression problems is essential to measure error minimization since the results might differ from obtaining high R 2 scores. In this case, it is challenging to determine which metric is more efficient, while the aim in measured data would be the determinant. Therefore, the use of a minimum of two error metrics, such as MAE and MSE (or root MSE), could be standardized for all student performance prediction studies.
In both problem domains, the applicability of the obtained results can be defined directly proportionally to the validation techniques.
In order to optimize the learning process, a method that is widely used is to select the instances to be used in training with different techniques. This could increase training and testing accuracy while reducing computational time in big data. However, in studies where attributes are selected rather than instances, it should be considered that each different student entry contains new and independent data for both the training and test phase. Studies have shown that other training instances could change the accuracy by more than 10% [2,46].
The hold-out method does not use all samples during the training and testing phases. It also creates problems in determining the ratio of dividing the dataset into training, testing, or validation sets. Nevertheless, even the hold-out method is preferred to reduce the computational time for big data; computers today can perform a vast number of operations in student performance prediction studies.
For this reason, in studies where instances are not analyzed and selected, k-fold cross-validation, which considers each sample during the learning and testing phase, should be a standard approach for training the model. The average number of folds results should be evaluated as the overall success rate of the model. This will provide a more objective approach for evaluating the obtained results, and the actual abilities of the models will be determined as a result of the evaluations made by considering all the data.
Many different factors, such as changes in the conditions of student admission to educational institutions in countries, education abroad, foreign language level, education in the mother tongue, cultural differences, demographic structure, personal preferences, place of residence, weather conditions of the country of residence, health conditions, etc., and factors that directly affect the university lives of students, were reported in different studies [64,65,66]. Additionally, it is known that students’ skills and their inclination and interest in courses also affect the level of success. If future studies are conducted without considering all these issues, they might experience difficulties in ensuring that the developed systems are applicable. Success only in specific predictions might mislead students and provide incorrect information to the instructors and experts who are responsible for determining education policies.
The spread of flipped classrooms, online education, and distance education during the COVID-19 period enabled the more effective recording of student data, logs, homework, quizzes, exams, feedback, and grades in many educational institutions, especially in HEI.
Educational institutions could enable more comprehensive studies in this mobile era by measuring students’ time on campus, their time on social media, and achievement records with volunteer students by developing special mobile software. Combining all obtained behavioral and educational data with demographic, personal, and cultural data will provide a more accurate prediction of student performance.
Therefore, it will be possible to predict students’ success in in-class and online courses more accurately by combining all the data, not only with questionnaires or online information. This will enable the generalization of AI and ML for both online and in-class courses, and artificial intelligence for student success in educational institutions will become more widespread.
Several studies have demonstrated that regional, national, and cultural differences, education in a foreign language, socioeconomic effects, demographic situation, and the role of instructors could have significant effects on the same scales in predicting student performance [67,68,69]. In addition, the developments in e-learning systems provide significant outcomes [70,71]. In this context, in the globalized world, creating a global education information consortium and the acquisition of data with the same criteria in different educational institutions worldwide will make reaching the goal non-specific and spread it across the globe. Moreover, it will undoubtedly create a tremendous source of information in determining students’ performance in terms of success in the semester, at the end of the semester, and in the next semester, whether it is distance education, in-class education, open education, etc.
Today’s computer technology provides the infrastructure to analyze big data that are obtained. This will make deep learning and data mining more focused on student performance prediction studies and might provide more accurate and applicable results than the results obtained so far.
Therefore, the drop-out and end-of-term predictions mentioned above as research topics will be provided as support points to the students. However, the high prediction success of in-term and risk estimations and the implementation of an early warning system will provide the most significant contribution. This will allow students to observe the risk levels and expected success level at the end of the term after enrolling in the course, and the students’ interest in the course will be increased.
Furthermore, instead of reaching general judgments in predicting students’ performance levels, it would be possible to implement personalized and individualized performance evaluation systems and to further the meta-analysis results of Schneider and Preckel’s [72] studies for HEI.

5. Conclusions

In interdisciplinary studies, artificial intelligence in education has significant importance in various subjects. Student performance estimation studies have been one of the most intensively studied topics in this field in the last decade.
This study aimed to identify the prominent differences, trends, and problems in these studies and to guide future studies with possible remedies.
First, a systematic literature review for student performance prediction and machine learning studies was performed. Then, the studies were classified according to their aims, the considered models, datasets, evaluation metrics, and the validation strategies, and numerical information about the studies was presented.
The differences and problems identified between the studies were determined, and remedies focused on machine learning were proposed in the discussion.
Possible remedies and ideas were presented to make the studies more applicable with a high success rate around the world, and inferences were made about how student performance prediction studies will progress in the coming years.
Based on the results obtained from the analysis of the studies, the use of the F1 and ROC AUC scores, in addition to the other metrics in classification studies, particularly in imbalanced data, and the use of the R 2 score and at least one additional metric in regression studies as standard evaluation metrics have been proposed.
In order to determine the general ability and applicability of each proposed model, the consideration of k-fold cross-validation as a standard validation technique in studies in which data selection is not applied has been suggested for both problem domains.
It is estimated that future studies will continue to focus on deep learning, particularly recurrent neural networks, as has been the case in recent years, with new opportunities provided by the development of computer technologies and expanding data.
It can be concluded that the data obtained via a global consortium and the importance of deep learning have significance for future studies and could be the solution to many research questions and problems.

Author Contributions

Conceptualization, B.S.; methodology, B.S., R.A., A.I., M.A., J.B.I.; formal analysis, B.S., R.A., A.I., M.A., J.B.I.; writing—original draft preparation, B.S., R.A., A.I., M.A., J.B.I.; writing—review and editing, B.S., R.A., A.I., M.A., J.B.I.; visualization, B.S. All authors have read and agreed to the published version of the manuscript.

Funding

This research received no external funding.

Institutional Review Board Statement

Not applicable.

Informed Consent Statement

Not applicable.

Data Availability Statement

Publicly available data and the corresponding URLs are provided in the text.

Conflicts of Interest

The authors declare that there are no conflicts of interest regarding the publication of this article.

References

  1. Khashman, A.; Carstea, C. Oil price prediction using a supervised neural network. Int. J. Oil Gas Coal Technol. 2019, 20, 360. [Google Scholar] [CrossRef]
  2. Sekeroglu, B.; Tuncal, K. Prediction of cancer incidence rates for the European continent using machine learning models. Health Inform. J. 2021, 27, 1460458220983878. [Google Scholar] [CrossRef] [PubMed]
  3. Ozcil, I.; Esenyel, I.; Ilhan, A. A Fuzzy Approach Analysis of Halloumi Cheese in N. Cyprus. Food Anal. Methods 2021. [Google Scholar] [CrossRef]
  4. Chen, L.; Chen, P.; Lin, Z. Artificial Intelligence in Education: A Review. IEEE Access 2020, 8, 75264–75278. [Google Scholar] [CrossRef]
  5. Perrotta, C.; Selwyn, N. Deep learning goes to school: Toward a relational understanding of AI in education. Learn. Media Technol. 2019, 45, 1–19. [Google Scholar] [CrossRef] [Green Version]
  6. Guan, C.; Mou, J.; Jiang, Z. Artificial intelligence innovation in education: A twenty-year data-driven historical analysis. Int. J. Innov. Stud. 2020, 4, 134–147. [Google Scholar] [CrossRef]
  7. Somasundaram, M.; Junaid, K.; Mangadu, S. Artificial Intelligence (AI) Enabled Intelligent Quality Management System (IQMS) For Personalized Learning Path. Procedia Comput. Sci. 2020, 172, 438–442. [Google Scholar] [CrossRef]
  8. Liu, J.; Loh, L.; Ng, E.; Chen, Y.; Wood, K.; Lim, K. Self-Evolving Adaptive Learning for Personalized Education; Association for Computing Machinery: New York, NY, USA, 2020; pp. 317–321. [Google Scholar] [CrossRef]
  9. Tilahun, L.; Sekeroglu, B. An intelligent and personalized course advising model for higher educational institutes. SN Appl. Sci. 2020, 2, 1635. [Google Scholar] [CrossRef]
  10. Wu, Z.; He, T.; Mao, C.; Huang, C. Exam Paper Generation Based on Performance Prediction of Student Group. Inf. Sci. 2020, 532, 72–90. [Google Scholar] [CrossRef]
  11. Yilmaz, N.; Sekeroglu, B. Student Performance Classification Using Artificial Intelligence Techniques. In Advances in Intelligent Systems and Computing; Springer: Cham, Switzerland, 2020; Volume 1095. [Google Scholar] [CrossRef]
  12. Zaffar, M.; Hashmani, M.; Savita, K.; Sajjad, S.; Rehman, M. Role of FCBF Feature Selection in Educational Data Mining. Mehran Univ. Res. J. Eng. Technol. 2020, 39, 772–778. [Google Scholar] [CrossRef]
  13. Jiang, P.; Wang, X. Preference Cognitive Diagnosis for Student Performance Prediction. IEEE Access 2020, 8, 219775–219787. [Google Scholar] [CrossRef]
  14. Gitinabard, N.; Xu, Y.; Heckman, S.; Barnes, T.; Lynch, C. How Widely Can Prediction Models Be Generalized? Performance Prediction in Blended Courses. IEEE Trans. Learn. Technol. 2019, 12, 184–197. [Google Scholar] [CrossRef] [Green Version]
  15. Gamulin, J.; Gamulin, O.; Kermek, D. Using Fourier coefficients in time series analysis for student performance prediction in blended learning environments. Expert Syst. 2015, 33. [Google Scholar] [CrossRef]
  16. Aydogdu, S. Predicting student final performance using artificial neural networks in online learning environments. Educ. Inf. Technol. 2020, 25, 1913–1927. [Google Scholar] [CrossRef]
  17. Zhao, L.; Chen, K.; Song, J.; Zhu, X.; Sun, J.; Caulfield, B.; Namee, B. Academic Performance Prediction Based on Multisource, Multifeature Behavioral Data. IEEE Access 2021, 9, 5453–5465. [Google Scholar] [CrossRef]
  18. He, Y.; Chen, R.; Li, X.; Hao, C.; Liu, S.; Zhang, G.; Jiang, B. Online At-Risk Student Identification using RNN-GRU Joint Neural Networks. Information 2020, 11, 474. [Google Scholar] [CrossRef]
  19. Mengash, H. Using Data Mining Techniques to Predict Student Performance to Support Decision Making in University Admission Systems. IEEE Access 2020, 8, 55462–55470. [Google Scholar] [CrossRef]
  20. Yang, J.; Devore, S.; Hewagallage, D.; Miller, P.; Ryan, Q.; Stewart, J. Using machine learning to identify the most at-risk students in physics classes. Phys. Rev. Phys. Educ. Res. 2020, 16, 020130. [Google Scholar] [CrossRef]
  21. Figueroa-Cañas, J.; Sancho-Vinuesa, T. Early Prediction of Dropout and Final Exam Performance in an Online Statistics Course. IEEE Rev. Iberoam. Tecnol. Aprendiz. 2020, 15, 86–94. [Google Scholar] [CrossRef]
  22. Xing, W.; Du, D. Dropout Prediction in MOOCs: Using Deep Learning for Personalized Intervention. J. Educ. Comput. Res. 2018, 57, 073563311875701. [Google Scholar] [CrossRef]
  23. Injadat, M.; Moubayed, A.; Nassif, A.; Shami, A. Multi-split optimized bagging ensemble model selection for multiclass educational data mining. Appl. Intell. 2020, 50, 4506–4528. [Google Scholar] [CrossRef]
  24. Moher, D.; Liberati, A.; Tetzlaff, J.; Altman, D. Preferred reporting items for systematic reviews and meta-analyses: The PRISMA statement. BMJ 2009, 339, e1000097. [Google Scholar] [CrossRef] [Green Version]
  25. Shanthini, A.; Vinodhini, G.; Chandrasekaran, R. Predicting Students’ Academic Performance in the University Using Meta Decision Tree Classifiers. J. Comput. Sci. 2018, 14, 654–662. [Google Scholar] [CrossRef] [Green Version]
  26. Yan, L.; Liu, Y. An Ensemble Prediction Model for Potential Student Recommendation Using Machine Learning. Symmetry 2020, 12, 728. [Google Scholar] [CrossRef]
  27. Sekeroglu, B.; Dimililer, K.; Tuncal, K. Artificial intelligence in education: Application in student performance evaluation. Dilemas Contemp. Educ. Política Y Valores 2019, 7, 1–21. [Google Scholar]
  28. Breiman, L.; Friedman, J.; Stone, C.; Olshen, R. Classification and Regression Trees; Taylor and Francis: Boca Raton, FL, USA, 1984. [Google Scholar]
  29. Oytun, M.; Tinazci, C.; Sekeroglu, B.; Acikada, C.; Yavuz, H. Performance Prediction and Evaluation in Female Handball Players Using Machine Learning Models. IEEE Access 2020, 8, 116321–116335. [Google Scholar] [CrossRef]
  30. Dougherty, G. Pattern Recognition and Classification; Springer: Berlin/Heidelberg, Germany, 2013. [Google Scholar]
  31. Breiman, L. Random Forests. Mach. Learn. 2001, 45, 5–32. [Google Scholar] [CrossRef] [Green Version]
  32. Pahlavan-Rad, M.; Dahmardeh, K.; Hadizadeh, M.; Keykha, G.; Mohammadnia, N.; Keikha, M.G.M.; Davatgar, N.; Brungard, C. Prediction of soil water infiltration using multiple linear regression and random forest in a dry flood plain, eastern Iran. CATENA 2020, 194, 104715. [Google Scholar] [CrossRef]
  33. Yang, L.; Wu, H.; Jin, X.; Zheng, P.; Hu, S.; Xu, X.; Yu, W.; Yan, J. Study of cardiovascular disease prediction model based on random forest in eastern China. Sci. Rep. 2020, 10, 1–8. [Google Scholar] [CrossRef] [Green Version]
  34. Friedman, J. Greedy Function Approximation: A Gradient Boosting Machine. Ann. Stat. 2001, 29, 1189–1232. [Google Scholar] [CrossRef]
  35. Chen, T.; Guestrin, C. XGBoost: A Scalable Tree Boosting System. arXiv 2016, arXiv:1603.02754. [Google Scholar] [CrossRef] [Green Version]
  36. Cortes, C.; Vapnik, V. Support-vector networks. Mach. Learn. 1995, 20, 273–297. [Google Scholar] [CrossRef]
  37. Smola, A.; Scholkopf, B. A tutorial on support vector regression. Stat. Comput. 2004, 14, 199. [Google Scholar] [CrossRef] [Green Version]
  38. Sekeroglu, B.; Dimililer, K. Review and analysis of hidden neuron number effect of shallow backpropagation neural networks. Neural Netw. World 2020, 30, 97–112. [Google Scholar] [CrossRef]
  39. Mason, C.; Twomey, J.; Wright, D.; Whitman, L. Predicting Engineering Student Attrition Risk Using a Probabilistic Neural Network and Comparing Results with a Backpropagation Neural Network and Logistic Regression. Res. High. Educ. 2018, 59, 382–400. [Google Scholar] [CrossRef]
  40. Stanton, J. Galton, Pearson, and the Peas: A brief history of linear regression for statistics instructors. J. Stat. Educ. 2001, 9. [Google Scholar] [CrossRef]
  41. Liu, P.; Wang, J.; Sangaiah, A.; Xie, Y.; Yin, X. Analysis and Prediction of Water Quality Using LSTM Deep Neural Networks in IoT Environment. Sustainability 2019, 11, 2058. [Google Scholar] [CrossRef] [Green Version]
  42. Lu, H.; Yuan, J. Student Performance Prediction Model Based on Discriminative Feature Selection. Int. J. Emerg. Technol. Learn. (IJET) 2018, 13, 55. [Google Scholar] [CrossRef]
  43. Wakelam, E.; Jefferies, A.; Davey, N.; Sun, Y. The potential for student performance prediction in small cohorts with minimal available attributes. Br. J. Educ. Technol. 2019, 51, 347–370. [Google Scholar] [CrossRef] [Green Version]
  44. Luque, A.; Carrasco, A.; Martin, A.; de Las Heras, A. The impact of class imbalance in classification performance metrics based on the binary confusion matrix. Pattern Recognit. 2019, 91, 6829. [Google Scholar] [CrossRef]
  45. Hossin, M.; Sulaiman, M. A Review on Evaluation Metrics for Data Classification Evaluations. Int. J. Data Min. Knowl. Manag. Process 2015, 5, 1–11. [Google Scholar] [CrossRef]
  46. Ever, Y.; Dimililer, K.; Sekeroglu, B. Comparison of Machine Learning Techniques for Prediction Problems. In Advances in Intelligent Systems and Computing; Springer: Cham, Switzerland, 2019; Volume 927. [Google Scholar] [CrossRef]
  47. Ozsahin, I.; Sekeroglu, B.; Musa, M.; Mustapha, M.; Ozsahin, D. Review on Diagnosis of COVID-19 from Chest CT Images Using Artificial Intelligence. Comput. Math. Methods Med. 2020, 2020, 9756518. [Google Scholar] [CrossRef]
  48. Azcona, D.; Hsiao, I.; Smeaton, A. Detecting students-at-risk in computer programming classes with learning analytics from students’ digital footprints. User Model. User-Adapt. Interact. 2019, 29, 759–788. [Google Scholar] [CrossRef]
  49. Hussain, M.; Zhu, W.; Zhang, W.; Abidi, S.; Ali, S. Using machine learning to predict student difficulties from learning session data. Artif. Intell. Rev. 2019, 52, 381–407. [Google Scholar] [CrossRef]
  50. Imran, M.; Latif, S.; Mehmood, D.; Shah, M. Student Academic Performance Prediction using Supervised Learning Techniques. Int. J. Emerg. Technol. Learn. 2019, 14, 92–104. [Google Scholar] [CrossRef] [Green Version]
  51. Waheed, H.; Ul Hassan, S.; Aljohani, N.; Hardman, J.; Alelyani, S.; Nawaz, R. Predicting academic performance of students from VLE big data using deep learning models. Comput. Hum. Behav. 2020, 104, 106189. [Google Scholar] [CrossRef] [Green Version]
  52. Yousafzai, B.; Hayat, M.; Afzal, S. Application of machine learning and data mining in predicting the performance of intermediate and secondary education level student. Educ. Inf. Technol. 2020, 25, 4677–4697. [Google Scholar] [CrossRef]
  53. Naicker, N.; Adeliyi, T.; Wing, J. Linear Support Vector Machines for Prediction of Student Performance in School-Based Education. Math. Probl. Eng. 2020, 2020, 1–7. [Google Scholar] [CrossRef]
  54. Elbadrawy, A.; Polyzou, A.; Ren, Z.; Sweeney, M.; Karypis, G.; Rangwala, H. Predicting Student Performance Using Personalized Analytics. Computer 2016, 49, 61–69. [Google Scholar] [CrossRef]
  55. Deo, R.; Yaseen, Z.; Al-Ansari, N.; Nguyen-Huy, T.; Langlands, T.; Galligan, L. Modern Artificial Intelligence Model Development for Undergraduate Student Performance Prediction: An Investigation on Engineering Mathematics Courses. IEEE Access 2020, 8, 136697–136724. [Google Scholar] [CrossRef]
  56. Turabieh, H.; Azwari, S.; Rokaya, M.; Alosaimi, W.; Alhakami, A.A.W.; Alnfiai, W. Enhanced Harris Hawks optimization as a feature selection for the prediction of student performance. Computing 2021, 103, 1417–1438. [Google Scholar] [CrossRef]
  57. Wang, X.; Yu, X.; Guo, L.; Liu, F.; Xu, L. Student Performance Prediction with Short-Term Sequential Campus Behaviors. Information 2020, 11, 201. [Google Scholar] [CrossRef] [Green Version]
  58. Adejo, O.; Connolly, T. Predicting student academic performance using multi-model heterogeneous ensemble approach. J. Appl. Res. High. Educ. 2017, 10, 61–75. [Google Scholar] [CrossRef]
  59. Tran, O.; Dang, H.; Thuong, D.; Truong, T.; Vuong, T.; Phan, X. Performance Prediction for Students: A Multi-Strategy Approach. Cybern. Inf. Technol. 2017, 17, 164–182. [Google Scholar] [CrossRef] [Green Version]
  60. Tsiakmaki, M.; Kostopoulos, G.; Kotsiantis, S.; Ragos, O. Transfer Learning from Deep Neural Networks for Predicting Student Performance. Appl. Sci. 2020, 10, 2145. [Google Scholar] [CrossRef] [Green Version]
  61. Kuzilek, J.; Hlosta, M.; Zdrahal, Z. Open University Learning Analytics dataset. Sci. Data 2017, 4, 170171. [Google Scholar] [CrossRef] [PubMed] [Green Version]
  62. Cortez, P.; Silva, A. Using Data Mining to Predict Secondary School Student Performance. In Proceedings of the 5th FUture BUsiness TEChnology Conference (FUBUTEC 2008), Porto, Portugal, 9–11 April 2008; pp. 5–12, ISBN 978-9077381-39-7. [Google Scholar]
  63. Sood, S.; Saini, M. Hybridization of Cluster-Based LDA and ANN for Student Performance Prediction and Comments Evaluation. Educ. Inf. Technol. 2021, 26, 2863–2878. [Google Scholar] [CrossRef]
  64. Balci, S.; Ayhan, B. Internet usage patterns among university students. J. Selcuk Commun. 2007, 5, 174–197. [Google Scholar]
  65. Bodovski, K.; Jeon, H.; Byun, S. Cultural capital and academic achievement in post-socialist Eastern Europe. Br. J. Sociol. Educ. 2017, 38, 887–907. [Google Scholar] [CrossRef]
  66. Richardson, M.; Abraham, C.; Bond, R. Psychological correlates of university students’ academic performance: A systematic review and meta-analysis. Psychol. Bull. 2012, 138, 353–387. [Google Scholar] [CrossRef] [Green Version]
  67. Boz, Y.; Boz, N. Prospective chemistry and mathematics teachers’ reasons for choosing teaching as a profession. Kastamonu Educ. J. 2008, 16, 137–144. [Google Scholar]
  68. Kayalar, F.; Kayalar, F. The effects of Auditory Learning Strategy on Learning Skills of Language Learners (Students’ Views). IOSR J. Humanit. Soc. Sci. (IOSR-JHSS) 2017, 22, 4–10. [Google Scholar] [CrossRef]
  69. Memduhoğlu, H.; Tanhan, F. Study of organizational factors scale’s validity and reliability affecting university students’ academic achievements. YYU J. Educ. Fac. 2013, X, 106–124. [Google Scholar]
  70. Franzoni, V.; Pallottelli, S.; Milani, A. Reshaping Higher Education with e-Studium, a 10-Years Capstone in Academic Computing. Lect. Notes Comput. Sci. 2020, 12250, 293–303. [Google Scholar] [CrossRef]
  71. Franzoni, V.; Tasso, S.; Pallottelli, S.; Perri, S. Sharing Linkable Learning Objects with the Use of Metadata and a Taxonomy Assistant for Categorization. Lect. Notes Comput. Sci. 2019, 11620, 336–348. [Google Scholar] [CrossRef]
  72. Schneider, M.; Preckel, F. Variables Associated With Achievement in Higher Education: A Systematic Review of Meta-Analyses. Psychol. Bull. 2017, 143, 565–600. [Google Scholar] [CrossRef]
Figure 1. Selection procedure of the study.
Applsci 11 10907 g001
Figure 2. The number of publications between 2010 and 2020 (n = 297).
Applsci 11 10907 g002
Figure 3. The aims of student performance prediction studies in percentages (regression vs. classification).
Applsci 11 10907 g003
Figure 4. The aims of student performance prediction studies in percentages for educational expectations.
Applsci 11 10907 g004
Figure 5. The use of machine learning models in student performance prediction studies: (a) classification and (b) regression.
Applsci 11 10907 g005
Figure 6. The frequency of evaluation metrics considered in the student performance prediction studies: (a) classification and (b) regression.
Applsci 11 10907 g006
Figure 7. Validation strategies in the student performance prediction studies.
Applsci 11 10907 g007
Table 1. Frequenly used machine learning Models in student performance prediction and their tasks.
ModelTask
Artificial Neural NetworksClassification and Regression
Deep Neural NetworksClassification and Regression
Long Short-Term Memory NNClassification and Regression
Decision TreeClassification and Regression
Random ForestClassification and Regression
Ectreme Gradient BoostingClassification and Regression
Gradient BoostingClassification and Regression
Logistic RegressionClassification
Linear RegressionRegression
Support Vector MachineClassification
Support Vector RegressionRegression
Table 2. Characteristics of the selected studies.
Author/Publication YearObjectiveTypeTarget LevelPrimary ML MethodPrimary Evaluation Metric (s)Validation Technique
Zaffar et al.,
2020 [12]
End-of-termCHS+HEFCBF + SVMAccuracy, Precision
Recall, F1 Score
10-fold
cross-validation
Jiang and Wang,
2020 [13]
In-termRHSPreferenceCDRMSE and MAE5-fold
cross-validation
Gitinabard et al.,
2019 [14]
Early predictionCHESVM, RF,
Logistic Regression
F1 Score5-fold
cross-validation
Gamulin et al.,
2015 [15]
End-of-termCHEDFT + (nB/kNN/ANN/SVM)AccuracyHold-out
Aydogdu,
2020 [16]
End-of-termCHEANNAccuracyHold-out
He et al.,
2020 [18]
At-risk
identification
CHERNN-GRU Joint
Neural Networks
AccuracyHold-out
Mengash, 2020
[19]
End-of-termCHEANNAccuracy, Recall,
Precision, and F1 Score
10-fold
cross-validation
Yang et al.,
2020 [20]
End-of-term, at-riskCHERFAccuracy, ROC AUC, Recall,
Specificity, Precision
Hold-out
Figueroa-Cañas and
Sancho-Vinue,
2020 [21]
Dropout and Final
Exam Performance
CHEConditional TreeRecall5-fold
cross-validation
Xing and Du,
2018 [22]
Drop outCHEDNNROC AUC10-fold
cross-validation
Injadat et al.,
2020 [23]
In-termCHEEnsemble ModelAccuracy, Precision, Recall,
F1 Score, FPR
Hold-out
Shantini et al.,
2018 [25]
End-of-termCHEAdaBoostPrecision, Recall,
and F1 Score
Hold-out
Yan and Liu,
2020 [26]
Predict student performance
in academic competition
CHEEnsemble Model
(SVM/RF/AdaBoost)
Precision, Recall,
F1 Score, ROC AUC
10-fold
cross-validation
Sekeroglu et al.,
2019 [27]
End-of-termCHSANN + DTAccuracyHold-out
Lu and Yuan, 2017 [42]End-of-termCHSintegrated Optimized Ensemble
Feature Selection Algorithm by
Density Peaks + SVM
Accuracy10-fold
cross-validation
Wakelam et al.,
2019 [43]
In-term, end-of-term,
at-risk
RHEDT, KNN and RFMSE-
Azcona et al.,
2019 [48]
At-risk predictionCHEkNN, RF, DT, Logistic Regression,
Linear and Gaussian SVM
F1 Score, Precision,
Recall
-
Hussain et al.,
2019 [49]
In-termCHEANN, SVMAccuracy, F1 Score,
Precision, Recall
5-fold
cross-validation
Imran et al.,
2019 [50]
End-of-termCHSJ48 DTAccuracy
(for comparisons)
5-fold
cross-validation
Waheed et al.,
2020 [51]
End-of-term,
early prediction
CHEDNNRecall, Precision,
Accuracy
Hold-out
Yousafzai et al.,
2020 [52]
End-of-termR + CPE+HSGA-based DTAccuracy, RMSE10-fold
cross-validation
Naicker et al.,
2020 [53]
End-of-termCHSLinear SVMAccuracy, ROC AUC5-fold
cross-validation
Elbadrawy et al.,
2016 [54]
Next-term grade prediction,
In-class assessment prediction
RHERF, FM, PLMR,
Course-specific regression
RMSE, MAE-
Deo et al.,
2020 [55]
End-of-termRHEELMMAE, MAPE,
root MSE, RRMSE
Hold-out
Yan and Liu,
2020 [26]
Predict student performance
in academic competition
CHEEnsemble Model
(SVM/RF/AdaBoost)
Precision, Recall,
F1 Score, ROC AUC
10-fold
cross-validation
Sekeroglu et al.,
2019 [27]
End-of-termCHSANN + DTAccuracyHold-out
Lu and Yuan, 2017 [42]End-of-termCHSIntegrated Optimized Ensemble
Feature Selection Algorithm by
Density Peaks + SVM
Accuracy10-fold
cross-validation
Wakelam et al.,
2019 [43]
In-term, end-of-term,
at-risk
RHEDT, KNN and RFMSE-
Azcona et al.,
2019 [48]
At-risk predictionCHEkNN, RF, DT, Logistic Regression,
Linear and Gaussian SVM
F1 Score, Precision,
Recall
-
Hussain et al.,
2019 [49]
In-termCHEANN, SVMAccuracy, F1 Score,
Precision, Recall
5-fold
cross-validation
Imran et al.,
2019 [50]
End-of-termCHSJ48 DTAccuracy
(for comparisons)
5-fold
cross-validation
Waheed et al.,
2020 [51]
End-of-term,
Early prediction
CHEDNNRecall, Precision,
Accuracy
Hold-out
Yousafzai et al.,
2020 [52]
End-of-termR + CPE+HSGA-based DTAccuracy, RMSE10-fold
cross-validation
Naicker et al.,
2020 [53]
End-of-termCHSLinear SVMAccuracy, ROC AUC5-fold
cross-validation
Elbadrawy et al.,
2016 [54]
Next-term grade prediction,
In-class assessment prediction
RHERF, FM, PLMR,
Course-specific regression
RMSE, MAE-
Deo et al.,
2020 [55]
End-of-termRHEELMMAE, MAPE,
root MSE, RRMSE
Hold-out
Turabieh et al.,
2020 [56]
End-of-termCHSHHO +
Layered RNN
AccuracyHold-out
Wang et al., 2020 [57]In-term, end-of-termCHEAttention-based Hybrid
RNN + SVM
Accuracy,
Recall
Hold-out
Adejo and Connolly,
2017 [58]
Early identification
At risk of dropping out
CHEEnsemble Hybrid modelAccuracy, Precision, Recall,
F1 Score, Error
10-fold
cross-validation
Tran et al., 2017 [59]End-of-termRHEHybrid ModelRMSE10-fold
cross-validation
Tsiakmaki et al.,
2020 [60]
Students at riskCHEDNN and
Transfer Learning
Accuracy10-fold
cross-validation
Table 3. Common datasets and properties.
DatasetLevelTypeCourses/Modules# of Students
SPDSEQuestionnaire2649 and 395
Kaggle MOOCHEOnline247>155,000
WorldUC DatasetHEOnline1010,523
Liru DatasetHEOnline181046
Junyi DatasetHEOnline182063
OULADHEOnline2232,593
Real-world dataset smart cardHEC. Behaviors-9207
Publisher’s Note: MDPI stays neutral with regard to jurisdictional claims in published maps and institutional affiliations.

