Article

A Study on the Customized Design Criteria of Pedestrians’ Specifications Using a Dimensionless Number

Department of Highway & Transportation Research, Korea Institute of Civil Engineering and Building Technology, Gyeonggi 10223, Korea
*
Author to whom correspondence should be addressed.
Appl. Sci. 2021, 11(22), 10762; https://doi.org/10.3390/app112210762
Submission received: 7 September 2021 / Revised: 11 November 2021 / Accepted: 13 November 2021 / Published: 15 November 2021
(This article belongs to the Special Issue New Trends in Design Engineering)

Abstract

:
Worldwide, the population is aging at a gradually increasing speed, due to a decrease in the population and the development of medical facilities and technology. Due to the rapid aging of the population, social infrastructure will also need to be transformed into convenient facilities for the elderly. Walking facilities have been manufactured based on body size measured for general adults. Accordingly, it is necessary to prepare a new design standard suitable for the characteristics of the elderly. It is very difficult to establish standardized values for the elderly because there is a large difference in gait characteristics as well as body size. Therefore, in this study, gait characteristics were measured for the elderly with the standard physique of the elderly in Korea, and the measured gait characteristic variable values were converted into dimensionless numbers to calculate coefficients with more representativeness. The calculated coefficient is expected to be more universally applied and utilized because factors that may affect it depending on the size of the body are removed. When designing a walking facility, the average body size is applied to convert it back into necessary walking attribute information (including units), and this is presented as an example from Korea. It is expected that the presented results can be used to design more suitable and safe pedestrian facilities for an aging society.

1. Introduction

According to CNN Money [1], an aging society is one in which people over 65 years old constitute 7% of the total population, an aged society is one where this figure is over 14%, and a post-aged or super-aged society is one where it is over 20%. Since it qualified as an aging society in 2000, South Korea’s population has been rapidly aging, and it became an aged society in 2017. The speed of aging is faster than in Japan, which became a super-aged society, and if the current progress continues, it is expected that South Korean society will become a super-aged society by 2025, as shown in Figure 1. As such, it is clear that the population of the elderly will continue to grow and, therefore, it is necessary to prepare social infrastructure and facilities for the elderly to ensure their safety and comfort.
In South Korea, transportation convenience facilities are assessed once every two years for improvement in transportation facilities for vulnerable road users. The survey on the current status of transportation convenience for vulnerable road users targets three areas: transportation means, passenger facilities, and roads (pedestrian environments). Roads (pedestrian environments) includes roads based on Art. 2, Clause 1 of the Roads Act (including appurtenances of the roads according to Clause 2 of the same article), as well as roads, underground passages, and pedestrian overpasses based on Art. 108 of the Roads Act [2].
The results of the most recent assessment, the survey on the current status of the transportation convenience for vulnerable road users [2], are as follows. The average share of transportation convenience facilities for vulnerable road users that met the standard was 78.3%, and that of the pedestrian environments was 78.0%. This value is an increase of 9.8% from 68.2% in 2014, indicating that a greater number of facilities have been improved to meet the standards. By contrast, the overall satisfaction rate of the elderly was 79.0 (out of 100); the satisfaction rate for pedestrian environments was 77.5, which was lower than that for other facilities (city buses, city railways, highway or intercity buses, airlines, or passenger ships). This means that despite more facilities meeting the standard, their relative contribution toward the satisfaction rate for pedestrian environments is low. There are 1.496 million vulnerable road users, among whom 49.2% are 65 years old or above; thus, these facilities would not satisfy half of the population of vulnerable road users. The reason for the low satisfaction rate for pedestrian environments despite the increase in the ratio of installed facilities meeting the standards may be due to the fact that the pedestrian facilities are not suited to the gait behavior of the elderly.
Walking is effective not only in reducing the risk of cardiovascular diseases, cancer, or stress, but also in improving lung capacity, lower body muscular strength, and physiological functions. Furthermore, it is reported that it is often recommended to the elderly as it imposes less of a burden on the body and causes less impact on musculoskeletal muscles and joints [3,4]. As such, walking is not merely a means to move around for the elderly; it also serves as a minimal bodily activity that can maintain or improve physiological functions.
It has been reported that an elderly person’s gait differs from that of healthy adults in terms of a decrease in walking speed and step length; the operational scope of the hip, knee, and angle joints; the slope of the upper body; and pelvic rotation [5,6,7,8].
Winter, Patla, Frank and Walt [9] compared the gait characteristics of young adults and the elderly, and reported that while there was no distinctive difference in cadence, the elderly people’s gait showed shorter step length, longer double support time, and smaller lower body power (which pushes the body from the ground in pre-swing). Ostrosky et al. [7] reported that the knee extension and stride length of an elderly person’s gait were smaller than those of young adults and that their overall gait speed was slower. As a result, the flat ground gait of the elderly showed shorter step length as they moved a shorter distance with the same number of steps, and they could maintain a stable gait for a longer duration with two-feet support on the ground than with one-foot support [10]. Such gait changes in the elderly are natural and are caused by aging.
The flat ground gait behavior of the elderly is greatly influenced by internal as well as gait environment factors. Menz, Lord, and Fitzpatrick [11] stated that the complex interaction of physical and psychological factors leads to behavioral changes; in particular, the interaction between the retrogression in muscles, control capacity in the physical factors, and the consequent psychological fear and anxiety may cause the changes in gait behavior. Physical and psychological anxiety may result in an increase in the risk of injuries while walking, such as falling accidents; environmental factors, such as structural changes in pedestrian passages, obstacles, stairs, or ramps may also affect an elderly person’s gait. Therefore, this study aimed to define the gait characteristics of the elderly by removing the risk factors involved in walking to achieve a more sustainable gait environment.

2. Review of Existing Studies and Necessity of the Elderly Standard Gait Model

2.1. Review of Existing Studies

Existing research has focused on the importance of the walking environment and the need for improvement. Pedestrian paths tend to target school-age children and the elderly, who use walking as their main movement method. This was reviewed in the center. The Sidewalk Condition Index (SCI) was presented for home-to-school routes, and one study conducted an analysis by selecting San Lorenzo as a test area [12].
For the aging population, the importance of the walking environment is generally recognized, and research has been conducted to produce more comfortable walking environments. In particular, the study that analyzed sidewalk maintenance to improve walking comfort for senior citizens suggests the SCI, and suggests a method to evaluate the walking path based on the analysis results. This includes the results of a review of physical pedestrian facilities that can affect pedestrians, such as road widths and damage to road facilities [13].
A characteristic of this study is that it provides a systematic methodology that can be evaluated in relation to external factors that can affect gait, that is, the physical environment. In this physical facility evaluation method, if a standard walking model that can evaluate individual pedestrians is prepared and applied, it is judged that a stronger pedestrian facility evaluation system can be prepared.

2.2. Design Standard Automobile

According to Explanation of the Rules on the Structural Facilities of Roads [14], the definition and the necessity for the design standard automobile are as follows: “There are various types of automobiles on the road. It is very complex to design roads according to each type of these automobiles, and in reality, as there are many types of automobiles, vehicles that represent the scope of each of these types of automobiles based on size and type should be classified and defined as ‘design standard automobiles.” Accordingly, when designing specific road zones, as shown in Table 1 or Table 2, the design standard automobile is defined as the largest sized automobile that would make frequent use of the road. Therefore, semi-trailers are defined as the design standard automobile for expressways and main arterial roads. The specifications by automobile type are presented in the Figure in Table 2.
This means that the selection and implementation of the design standard automobile aims to secure safe driving environments for all vehicle types frequently using the corresponding road by selecting the automobile type with the worst condition as the design standard automobile.
In the case of a vehicle, the width and length have a very large influence on the design of the turning radius. Accordingly, there is no major problem in designing road facilities with only these design standards. However, in the case of pedestrian facilities, suggesting the height and width of a person may only affect the design of the vertical structure through which a person passes, and it will not at all affect the determination of the facility that must be actually stepped on or passed through in the process of walking. In addition, the walking speed used to determine the green time of the current traffic light is the average value for a general person, and walking speed is different even for people of the same height. The gait attribute data calculated by the average of a simple sample cannot be said to be representative. In particular, since the difference between the individual gait characteristics of elderly people is very large, it may be inappropriate to apply the simple calculated average to generalize it, so it needs to be supplemented.

2.3. The Necessity for a Standard Gait Model

As with their application in the definition and implementation of the design standard automobile in road design, gait facilities are also used by people of different ages, with various disabilities or levels of discomfort, and different gait characteristics. Therefore, it is necessary to establish a standard and design a standard gait model similar to the design-standard automobile. However, it is very difficult to define the gait behavior of the elderly. Furthermore, gait characteristics are affected by individuals’ physical traits and the characteristics of their living environments, which naturally result in physical changes. Thus, gait characteristics appear regardless of age or sex.
Aging in South Korea is the fastest among all countries. The elderly population, which accounts for 49.2% of the total number of vulnerable road users [2], continues to grow; in fact, South Korea qualified as an aged society in 2017, and it is projected to be a super-aged society by 2025 [15]. To support safe and comfortable gait for the elderly in keeping pace with rapid aging levels, the development of a standard gait model for the elderly is an urgent requirement.

3. Methodology

3.1. Selection of the Participants and Results

To develop a standard gait model for the elderly, the study recruited a total of 112 elderly participants. The participants were 70 years or older, with heights and weights within ±5 cm and ±5 kg of the national average values according to Korea Health Statistics [15]. The result of the measurements is shown in Table 3. The largest error is the height of the female participants, which is shown as 2.9% (4.5 cm), with an average error of 1.16%. Thus, it was determined that the body size of the participants was similar to the average body size of the elderly.

3.2. Selection of the Participants and Results

A motion capture system is a device used for measuring physical and kinetic characteristics in medicine, rehabilitation medicine, sports kinematics, and kinetics, as well as for special effects in film. This device measures kinematic data and kinetic data through markers attached to each joint in the body. Due to the characteristic of the system that acquires and utilizes objective data compared to the existing video analysis methods, it is also increasingly used in determining the location and shape of the parts that people use in product design, such as handles or knobs.
A motion capture system generally consists of two parts: an infrared (IR) camera that acquires the 3D coordinates of markers attached to the body, and a ground reaction force plate that measures the ground reaction force. This study aimed to measure and analyze only the spatiotemporal parameters while walking and, accordingly, it used only the data acquired from the IR camera for analysis. As shown in Figure 1, the IR cameras used in this study were four Raptor-E cameras and eight Oespery cameras manufactured by Motion Analysis.
The camera setting for gait analysis was 120 frames per second. During the analysis, the 3D coordinate data taken from the cameras passed through a smoothing process (Cortex 6.0 S/W) using a cut-off frequency of 6 Hz. As shown in Figure 2, a gait passage of 4 m × 10 m was created, and infrared cameras were installed at a height of approximately 2 m. The camera installation gap was adjusted to capture at least three markers attached to the participants from all locations.

3.3. Selection of the Participants and Results

The most basic gait factors in flat ground walking are gait speed, step length, stride length, and step width, as shown in Figure 3. The aforementioned factors are greatly influenced by the physical traits of a person, such as their height and weight. In other words, a tall person has a greater chance of possessing a wider step length and stride length, which are length-related gait parameters, than a shorter person, resulting in a relatively high gait speed [16]. Accordingly, merely implementing the average values from the measurements in the pedestrian facility design can lead to distorted results due to the varying characteristics of different groups. As such, to minimize the potential distortion due to physical traits such as height or weight, this study used a method of standardizing gait factors through the dimensionless number proposed by Hof [17], as shown in Table 4.
The method proposed by Hof [17] is used for removing the unit by each gait factor from physical traits such as weight or height, through which the removal of the effects of the height and weight can be performed. Among the gait factors, this study aimed to propose the standard gait model (value) based on the following five factors: gait speed, step length, stride length, step width, and cadence (number of steps per minute).

4. Measurement and Analysis of Gait Characteristics

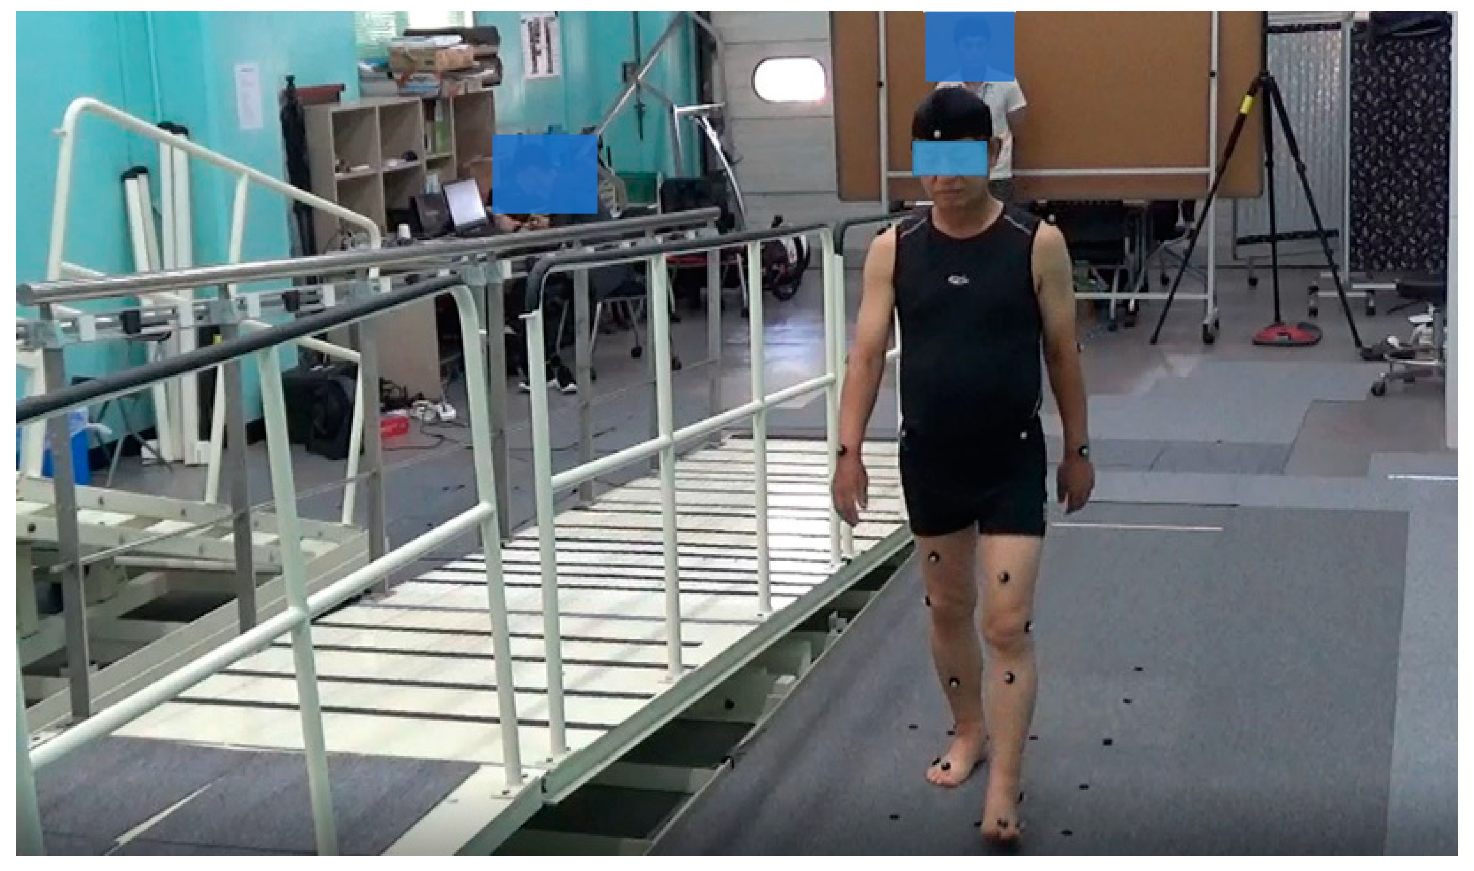
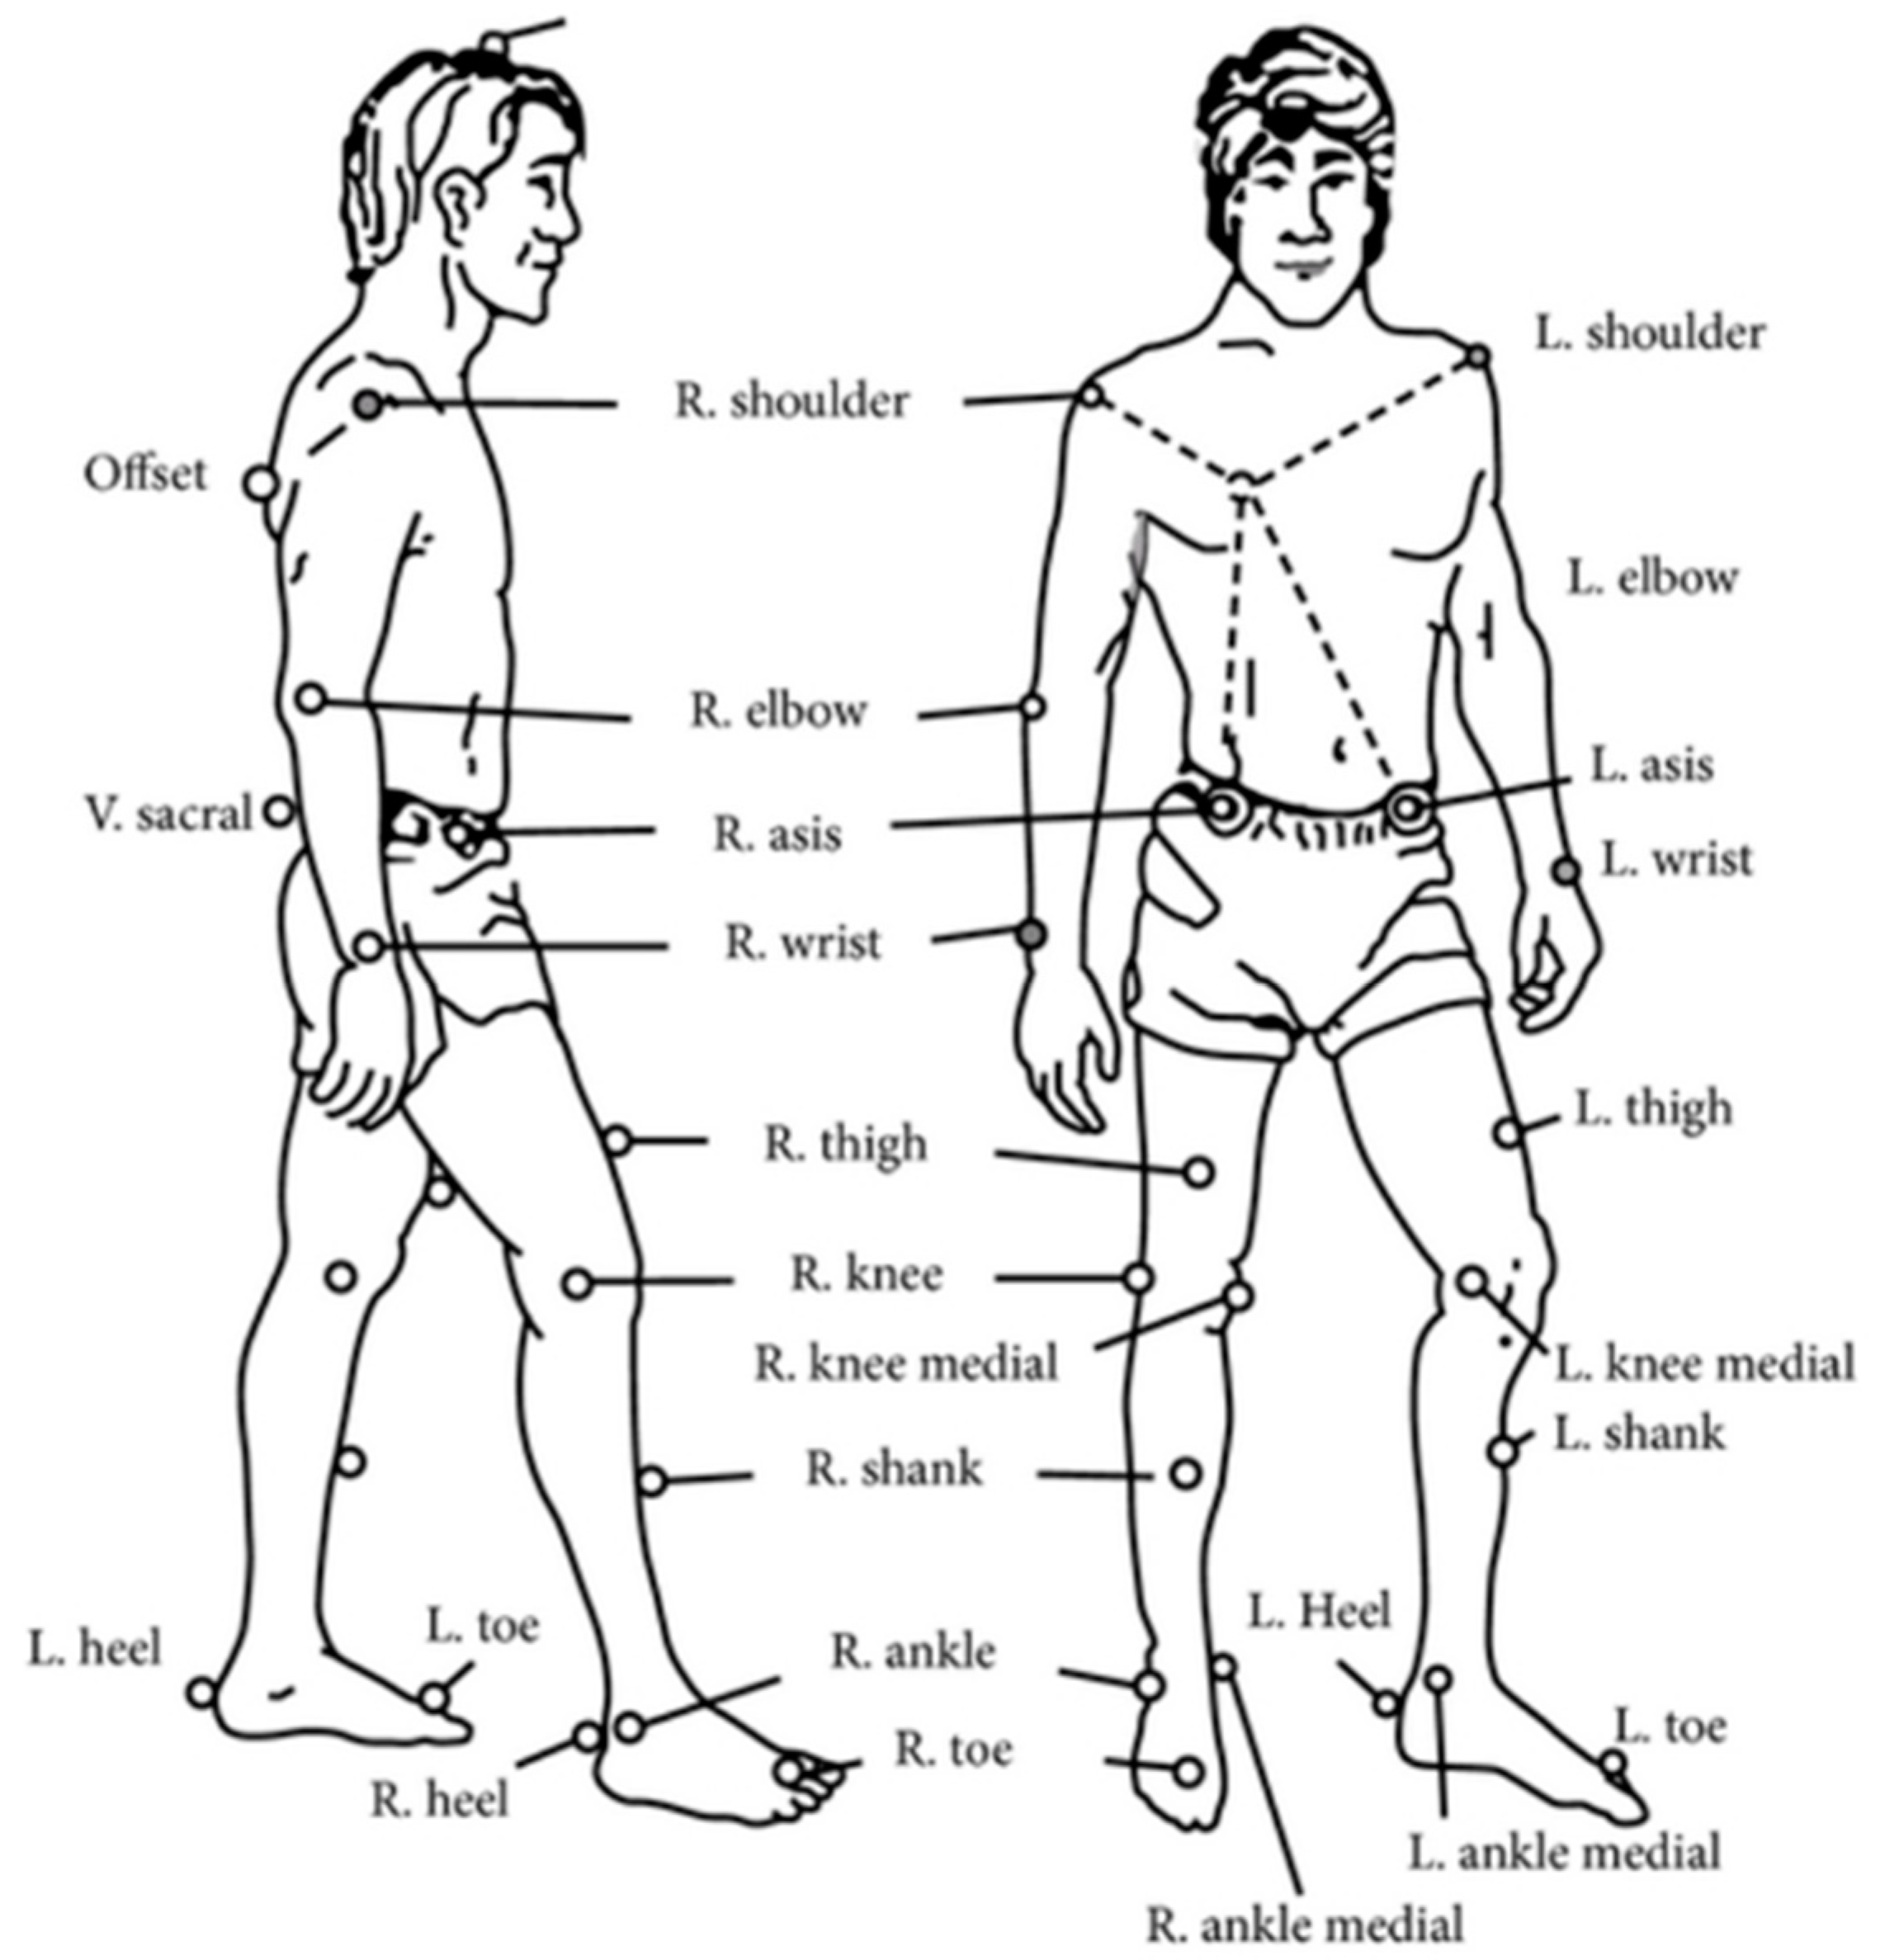
4.1. Measurement of Gait Characteristics

The participants wore sleeveless shirts and shorts so as to expose their joints for the measurement of gait characteristics; they did not wear shoes, in order to allow accurate measurement of the movement of ankle joints. Because this clothing may have differed from the participants’ usual clothing, and to prevent abnormal gait behaviors that might be caused by the measurement environment, the participants’ age and medical history were recorded, and after measuring their height and weight, they were asked to walk the pedestrian passage back and forth three to five times. Those whose gait behavior showed a marked difference from their natural gait (which was observed when they first entered the measurement room) were asked to walk repeatedly in order for them to achieve their natural gait and to become psychologically relaxed.
To measure the participants’ gait factors while they were walking repeatedly on the pedestrian passage, a total of 29 markers were attached to each of them, as shown in Figure 4. The 3D coordinates of these markers were first acquired with the participants staying still and standing straight on the ground reaction force plate. Based on these data, the 3D location of the joints was calculated and the body movement and load on each body part were measured. After acquiring the coordinates of the joints, a total of four markers that could cause discomfort while walking, each of which was attached to the knee and the inside of the ankle, were removed, and the main measurement of the gait characteristics was conducted, as shown in Figure 2.

4.2. Standardization of the Gait Characteristics

Based on the gait characteristics measurement from a total of 112 elderly participants, the data of 77 participants (40 male and 37 female participants) were selected for the final analysis. Participants with existing conditions such as arthritis, rheumatism, or other conditions that affect walking were excluded, as well as those whose gait behavior showed a marked difference between the initial and final measurements caused by degradation in physical strength due to repeated walking.
The five aforementioned gait factors were divided according to male and female groups; Table 5 shows the average, standard deviation, and average standard error by factor. Table 6 shows the standardized gait factors obtained after converting the measurements of the physical traits (weight and height) affecting the gait factors with the dimensionless number (Table 4).
For the dimensionless number conversion using gait factor, gait speed used the dimensionless number conversion equation of speed, where g is gravitational acceleration (9.8 m / s 2 ) and l 0 is the height of each participant. Step length, stride length, and step width used the dimensionless number conversion equation of length. The l ^ of each participant (step length, stride length, and step width in Table 6 are length values) was derived by substituting for the measurement by each factor, and substituting the height of each participant to l 0 . As cadence is the number of steps per minute, it was derived by applying both the frequency and time dimensionless number conversion equations. Assuming cadence as a fractional number with 1 as the denominator, the steps corresponding to the fraction were standardized using the frequency conversion equation, and the denominator (1) was standardized using the time conversion equation; the number after the frequency conversion was divided by the number after the time conversion to derive the cadence dimensionless number.
The average value by each gait factor in Table 5 is the mean average value that includes all the factors pertaining to body size resulting from individual differences in weight and height. It is difficult to establish that the determination of elderly people’s gait characteristics based on this value is the standard data for the facilities, even if this data on the elderly resulted from the standard body size of the elderly in South Korea. However, as shown in Table 6, the values obtained after the dimensionless number conversion cancel out the effect of the weight and height. Therefore, it can be said that these values are standardized values regardless of the person’s height and weight. The study derived the standard gait model of the elderly by inverse operation of the derived values by using the standard weight and height of the elderly in South Korea.

5. Standard Gait Model of the Elderly Using Dimensionless Numbering Coefficients in South Korea

5.1. Derivation of the Standard Gait Model of the Elderly in South Korea

The mean values in Table 6 are the average values without a unit, derived from the dimensionless number conversion of the individual gait factors measurements. To implement the mean values to the design of pedestrian facilities and to determine how the elderly with the average walking capacity and physical size walk, the unit by gait factor was re-applied based on the standard physical measurements. To this end, this study conducted the inverse operation of the applied dimensionless number conversion equation, which was used for the standardization, to derive the final value by the standardized gait factor. For example, the mean ( x ) of the dimensionless number of gait speed was derived as follows:
v ^ ¯ = n = 1 n v g × l 0 n
Here, the standardized gait speed ( v standardization ) with a unit was derived by the following equation:
v standardization = v ^ ¯ × g × l 0
With the same method, the average physical measurements of the elderly South Koreans were applied to the mean average value by gait factor, which was converted to the dimensionless number shown in Table 6, to derive the final standard gait model value. These data were presented by classifying the participants into male and female groups, and the mean average values of the integrated physical measurements were not separately presented. Thus, the weighted means of the integrated physical measurements, which were used to calculate the standard physical measurements, were used to derive the gait model values. The number of the samples used to derive the standard height of the elderly of and over 70 years old in National Health Statistics 2015 [18] was 404 male and 585 female participants, and the value was derived by using the following equation:
W e i g h t e d   a v e r a g e   h e i g h t   f r o m   t h e   s t a n d a r d   s i z e = ( A v e r a g e   h e i g h t   o f   m a l e × s a m p l e   s i z e   o f   m a l e ) + ( A v e r a g e   h e i g h t   o f   f e m a l e × s a m p l e   s i z e   o f   f e m a l e ) S a m p l e   s i z e   o f   m a l e + s a m p l e   s i z e   o f   f e m a l e
Table 7 shows the values by male, female, and integrated standard gait factors (standard gait model) derived by the above method. The data from the participants with physical characteristics close to the standard physical measurements were collected separately, and the accuracy of the measurement values was determined by motion analysis. Furthermore, the errors from the differences in physical measurements were minimized using the dimensionless number conversion method.

5.2. Comparison of Results with the Gait Characteristics of Normal Adults

Table 8 shows the comparison of the gait characteristics between the elderly, the normal adults presented by Roh et al. [19] and the standard gait model of the elderly proposed by this study. It is shown that compared to previous studies, the results from this study showed relatively better gait capacity in four gait factors except cadence. The elderly participants’ gait speed was faster (2%) and step width was narrower (7%) than those of the normal adults. Wider step width means toe-out gait, which would make it relatively difficult to maintain balance. On the other hand, cadence was increased by 4%. This means that while the stride length was similar, the number of steps taken increased, suggesting that the elderly participants moved in smaller steps.
As a result of comparing the control group in their 20s from a previous study with the results from this study, it was inferred that the gait capacity of the elderly was approximately 78% of the control group. In particular, the gait speed was very low, at 68% of that of the normal people. When the crossroad signal decision time (1.0 m/s) is applied, this means that the elderly may not be able to cross an entire crossroad within the given time despite having the general gait capacity and physical conditions. Considering the step length (87%) and stride length (78%), wide projections or low steps which normal adults could easily pass may cause difficulty for the elderly. In the case of the male elderly, the step width was wider than that of the normal adults, and the cadence was approximately 104%, with a small increase in the number of small steps.

6. Conclusions and Applications

6.1. Definition of the Standard Gait Model for the Elderly in South Korea

The standard gait model for the elderly defined in this study for the application of the pedestrian facilities design to prepare for super-aged society conditions is as follows.
The average height and weight of elderly South Korean males are 164.2 cm and 63.9 kg, respectively, and those of elderly South Korean females are 150.2 cm and 55.4 kg, respectively. The gait characteristics of the elderly in South Korea with the average weight and height who could walk independently without a walk-assisting equipment are as following Table 9:
In summary, the elderly were shown to have a lower gait capacity than young adults, as is commonly understood. Considering this relative gait capacity, the standards were either merely moderated to some degree or were assumed to be the same as those for young adults in the design of pedestrian facilities, resulting in continuous discomfort for the elderly. There has been a consensus on the need for legal and systemic infrastructure to prepare for the aged and super-aged society, and the improvement in social infrastructure toward the support of the elderly’s social and economic activities; thus, relevant standards for the design of pedestrian facilities for the elderly are essential. If there are no standard values that could be implemented in adjusting the facility limits for the elderly, more practical and applicable legal and systemic standards can be prepared if precise and objective bases of the type presented in this study are established.
However, it is recommended that a greater number of flexible design standards than those strictly based on the results shown in this study be prepared by establishing buffers based on concepts such as safety rate. For example, as shown in the terminology, gait speed is a scalar value. Thus, if it is applied as it is currently understood, it can satisfy the speed requirements only under the assumption that the person moves in a straight line. However, as shown in the values of step width, the elderly often walk with a toe-out gait or cannot maintain good balance, making straight walking more difficult than it is for young adults. Therefore, if the velocity, a vector concept, is measured, a lower value may be obtained.

6.2. Discussion and Conclusions

Existing studies also suggest that different pedestrian facility design standards should be prepared according to the purpose and environment of walking. Recently, research [21] into the construction of pedestrian-friendly cities has also been conducted. Some studies also analyzed the effect of walking density on walking [22] and suggested that walking accessibility has an effect on travel decisions [23]. As described above, walking is a transportation method that is always used at the beginning and end of each means despite using various means such as car, train, and air when moving. Some make up the entire trip just by walking. In the case of the elderly, the proportion of walking as a means of transportation is higher than that of other age groups [20]. Therefore, it can be said that the influence of the walking environment on mobility is greater for the elderly.
However, pedestrian facilities are designed based on the general adult and are constructed in order to eliminate inconvenience for general adults when moving. This makes the elderly feel uncomfortable when using the stairs or using the escalator. In other words, they use facilities that do not fit their body size and walking characteristics, and they complain of discomfort. Such inappropriate facilities can be directly related to safety accidents that can occur while walking for the elderly.
Therefore, it is judged that research on how to design facilities suitable for the elderly is necessary. In order to design a facility suitable for the elderly, it is fundamentally necessary to know the size of the elderly person’s body. This is achieved through the analysis of national statistics. In Korea, there is a Statistical Yearbook [15] that presents the average body size by age. However, it is difficult to publish statistics on how older people walk. This is because even people of the same height and weight demonstrate different gait speeds, step lengths, stride lengths, step widths, and cadences. If the average value of these gait variables is used, the effect caused by the height and the length of the lower extremities cannot be removed, and a kind of collinearity problem may occur. Therefore, in this study, we tried to solve this problem by applying a dimensionless number. The numerical value with the unit removed can be used for a more objective design of facilities because it can remove the factors that affect the height or the length of the lower extremities. By applying the average height to the gait variable values derived in this way, it was possible to derive a more objective average gait variable value for the elderly in that age group. Of course, there may be differences by country, but it is expected that standard gait variable values for each country can be derived if this method is applied. The results obtained in this way are expected to be applicable to the design of new pedestrian facilities.

6.3. Applications

For determining the duration of green lights at traffic junctions, the current standards set 1.2 m/s for normal crossroads, and 1.0 m/s or 0.8 m/s for those in elderly protection zones (silver zones). However, it is difficult to find the standards from which these values were derived. Even the normal crossroad setting was taken from standards used in other countries, and the standards for the elderly protection zone are merely a moderate version of the standards for young adults. As such, there are no gait models for determining pedestrian facilities standards and, as a result, foreign standards have often been borrowed.
Pedestrian passages in urban environments mostly comprise flat ground, ramps, and steps; therefore, this study proposed a standardized gait model (based on the gait factors) that can be applied to flat grounds and low steps. Table 10 shows this study’s scope of application. It is expected that the development of the proposed standard gait model into models determined by situation, age, and facility so as to be implemented in the facilities standards and design would lead to higher user satisfaction, as well as safer and more comfortable walking. As a method through which to achieve this, in this study, the gait attribute coefficient calculated as a dimensionless number was presented, and a method for calculating the average value of the gait attribute data with the required unit was experimentally calculated. Since there is no value that can be called the true value, it is difficult to make a clear comparison, but a comparison with the existing value used in Korea, which measured and analyzed the data, is presented. Considering the prospect of a super-aged society, and in light of this method, it is expected that studies on more representative standards and the development of facilities for safe walking for the elderly will be conducted continuously.

Author Contributions

Conceptualization, methodology, validation, formal analysis, data curation, writing—original draft preparation, and writing C.-G.R., review and editing, B.-J.P. All authors have read and agreed to the published version of the manuscript.

Funding

This research was funded by the Key Research Project of the Korea Institute of Civil Engineering and Building Technology, “Development of Sustainable MaaS (Mobility as a Service) 3.0+ Technology in Rural Areas”.

Institutional Review Board Statement

Ethical review and approval were waived for this study, due to ‘The participant’s informed consent procedure has been completed, and there are no ethical issues or national policy issues as it is a public-purpose research conducted by the National Research Institute.’

Informed Consent Statement

Ethical review and approval were waived for this study, due to the Bioethics Act in Korea—Article 2, Paragraph 2 (research conducted by the state or local government directly or entrusted to review and evaluate public welfare or service programs).

Conflicts of Interest

The authors declare no conflict of interest.

References

  1. CNN Money, See the ‘Super-Aged’ Nations. Available online: https://money.cnn.com/interactive/news/aging-countries/index.html (accessed on 7 April 2020).
  2. Ministry of Land, Infrastructure and Transport (MOILIT). Actual Condition of Transportation Convenience Movement for 2017 2018, MOILIT (Korea). Available online: https://tmacs.kotsa.or.kr/web/TraffickingWeak/psd/weak_report_list.do?mid=S3106 (accessed on 7 July 2021).
  3. Andrews, J.D. A walk a day keep cancer away. Prevention. 2005. Available online: https://www.prevention.com/health/a20458566/a-walk-a-day-keeps-cancer-away/ (accessed on 7 July 2021).
  4. Jankowski, L.W.; Ferguson, R.J.; Langelier, M.; Chaniotis, L.N.; Choquette, G. Accuracy of methods for estimating O2 cost of walking in coronary patients. J. Appl. Physiol. 1972, 33, 672–673. [Google Scholar] [CrossRef]
  5. Choi, J.S.; Kang, D.W.; Mun, K.R.; Bang, Y.H.; Tack, G.R. Comparison of Kinematic Factors between Old and Young People during Walking on Level and Uneven Inclined Surfaces. Korean J. Sport Biomech. 2010, 20, 33–39. [Google Scholar] [CrossRef] [Green Version]
  6. Eun, S.D.; Lee, K.K. The effect of the speed conditions on the gait pattern in treadmill walking of eldery persons. Korean J. Phys. Educ. 2004, 43, 397–404. [Google Scholar]
  7. Ostrosky, K.M.; VanSwearlngen, J.M.; Burdett, R.G.; Gee, Z. A comparison og gait characteristics in young and old subject. Phys. Ther. 1994, 74, 637–644. [Google Scholar] [CrossRef]
  8. Paroczai, R.; Bejek, Z.; Illyes, A.; Kocsis, L.; Kiss, R.M. Gait parameters of healthy, elderly people. Phys. Educ. Sport 2006, 4, 49–58. [Google Scholar]
  9. Winter, D.A.; Patla, A.E.; Frank, J.S.; Walt, S.E. Biomechanical walking pattern changes in th fit and healthy elderly. Phys. Ther. 1990, 70, 340–347. [Google Scholar] [CrossRef]
  10. Cromwell, R.L.; Newton, R.A. Relationship between balance and gait stability in health older adults. J. Aging Phys. Act. 2004, 12, 90–100. [Google Scholar] [CrossRef]
  11. Menz, H.B.; Lord, S.R.; Fitzpatrick, R.C. A structural equation model relating impaired sensorimotor function, fear of falling and gait patterns in older people. Gait Posture 2007, 25, 243–249. [Google Scholar] [CrossRef]
  12. Corazza, M.V.; D’Alessandro, D.; Di Mascio, P.; Moretti, L. Methodology and evidence from a case study in Rome to increase pedestrian safety along home-to-school routes. J. Traffic Transp. Eng. 2020, 7, 715–727. [Google Scholar] [CrossRef]
  13. Corazza, M.V.; Di Mascio, P.; Moretti, L. Management of sidewalk maintenance to improve walking comfort for senior citizens. WIT Trans. Built Environ. 2018, 176, 195–206. [Google Scholar] [CrossRef] [Green Version]
  14. Ministry of Land, Infrastructure and Transport (MOILIT). Explanation of the Rules on the Structural Facilities of Roads 2013; MOILIT: Sejong, Korea, 2013. [Google Scholar]
  15. Korean Statistical Information Service, Funeral Population Statistics. Available online: http://kosis.kr/statisticsList/statisticsListIndex.do?menuId=M_02_01_01&vwcd=MT_RTITLE&parmTabId=M_02_01_01#SelectStatsBoxDiv (accessed on 8 September 2019).
  16. Lee, H.S. Effect of dimensionless number and analysis of gait pattern by gender -spatiotemporal variables-. Korean J. Phys. Educ. 2014, 53, 521–531. [Google Scholar]
  17. Hof, A.L. Scaling gait data to body size. Gait Posture 1996, 4, 222–223. [Google Scholar] [CrossRef]
  18. Korea Center for Disease Control and Prevention, National Health Statistics 2018. Available online: https://knhanes.cdc.go.kr/knhanes/sub04/sub04_03.do (accessed on 7 April 2020).
  19. David, R.B.; Naira, C.K.; Robert, T.; Peter, M.Q. Research Article Biomechanics of Lower Limbs during Walking among Candidates for Total Knee Arthroplasty with and without Low Back Pain. BioMed Res. Int. 2015, 2015. [Google Scholar] [CrossRef] [Green Version]
  20. Roh, C.G.; Park, B.J.; Kim, J.S. Comparative research on walking characteristics of ordinary and elderly people on flat ground. Int. J. Adv. Eng. Manag. Res. 2017, 2, 1018–1025. [Google Scholar]
  21. Campisi, T.; Basbas, S.; Tesoriere, G.; Trouva, M.; Papas, T.; Mrak, I. How to Create Walking Friendly Cities. A Multi-Criteria Analysis of the Central Open Market Area of Rijeka. Sustainability 2020, 12, 9470. [Google Scholar] [CrossRef]
  22. Amprasi, V.; Politis, I.; Nikiforiadis, A.; Basbas, S. Comparing the microsimulated pedestrian level of service with the users’ perception: The case of Thessaloniki, Greece, coastal front. Transp. Res. Procedia 2020, 45, 572–579. [Google Scholar] [CrossRef]
  23. Rahman, M.T.; Nahiduzzaman, K. Examining the walking accessibility, willingness, and travel conditions of residents in Saudi cities. Int. J. Environ. Res. Public Health 2019, 16, 545. [Google Scholar] [CrossRef] [PubMed] [Green Version]
Figure 1. Configuration of motion capture system (infrared cameras): (a) Oespery; (b) Raptor-E.
Applsci 11 10762 g001
Figure 2. Motion capture analysis environment.
Applsci 11 10762 g002
Figure 3. Gait factor.
Applsci 11 10762 g003
Figure 4. Modified Helen Hayes marker arrangement utilized for 3D motion analysis.
Applsci 11 10762 g004
Table 1. Definition of the design standard automobile by road hierarchy.
Type of RoadDesign Standard Automobile
Expressway and main arterial roadsSemi-trailer
Minor arterial roads and collector roadSemi-trailer or large vehicle
local roadsLarge vehicle or passenger vehicle
Table 2. Specifications per the design standard automobile type.
TypeWidth
(m)
Height
(m)
Length
(m)
Axis
Distance
(m)
Minimum Rotational
Radius
Specifications
Passenger vehicle1.72.04.72.76.0 Applsci 11 10762 i001
Small
vehicle
2.02.86.03.77.0 Applsci 11 10762 i002
Large
vehicle
2.54.013.06.512.0 Applsci 11 10762 i003
Semi-trailer2.54.016.7Front: 4.2
Back: 9.0
12.0 Applsci 11 10762 i004
Table 3. Average body size of the elderly.
Type of RoadSample SizeAverage AgeParticipant GroupKorea Health Statistics [13]Error (Error Rate (%))
Height
(cm)
Weight
(kg)
Height
(cm)
Weight
(kg)
HeightWeight
male5274.38165.8162.93164.263.91.6 (0.98)−1.0 (−1.53)
female6075.52154.6956.62150.255.44.5 (2.99)1.2 (2.21)
total11274.99160.2760.05----
Table 4. Dimensionless Number Conversion Method.
Type of TypeSymbolDimensionDimensionless Number
Speed, velocity υ = x ^ LT−1 v ^ = v g × l 0
Length, distancel, xL l ^ = l l 0
FrequencyFT−1 f ^ = f g l 0
TimeTT t ^ = t l 0 g
( g acceleration of gravity (=9.81 m / s 2 on earth), l 0 length (height)).
Table 5. Gait factor before standardization.
GenderSample SizeAverageStandard
Deviation
Standard Error of Mean
Gait speed
(cm/s)
male40100.2316.972.68
female3794.8415.412.53
Step length
(cm)
male4053.687.521.19
female3748.3710.131.67
Stride length
(cm)
male40107.7114.622.31
female37100.9110.331.70
Step width
(cm)
male4012.663.010.48
female3711.422.800.46
Cadence
(step/min)
male40112.329.761.54
female37112.4611.191.84
Table 6. Gait factor after standardization (dimensionless numbering coefficients for normalization of gait properties).
GenderSample SizeAverageStandard
Deviation
Standard Error of Mean
Gait speedmale400.250.040.01
female370.240.040.01
Step lengthmale400.320.040.01
female370.310.070.01
Stride lengthmale400.650.090.01
female370.650.070.01
Step widthmale400.080.020.00
female370.070.020.00
Cadencemale400.770.060.01
female370.750.070.01
Table 7. Standard gait model of the elderly in South Korea.
GenderSample SizeD.N. MeanStandardized ValueComparison Value
(Average of Measured)
Gait speed
(cm/s)
male400.25100.29100.23
female370.2492.0894.84
total770.2493.82-
Step length
(cm)
male400.3252.5453.68
female370.3146.5648.37
total770.3249.89-
Stride length
(cm)
male400.65106.73107.71
female370.6597.63100.91
total770.65101.35-
Step width
(cm)
male400.0813.1412.66
female370.0710.5111.42
total770.0710.91-
Cadence
(step/min)
male400.77112.87112.32
female370.75114.95112.46
total770.76114.32-
Table 8. Comparison of gait characteristics between the elderly and normal adults.
GenderThis StudyPrevious Study [20]
Standardization ResultThe AverageThe Elderly
(66+)
Normal Adults
(Age 20–30)
Gait speed
(cm/s)
male100.29100.2391.86137.30
female92.0894.84
total93.82-
Step length
(cm)
male52.5453.6849.6157.10
female46.5648.37
total49.89-
Stride length
(cm)
male106.73107.71100.87129.80
female97.63100.91
total101.35-
Step width
(cm)
male13.1412.6611.7812.00
female10.5111.42
total10.91-
Cadence
(step/min)
male112.87112.32109.75109.50
female114.95112.46
total114.32-
Table 9. Standard gait model.
GenderGait Characteristic ValuePercentage of Walking Ability Compared to Adults in Their 20s [20]
Gait speed
(cm/s)
male100.2973%
female92.0867%
total93.8268%
Step length
(cm)
male52.5492%
female46.5682%
total49.8987%
Stride length
(cm)
male106.7382%
female97.6375%
total101.3578%
Step width
(cm)
male13.14110%
female10.5188%
total10.9191%
Cadence
(step/min)
male112.87103%
female114.95105%
total114.32104%
The gait speed is 68%, step length is 87%, stride length is 78%, and step width is 91% compared to young adults. Cadence is approximately 104%, walking in small steps.
Table 10. Applications of the standard gait model by factor.
DefineApplicable FacilitiesContents
Gait speedgait speedcrossroads and other pedestrian facilitiesduration of signal time
Step lengthsteps per minuteescalator,
moving walk
speed of escalator or moving walk
Stride lengthdistance from the heel of the front foot to the heel of the back footstepsestablishment of the appropriate design standards for facilities affected by steps, such as the width and height of stairs on pedestrian roads
Step widthdistance between the two consecutive heels performed by the same foot
Cadencedistance between the center of the heel of both feet while walking
Publisher’s Note: MDPI stays neutral with regard to jurisdictional claims in published maps and institutional affiliations.

