Article

The Influences of Local Glacitectonic Disturbance on Overconsolidated Clays for Upland Slope Stability Conditions: A Case Study

by
Kamil Kiełbasiński
1,*,
Paweł Dobak
1,
Łukasz Kaczmarek
2 and
Sebastian Kowalczyk
1
1
Faculty of Geology, University of Warsaw, Żwirki i Wigury 93 St., 02-089 Warsaw, Poland
2
Faculty of Building Services, Hydro and Environmental Engineering, Warsaw University of Technology, Nowowiejska 20 St., 00-653 Warsaw, Poland
*
Author to whom correspondence should be addressed.
Appl. Sci. 2021, 11(22), 10718; https://doi.org/10.3390/app112210718
Submission received: 11 October 2021 / Revised: 7 November 2021 / Accepted: 9 November 2021 / Published: 13 November 2021
(This article belongs to the Special Issue New Frontiers in Sustainable Geotechnics)

Abstract

:

Featured Application

Spatial development planning, construction of high-rise buildings, construction with the use of deep excavations in areas near slopes (especially in urban areas), where the geological structure is complicated.

Abstract

Reliability of equilibrium state evaluation about settlement slopes in the context of natural and human-made hazards is a complex issue. The geological structure of the vicinity of the upland slope in the urban environment of Warsaw is characterised by a significant spatial diversification of the layers. This is especially due to the glacitectonics in the Mio-Pliocene clays, which are located shallowly under the sandy tills’ formations. With substantial variability in the clay roof surface, point recognition by drilling is often insufficient. The use of electrical resistivity imaging (ERI) in the quasi-3D variant provides accurate images of the real ground conditions, which is crucial in optimal geotechnical design. In forecasting the behaviour of the slope, it is necessary to quantify the impact of spatially differentiated systems of disturbed layers on changes in the safety factor (SF), which corresponds to the observed landslide activity of the Warsaw Slope. This study concerns numerous calculation model analyses of the optional clay position in the context of slope stability conditions. A wide range of soil properties variability was taken into account, resulting from both lithogenesis and subsequent processes disintegrating the original soil structure. Regarding the geological conditions of the slip surface, the use of classical computational methods and numerical modelling (FEM) was considered for comparative purposes. The results indicated that local changes in equilibrium conditions were affected by the different morphology of the clay roof surface of the slope and the alternation in strength characteristics on the slip surfaces. The findings of the study contribute to sustainable spatial planning of near-slope regions.

1. Introduction

Slope stability, especially among urban areas, is a subject of extensive engineering-geology research [1,2]. The scope of these studies includes improvement of geological structures’ identification, especially glacitectonic ones, as well as optimising methods of forecasting slope stability conditions. The first aspect uses shallow geophysics, which allows more precise identification and mapping of the course of structural disturbances. The second aspect of the analysis concerns the optimisation of computational methods that are applied in forecasting the equilibrium state of the slopes. Such an approach allows the correlation of the results of the identification of shallowly located glacitectonic structures obtained with the use of different methods. It provides a possibility to apply the data acquired with the electrical resistivity imaging (ERI) method to classical slope stability model analyses and to the finite element method (FEM). Combined, the analysed issues can be proposed as a pattern of conducting slope stability research, especially in the case of the wide availability of various research and computational methods, that do not necessarily fit all conditions.
The electrical resistivity method can be helpful in determining a model of spatial variability of strata and slope stability. This method is marked by high prospection efficiency and is commonly used to characterise geological structures, e.g., course and depth of geological boundaries, including the position of clays. Vertical electrical sounding [3,4,5] and electrical resistivity imaging (ERI) are commonly applied techniques [6,7,8] to determine the position of the roof of Neogene clays in Poland. The ERI method, also known as the electrical resistivity tomography (ERT) or continuous vertical electrical sounding (CVES) method, is often used in the mapping of landslides and slope stability [9,10,11,12,13]. The theoretical basis of the electrical resistivity imaging method, as well as the history of its development and application, was described by [14,15]. In these studies, the results of an ERI survey were applied to determine the position of the roof of the Neogene clays.
The results of the quantitative assessment of the equilibrium state conditions are the subject of numerous analyses [16,17,18] and were developed in this work according to the conclusions of [19,20], among others. An important influence on the methodology development of stability analyses has the effect of studies of landslides at different scales and conditions (e.g., [16,17,18,19,20,21,22,23,24]). Models introduced in the analysed case study take into consideration different factors the spatial variability of the geological structure and periodic changes in soil strength properties caused by changes in moisture content and consistency on potential structural slip surfaces. Those changes can be caused by the seepage of rainwater, especially during increasingly occurring events of heavy rains and sewage system failures. The effects of such situations were analysed using multivariant, computer-aided modelling. A number of classical methods of slope stability prediction, based on various assumptions, are in use, although those methods typically do not take geological conditions into account while determining the location of potential slip zones. Another group of analyses uses the modelling of the slope stability conditions based on the finite element method. The comparative approach to the slope stability issue is significant in terms of recognition of optimal slope safety conditions, but also in terms of the evaluation of various prognostic methods. These issues are addressed by the study of the assumptions of both the LEM and the determination of optimal slope slip surfaces using FEM. The obtained results indicate the necessity to further develop an outcome comparison from these two groups of calculation methods [19,25].
Another aspect that is frequently discussed in research is the adoption of simplified plane strain models for spatial issues [21,22]. The presented methodological approach allows the assessment of the influence of various spatial forms on slope stability, and it also answers the question of whether the simplification of the plane-deformation analysis model will have a significant impact on the obtained results. This task was carried out with the use of a 3D model by finite element method (FEM) calculations as well as performing calculations in 2D using two traditional limit equilibrium methods (LEMs; namely, Bishop and Janbu methods) and also once again by FEM.
The FEM calculations were carried out by the ZSoil 2016 software with the implementation of the proportional reduction in strength parameters (c/ϕ reduction—SRM). The SRM is commonly used for slope stability analysis [16,17,26,27,28]. The beginnings of SRM application can be associated with the publication of Zienkiewicz et al. (1975) [29]. Based on previous experiments [23,30], the safety factor was determined with consideration of the successively reduced values of strength parameters for iterative solving of the boundary problem of statics using the finite element method. During the calculation process, the state of equilibrium was analysed with the assumption of the geostatic distribution of the stress state in the soil medium. At the initial stage, the value of the reduction factor SF = 1 was determined for which the equilibrium state was defined for the initially adopted soil parameters. This stage served as a reference level for subsequent iterations in which there was a discrete reduction in the strength parameters of the soil medium by increasing the SF coefficient. This process was conducted until the equilibrium state was lost, which is associated with the development of the slip zone. The last value of the reduction factor SF at which it was possible to obtain the equilibrium state corresponds to the value of the estimated safety factor. The previously mentioned method was applied to solve the problems of the stability of the soil medium in 2D and 3D deformation models.

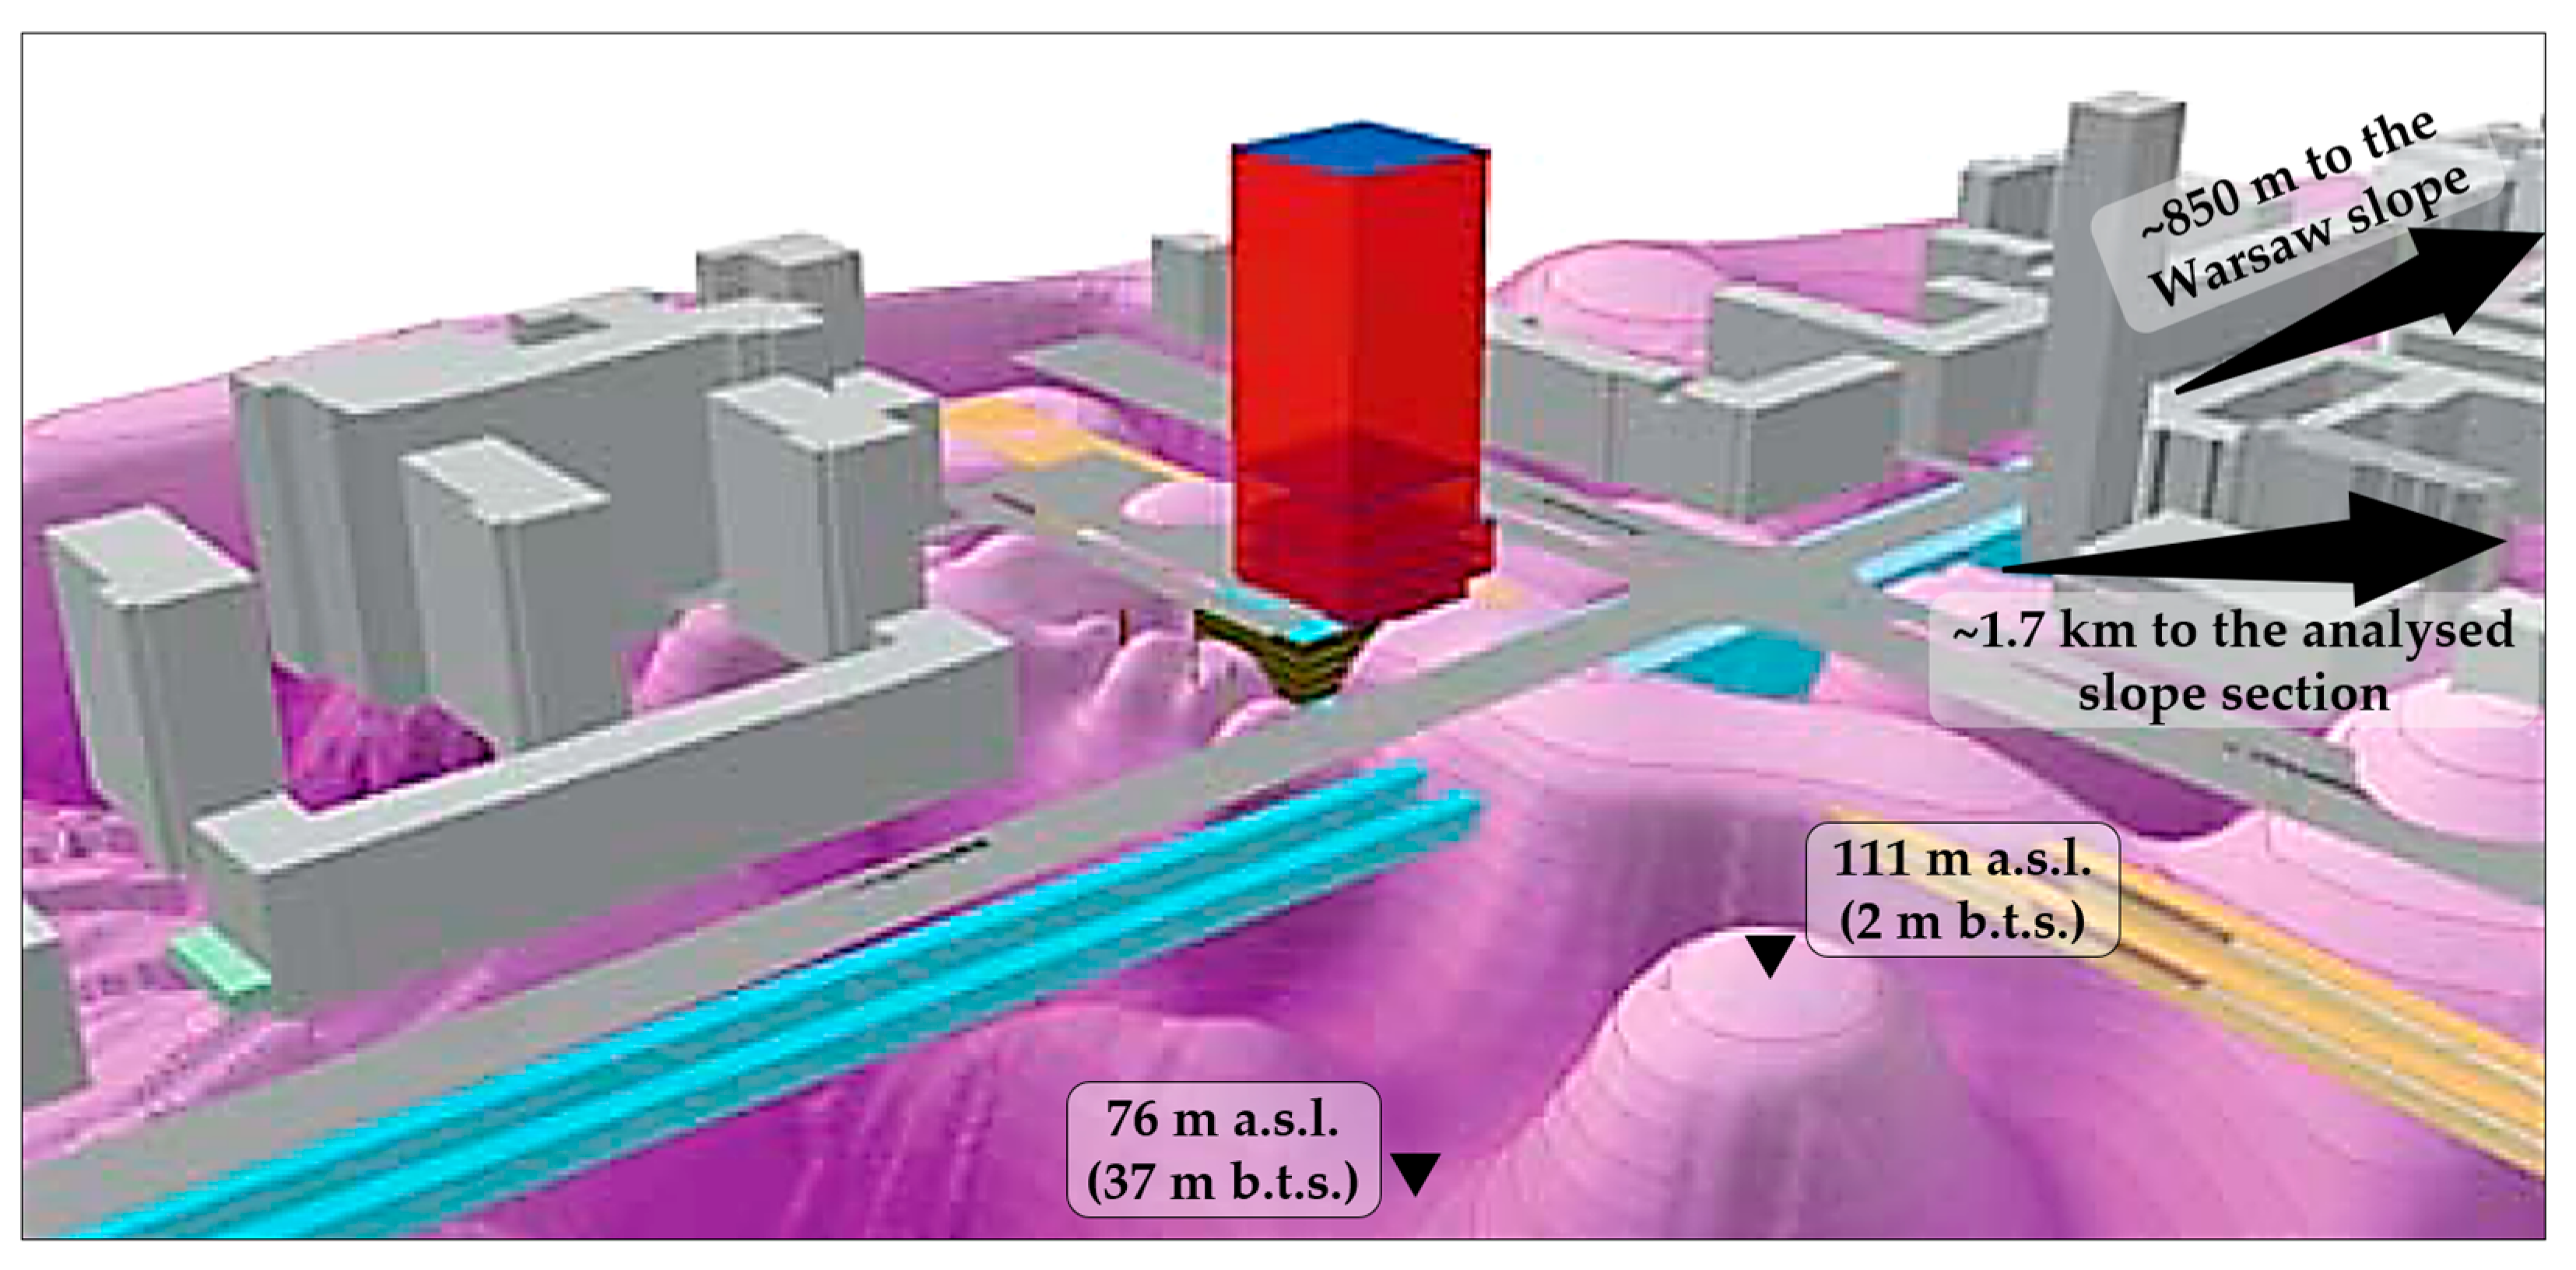
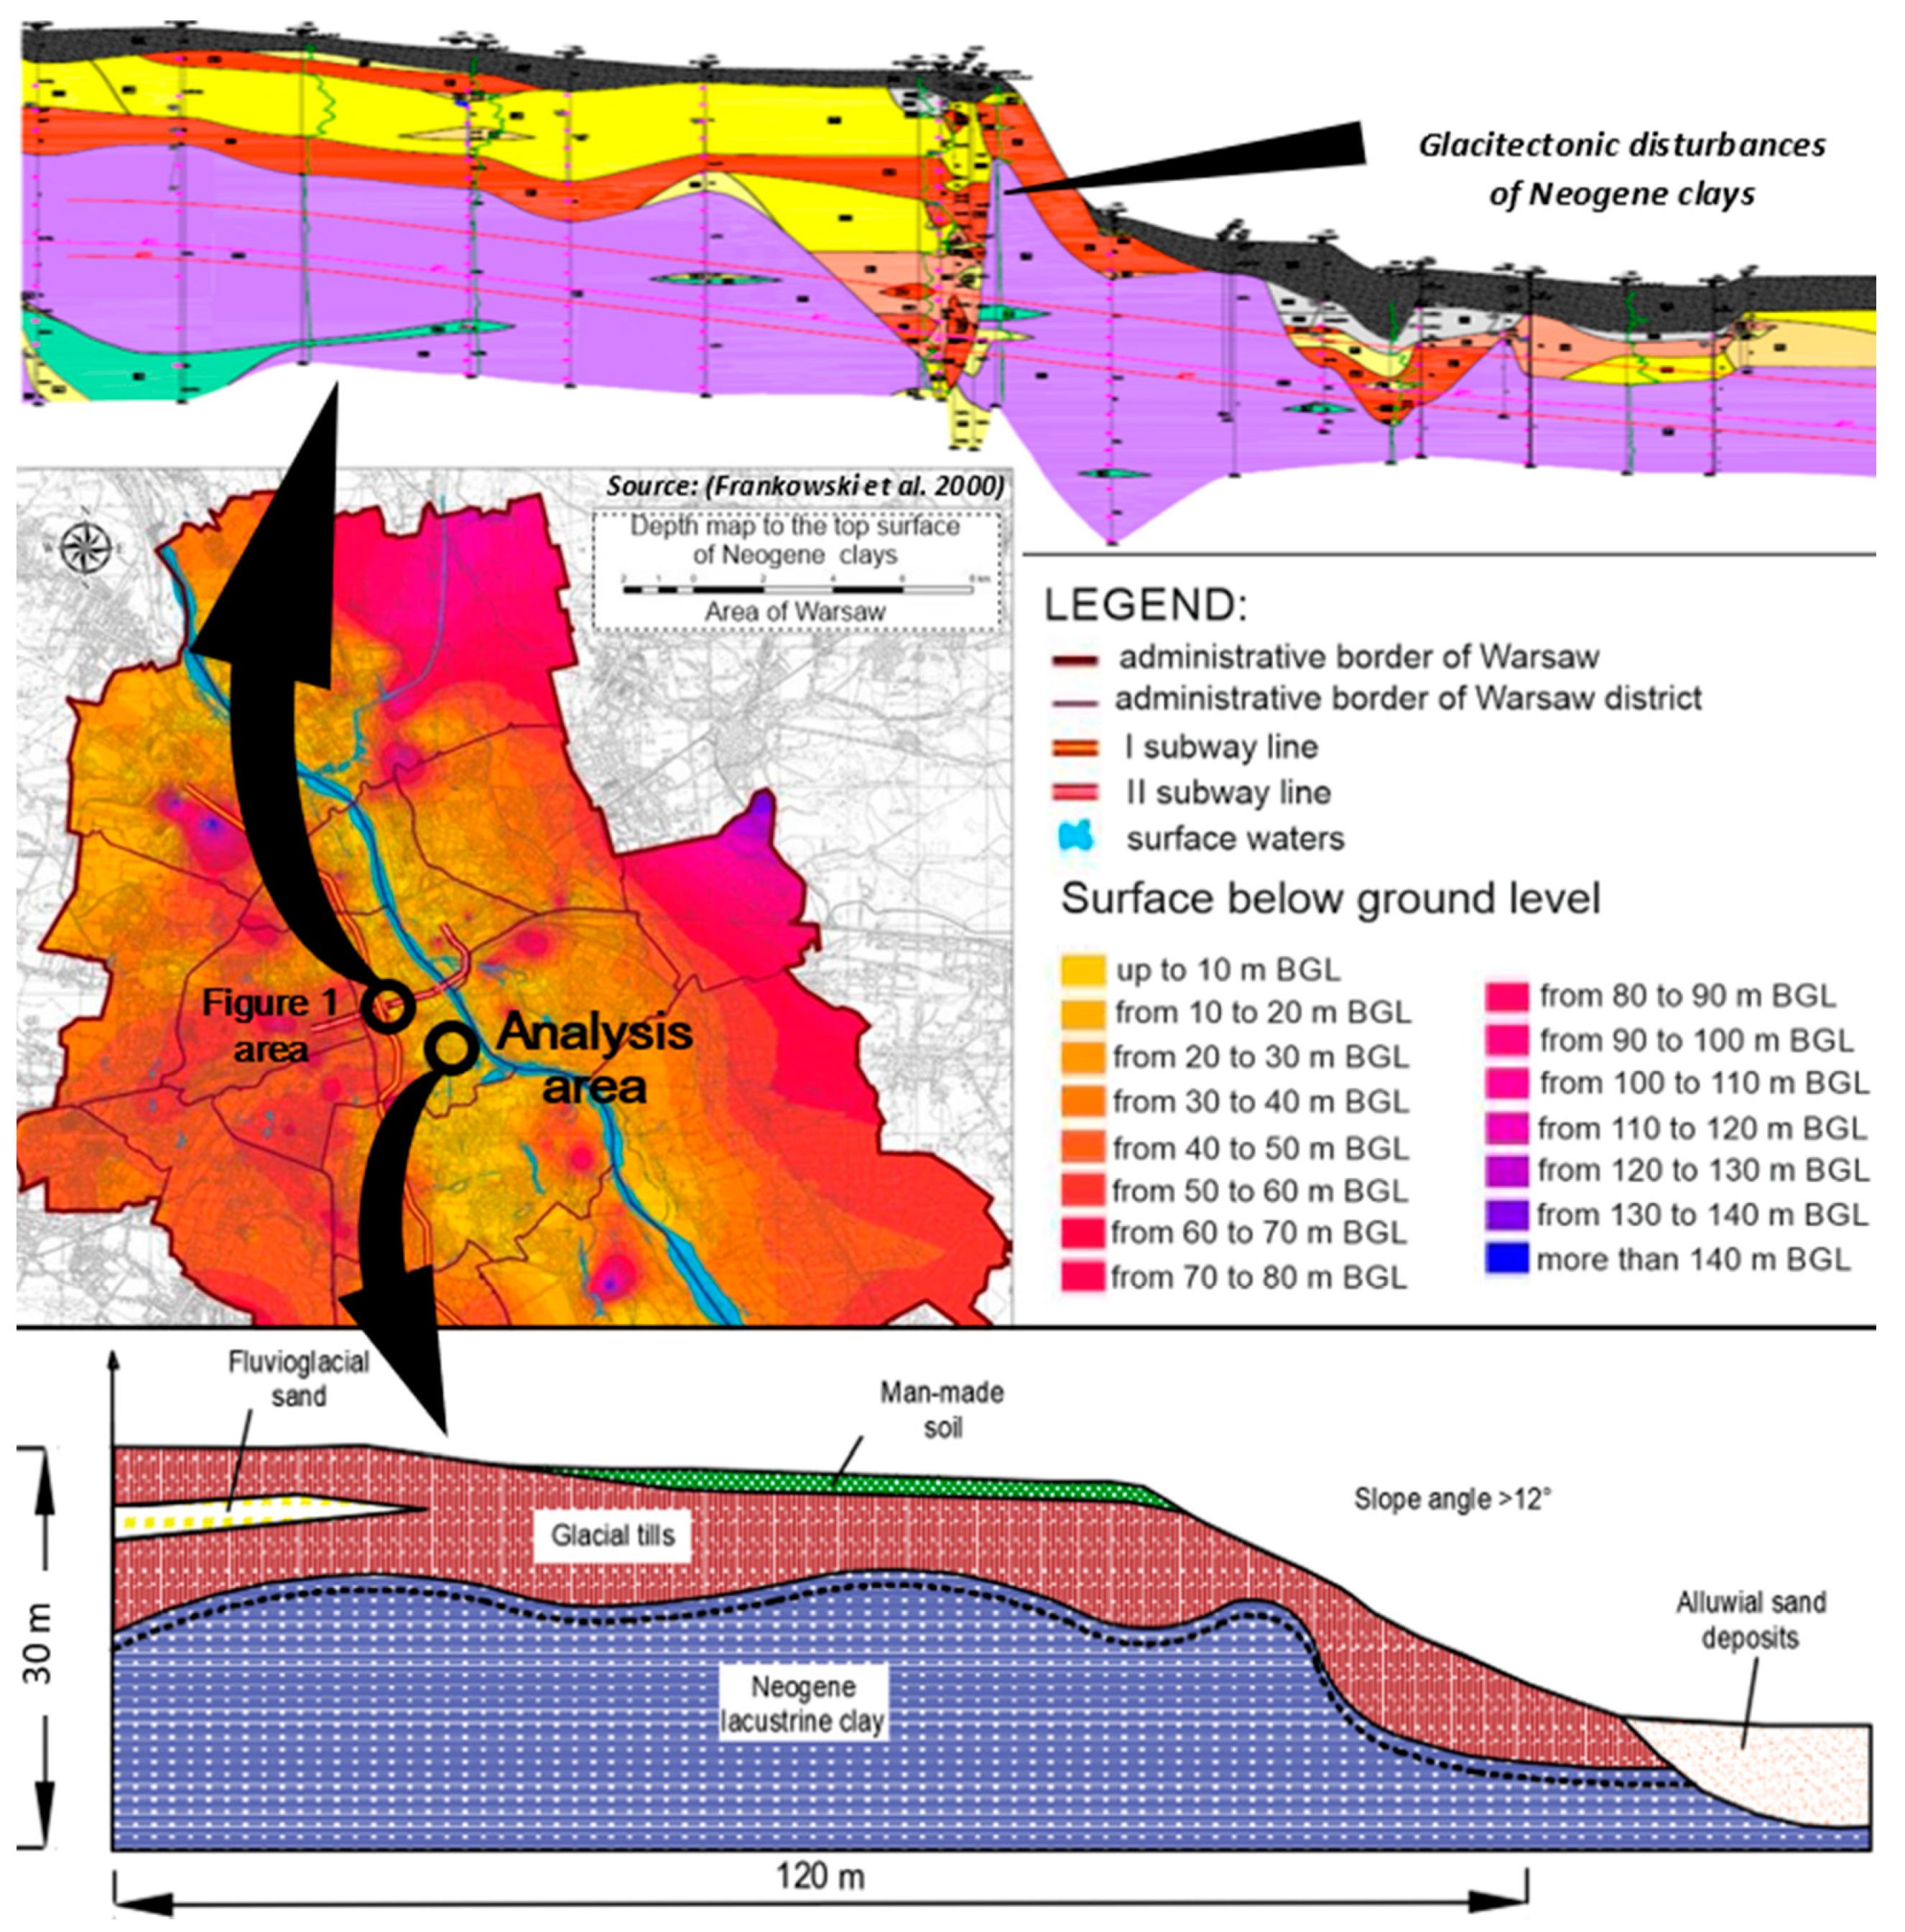
2. Analysed Area and Materials—Structural Factors of Stability Conditions

The subject of the study presented in this paper is potential changes in the slope stability conditions in a selected survey area located on the upland in the vicinity of the Warsaw Slope. The survey area was previously investigated with the use of geophysical methods.
Warsaw Slope, which forms the border of the Vistula River Valley, was used as the study site. Warsaw Slope is located on Warsaw Upland, which is built by glacitectonically deformed clays of the Poznań clay formation (Figure 1), covered by layers of glacial till and fluvioglacial sediments.
The spatially and genetically complex structural setting of Warsaw Slope has been carefully documented by many studies (e.g., [32,33]). Successive development of processes leading to the displacement of soils can be observed, among others, by comparison of historical iconography illustrating the panoramas of the Old Town, Krakowskie Przedmieście, and Żoliborz, seen from the side of Vistula River.
There are also historical records mentioning difficulties in placing building foundations, e.g., in the case of St Anne’s Church, located directly on the Warsaw Slope. Archival materials, especially panorama paintings and shaded-relief maps, can be used to assess the nature and directions of changes in the Warsaw Slope and correlate them with a rich collection of results of contemporary research and studies. Lithological profiles of numerous boreholes, the results of site observation, i.e., condition of existing buildings, observations from research outcrops discovering old foundations, and data from recently conducted geophysical surveys are collected [9].
Comparisons on modern morphometry indicate that in the most densely developed downtown quarter, the mean height of the Warsaw Slope ranges from 15 to over 20 m, with a typical range of inclination of the slope ranging from 10 to 20 degrees. The highest inclination exceeds 30 degrees in the area of Oboźna Street and the Old Town. In the synthetic monograph prepared under the supervision of Wysokiński [32], the following geological areas were distinguished:
-
Areas with active slope processes (with the simultaneous lack of structural predisposition to the formation of large landslides);
-
Areas with low or periodic slope activity (with a predisposition to the formation of landslides);
-
Areas with no traces of slope activity (determined by the structural predisposition for the formation of landslides).
In general, it can be stated that the status quo of development is maintained, which can be changed by periodically activated slope activity. However, the aforementioned classification does not apply in the areas where soil creeping processes are observed [30,32].
Due to the complexity of the spatial structure of the Warsaw Slope (Figure 2), classic methods based on locating the most favourable slip zones may not be accurate. Mechanistic optimisation related to the assumption of quasi homogeneity of the ground is difficult to accept. After all, the assumption stating that structurally conditioned slip surfaces are major factors in initiating and developing landslide processes is widely accepted. In the case of the Warsaw Slope, these circumstances can occur as a result of glacitectonic deformations of the Poznań clay formation, located in close proximity to the slope. Therefore, the cause of groundmass movements observed on various sections of the slope is often difficult to determine.
On this account, it is necessary to quantify the influence that clay roof deformations have on the stability of the slope. The location of the clay stratum noted in the drilling profiles varies significantly, which is documented in both cross section and map interpretations. Created images are highly dependent on the density of documented boreholes and on the methods of generalising the obtained information [30]. In earlier studies, the border of the clay formation was often captured as a mildly collapsing line parallel to the upland’s slope. At the same time, the clay formation collateral to the edge of the upland is built of folds of various heights that create local elevations. The complexity of geological structure is determined by plastic, form-like deformations of clay, caused by the base of a dynamically moving ice sheet.
The denivelations of the clay roof are locally extensively documented (e.g., in the vicinity of the Świętokrzyska metro station [31,35]). Such situations may occur along the entire slope. For example, the illustrative cross section in the area of Dworkowa Street—about 2 km southward of the analysed area—and Sarmacka Street [36] shows a noticeable uplift of the clay stratum, the upper part of which lies in close vicinity of the upland’s slope. The insight on mechanisms of multiplicative folds, along with the growing number of boreholes drilled in the intensively developed areas of Śródmieście and Mokotów districts, indicate that much more local, small elevations occur in the area. Data from newly drilled boreholes are successively added to the databases, making the image of the geological structure in the area more diverse and real. In this case, it is necessary to use geophysical methods, the possibilities of which, however, are hindered in urban areas by the presence of underground infrastructure interfering with the recorded fields.
An example of implementing geophysical prospection is the electrical resistivity tomography that was used to track the disturbances of the clay roof in the area of Piękna and Lenona streets in Warsaw.

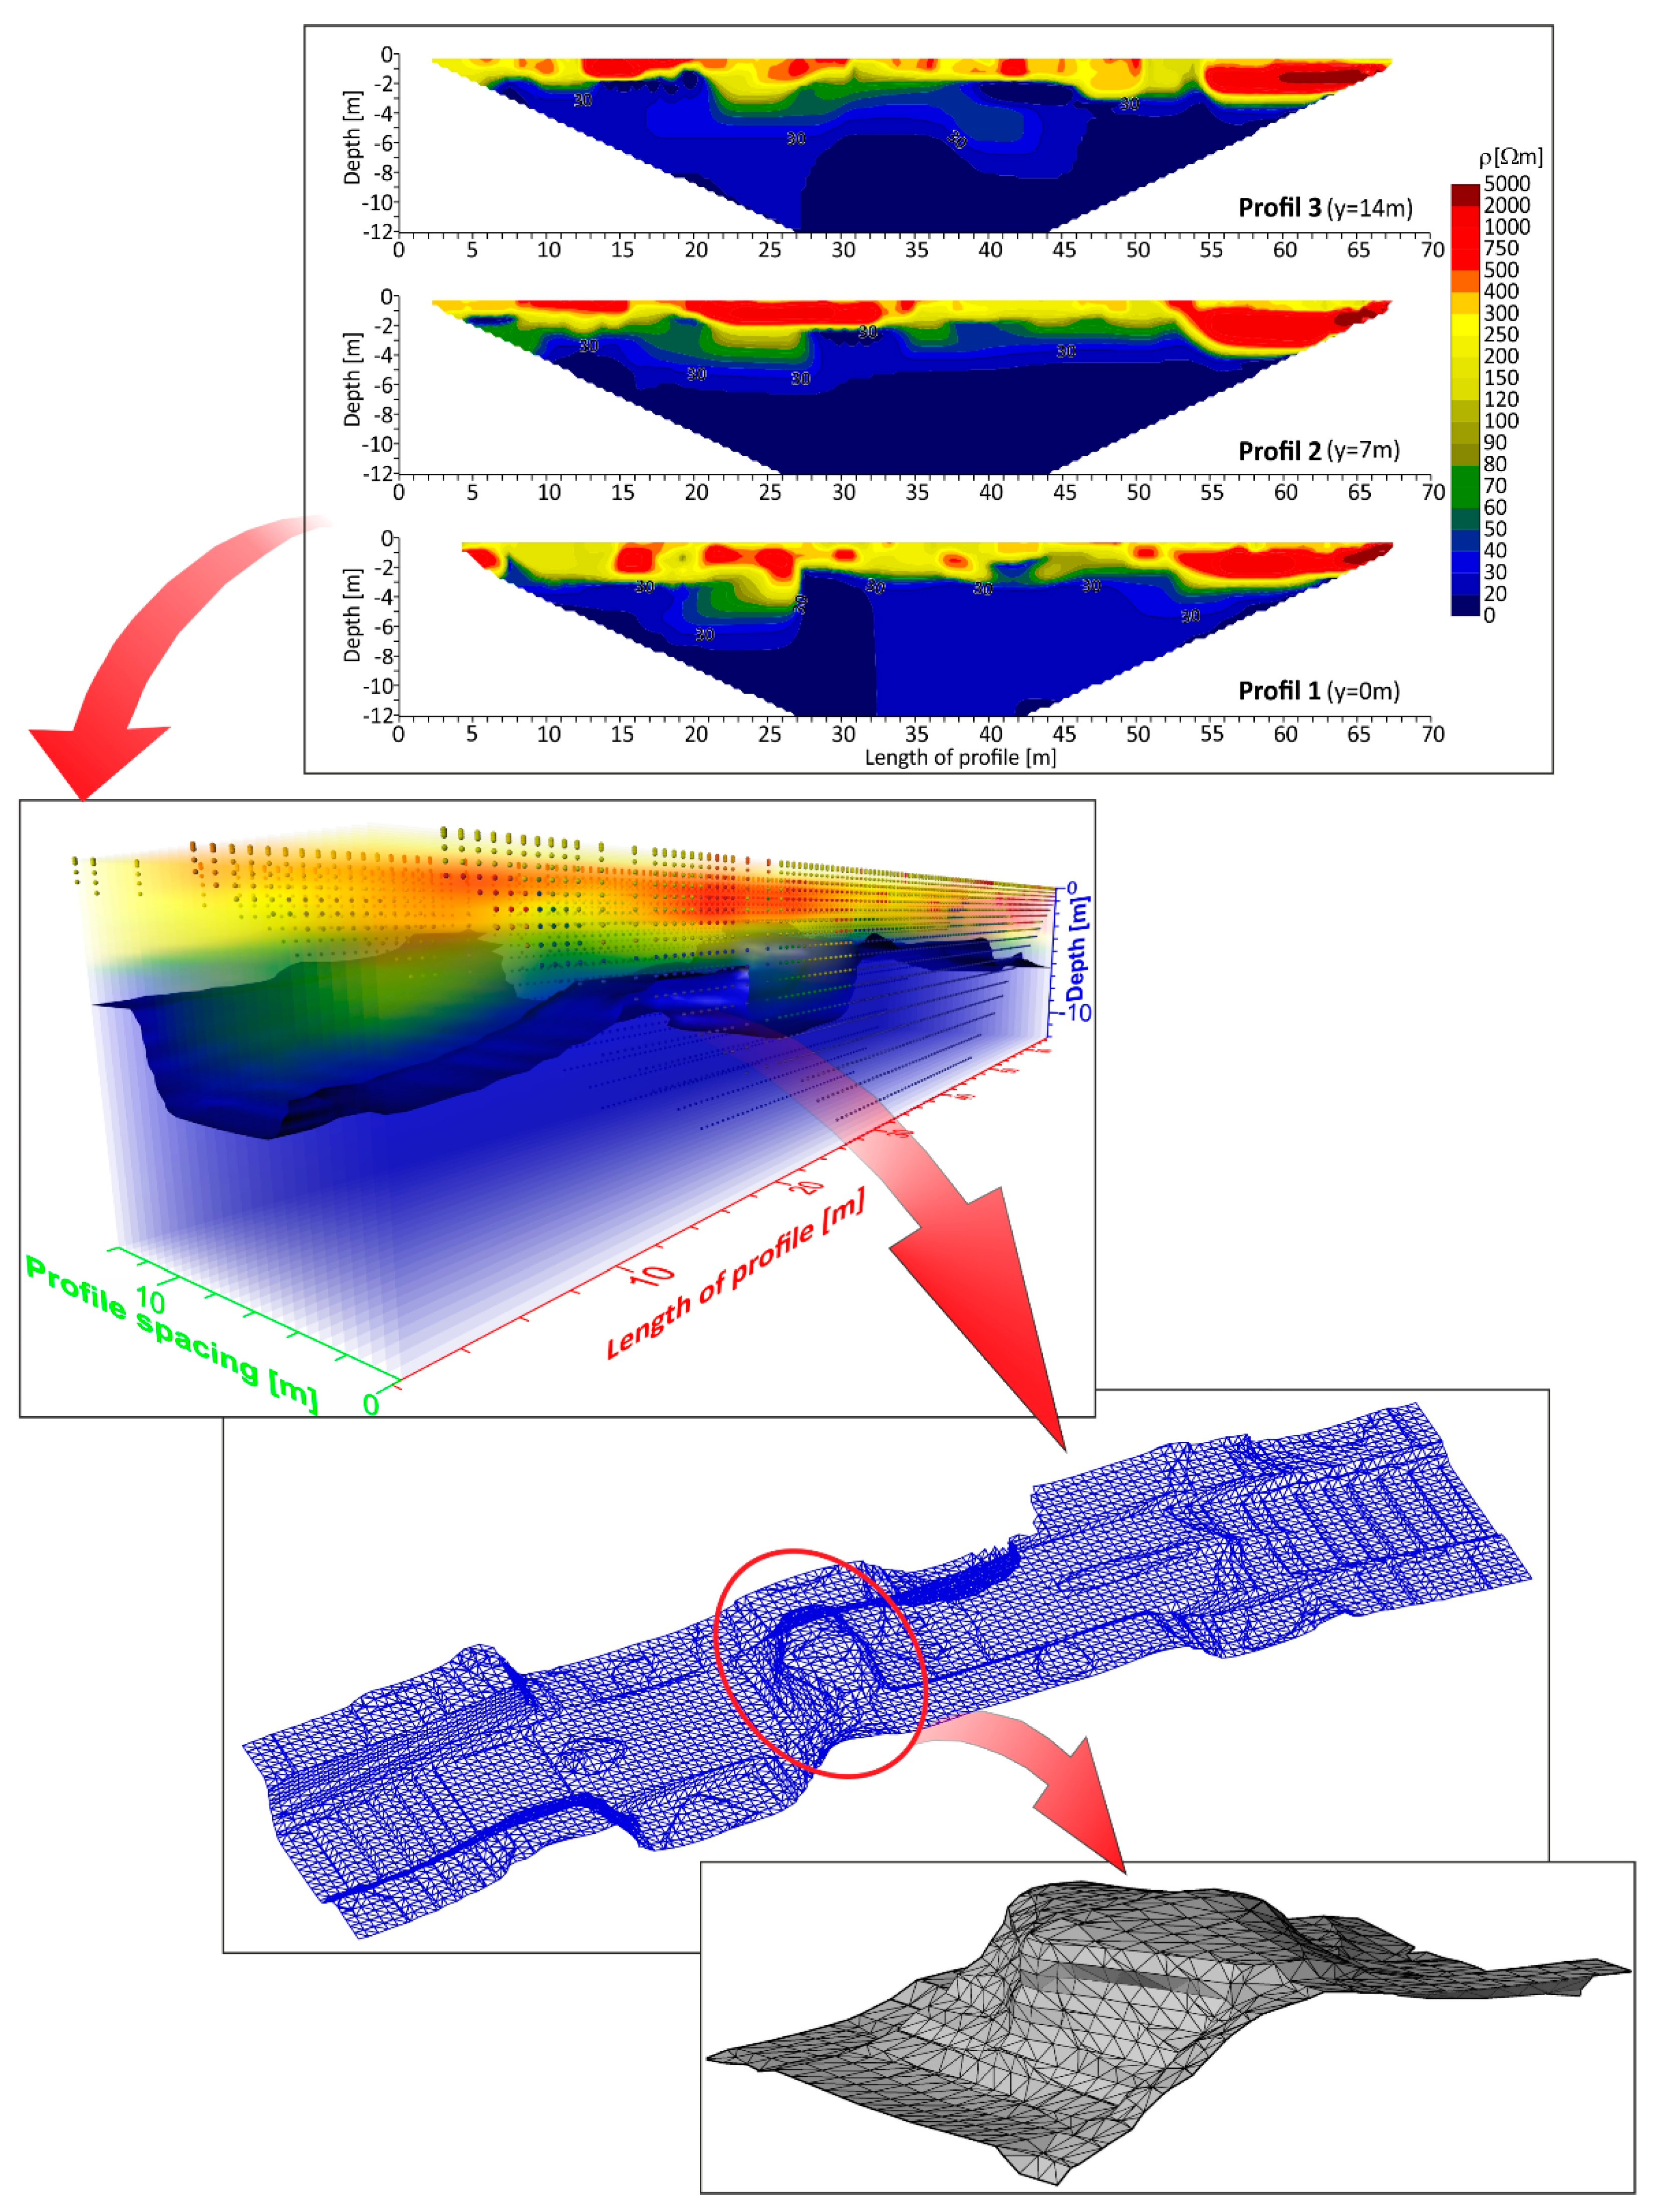
3. Local Estimation of the Clay Roof Relief Based on Electrical Resistivity Prospection

ERI measurements were made with the Terrameter LS apparatus of the Swedish company ABEM, alongside three 70 m long measurement lines with 7 m intervals. The spacing of the electrodes on each of the lines was 1 m. Measurements were made by a gradient array with multiple current–electrode combinations, which yields solid outcomes when recognising/mapping horizontal variability [37]. Apparent resistivity data obtained from field measurements were processed with the Res2DInv software [38]. Acquired two-dimensional resistivity models of the surface level of the geological medium were used to perform the 3D interpretation in the Voxler program (Figure 3).
The determination of the top surface of the Neogene clays was the primary task for the ERI measurements. The location of the relief of the Neogene clay formation roof was assumed on the basis of the iso-resistivity line of 30 Ωm. Resistivity values below 30 Ωm are the most common resistivity values for clays in Poland [39]. In the Warsaw city region, the juxtaposition of borehole profiles with the distribution of low resistivity values shows that Neogene clays are assigned to soils with electrical resistivity value below 30 Ωm [9,13,40].
The results of the resistivity distribution in the study area were related to geological data from archive boreholes. Such an approach reduced uncertainty of interpretation and increased confidence in placing borders interpreted on the basis of resistivity distribution. Over the Neogene clays (resistivity below 30 Ωm), there is a layer of glacial till, with resistivity from 30 to 80 Ωm. Just above tills, there is a near-surface layer of high resistivity, with resistivity ranging from 80 to over 5000 Ωm. It can be identified as fluvioglacial sands or human-made soils. In this case, electrical resistivity tests do not allow for the differentiation of those deposits and the placement of clear borders between them.

4. Stability Analysis Results, Their Interpretation, and Discussion

The tests carried out by the ERI in the area of Piękna Street in Warsaw showed a local disturbance of the clay complex roof surface. The relative height of the displacement was determined on the basis of the iso-resistivity line of 30 Ωm and was about 3.5 m. The width of the base of the structure in the direction perpendicular to the slope was estimated at 7.5 m. As a result, the inclination of the Warsaw Slope reached 50 degrees in some places. The interpretation of the 3D ERI in the geophysical image indicates that the considered form of the roof surface had a local character. From a broader analysis of the geological area complexity, it can be assumed that underneath the base of the slope, a dike-like form parallel to the edge of the upland structure occurs. The obtained results were processed in the AutoCAD software and presented in the form of electrical resistivity distribution as a large-scale surface model (Figure 3).
The next stage of assessing the impact of clay roof surface deformation on the stability conditions in the slope area was the preparation of the upper-layer stratum sequence model. The architecture of the identified form was projected in the spatial model with a geometric approximation. Basic attributes such as the relative height, width, and slope gradient were maintained.

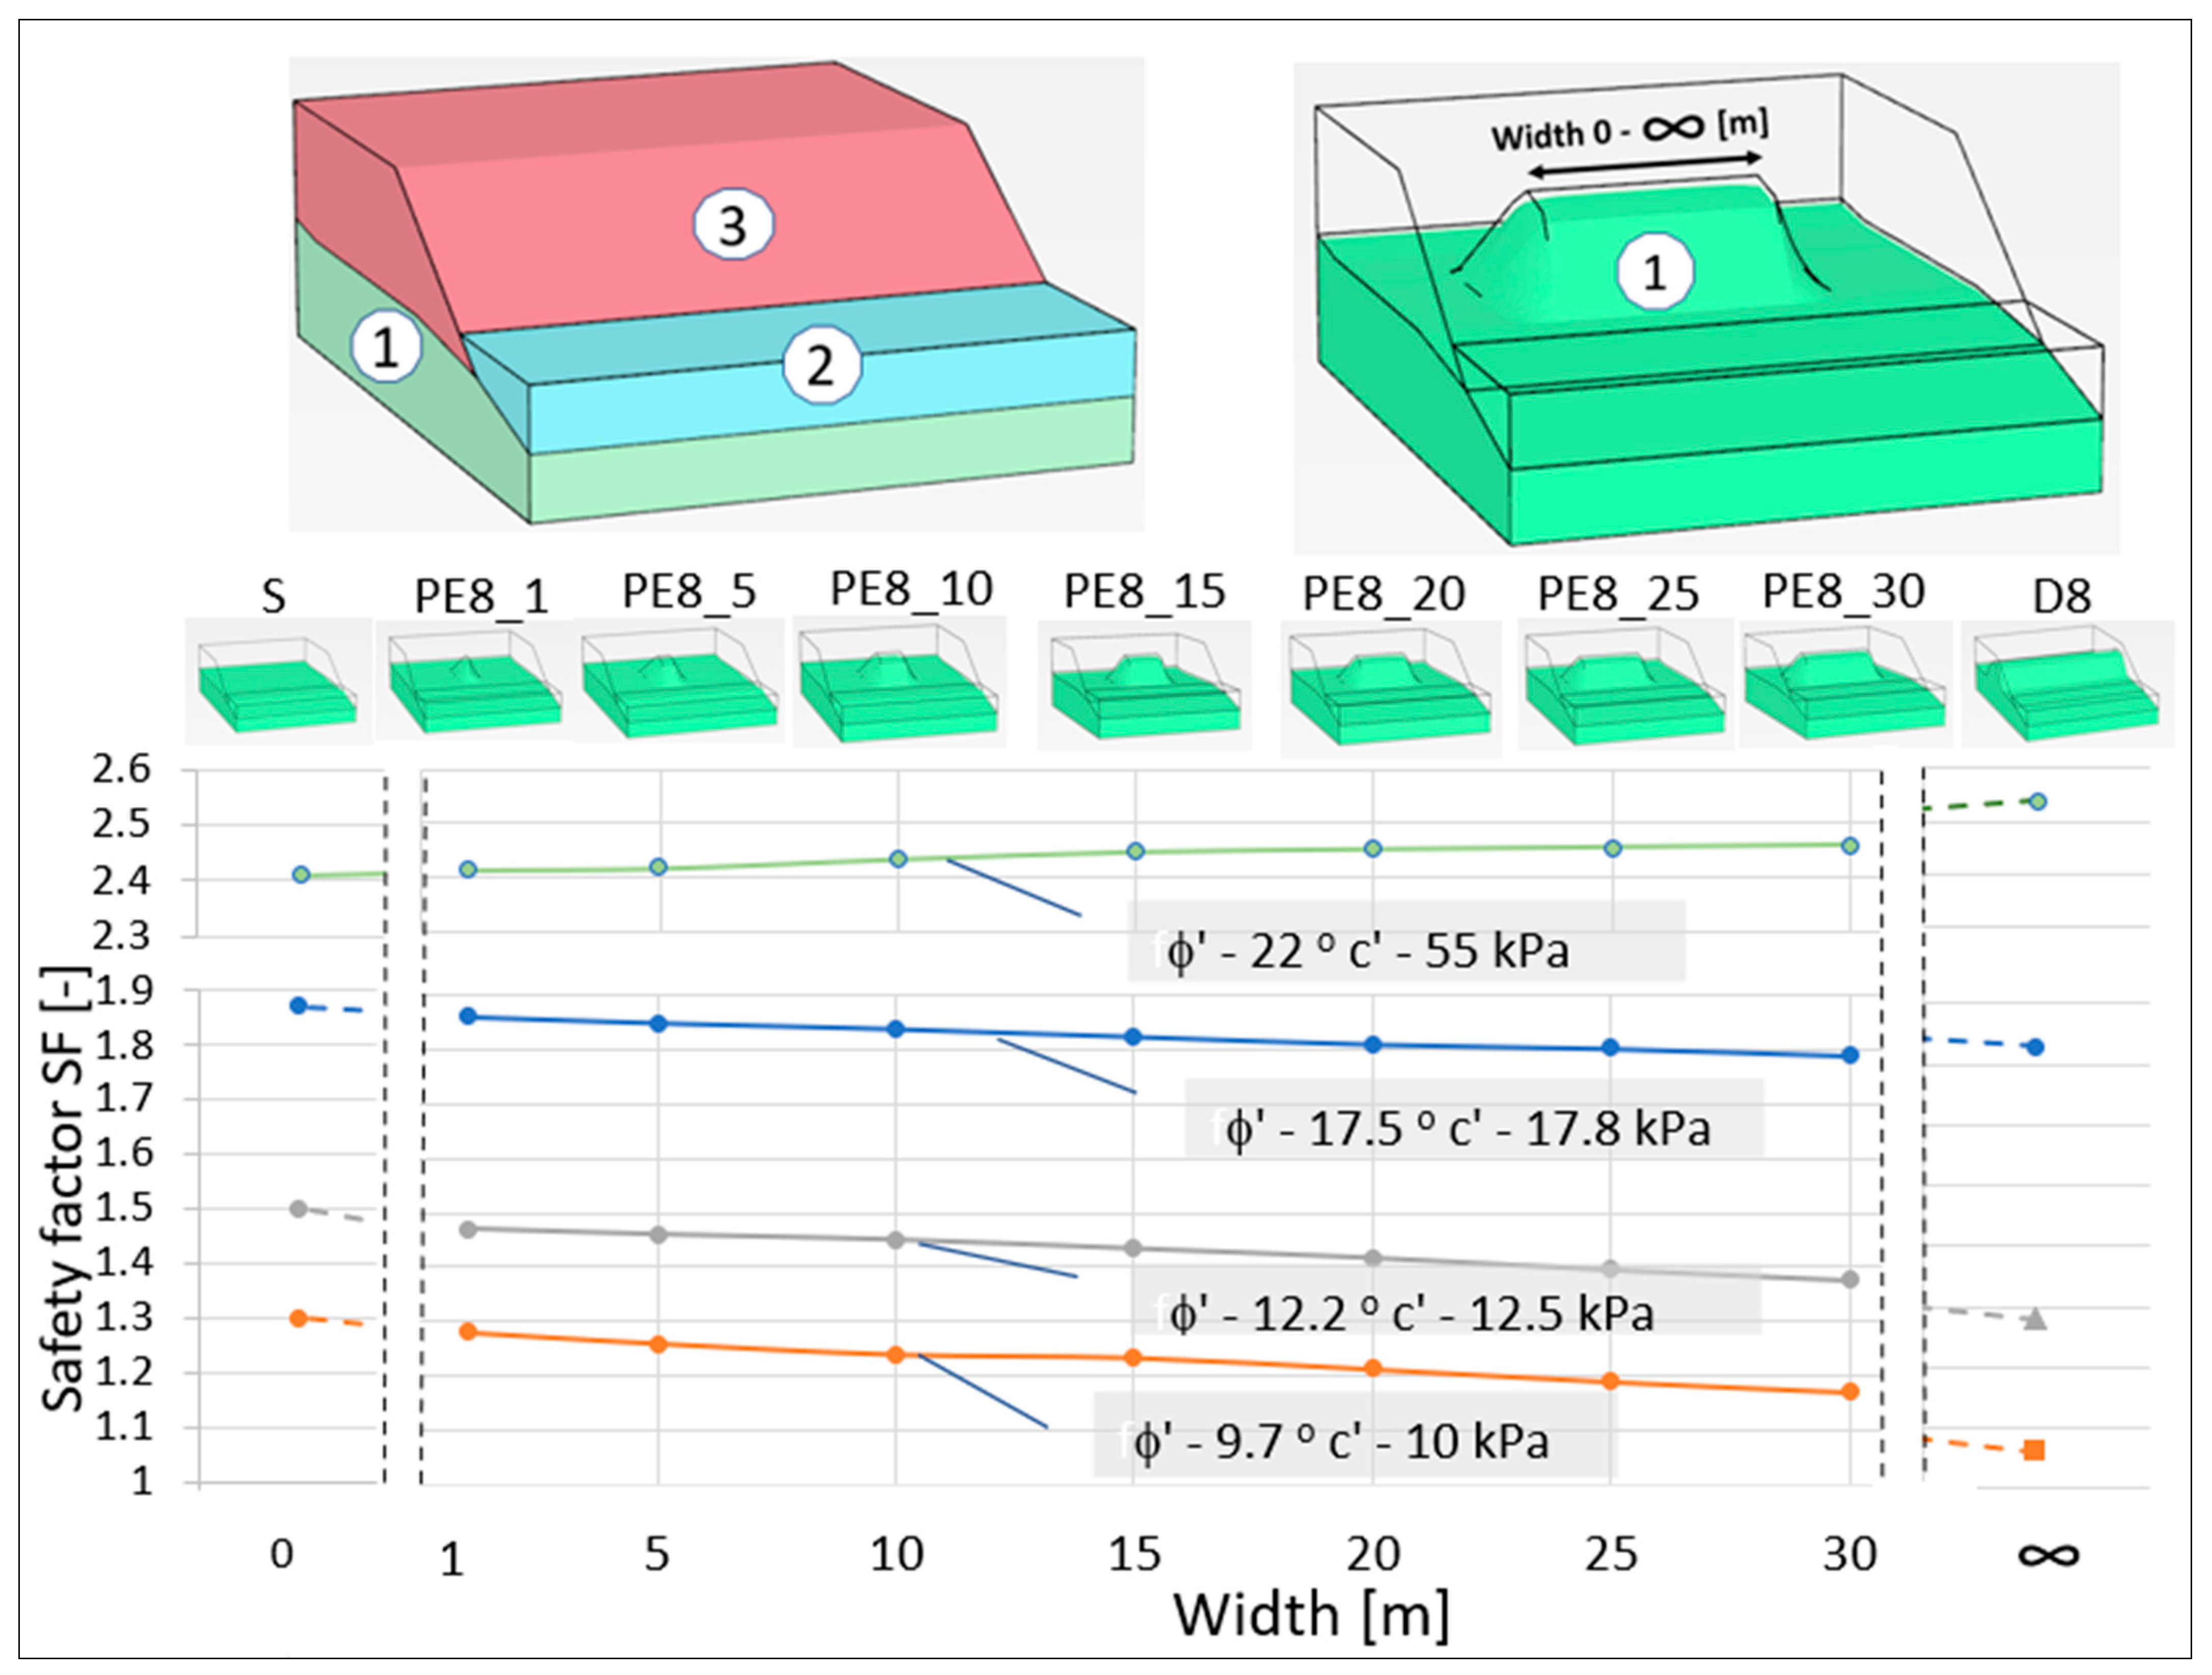
4.1. Stability Analysis by 3D Modelling

The investigated form is a disturbance with restricted spread, and therefore, the created solid model does not meet the criteria of plane strain analysis. Therefore, it proved necessary to perform a stability analysis, taking into account the three-dimensional stress analysis. In the first stage of the analysis, two generalised solid models were compared:
-
Local elevation limited in the plan (3D analysis);
-
Dike-like form (reduced to the 2D analysis).
In the calculation model used, the following was applied:
-
Parameters of the strength of the soil medium based on the elastic–plastic constitutive Mohr–Coulomb model;
-
The optional shape of the roof surface of Neogene clays.
In the stability calculations, variant values of the geotechnical parameters of clays were assumed, based on the results obtained on own research (from the analysed area adjacent to the slope) and literature data taking into account the glacitectonic disturbance of the structure [30,41,42].
As a starting point in computational iterations, the following assumptions were made:
  • For non-glacitectonically disturbed layers, the maximum values of ϕ’ and c’ were used based on archival data [41,42];
  • For glacitectonically disturbed layers,
    -
    Archival cohesion values were reduced by 60% [42];
    -
    Values of ϕ’ and c’ from TRX investigations; for soils showing the effects of structural disintegration, a reduction of 30% to 45% of the cohesion value and 10% to 30% of the angle of internal friction were applied [41,42];
    -
    Values of ϕ’ and c’ from creep TRX’s tests [30].
Section 4.2 presents the parameter value options used in the stability calculations in the following ranges: ϕ’ = 9.7°–22°; c’ = 0–55 kPa.
The calculations were made with the following spatial assumptions: generally flat clay roof surface slightly inclined towards the slope (option S), which may include
-
Point elevation with heights of 3.5 and 8 m (options PE3.5 and PE8);
-
Parallel to the edge of the slope, a dike-like form disturbance with a height of 8 m (D8).
Option PE3.5 refers to the results of the local geophysical investigation, while the alternative variants represent other common types of geological settings found along the Warsaw Slope (Figure 2).
The results of the SF stability factor calculations in options S and PE3.5 were similar (SF(S) = 1.80; SF(PE3.5) = 1.83), which indicates the marginal impact of the 3.5 m disturbance on the slope stability.
In order to assess the impact of the disturbance size on the slope stability, the dike relative height was increased (up to 8 m) while maintaining the previous inclination. In this configuration, 7 options (PE8_1-PE8_30) differing in the extent of the disturbance (Figure 4) from 1 to 30 m, with an interval of 5 m, were analysed.
As a result, depending on the assumed strength parameters of the soil, the presence of disturbance in the clay roof surface over 20 m wide resulted in a reduction in the stability index by 3 to 7%m in comparison with option S. The greater presence of clays in the slip zone is a possible reason. The greatest decrease in the SF was observed with ϕ’=9.7° and c’ = 10.0 kPa—the maximally reduced strength parameters of the clay. With the use of the maximum strength parameters (ϕ’—22° and c’—55 kPa), despite the presence of a disturbance in the clay roof surface, an enhancement in the stability conditions was achieved in relation to the S variant. The reason for the modelled slope strengthening was the fact that the assumed clay strength parameters were higher than those of the overlying glacial tills. The numerical simulations of the D8 option were carried out for 4 variants of the strength parameters of Neogene clays while maintaining the parameters of the remaining layers unchanged.
In further analysis, the results of stability modelling at point elevations, the width of which did not exceed 10 m (variant: PE8_10), were compared with the dike-like elevations. The sensitivity of models with an alternative method of shaping the clay roof surface depends on the considered ranges of strength parameters. The smallest difference in SF, amounting to approx. 6%, was observed for the clay parameters specified in TRX research. On the other hand, the largest difference in the stability indexes, amounting to 14%, was related to the variant taking into account the maximum reduced parameters of the clay (ϕ’ = 9.7° and c’ = 10 kPa). It should be emphasised that in each of the analysed variants, the slope stability with the dike elevation was lower than that of the slope with a point elevation of the clay roof surface in the basement. This allows the conclusion that the dike elevations provide an additional safety margin in relation to the point elevation models. Thus, it justifies simplifying the calculations for the plane strain analysis model, which provides an additional safety margin.

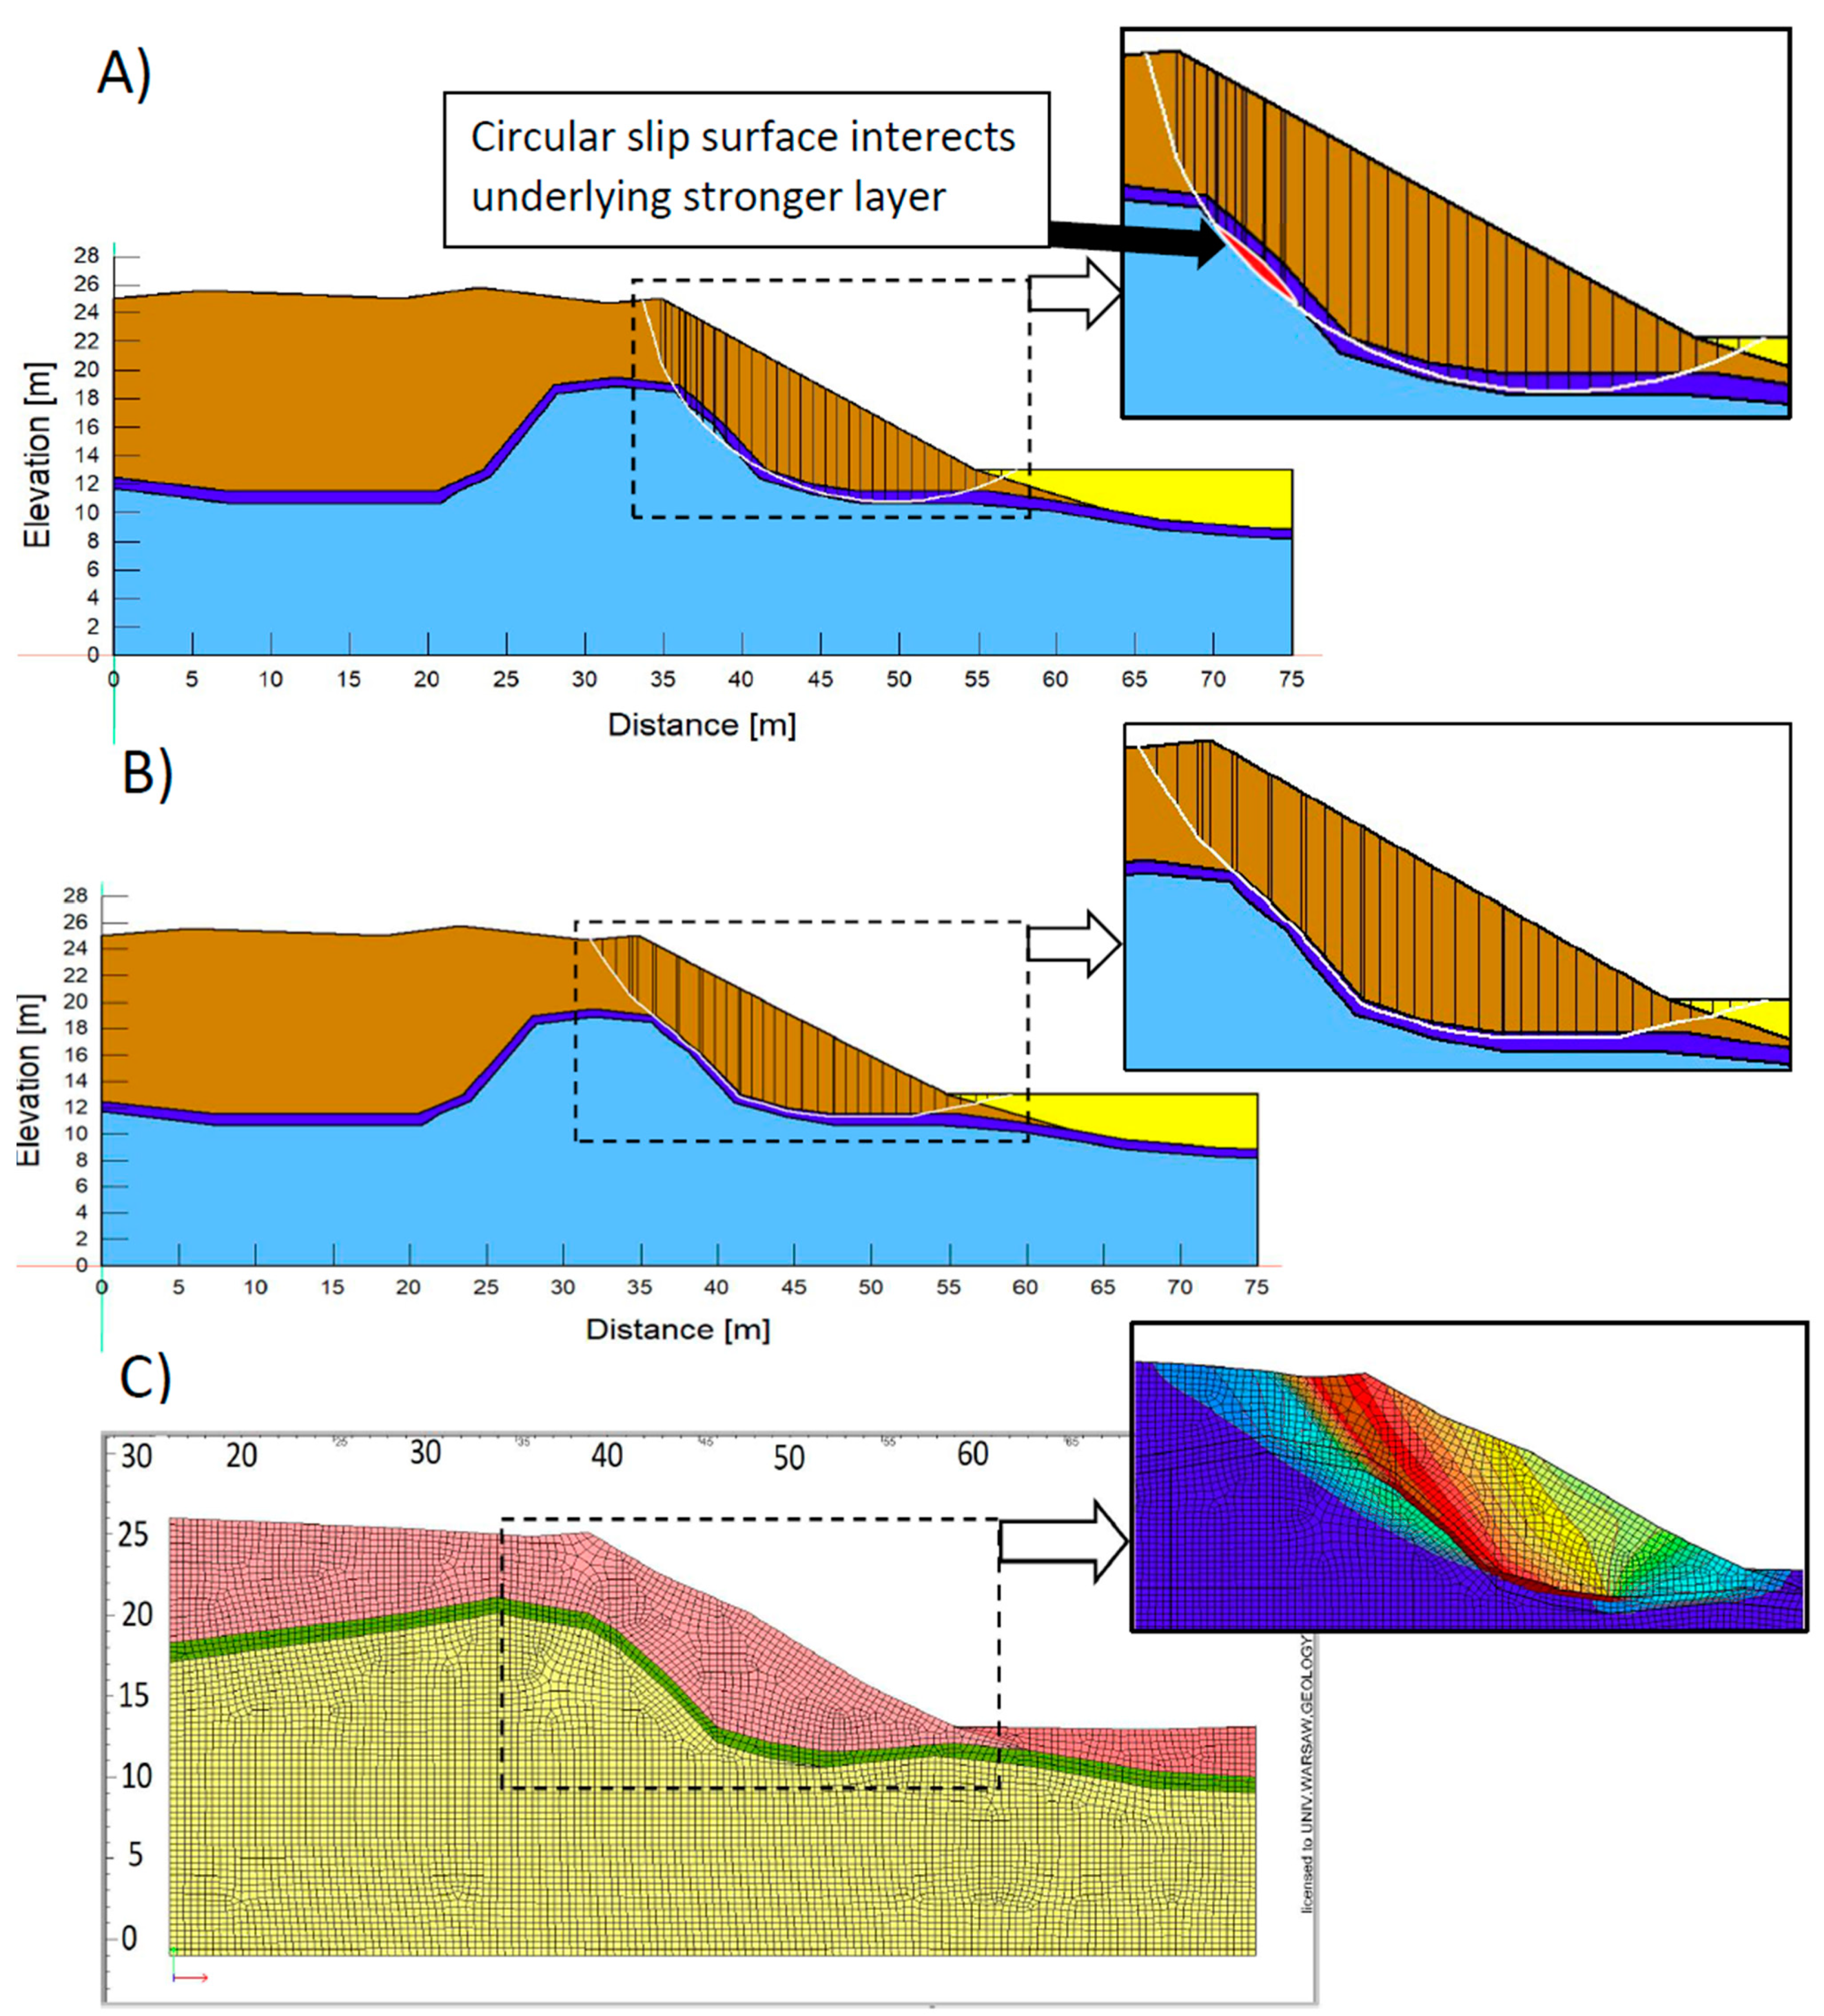
4.2. Stability Analysis by 2D Model (Plane Strain State)

The implementation of calculations in the plane deformation state allowed for additional comparative analyses using the limit equilibrium method (LEM), well established in engineering practice, and the 2D finite element method (FEM). Calculations made in a 2D environment require less computing power, compared with 3D systems.
The simplified Bishop method and the Janbu method were used in the LEM analysis. The simplified Bishop method is a strip method that does not take into account the vertical interaction forces between the stripes and the equilibrium condition of the horizontal forces. In the assumptions, it requires an approximation of the slip surface with a segment of a circle. Despite all these simplifications, it is very often used in practice and, in most cases, sufficient for the initial assessment of slope stability. The obtained estimation of the stability coefficient using this method does not differ from the accuracy obtained by more advanced methods such as the Morgenstern–Price method or the Spencer method [43].
The application of the circular slip surface method is possible mainly in the assessment of the stability of homogeneous structures or a horizontal arrangement of layers. In the case of soil with an inclined layer system or with a complicated course of layers, as in the analysed case, the use of this method may overestimate stability assessments. This fact is largely due to the mismatch between the idealised circular slip surface and the surface produced by the contact of inclined or folded layers. The aforementioned situation occurred in the analysed model. The wrinkled clay roof surface had the potential to initiate a slip. The complexity of the real surface relief, diverging from the cylindrical surface required in Bishop’s method, resulted in a reduction in the accuracy of the safety factor estimation.
In the course of computational analyses, four models that differed in the size of the aforementioned discrepancies (caused by structural disturbances) were created. The initial relative height in the analyses of 3.5 m was increased optionally to 5, 6.5, and 8 m. This resulted in, inter alia, changes in the share of clay in the slip zone.
In the considered spatial models, the relief of the disturbed clay roof surface allowed only an approximate fit of the circular slip surface, which also intersected the underlying layers with higher parameters (Figure 5A). This situation had a direct impact on the result of the stability assessment and resulted in its overestimation. In order to assess the size of this overestimation, the results from Bishop’s method were compared with the Janbu method, in which the shape of the slip line was adjusted to geological conditions. As a result, stability was analysed even with a more complex, broken slip surface, the course of which was adapted to the contact zone of soils of different genesis and properties (Figure 5B).
The FEM 2D analysis was carried out by ZSoil 2016 software. Geometric assumptions were identical as in the case of the LEM method (Figure 5C). As in the case of 3D analysis, the elastic–plastic constitutive Mohr–Coulomb model was also used to describe the behaviour of the soil medium.
In the plane strain analyses (LEM and FEM 2D), the thickness of the top layer of the clay complex was changed by 1 m relative to the set of parameters previously used in the 3D analysis. Calculation models were extended by several sets of strength parameters to assess their sensitivity and possible parameter changes. In total, 8 variants with different parameters of the clay layer were analysed. Additionally, the models differentiated the strength parameters of the deeper clay layer (non-weathered/non-disturbed) using 3 sets of parameters. The first corresponded to the parameters of the clay from the area of ul. Piękna [30], the second matched a glacitectonically disturbed clay [42], and the third matched the maximum documented strength parameters of these soils [42]. Parameter combination of the top clay and the deeper layers created 24 calculation variants. Results, in the form of a safety factor (SF), are summarised in Figure 6.
Analysis of the obtained results indicated that in the Janbu method, differentiating the parameters of the clay layer below the weakened layer did not affect the SF value. In the case of FEM 2D modelling, the influence was also marginal, but with the application of the simplified Bishop method, change was significant. The reason for this is that the slip surface in the Bishop method passed through the deeper layer, while in the Janbu and FEM 2D method, it was limited to the weakened layer only. The FEM 2D modelling indicated a loss in slope stability with the maximally reduced value of the clay strength parameters in all analysed calculation variants. Convergent results were also obtained using the Janbu method but only for the variant taking into account the maximum assumed height of the disturbance (8 m). In other computational cases, despite the disturbance, the slope was stable.
The multivariate analysis of geometric factors and optional strength characteristics allowed presenting the three-dimensional dependencies of SF on the value of the internal friction angle and cohesion (Figure 7). They were mapped in the form of several surfaces corresponding to the different calculation methods used. In addition to the 2D modelling outcome, the results of the 3D FEM are presented. Different sensitivity of individual slope stability calculation methods to changes in strength properties of soils is represented by different inclinations of these surfaces. This influence was best seen in the Janbu method and 2D FEM modelling. Thus, concerning the Janbu method, the great importance of the real relief of the slip surface structural predispositions for the results of stability prediction could be observed. At the same time, the Janbu method obtained the relatively lowest SF values, making it possible to recommend this method as the safest method for geodynamic forecasting.
The SF values obtained by 3D FEM modelling deviate from the results of other methods. In the range of low clay internal friction angle (9–11°), values of SF were comparable to the results obtained by the Bishop method. However, for ϕ’ values above 12°, the SF results were the highest of all the methods used. By assumption, the results of 3D modelling illustrate the natural geological situation better, especially taking into account the weaknesses in the slope [20]. Further, the 3D modelling outcomes differed from the results of 2D calculations. The SF values obtained in the 2D model were lower than the results of 3D modelling. The reason for the higher value of SF estimates may be the application of 3D models with a reduced density of the finite element mesh compared with the 2D variant. The increase in the finite element density causes a decrease in the predicted slope stability index value [26,27]. Without deciding which approach is closer to the real equilibrium state, it is worth noting that the consideration of lower estimated SF value by designers is treated as a safer procedure.

5. Conclusions

  • Structurally complex soil conditions in the area of the upland slopes (especially considering glacitectonic disturbances) require optional stability analyses, which take into account both the spatial variability of the soil structure and the variability of soil strength parameters.
  • For a more precise recognition of the spatial variability of the position of the soil layers, it is recommended to use quasi-3D electrical resistivity imaging (ERI; the so-called 2.5D electrical resistivity imaging). This method is necessary to obtain a ‘continuous’ image of the course of the disturbed roof of key structural surface (clays), which can determine the conditions of the equilibrium state of slopes, deep excavations, etc.
  • Identification of the Neogene clay elevation with the ERI method made performing a multivariant stability analysis possible. The results of the analysis allowed the determination of nomograms defining changes in SF depending on c’ and ϕ’.
  • The variability of soil properties caused by exogenous factors, in particular in the weak zones (e.g., on the clay roof), resulted in an alternation of strength parameters of the soil, which may change over time. For this reason, the use of parametric sensitivity analyses of computational models is recommended.
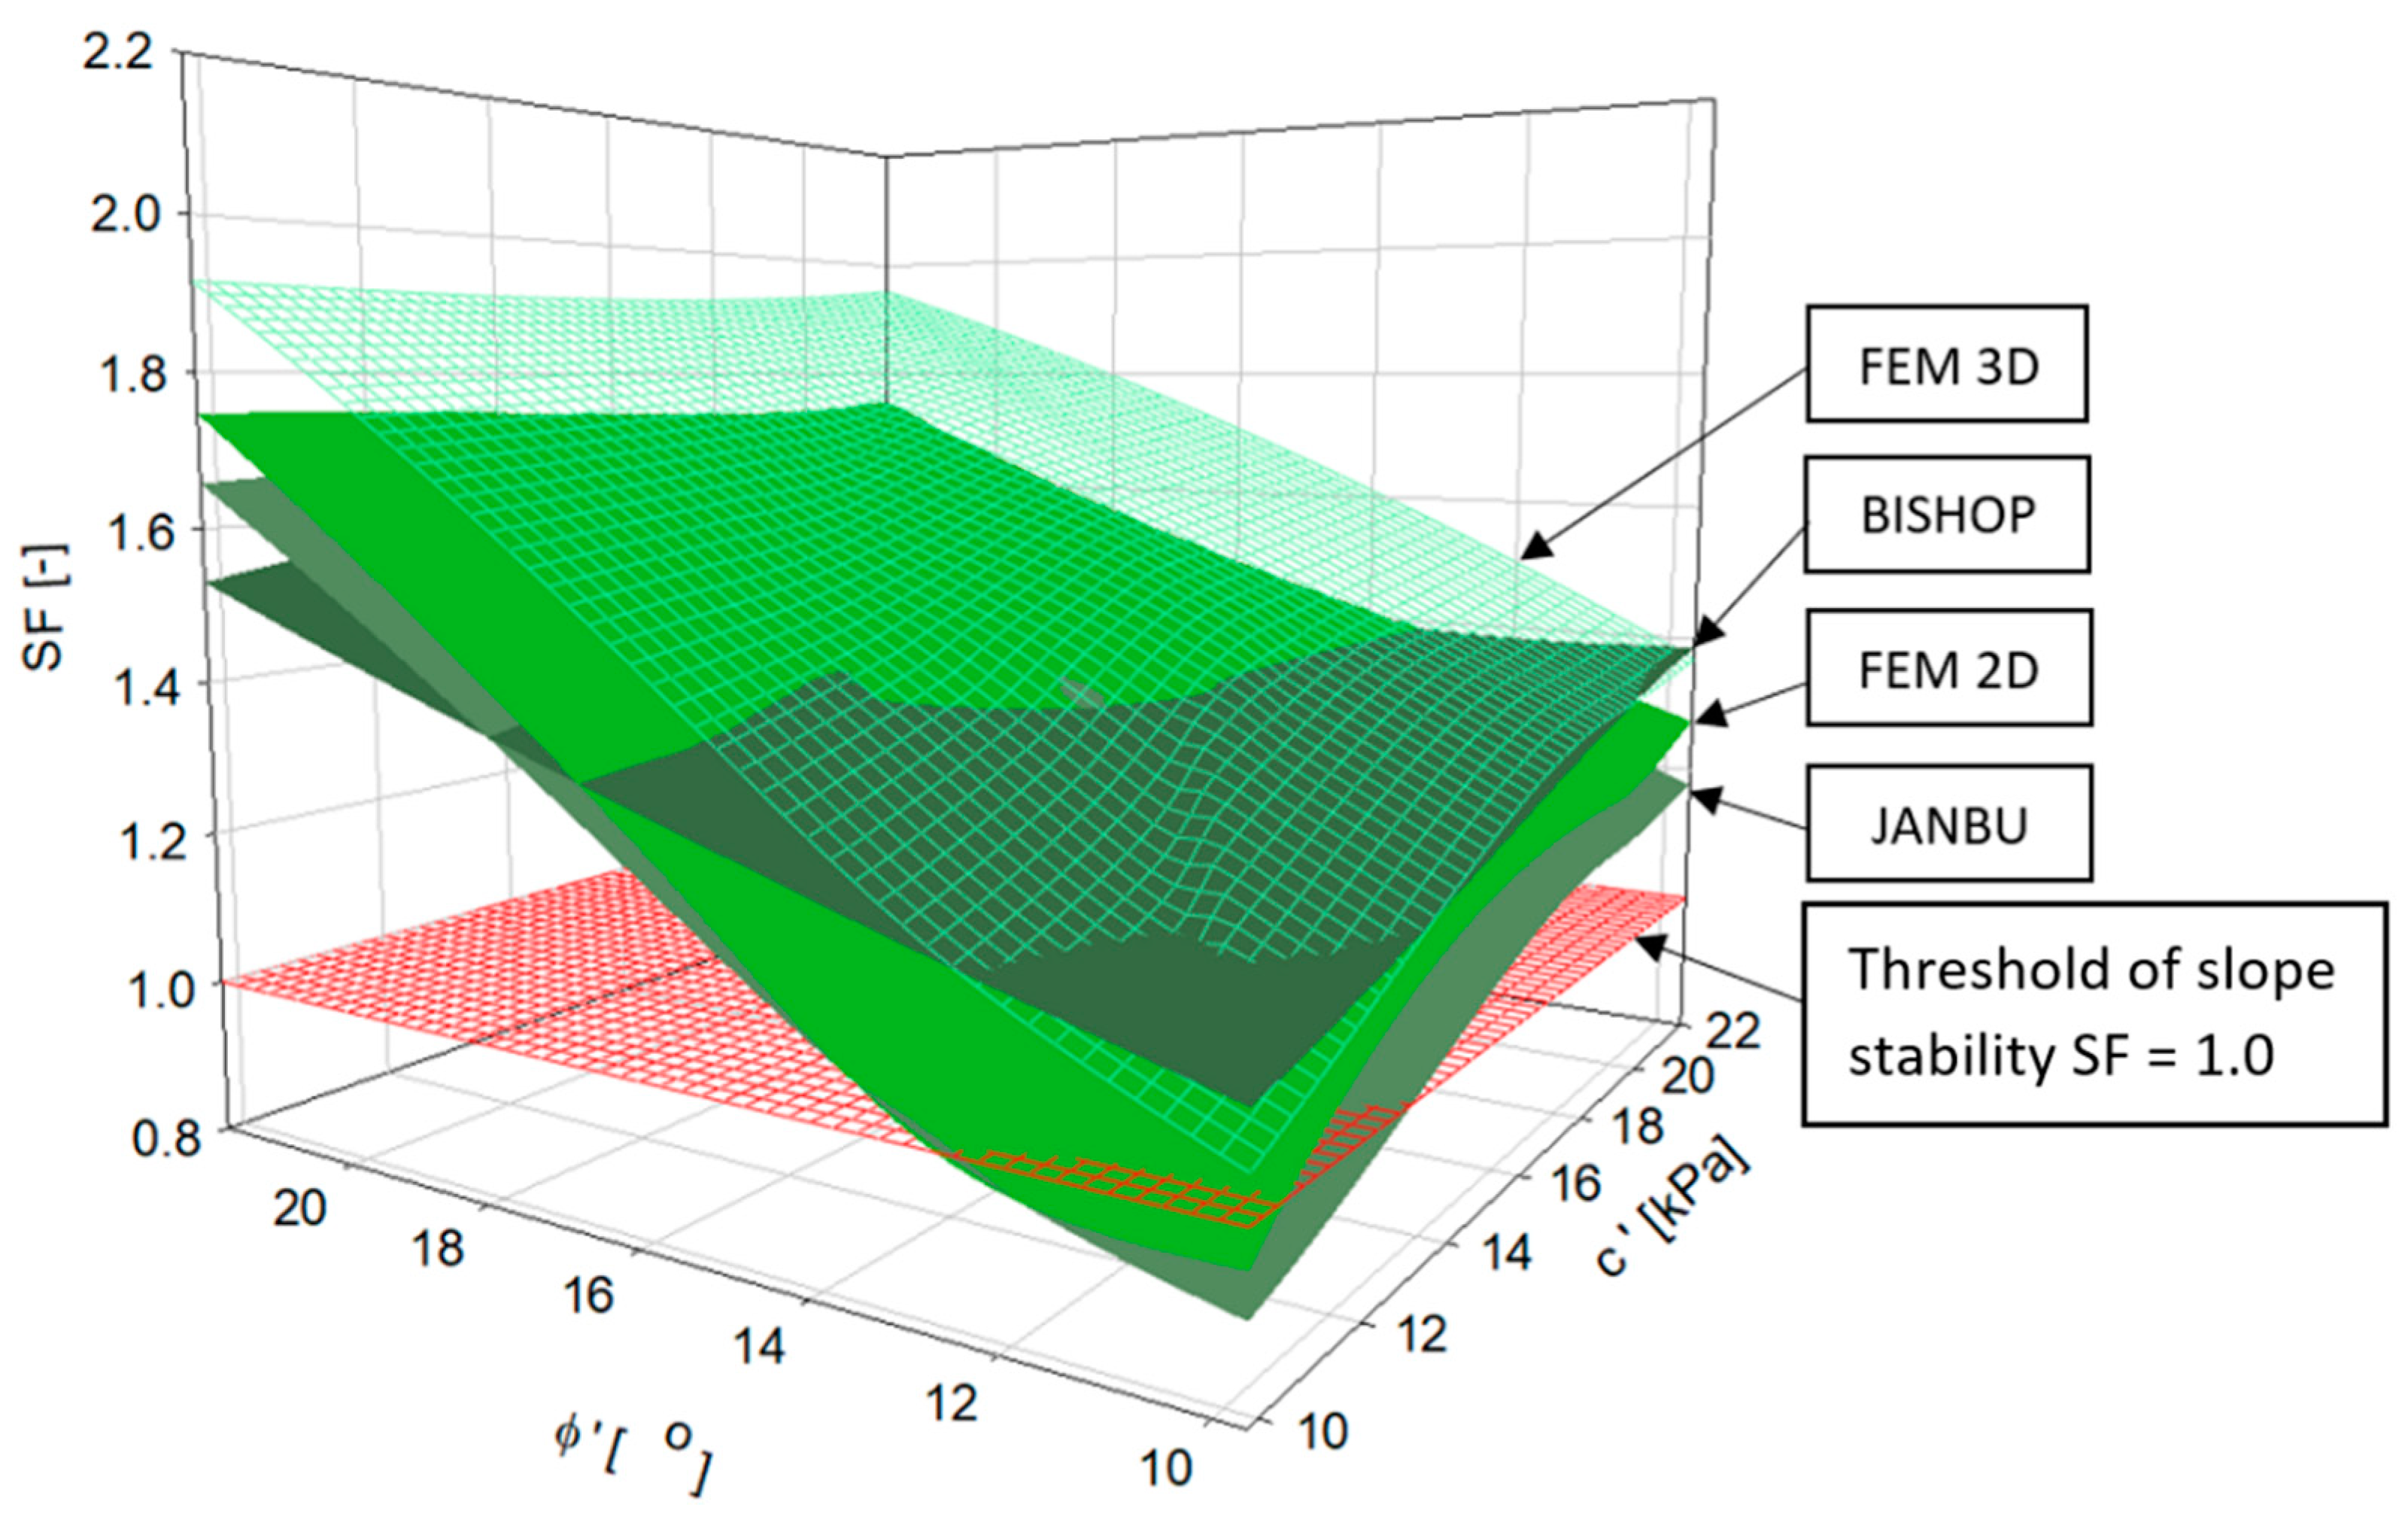
  • The analysed models indicated that the Neogene clay elevations were the main factor influencing the stability of the massif in the slope area. Changes in soils’ strength parameters were the secondary factor in modifying the structural factors of stability. For example, according to applied models, changes in the strength parameters in the range of ϕ’ ± 5°; c’ ± 5 kPa resulted in changes of SF ± 0.2. The value of internal friction angle was a more important factor influencing slope stability, as this parameter considerably depends on the stress state and indirectly on the geometry of the layers building the slope.
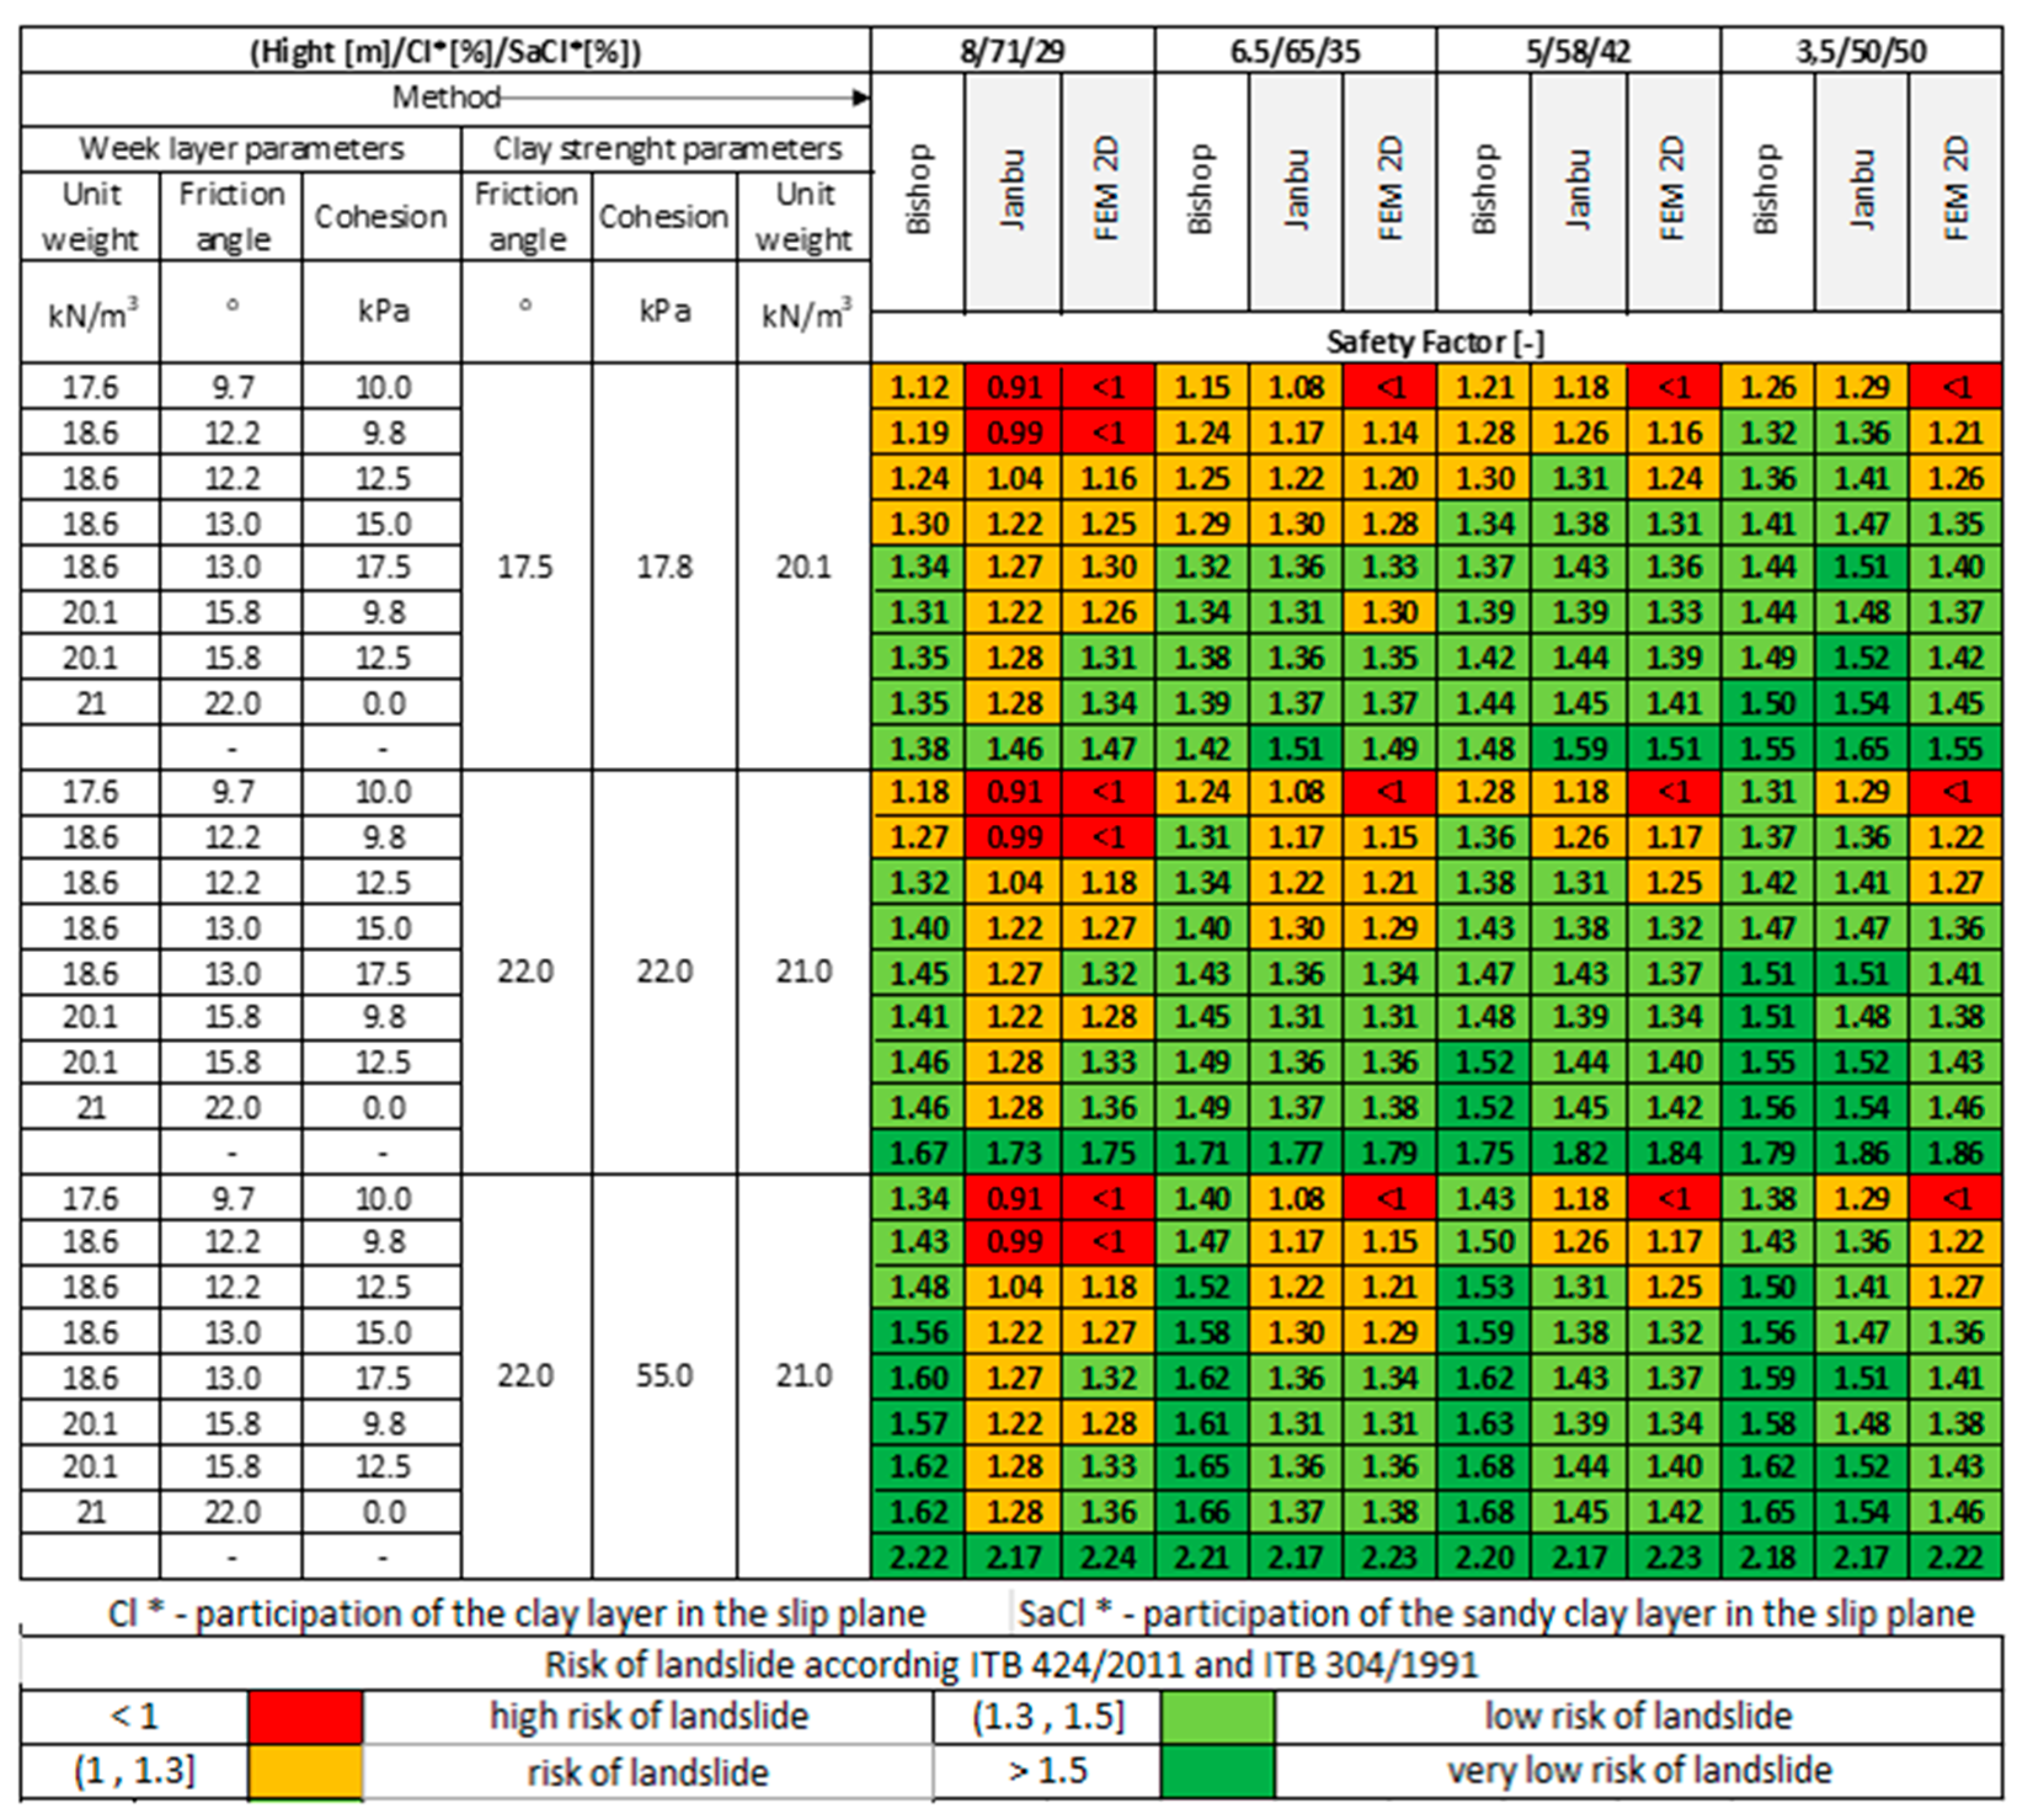
  • Stability predictions quite significantly depend on the applied calculation techniques, both analytical methods based on the conditions of moment equilibrium (e.g., Bishop) or forces (e.g., Janbu) and modelling using the finite element method (FEM). In calculations of the stability conditions performed in this paper, the influence of the weak layer was taken into account. Both Janbu and FEM 2D methods produced similar results. The values of the SF index calculated by the Bishop and FEM 3D methods were higher than those obtained with the other methods. The overestimation of the stability value in the case of the Bishop method was related to the use of a circular-cylindrical slip surface, which did not coincide with the probable slip surface related to the course of the weak layer (e.g., the weathered roof of Neogene clays, which is a screen for seeping groundwater). In addition, the highest values of SF results in the FEM 3D method require further research.
  • The conducted analyses showed the necessity of mapping the structural conditioning of stability and the necessity of deliberate selection of modelling method that takes into account the variability of both geometric factors and strength characteristics. It was proven by the usefulness of the use of geophysical prospection, which enriches the point characteristics obtained from traditional ground exploration by drilling. Thus, local disturbances and their influence on changes in slope stability can be taken into account.

Author Contributions

Conceptualisation and design: K.K. and Ł.K.; literature review: Ł.K. and S.K.; methodology and validation: K.K., Ł.K., and S.K.; formal analysis: K.K., Ł.K., and S.K.; investigation and data collection: K.K., Ł.K., and S.K.; data analysis and interpretation: K.K., Ł.K., P.D., and S.K.; writing—original draft preparation: K.K., P.D., Ł.K., and S.K.; writing—review and editing: P.D., K.K., and Ł.K.; supervision: P.D. All authors have read and agreed to the published version of the manuscript.

Funding

This research was funded by the University of Warsaw.

Conflicts of Interest

The authors declare no conflict of interest.

References

  1. Carrión-Mero, P.; Briones-Bitar, J.; Morante-Carballo, F.; Stay-Coello, D.; Blanco-Torrens, R.; Berrezueta, E. Evaluation of Slope Stability in an Urban Area as a Basis for Territorial Planning: A Case Study. Appl. Sci. 2021, 11, 5013. [Google Scholar] [CrossRef]
  2. El Kechebour, B. Relation between stability of slope and the urban density: Case study. Procedia Eng. 2015, 114, 824–831. [Google Scholar] [CrossRef] [Green Version]
  3. Krawczyk, J.; Tkaczyk, A.M. Czwartorzędowe struktury rynnowe rejonu niecki wrocławskiej w świetle badań geofizycznych—elektrooporowych. Przegląd Geol. 1997, 45, 423–427. (In Polish) [Google Scholar]
  4. Flieger-Szymańska, M.; Filipiak, P. Geophysical prospection problems in determining the presence and boundaries of hydrogeological structures of buried valleys geoelectric method. Biul. Państwowego Inst. Geol. 2011, 445, 97–106, (In Polish with English summary). [Google Scholar]
  5. Słodkowska, B.; Gałązka, D. Paleogene and Neogene sediments in mega-scale glaciotectonic structures of the Dylewskie Hills. Biul. Państwowego Inst. Geol. 2015, 461, 251–294, (In Polish with English summary). [Google Scholar] [CrossRef]
  6. Pacanowski, G.; Sokołowska, M.; Mieszkowski, R. Geoelectrical imaging of complex geological structures of the Morasko Hill in Poznań. Przegląd Geol. 2016, 64, 238–244, (In Polish with English summary). [Google Scholar]
  7. Kowalczyk, S.; Cabalski, K.; Radzikowski, M.; Jędrzejewski, J. Application of electrical resistivity imaging to ground recognition of the Warsaw Southern Ring-Road. Przegląd Geol. 2017, 65, 772–778, (In Polish with English summary). [Google Scholar]
  8. Lech, M.; Skutnik, Z.; Bajda, M.; Markowska-Lech, K. Applications of Electrical Resistivity Surveys in Solving Selected Geotechnical and Environmental Problems. Appl. Sci. 2020, 10, 2263. [Google Scholar] [CrossRef] [Green Version]
  9. Kowalczyk, S.; Mieszkowski, R.; Pacanowski, G. The stability evaluation of Warsaw slope selected pieces based on Electrical Resistivity Tomography survey (ERT). Przegląd Geol. 2014, 62, 634–640. [Google Scholar]
  10. Bellanova, J.; Calamita, G.; Giocoli, A.; Luongo, R.; Macchiato, M.; Perrone, A.; Uhlemann, S.; Piscitelli, S. Electrical resistivity imaging for the characterization of the Montaguto landslide (southern Italy). Eng. Geol. 2018, 243, 272–281. [Google Scholar] [CrossRef] [Green Version]
  11. Hack, R. Geophysics For Slope Stability. Surv. Geophys. 2000, 21, 423–448. [Google Scholar] [CrossRef]
  12. Moradi, S.; Heinze, T.; Budler, J.; Gunatilake, T.; Kemna, A.; Huisman, J.A. Combining Site Characterization, Monitoring and Hydromechanical Modeling for Assessing Slope Stability. Land 2021, 10, 423. [Google Scholar] [CrossRef]
  13. Kaczmarek, Ł. Geomorphological and geophysical analysis of the Warsaw slope stability conditions in the Ursynów district. Sci. Rev. Eng. Env. Sci. 2014, 65, 215–226, (In Polish with English summary). [Google Scholar]
  14. Dahlin, T. The development of DC resistivity imaging techniques. Comput. Geosci. 2001, 27, 1019–1029. [Google Scholar] [CrossRef] [Green Version]
  15. Loke, M.H.; Chambers, J.E.; Rucker, D.F.; Kuras, O.; Wilkinson, P.B. Recent developments in the direct-current geoelectrical imaging method. J. Appl. Geophys. 2013, 95, 135–156. [Google Scholar] [CrossRef]
  16. Zhang, S.; Li, Y.; Li, J.; Liu, L. Reliability Analysis of Layered Soil Slopes Considering Different Spatial Autocorrelation Structures. Appl. Sci. 2020, 10, 4029. [Google Scholar] [CrossRef]
  17. Pirone, M.; Urciuoli, G. Analysis of slope-stabilising piles with the shear strength reduction technique. Comput. Geotech. 2018, 102, 238–251. [Google Scholar] [CrossRef]
  18. Azarafza, M.; Akgün, H.; Ghazifard, A.; Asghari-Kaljahi, E.; Rahnamarad, J.; Derakhshani, R. Discontinuous rock slope stability analysis by limit equilibrium approaches—A review. Int. J. Digit. Earth 2021, 1–24, ahead-of-print. [Google Scholar] [CrossRef]
  19. Tang, H.M.; Liu, X.; Xiong, C.R.; Wang, Z.Y.; Eldin, M. Proof of Nondeterministic Polynomial-Time Complete Problem for Soil Slope-Stability Evaluation. Int. J. Geomech. 2016, 16, 12. [Google Scholar] [CrossRef]
  20. Xia, Y.-X.; Cheng, P.; Liu, M.-M.; Hu, J. Numerical Modeling of 3D Slopes with Weak Zones by Random Field and Finite Elements. Appl. Sci. 2021, 11, 9852. [Google Scholar] [CrossRef]
  21. Peng, W.X.; Mo, J.J.; Xie, Y.J. Comparison for the Results from 2D and 3D Analysis for Slope Stability. Appl. Mech. Mater. 2011, 90, 255–259. [Google Scholar] [CrossRef]
  22. Fredlund, M.D.; Fredlund, D.G.; Ivkovic, Z.; Lu, H. Extending slope stability analysis to multi-plane 2D and 3D limit equilibrium approaches. In Proceedings of the 70th Canadian Geotechnical Conference GeoOttawa 2017, Ottawa, ON, Canada, 1–4 October 2017. [Google Scholar]
  23. Kaczmarek, Ł.; Popielski, P. Selected components of geological structures and numerical modelling of slope stability. Open Geosci. 2019, 11, 208–218. [Google Scholar] [CrossRef]
  24. MacKillop, K.; Fenton, G.; Mosher, D.; Latour, V.; Mitchelmore, P. Assessing Submarine Slope Stability through Deterministic and Probabilistic Approaches: A Case Study on the West-Central Scotia Slope. Geosciences 2019, 9, 18. [Google Scholar] [CrossRef] [Green Version]
  25. Lu, K.L.; Zhu, D.Y. A three-dimensional rigorous method for stability analysis and its application. Bull. Eng. Geol. Environ. 2016, 75, 1445–1457. [Google Scholar] [CrossRef]
  26. Oberhollenzer, S.; Tschuchnigg, F.; Schweiger, H.F. Finite element analyses of slope stability problems using non-associated plasticity. J. Rock Mech. Geotech. Eng. 2018, 10, 1091–1101. [Google Scholar] [CrossRef]
  27. Sazzad, M.M.; Rahman, F.I.; Mamun, M.A.A. Mesh Effect on the FEM Based Stability Analysis of Slope. In Proceedings of the International Conference on Recent Innovation in Civil Engineering for Sustainable Development, Gazipur, Bangladesh, 11–13 December 2015. [Google Scholar]
  28. Tschuchnigg, F.; Schweiger, H.; Sloan, S.W. Slope stability analysis by means of finite element limit analysis and finite element strength reduction techniques. Part II: Back analyses of a case history. Comput. Geotech. 2015, 70, 178–189. [Google Scholar] [CrossRef]
  29. Zienkiewicz, O.C.; Humpheson, C.; Lewis, R.W. Associated and nonassociated visco-plasticity and plasticity in soil mechanics. Geotechnique 1975, 25, 671–689. [Google Scholar] [CrossRef]
  30. Kaczmarek, Ł.; Dobak, P.; Szczepański, T.; Kiełbasiński, K. Triaxial creep tests of glacitectonically disturbed stiff clay—structural, strength, and slope stability aspects. Open Geosci. 2021, 13, 1118–1138. [Google Scholar] [CrossRef]
  31. Frankowski, Z.; Majer, E.; Sokołowska, M.; Ryżyński, G.; Ostrowski, S.; Majer, K. Engineering geological research conducted in the Polish Geological Institute during the last fifty years of activity. Przegląd Geol. 2018, 66, 752–768. [Google Scholar]
  32. Wysokiński, L. The Warsaw Slope in the Śródmieście District (from al. Jerozolimskie to the Sanguszki St.); Drukarnia Piotra Włodarskiego: Warszawa, Poland, 1999. [Google Scholar]
  33. Kaczmarek, Ł.; Dobak, P. Stability conditions of the Vistula Valley attained by a multivariate approach—A case study from the Warsaw Southern Ring Road. Geologos 2015, 21, 249–260. [Google Scholar] [CrossRef] [Green Version]
  34. Frankowski, Z.; Bażyński, J.; Zawadzki, R.; Lewkowicz, M.; Smagała, S.; Wysokiński, L.; Majer, E.; Łukasik, S.; Filipowicz, A.; Sobiech, J. Engineering Geological Atlas of Warsaw on a Scale of 1: 10,000; PIG-PIB: Warszawa, Poland, 2000. [Google Scholar]
  35. Bogusz, W. Prediction of Tunneling-Induced Ground Movements. Ph.D. Thesis, ITB, Warsaw, Poland, 2021. [Google Scholar]
  36. Sarnacka, Z. Detailed Geological Map of Poland, Scale 1: 50,000, Warsaw East Sheet with Explanations; PIG-PIB: Warszawa, Poland, 1980. [Google Scholar]
  37. Dahlin, T.; Zhou, B. Multiple-gradient array measurements for multichannel 2D resistivity imaging. Near Surf. Geophys. 2006, 4, 113–123. [Google Scholar] [CrossRef] [Green Version]
  38. Loke, M.H. Tutorial: 2-D and 3-D Electrical Imaging Surveys; Geotomo Software: Gelugor, Malaysia, 2002. [Google Scholar]
  39. Stenzel, P.; Szymanko, J. Metody Geofizyczne w Badaniach Hydrogeologicznych i Geologiczno-Inżynierskich (in Polish); Wydawnictwa Geologiczne: Warszawa, Poland, 1973. [Google Scholar]
  40. Lech, M.; Bajda, M.; Markowska-Lech, K. Zastosowanie tomografii elektrooporowej do określenia głębokości zalegania stropu iłów na wybranych obiektach w rejonie Warszawy. Inżynieria Morska Geotech. 2015, 3, 222–225. (In Polish) [Google Scholar]
  41. Kaczyński, R. Overconsolidation and microstructures in Neogene clays from the Warsaw area. Geol. Q. 2003, 47, 43–54. [Google Scholar]
  42. Kaczyński, R. Engineering geological behaviour of London and Warsaw clays. Geologos 2007, 11, 481–490. [Google Scholar]
  43. Zhu, D.Y. Investigations on the accuracy of the simplified Bishop method. Landslides and Engineered Slopes. In Landslides and Engineered Slopes; Chen, Z., Zhang, J., Li, Z., Wu, F., Ho, K., Eds.; Taylor & Francis Group: London, UK, 2008; pp. 1055–1058. [Google Scholar]
Figure 1. The Neogene clay roof within the Warsaw city centre (excluding soils lying over clay), modified from [31].
Applsci 11 10718 g001
Figure 2. The roof of the Neogene clay within the borders of Warsaw with two exemplary sections crossing the Warsaw Slope (modified from [9,34]).
Applsci 11 10718 g002
Figure 3. Workflow to select the elevation of the Neogene clay roof surface from the results of quasi 3D electrical resistivity tomography prospection.
Applsci 11 10718 g003
Figure 4. Results of slope stability 3D finite element modelling in different structural condition: (1) Cl/siCl—(clay, silty clay) strength parameters on above graph; (2) saCl/clSa—silty clay/clayey sand ϕ′—22°; c′—44 kPa; (3) MSa—(medium sand) ϕ′—30°; c′—0 kPa. Codification explanation: S—slightly inclined, PE—point elevation, D—dike-like form (type of disturbance with the height–disturbance width).
Applsci 11 10718 g004
Figure 5. (A) Circular slip surface for Bishop’s method; (B) fully specified slip surface for Janbu’s method; (C) FEM 2D.
Applsci 11 10718 g005
Figure 6. Results of stability modelling (plane strain analysis).
Applsci 11 10718 g006
Figure 7. The three-dimensional dependencies of SF on the value of the internal friction angle and cohesion for different calculation methods.
Applsci 11 10718 g007
Publisher’s Note: MDPI stays neutral with regard to jurisdictional claims in published maps and institutional affiliations.

