Article

A Study on Interaction Prediction for Reducing Interaction Latency in Remote Mixed Reality Collaboration

1
BioComputing Lab, Department of Computer Science and Engineering, Korea University of Technology and Education (KOREATECH), Cheonan 31253, Korea
2
Electronics and Telecommunications Research Institute (ETRI), Daejeon 34129, Korea
3
BioComputing Lab, Department of Computer Science and Engineering (KOREATECH), Institute for Bio-Engineering Application Technology, Cheonan 31253, Korea
*
Author to whom correspondence should be addressed.
Appl. Sci. 2021, 11(22), 10693; https://doi.org/10.3390/app112210693
Submission received: 31 August 2021 / Revised: 10 November 2021 / Accepted: 10 November 2021 / Published: 12 November 2021
(This article belongs to the Special Issue Augmented Reality: Trends, Challenges and Prospects)

Abstract

:
Various studies on latency in remote mixed reality collaborations (remote MR collaboration) have been conducted, but studies related to interaction latency are scarce. Interaction latency in a remote MR collaboration occurs because action detection (such as contact or collision) between a human and a virtual object is required for finding the interaction performed. Therefore, in this paper, we propose a method based on interaction prediction to reduce the time for detecting the action between humans and virtual objects. The proposed method predicts an interaction based on consecutive joint angles. To examine the effectiveness of the proposed method, an experiment was conducted and the results were given. From the experimental results, it was confirmed that the proposed method could reduce the interaction latency compared to the one obtained by conventional methods.

1. Introduction

Recently, due to the worldwide COVID-19 pandemic, the use of remote collaboration has increased [1,2]. Various conventional video conferencing solutions [3,4,5] for remote collaboration have limitations in terms of realistically delivering the user’s work [6,7]. To overcome this, research to apply mixed reality (MR) to remote collaboration has recently been conducted [8,9]. In remote MR collaboration, end-to-end latency possibly occurs because of various reasons, such as tracking, application, image generation, display, or network [10,11,12,13]. It is difficult to completely remove the latency since most of the latency causes mentioned above are essential operations for MR. However, as latency affects the usability (e.g., interaction satisfaction) as well as the efficiency of remote MR collaborations, it is necessary to reduce it.
Due to this need, various studies have been conducted to improve the latency. Conventional studies have focused on reducing latency between the moment of performing the interaction and delivering the performed interaction information. Action detection, such as contact between a human and an object, is required to find the performed interaction in a remote MR collaboration. In other words, in remote MR collaborations, it is difficult to determine whether the user had performed an interaction before such actions are detected. Defining the time to check whether the interaction is performed according to the user’s intention in a remote MR collaboration as the interaction latency, conventional solutions have limitations because it is difficult to reduce latency.
In this paper, we propose an interaction prediction method for reducing interaction latency in remote MR collaborations. The proposed method reduces interaction latency by predicting interactions between a human and a virtual object. Interaction prediction is performed using consecutive hand joint information as the input in human and virtual object interactions.
This paper is composed as follows: in Section 2, we introduce the process of deriving frequently used gestures in remote MR collaboration based on conventional studies and selecting the gestures for this study. In Section 3, we propose a prediction method for selected gestures. In Section 4, we conduct an experiment with and without applying the proposed method and compare the experimental results to examine the effectiveness of the proposed method. Finally, in Section 5, we present conclusions and future works.

2. Related Work

2.1. Interactions in Remote MR Collaboration

Based on the target, interactions used in remote collaboration can be broadly classified into the following categories: human–human, human–virtual object (hereafter human–VO), and human–real object (hereafter human–RO). Among these, human–RO interactions, which are interactions between a human and a real object, is difficult to apply to various remote collaborations since they require a physical object in the real world. Therefore, as a result of an investigation into research on remote collaboration based on MR, virtual reality (VR), and augmented reality (AR) conducted over the past three years on the other two interactions, the human–VO interaction was used more frequently than the human–human interaction [14,15,16,17,18]. These results seem to be due to the purpose of applying MR to remote collaboration. In other words, it can be found that the purpose of realistically delivering a remote user’s work is achieved through human–VO interaction.
The human–VO interaction can be applied to various types of remote collaboration application scenarios [19]. Oyekan et al. [14], Wang et al. [15] and Kwon et al. [16] conducted a remote collaboration application study of the remote expert scenario focusing on collaborations between remote experts and workers. In the remote expert scenario, the human–VO interaction was performed for the remote expert to manipulate the shared virtual object and to give work instructions to field workers. Coburn et al. [17] conducted a remote collaboration application study of the co-annotation scenario, focusing on annotating objects or environments of user interest. In the co-annotation scenario, human–VO interaction was performed for users to check annotations that were left or to jointly annotate things or environments. Rhee et al. [18] conducted a remote collaboration application study of a shared workspace scenario focusing on performing tasks in a shared virtual space. In the shared workspace scenario, human–VO interaction was performed to manipulate virtual objects shared between users in remote locations.
In each of the above studies, interaction was mainly used to transform a target virtual object as follows: move, rotate, and scale. When performing move, rotate, and scale, the gestures that were mainly used were pinch and grab [20]. Pinch uses two fingers to transform an object, and grab uses five fingers to transform an object.

2.2. Latency When Interacting with Virtual Objects in Remote MR Collaboration

Latency is one of the representative factors that affect a user (e.g., less work efficiency, less application satisfaction, etc.) in a human–VO interaction. Therefore, minimizing the end-to-end latency between performing the interaction and when the performed interaction information is delivered to a remote user is one of the main goals of remote MR collaboration research.
In general, end-to-end latency in remote MR collaboration occurs for the following reasons:
  • Tracking latency, or the time required to track the user and align the direction;
  • Application latency, or the time required to run the application;
  • Image generation latency, or the time required to generate an image to be shown as a result;
  • Display latency, or the time required to output an image to a see-through type display, such as Hololens2 [21], or a head-mounted display (HMD), such as HTC-Vibe [22];
  • Network latency, or the time required to transmit and receive interaction-related information between users in remote locations.
In general, a latency of 100 ms or less is known as a threshold that does not affect users, but according to a recent study, it was found that even such a small latency affects users [23]. Therefore, all of the above latencies play a major role in user satisfaction during the interaction. Since most of these latency causes are essential operations for MR, it is difficult to remove the latency in MR applications completely. However, it is possible to partially reduce the latency through various methods, and for this reason, various studies are in progress [10,11,12].
Elbambi et al. [10] focused on network latency in wireless VR, especially, and found that the use of mmWave communication, mobile edge computing, and pre-caching helps to reduce latency. Zheng et al. [11] focused on display latency in AR systems and proposed a low-latency update algorithm to solve the problem. Chen et al. [12] focused on application latency, tracking latency, and image generation latency in mobile AR systems and proposed a low-latency and low-energy mobile AR system to prevent duplicate image calculation and image loading.
The conventional studies above were related to reasons for latency occurring between performing the human–VO interaction and when the performed interaction information is delivered. In other words, conventional studies focused on reduction latency after finding the performed human–VO interaction. Meanwhile, action detection (such as contact or collision) between a human and a virtual object is required for finding the interaction performed in remote MR collaboration. Defining the time to check whether the interaction is performed according to user’s intention in a remote MR collaboration as the interaction latency, conventional studies related to this interaction latency were insufficient. Therefore, it is required to try a new approach to reduce the interaction latency.

3. Proposed Method

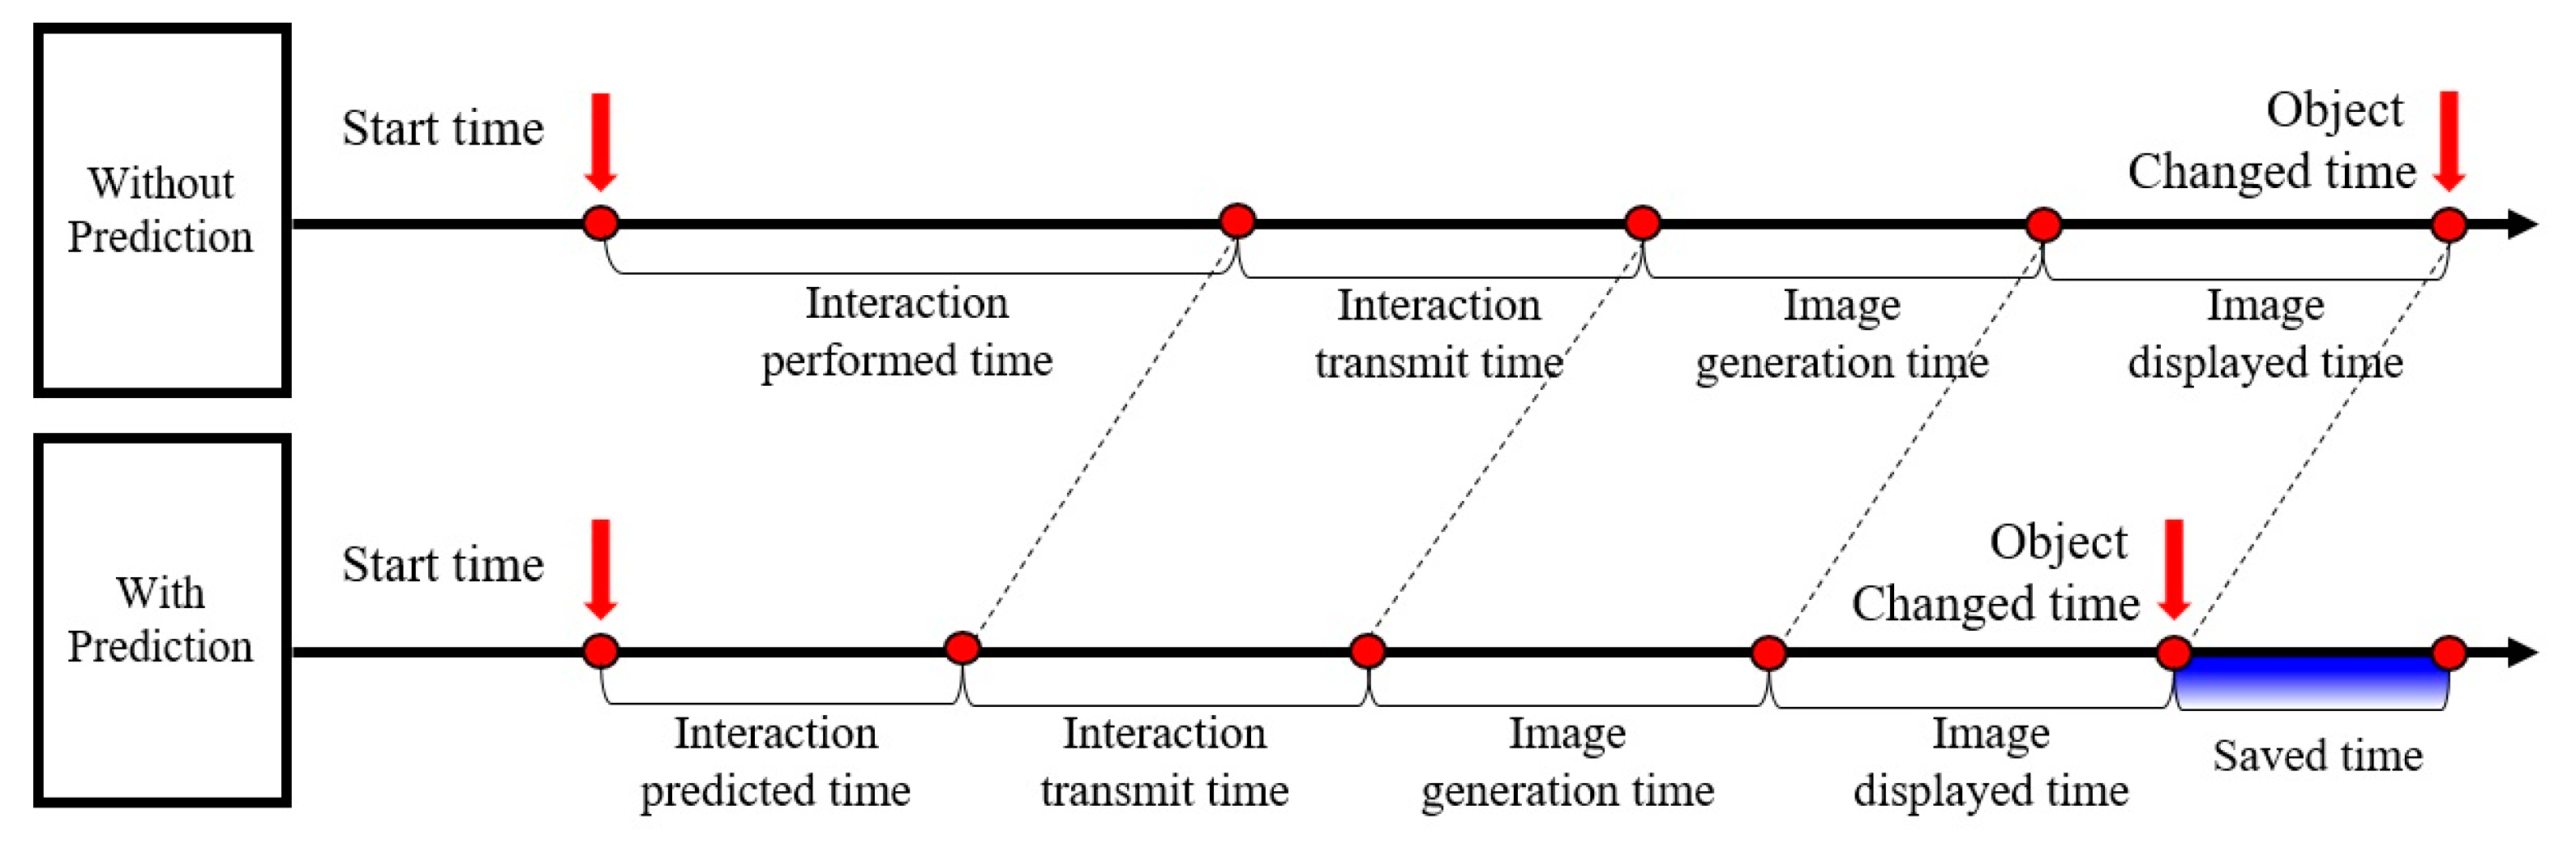
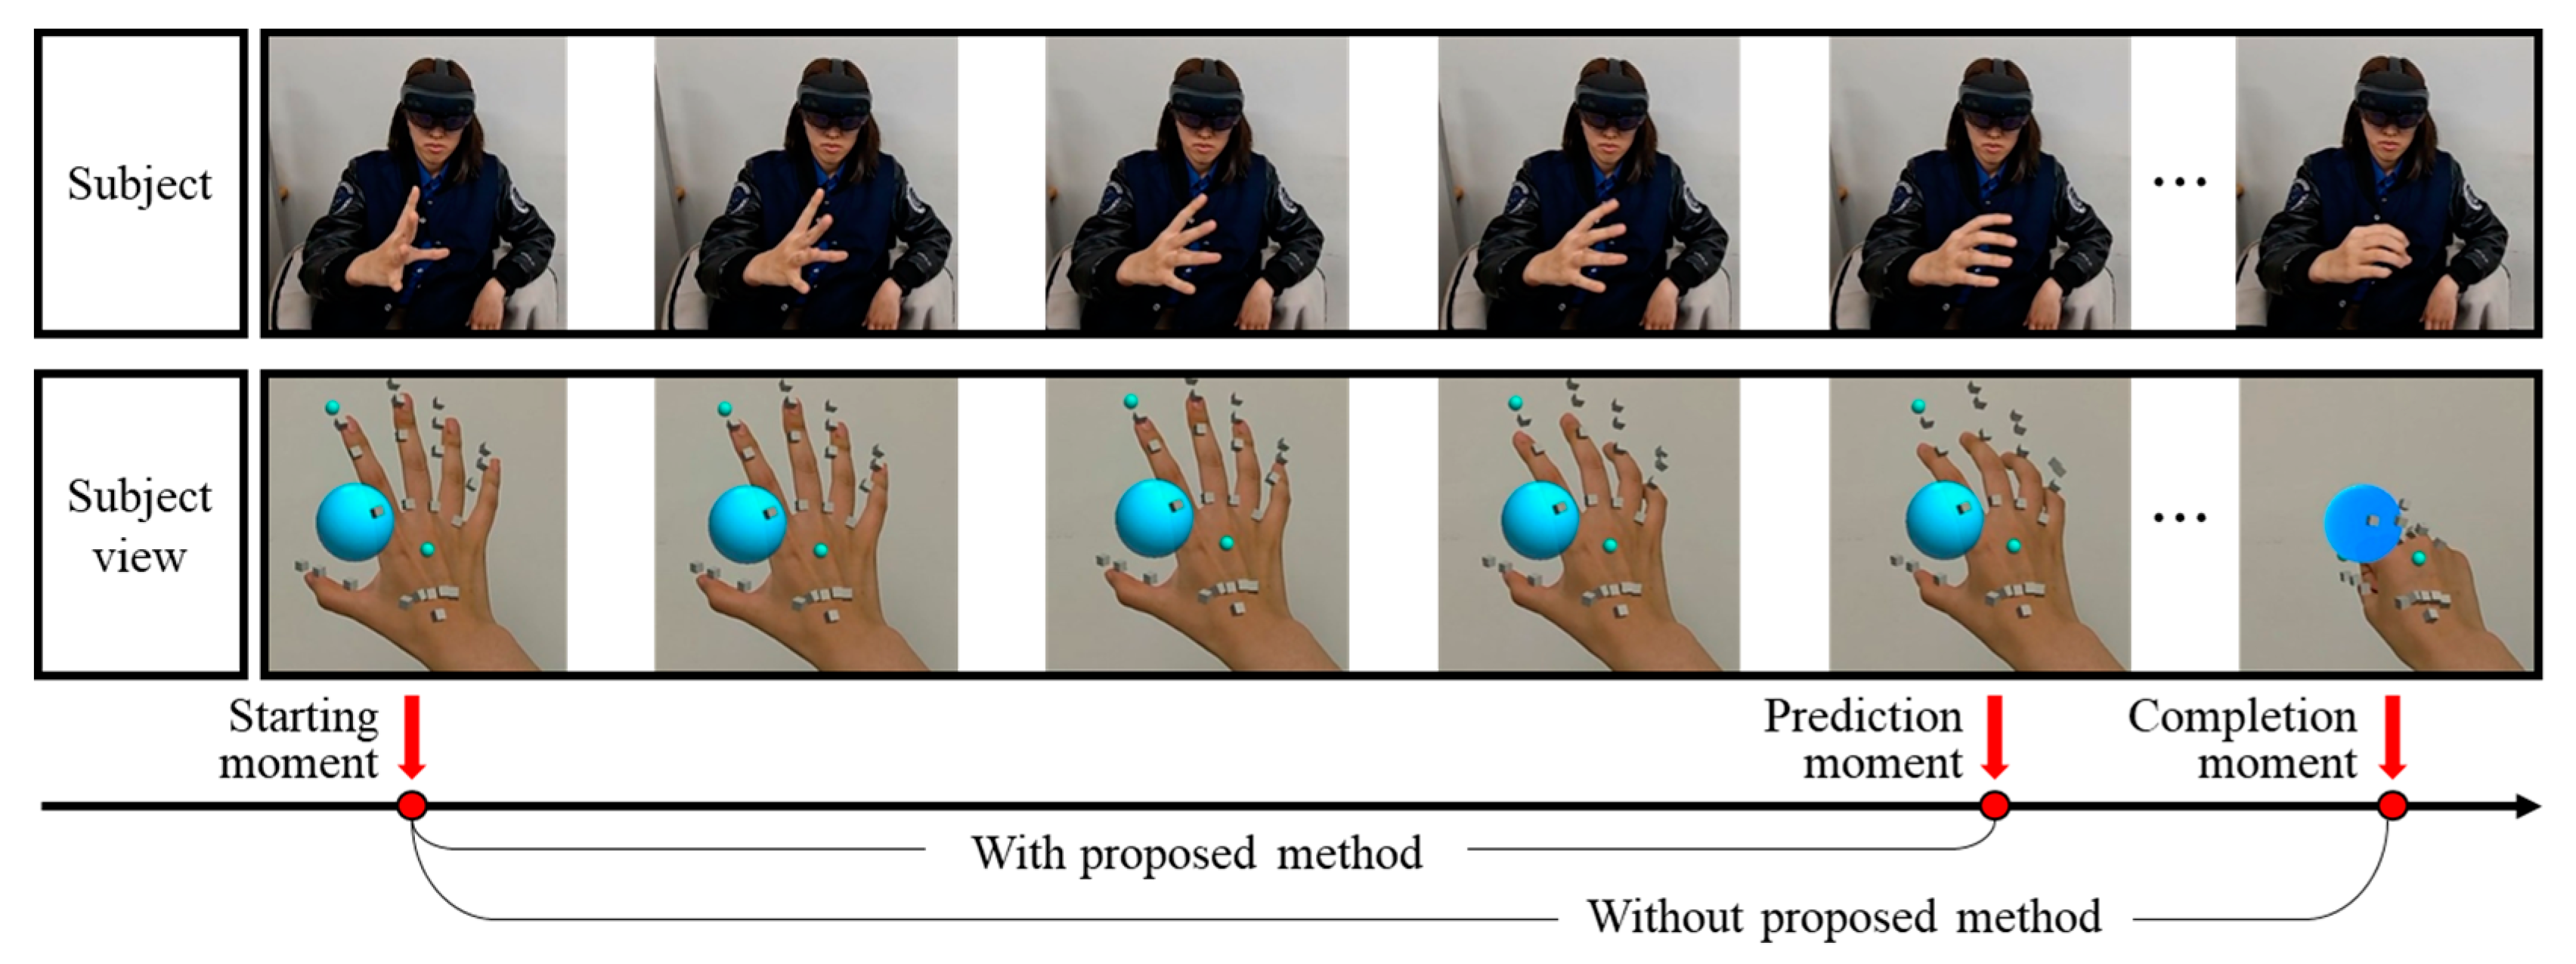
In this section, we describe a method for reducing interaction latency when performing human–VO interactions. In general, in remote MR collaborations, including human–virtual object interactions, remote users cannot know the other user’s intentions until an interaction is performed. Since users’ intentions include interaction targets, interaction types, etc., if users’ intentions are known previously, it is possible to predict changes in the virtual object and environment (e.g., the object’s color, sound effect, etc.). If the changes of the virtual object or environment are predictable, the ‘saved time’, highlighted in blue in Figure 1, can be shortened until the change caused by the interaction is revealed to a user.
To reduce interaction latency, this study proposes a method to find the interaction information in advance in remote MR collaborations. The proposed method is a method to reduce interaction latency by predicting the occurrence of the interaction before the human–VO interaction is performed.
There are many types of human–VO interactions used in the MR environment [24], and one of those types, a representative type that does not require tools and devices other than a see-through type displays or HMDs, is the gesture-based interaction. This study mainly targets gesture-based interactions that are not biased toward a specific device and can be widely applied to remote MR collaborations. Meanwhile, the types of gestures that can be used for interaction, such as manipulating virtual objects in a remote MR collaboration, are various, and in many cases, those gestures even differ for each application. This study focused on gestures that were mainly used to transform a target object in a human–VO interaction, such as grab and pinch [21].
For the interaction prediction, it is required to classify the studied target gestures correctly. In the proposed method, k-nearest neighbor (k-NN) [25], which executes quickly on a relatively small dataset without significantly compromising accuracy, was used as an algorithm for gesture classification. The purpose of this study was to investigate the feasibility of the proposed method, so a relatively small and simple k-NN algorithm was adopted.
A k-NN algorithm can cause problems of classifying an undefined hand gesture (hereafter none) into a specifically defined hand gesture (grab, pinch). Therefore, the existing k-NN was partially adjusted to further classify undefined hand gestures. Three numbers (3, 5, and 7) were also selected as the value k , since the performance of k-NN may vary depending on the value k .
A dataset is essential for classifying gestures with k-NN. In MR, the hand is usually expressed as a 20-keypoint model representing a joint. If all of this information is used, the size of the dataset becomes very large as the number of gesture samples in the dataset increases. Therefore, in this study, we tried to derive a representative value that can represent the hand using joint information before creating a dataset for gesture classification.
Since the representative value is used to classify the gesture, it should express whether the gesture is performed or not. In other words, the value that changed the most according to the gesture that was performed should be selected as the representative value. To find this, grab and pinch gestures, the targets of this study, were performed; recorded joint trajectories data are shown in Figure 2.
Figure 2 shows the joint trajectories with respect to grab and pinch gestures. Each joint’s information was recorded by dividing it to confirm the degree of change as follows: gesture at starting moment (Figure 2a,d), gesture at ending moment (Figure 2b,e). Figure 2c,f expresses the starting and ending moment of a gesture together; the dashed line means the hand at the starting moment, and the solid line means the hand at the ending moment. In Figure 2c,f, although it is possible to approximately check the degree of the joint information changed in each gesture, it is difficult to confirm the degree of change with respect to each joint. The degree of change with respect to each joint was calculated to confirm it more accurately.
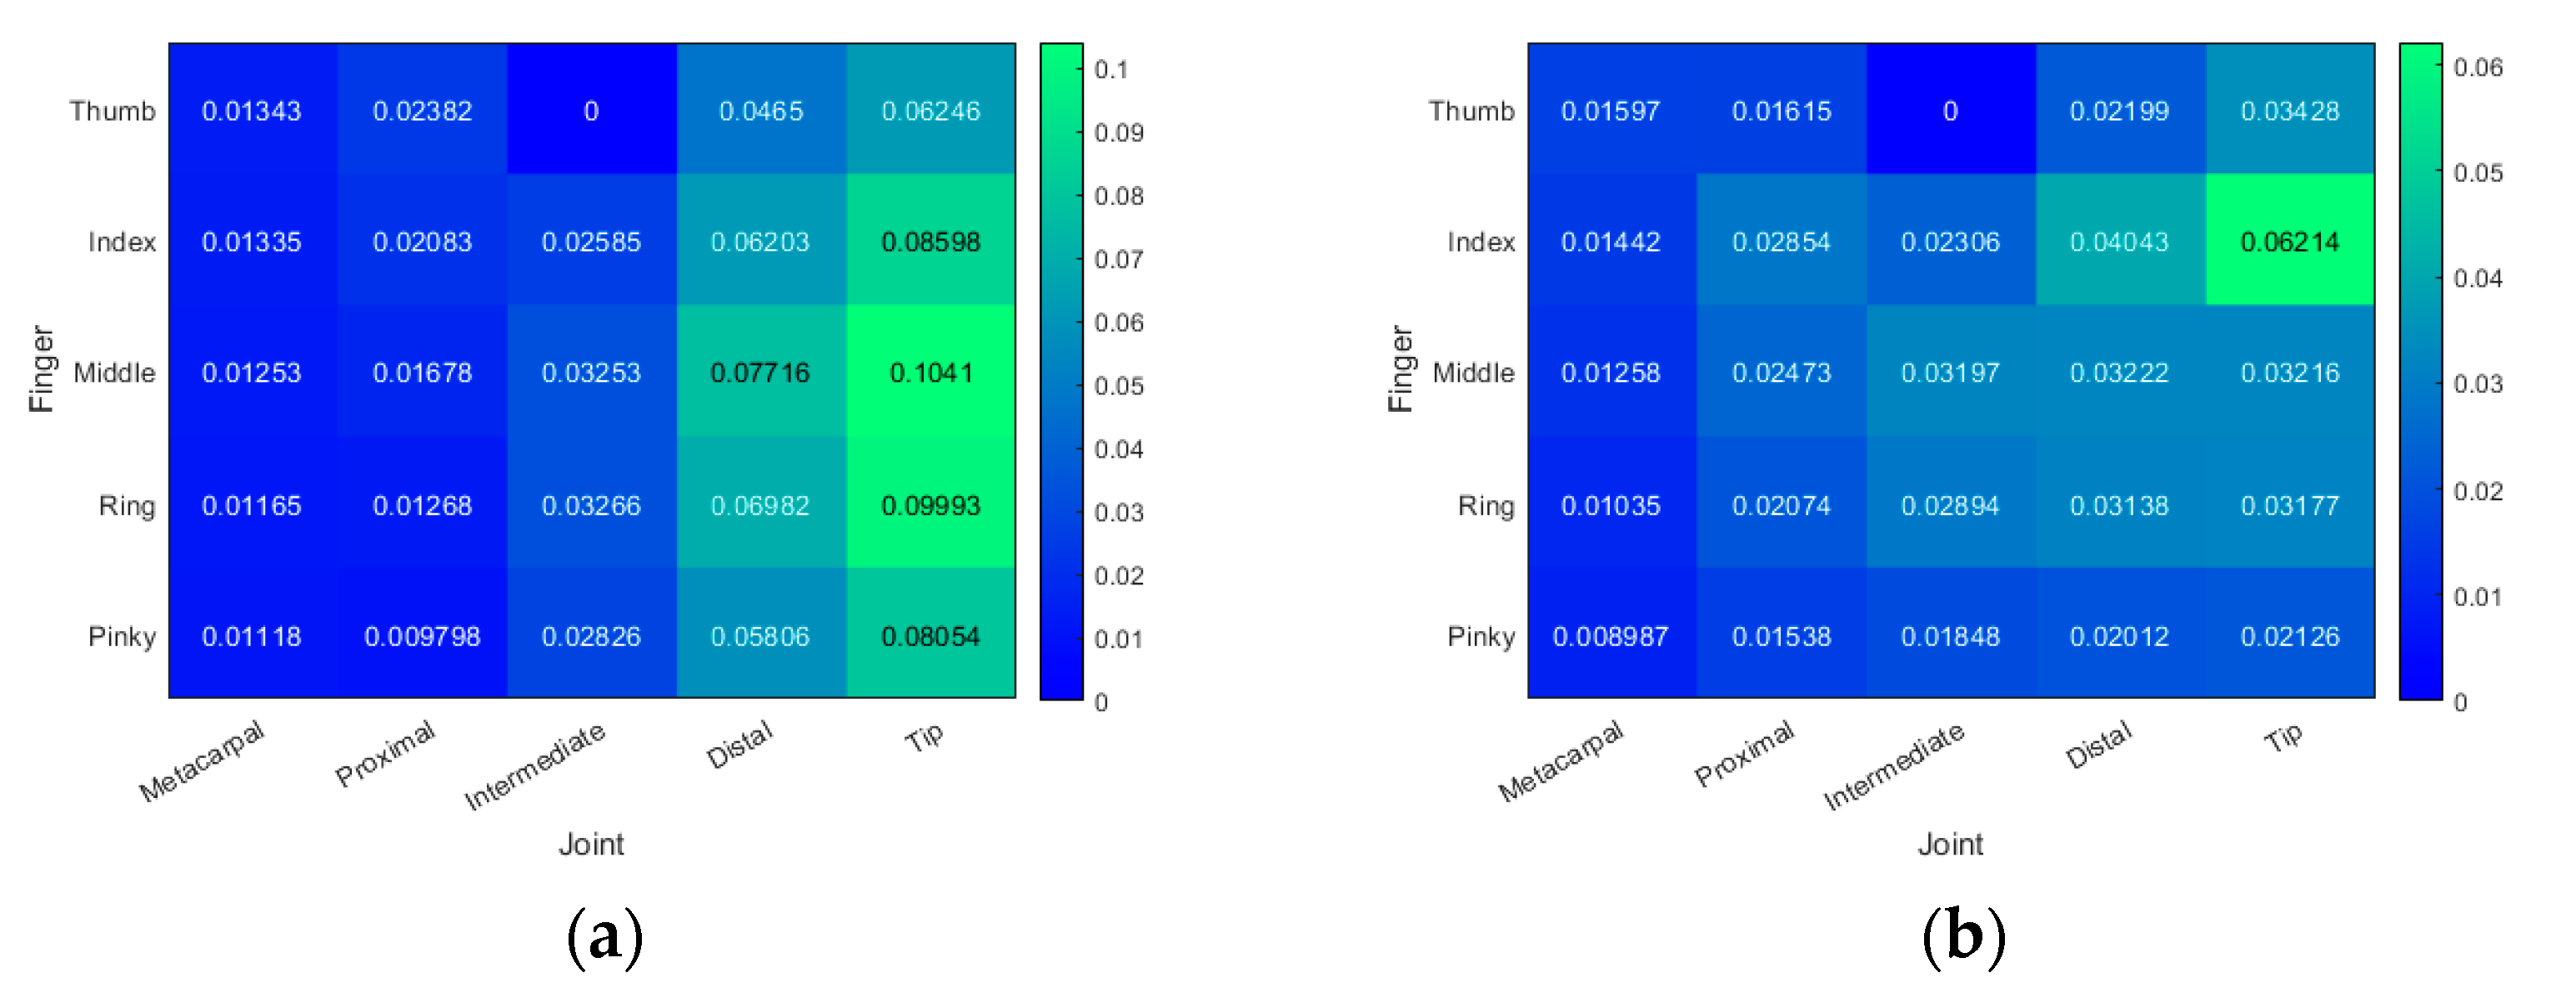
Figure 3 indicates the degree of change with respect to each joint information according to grab and pinch gestures. In the case of the thumb, there is no intermediate joint, so 0 was assigned in the intermediate of the thumb. The other joints are expressed in blue for fewer changes (0 in Figure 3a,b) and green for more changes (0.1 in Figure 3a and 0.05 in 
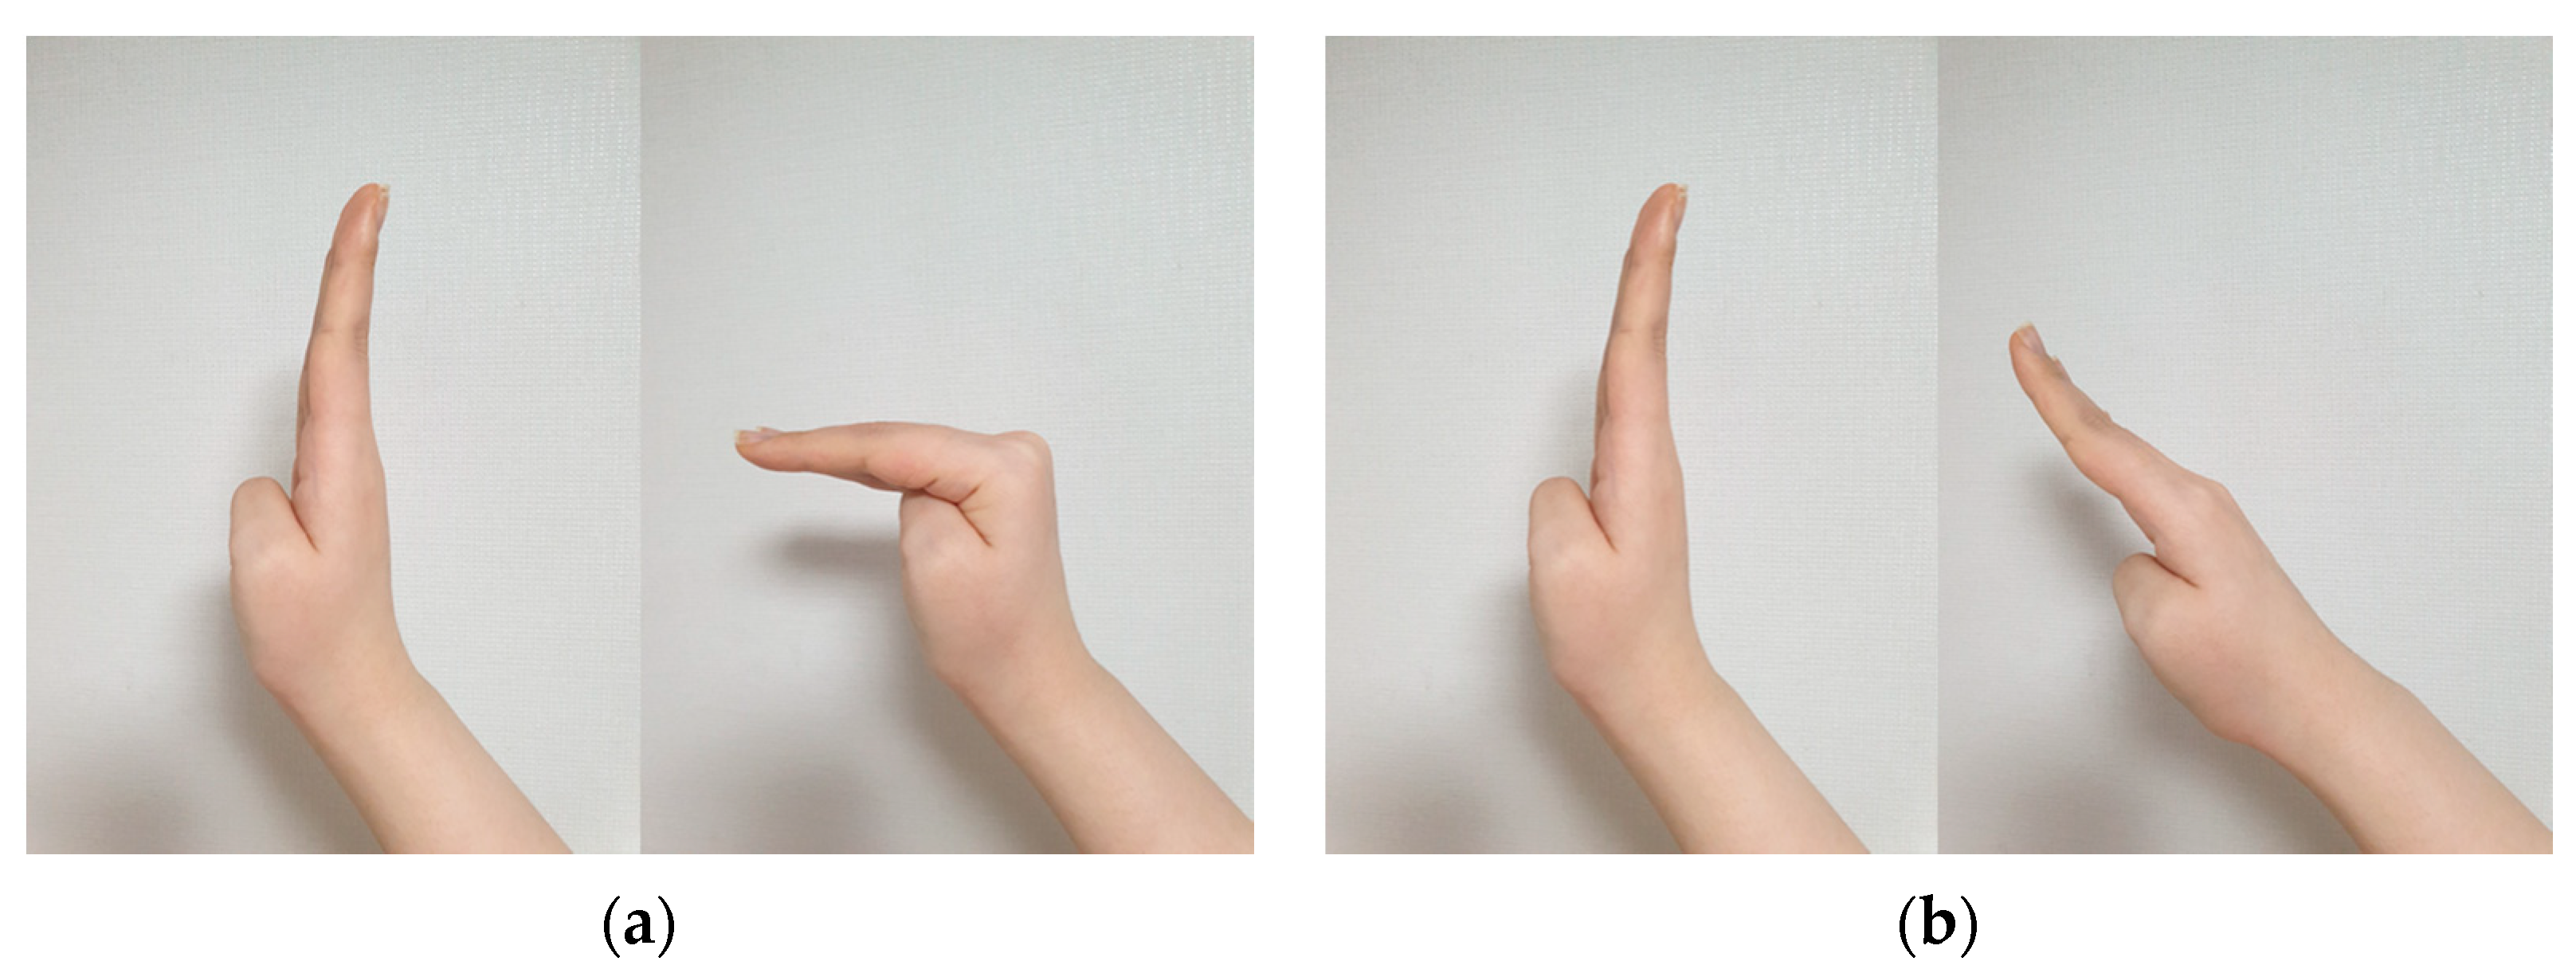
Figure 3b), depending on the degree of change. As a result, in the case of grab, it was confirmed that the tip joint greatly changed. In the case of pinch, it was confirmed that the tip joint and the distal joint of the index finger greatly changed. Additionally, in the case of pinch, the tip joint of the other fingers showed a tendency to change significantly compared to other joints of each finger. Based on this, we selected the tip joint of each finger as a representative value of the hand for classifying the grab and pinch gesture. However, additional information is required because it is impossible to determine the hand’s movement only with the tip joint. For example, Figure 4a,b shows the cases where the tip joint greatly changed. It is difficult to distinguish the cases shown in Figure 4 with only the information that the tip joint changed greatly.
Even if additional information is used, the representativeness of the tip joint should be maintained, so the metacarpal joint and proximal joint were additionally selected, which had the least degree of change due to the review result of Figure 3. The selected joints were used to help classify the gesture without compromising the representativeness of the tip joint. In particular, the selected joints can help to check the overall degree of the hand. Meanwhile, the more joints included when classifying a gesture, the larger the size of the dataset and the longer the computation time. Therefore, we did not select a distal joint that showed the most degree of change after the tip, for which the change of degree was almost similar to the tip. Eventually, in this study, joint angles for each finger were calculated using the tip joint, the metacarpal joint, and the proximal joint by Equations (1)–(3):
v 1 = p o s i t i o n M e t a c a r p a l p o s i t i o n P r o x i m a l
v 2 = p o s i t i o n T i p p o s i t i o n P r o x i m a l
θ j o i n t a n g l e = cos 1 ( v 1 · v 1 v 1 v 2 )
where p o s i t i o n M e t a c a r p a l , p o s i t i o n P r o x i m a l , and p o s i t i o n T i p are 3D points of the metacarpal joint, the proximal joint, and the tip joint, respectively; θ j o i n t a n g l e is an internal angle calculated using the metacarpal, proximal, and tip joints. These five calculated joint angles ( θ 1 θ 5 ) are shown in Figure 5 and these values were used as representative values representing the hand.
When classifying a gesture, only using information at a specific moment cannot reflect information from consecutive movements, so it is difficult to find the user’s intention. In other words, since classifications using only the information of a specific moment are highly likely to fail, consecutive joint angles were used for interaction predictions in this study.
Figure 6 shows an example of deriving consecutive joint angles. The joint angles of five fingers are calculated from each frame (frame 1, frame 2, frame 3, frame 4, and frame 5), and calculated values from 5 consecutive frames become one joint angle set. In general, a human gesture lasts 0.5 to 1 s [26]. In order for the proposed method to have meaning as a prediction, it was judged that the time required for the prediction itself should be about half of the duration of the gesture. Therefore, we tried to perform predictions through 5 frames at 30 fps (about 0.17 s).
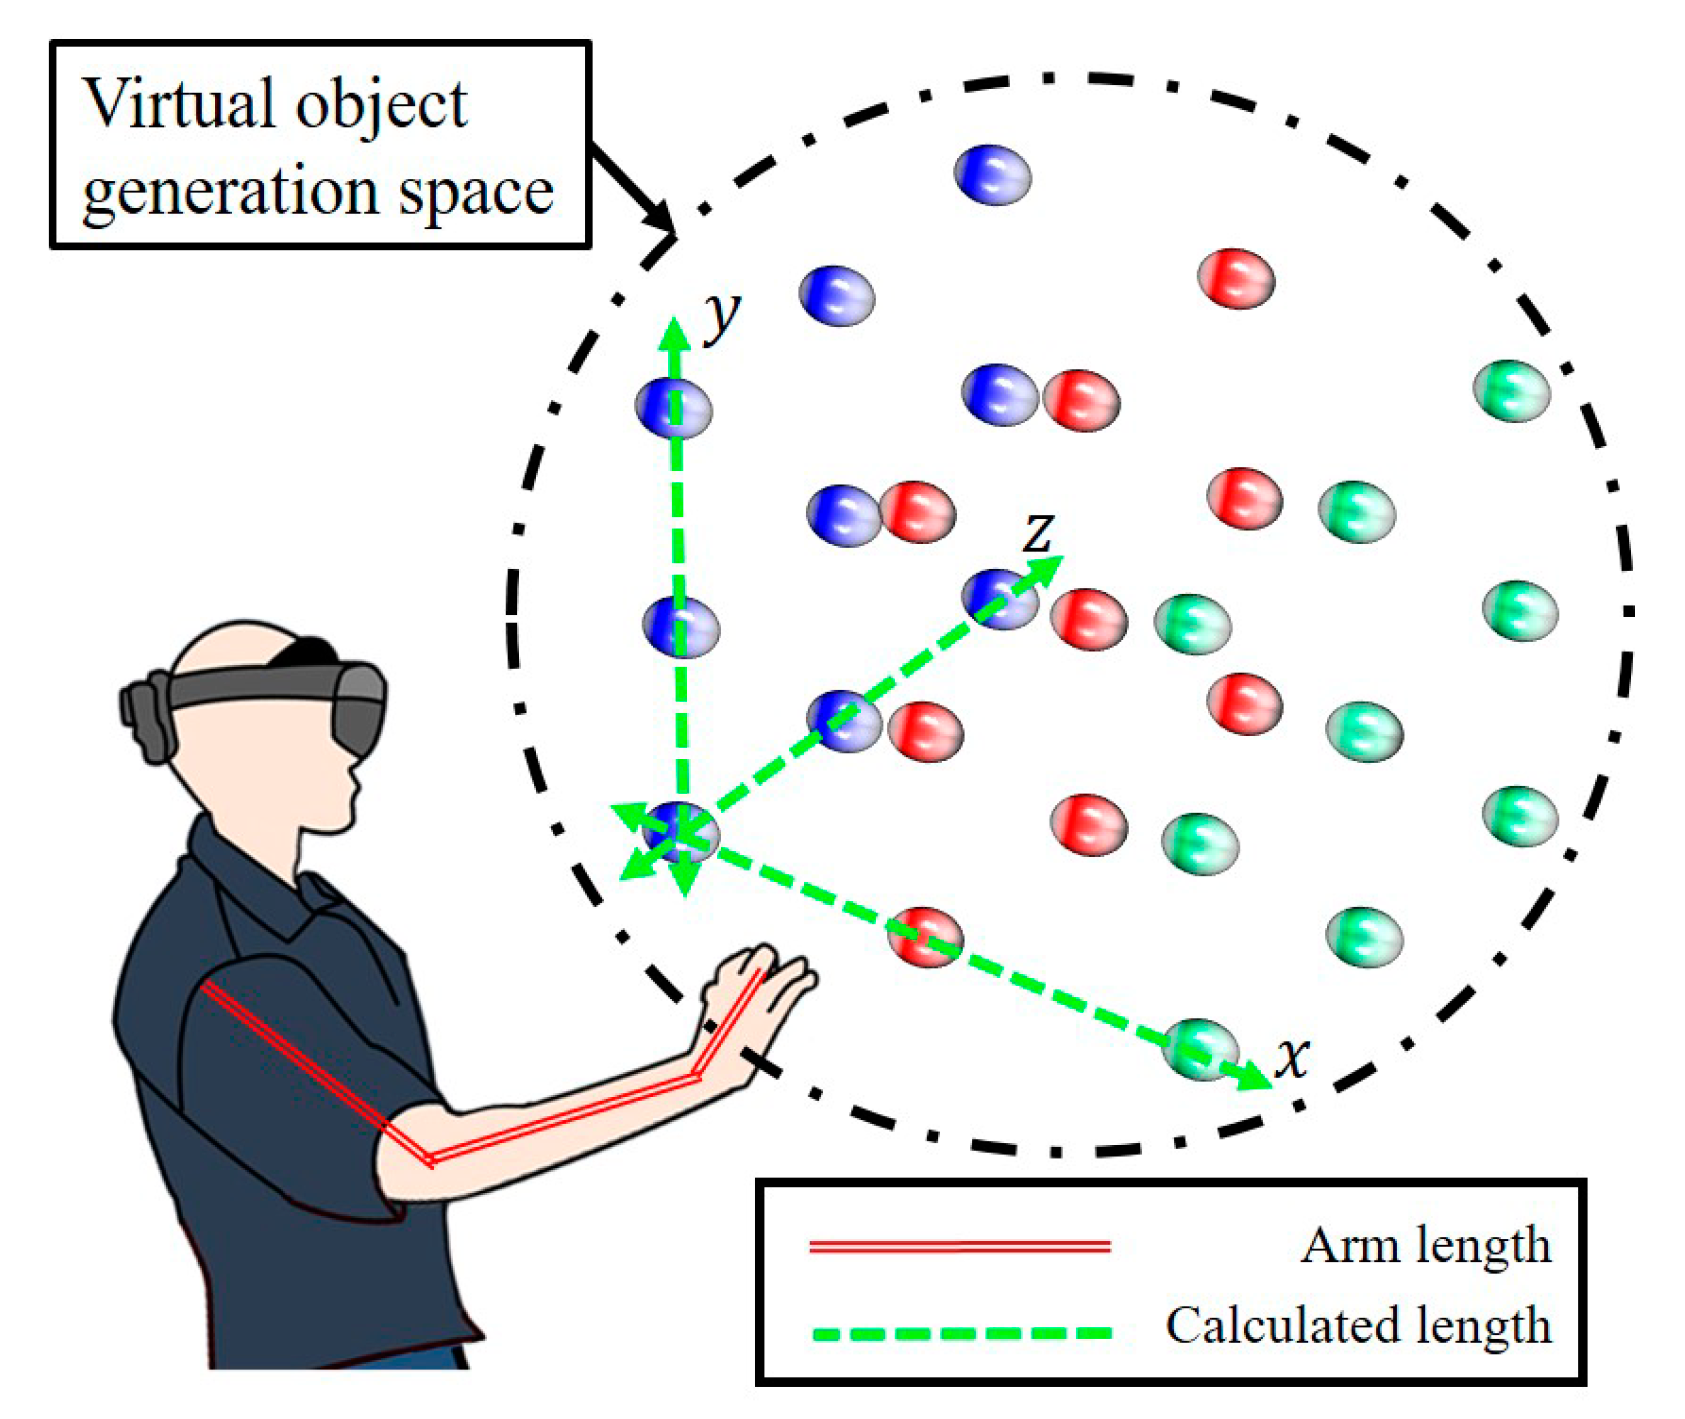
The dataset used in this study consists of joint angle sets calculated as above. In this study, the joint angle sets were created by performing grab and pinch gestures for virtual objects generated at random locations by 3 users. Joint angle sets included in the dataset were derived through 5 consecutive frames from when each gesture was started. To create the dataset, 3 users performed grab and pinch gestures 100 times each, and through this, a dataset including a total of 300 finger joint angle sets for gesture interactions was obtained. The procedure for performing the proposed interaction prediction described above is shown in Figure 7, and the detailed description is as follows:
  • Original image input: the hand joint raw data is obtained when the original image is input;
  • Joint angle calculation: each joint angle data is calculated from the obtained hand joint raw data;
  • Interaction prediction: the corresponding interaction is predicted using the k-NN algorithm with the joint angle set as the input. The input joint angle set is classified as grab, pinch, or none (which is neither grab nor pinch; see the red box in Figure 7);
  • Prediction result check: by confirming the prediction result, the interaction prediction of the proposed method is completed (see the red box in Figure 7).
In this study, ‘interaction prediction’ means that the user’s gesture is classified as a defined specific gesture through the above process. The first frame among the consecutive frames used for classification is considered as the user’s gesture starting moment. We examined whether our procedure worked well by comparing the obtained hand gestures with actual ones. It was confirmed that the proposed method could classify users’ hand gestures into grab, pinch, and none through the additional test.

4. Experimental Results and Discussion

4.1. Environment

An application was implemented to examine the effectiveness of the proposed method. The implemented application was designed to interact with virtual objects using gestures such as grab or pinch, and the experimental environment is shown in Figure 8.
In Figure 8, the red double line is the measured arm length of the subjects, and the green dashed line is the calculated length based on the arm length to limit the virtual object generation space. In Figure 8, the virtual object generation space, expressed with the black dash-dotted line, is defined as the maximum space in which the virtual object can appear, and was set based on the calculated length. The environment based on arm length was constructed to minimize the effect of differences of each subject’s body on the experiment.
If the virtual object appears only in a specific position, the subject can easily adapt to interaction, and accordingly, the experimental results can be biased. Therefore, the virtual objects were set to appear randomly at the positions represented by the spheres in Figure 8 (blue, red, and green). The order and the position of the virtual object were set to be counterbalanced across the conditions. In the application, an additional effect (e.g., color darkening or a sound effect) was added when the interaction was completed so that the subject could check whether the interaction was completed. The application for the experiment was executed at 30 fps on Microsoft’s Hololens2 [20].
When using the application, the sharpness of the virtual object felt by the subjects may differ. This can be caused by the relative position of the light and the average indoor illuminance. Therefore, the experiment was conducted at the same position in the room under the same posture (sitting). In addition, artificial lighting was applied to the experimental environment to maintain a constant average illuminance (140 lux).

4.2. Methodology

A subject experiment was conducted with 7 subjects in their twenties to thirties [27] to examine the effectiveness of the proposed method. For consistency of the experiment, all subjects were recruited as right-handed people. The subjects were informed of the experimental location and time before the experiment and were asked to participate in the experiment after sufficient rest. The subjects were also sufficiently informed about the contents of the experiment in advance, and informed consent was obtained from all subjects involved in the study before the start of the experiment.
The information measured in the experimental procedure was as follows: demographic questionnaire, subject’s body information (arm length), pre-questionnaire, post-questionnaire, and the task information of the subjects. First, before the experiment, a demographic questionnaire consisting of questions regarding the age, gender, and contact information of the subject was completed. Next, a pre-questionnaire consisting of previous MR experiences and the motion sickness condition of the subject was completed. The simulator sickness questionnaire (SSQ), which has been widely used in existing studies, was used to measure motion sickness including the visual fatigue of the test subjects [28]. The SSQ included 16 symptoms that were associated with being indicative of simulator disease. After the demographic questionnaire and pre-questionnaire, the subject’s body information was measured. The measured body information was arm length, which was used to set a virtual object generation space suitable for each subjects’ body in an application. After body information measurements were completed, the subjects wore a Hololens2 [20] for the experiment.
In the experiment, the task to interact with a target virtual object was given to each subject. Grab and pinch gestures were used for interactions with a target virtual object. A task made a user interact 27 times with virtual objects in the virtual object generation space. Subjects were instructed to perform the given task four times by gesture so that each subject totally interacted 108 times for gesture interaction.
The task information of the subjects was measured during the experiment as follows: interaction starting moment, interaction prediction moment, interaction completion moment, predicted interaction, and prediction result (success or failure). Among the above information, time-related information was measured as shown in Figure 9.
The small red circles in Figure 9 indicate the interaction starting, interaction prediction, and interaction completion moments, respectively. The interaction starting moment was measured at the moment the target object appeared in the virtual object generation space. The interaction prediction moment was measured at the moment when the gesture of the subject was classified as a specific gesture by consecutive frame input. Finally, the interaction completion moment was measured at the moment when the interaction of the subject with the virtual object was completed. Two interaction latencies were calculated using the interaction starting moment, the interaction prediction moment, and the interaction completion moment for the purpose of comparison: one with the proposed method and the other without the proposed method.
While the subject repeated the action shown in Figure 9, the prediction result was also measured, as was the time-related information. If the interaction prediction was correct, the task was recorded as a success and counted. However, if the interaction prediction was incorrect (e.g., a pinch is classified as a grab) or the prediction was not made at all, the prediction was recorded as a failure and not counted. The prediction success rate was calculated from the number of successes counted in this way. Finally, after the experiment, the motion sickness condition of the subject was measured once again using a post-questionnaire. Measured data in this study were analyzed using SPSS version 21.0 [29].
All of the above research procedures were conducted according to the guidelines of the Declaration of Helsinki. In addition, for all of the above research procedures, we obtained approval by the Institutional Review Board of KOREATECH in advance (approval on 16 July 2020).

4.3. Results and Discussion

4.3.1. Gesture Classification Using k-NN Algorithm

In this study, a k-NN algorithm was used for gesture classification. Since the k-NN algorithm has the possibility to exhibit different levels of performance depending on the k value, it was necessary to confirm whether the experimental results were affected by the k value of k-NN. For this, the experimental results for when the k value was 3, 5, and 7 were compared.
First, to confirm whether each subject’s prediction time was affected by the k value, a one-way ANOVA was performed for the average prediction time, with respect to the subject, when the k value was 3, 5, and 7. Table 1 shows the results of the normality test to perform one-way ANOVA.
As a result of the normality test, as shown in Table 1, the significance level (red boxes in Table 1) of both the Kolmogorov–Smirnov and the Shapiro–Wilk test was greater than 0.05, so prediction time data satisfy the normal distribution. Next, the test result for equality of variance in consideration of the post hoc analysis of one-way ANOVA is shown in Table 2.
As a result of the test for equality of variance, as shown in Table 2, the significance level (red box in Table 2) of Levene was greater than 0.05, so the equality of variance was confirmed. Thus, Table 3 shows the results of one-way ANOVA.
As a result of the one-way ANOVA, as shown in Table 3, the significance level (red box in Table 3) was greater than 0.05, so the null hypothesis of one-way ANOVA was adopted. Based on this, even if the k value in k-NN was different, as 3, 5, and 7, respectively, it could be seen that there was no significant difference in the average prediction time for each subject. That is, it was confirmed that even if the k values of k-NN were different, there was no significant effect on the prediction time measured for each subject.
Next, to confirm whether each subject’s prediction success rate for grab gestures was affected by the k value, the one-way ANOVA was performed for the prediction success rate of grab gestures, with respect to subject, when the k value was 3, 5, and 7. Table 4 shows the results of the normality test to perform one-way ANOVA.
As a result of the normality test, as shown in Table 4, the significance level (red boxes in Table 4) of both the Kolmogorov–Smirnov and the Shapiro–Wilk test was greater than 0.05, so the prediction success rate of the grab gesture data satisfies the normal distribution. Next, the result of the test for equality of variance in consideration of the post hoc analysis of one-way ANOVA is shown in Table 5.
As a result of the test for equality of variance, as shown in Table 5, the significance level (red box in Table 5) of Levene was greater than 0.05, so the equality of variance was confirmed. Thus, Table 6 shows the results of one-way ANOVA.
As a result of one-way ANOVA, as shown in Table 6, the significance level (red box in Table 6) was greater than 0.05, so the null hypothesis of one-way ANOVA was adopted. Based on this, even if the k value in k-NN was different, as 3, 5, and 7, respectively, it could be seen that there was no significant difference in the average prediction success rate of the grab gestures for each subject. That is, it was confirmed that even if the k values of k-NN were different, there was no significant effect on the prediction success rate of grab gesture measured for each subject.
Finally, to confirm whether each subject’s prediction success rate of the pinch gesture was affected by the k value, a one-way ANOVA was performed for the prediction success rate of the pinch gesture, with respect to the subject, when the k value was 3, 5, and 7. Table 7 shows the results of normality test to perform one-way ANOVA.
As a result of the normality test, as shown in Table 7, the significance level (red boxes in Table 7) of both the Kolmogorov–Smirnov and the Shapiro–Wilk test was greater than 0.05, so the prediction success rate of pinch gesture data satisfies the normal distribution. Next, the result of the test for equality of variance, in consideration of the post hoc analysis of one-way ANOVA, is shown in Table 8.
As a result of the test for equality of variance, as shown in Table 8, the significance level (red box in Table 8) of Levene was greater than 0.05, so the equality of variance was confirmed. Thus, Table 9 shows the results of one-way ANOVA.
As a result of one-way ANOVA, as shown in Table 9, the significance level (red box in Table 9) was greater than 0.05, so the null hypothesis of one-way ANOVA was adopted. Based on this, even if the k value in k-NN was different, as 3, 5, and 7, respectively, it could be seen that there was no significant difference in the average prediction success rate of the pinch gesture for each subject. That is, it was confirmed that even if the k values of k-NN were different, there was no significant effect on the prediction success rate of pinch gestures measured for each subject.
Up to now, it was examined whether the data for confirming the effectiveness of this study, such as the prediction time, prediction success rate of grab gestures, and the prediction success rate of pinch gestures, were affected by the k value of k-NN. As a result of the one-way ANOVA for the cases where k is 3, 5, and 7, it was confirmed that there was no significant difference according to the k value. Therefore, 3 was arbitrarily selected as the k value for examining the subsequent experimental results.

4.3.2. Prediction Success Rate

In the experiment, each subject was assigned to do the given task four times with respect to gestures, and each subject performed 27 interactions for each task using pinch or grab. Each task consisted of only grab or only pinch. Each subject conducted four grab tasks and four pinch tasks. Additionally, virtual objects were generated only one time in the same position in one task. Therefore, subjects performed interactions with virtual objects at 27 positions for one task. The number of prediction successes for the entire task is shown in Table 10 and Table 11.
Table 10 shows the number of prediction successes measured in the task for grab. As a result of a calculation based on Table 10, in the grab case, the mean and the standard deviation were 21.25 and 3.40, respectively, and the average prediction success rate was 78.70%.
Table 11 shows the number of prediction successes measured in the task for pinch. As a result of a calculation based on Table 11, in the grab case, the mean and the standard deviation were 23.93 and 4.04, respectively, and the average prediction success rate was 88.62%. Figure 10 shows the average number of interaction prediction successes with respect to subject for each gesture.
Although sufficient explanation was given before the experiment, there were cases in which the subjects performed wrong actions: a pinch or a none gesture in a grab task, or a grab or a none gesture in a pinch task. To properly evaluate the proposed method, we needed to confirm not only the prediction success rate, but also false positives and false negatives. Therefore, we reviewed all cases to check how often the algorithm produces false positives and false negatives. For this, we compared the subjects’ real action data to the prediction results of the proposed method. The result is shown in Table 12 and Table 13.

4.3.3. Interaction Latency

The interaction latency was measured when the proposed method was applied and when it was not. The former means time from the moment when the virtual object for interaction appears to the moment when the prediction is completed by the proposed method. The latter means time from the moment when the virtual object for interaction appears to the moment when the interaction with the virtual object is really performed. The comparison result of the average interaction latency for each subject is shown in Figure 11.
The red arrows in Figure 11 show the reduction of interaction latency by applying the proposed method. To confirm more precisely whether the time differences, such as the red arrows, are significant, a paired-sample t-test was performed for the average interaction latency with respect to the subject. Table 14 shows the results of the normality test to perform the paired-sample t-test.
As a result of the normality test, as shown in Table 14, the significance level (red boxes in Table 14) of both the Kolmogorov–Smirnov and the Shapiro–Wilk test was greater than 0.05, so the average interaction latency data satisfy the normal distribution. Since the measured data satisfy the normal distribution, a paired-sample t-test was performed, and the result is shown in Table 15 and Table 16.
As a result of the paired-sample t-test, as shown in Table 15, it was confirmed that the interaction latency (red box in Table 15) in the ‘With proposed method’ case (1.3815 s) was further reduced, compared to the ‘Without proposed method’ case (1.5718 s).
The significance level (red box in Table 16) of the paired-sample t-test was less than 0.05, so the null hypothesis of the paired-sample t-test was rejected. Therefore, from the above results, it was confirmed that the interaction latency was significantly reduced (by an average of 12.1%) with the proposed method compared to the one without the proposed method.
As a result of the experiment, we confirmed that the interaction latency in the ‘With proposed method’ case (1.3815 s) was further reduced by 12.1%, compared to the ‘Without proposed method’ case (1.5718 s), and through this, we examined that the proposed method is effective for reducing interaction latency.

4.3.4. Motion Sickness in Experiment

One of the main issues with MR is whether motion sickness occurs. In the case of the see-through device, there are studies showing that the effect on motion sickness is insignificant [30], but there are also studies showing that it has a similar degree of motion sickness to HMD devices [31]. Motion sickness, once developed, has a significant impact on the usability of MR applications, which can affect the study results. Therefore, in this study, the motion sickness condition of subjects was measured through pre- and post-questionnaires, including SSQ, to confirm whether motion sickness that could affect the study results occurred, and the measured results are shown in Figure 12.
From Figure 12, it was confirmed that there is some difference in the average SSQ scores of the subjects measured through the pre- and post-questionnaires. To confirm whether the difference is significant, it is necessary to perform the paired-sample t-test for all SSQ scores. Table 17 and Table 18 show the results of the normality test obtained by the paired-sample t-test, respectively.
As a result of the normality test, as shown in Table 17 and Table 18, in the case of nausea (pre-questionnaires), oculomotor discomfort (post-questionnaires), and total score (post-questionnaires), the significance level (red boxes in Table 17 and Table 18) of both the Kolmogorov–Smirnov and the Shapiro–Wilk test was greater than 0.05. However, in the case of all other measured values, the significance level of both the Kolmogorov–Smirnov and the Shapiro–Wilk test was less than 0.05, so SSQ score data did not satisfy the normal distribution.
Since the entire data could not satisfy normal distribution, a Wilcoxon signed rank test, which is a non-parametric test, was performed instead of a paired-sample t-test, and the result is shown in Table 19.
As a result of the Wilcoxon signed rank test, as shown in Table 19, the significance level (red box in Table 19) of all the scores (nausea, oculomotor discomfort, disorientation, total score) was greater than 0.05. Based on this, it was confirmed that there is no significant difference between motion sickness measured by pre- and post-questionnaires and that the experimental results in this study were not affected by motion sickness.

5. Conclusions and Future Works

In this paper, we proposed an interaction prediction method for reducing interaction latency in remote MR collaboration. The proposed method is a method to reduce interaction latency by predicting accruable interactions in remote MR collaborations. In this paper, we proposed the interaction prediction method using consecutive joint angles and conducted an experiment to examine the effectiveness of it. For the experiment, the subject wore a Microsoft Hololens2 [20] and performed interactions using grab and pinch gestures. During the experiment, interaction starting moments, interaction prediction moments, and interaction completion moments were measured, and through these, interaction latencies with and without the proposed method were compared. As a result of the experiment, we confirmed that the interaction latency in the ‘With proposed method’ case (1.3815 s) was further reduced, compared to the ‘Without proposed method’ case (1.5718 s), and through this, we examined that the proposed method is effective for reducing interaction latency. Therefore, we expect the proposed method for reducing interaction latency to improve user experience in remote MR collaborations by reducing the time required for transmitting human–VO interaction information. In addition, the proposed method could be applied to various remote MR collaboration applications, such as education, games, and industry, and it is expected to increase user satisfaction. The study results were obtained by applying k-NN, a simple classification algorithm, with a small dataset (300 data samples per gesture) based on representative gestures (grab and pinch). This study did not consider a penalty when predictions failed. Thus, future works may include an experiment that considers the time penalty in wrong prediction cases and feature extensions into applying advanced algorithms and a larger number of subjects.

Author Contributions

Conceptualization, Y.C. and Y.S.K.; methodology, Y.C. and Y.S.K.; software, Y.C.; validation, Y.C.; formal analysis, Y.C.; investigation, Y.S.K.; resources, W.S.; data curation, Y.C.; writing—original draft preparation, Y.C. and Y.S.K.; writing—review and editing, W.S. and Y.S.K.; visualization, Y.C.; supervision, Y.S.K.; project administration, Y.S.K.; funding acquisition, Y.S.K. All authors have read and agreed to the published version of the manuscript.

Funding

This research received no external funding.

Institutional Review Board Statement

The study was conducted according to the guidelines of the Declaration of Helsinki, and approved by the Institutional Review Board of KOREATECH (approved on 16 July 2020).

Informed Consent Statement

Informed consent was obtained from all subjects involved in the study.

Data Availability Statement

Not applicable.

Acknowledgments

This work was supported by the Electronics and Telecommunications Research Institute(ETRI) grant, funded by the ICT R&D program of MSIT/IITP [No. 2020-0-00537, Development of 5G based low latency device—edge cloud interaction technology]. This work was partially supported by the National Research Foundation (NRF) of Korea Grant, funded by the Korean Government (MSIT) (NRF-2020R1F1A1076114).

Conflicts of Interest

The authors declare no conflict of interest.

References

  1. Waizenegger, L.; McKenna, B.; Cai, W.; Bendz, T. An affordance perspective of team collaboration and enforced working from home during COVID-19. Eur. J. Inf. Syst. 2020, 29, 429–442. [Google Scholar] [CrossRef]
  2. Embrett, M.; Liu, R.H.; Aubrecht, K.; Koval, A.; Lai, J. Thinking together, working apart: Leveraging a community of practice to facilitate productive and meaningful remote collaboration. Int. J. Health Policy Manag. 2020, 10, 528–533. [Google Scholar] [CrossRef] [PubMed]
  3. Zoom. Available online: https://zoom.us (accessed on 1 August 2021).
  4. Remote Meeting. Available online: https://www.remotemeeting.com (accessed on 1 August 2021).
  5. GoToMeeting. Available online: https://www.gotomeeting.com/ (accessed on 1 August 2021).
  6. Teo, T.; Lee, G.A.; Billinghurst, M.; Adcock, M. Merging Live and Static 360 Panoramas Inside a 3D Scene for Mixed Reality Remote Collaboration. In Proceedings of the 2019 IEEE International Symposium on Mixed and Augmented Reality Adjunct (ISMAR-Adjunct), Beijing, China, 10–18 October 2019; IEEE: Piscataway, NJ, USA; pp. 22–25. [Google Scholar]
  7. Bai, H.; Sasikumar, P.; Yang, J.; Billinghurst, M. A user study on mixed reality remote collaboration with eye gaze and hand gesture sharing. In Proceedings of the 2020 CHI Conference on Human Factors in Computing Systems, Honolulu, HI, USA, 25–30 April 2020; Association for Computing Machinery: New York, NY, USA, 2020; pp. 1–13. [Google Scholar]
  8. Pidel, C.; Ackermann, P. Collaboration in virtual and augmented reality: A systematic overview. In Proceedings of the Augmented Reality, Virtual Reality, and Computer Graphics AVR 2020 Lecture Notes in Computer Science, Lecce, Italy, 7–10 September 2020; Springer: Cham, Switzerland, 2020; Volume 12242, pp. 141–156. [Google Scholar]
  9. Pouliquen-Lardy, L.; Milleville-Pennel, I.; Guillaume, F.; Mars, F. Remote collaboration in virtual reality: Asymmetrical effects of task distribution on spatial processing and mental workload. Virtual Real. 2016, 20, 213–220. [Google Scholar] [CrossRef]
  10. Elbamby, M.S.; Perfecto, C.; Bennis, M.; Doppler, K. Toward low-latency and ultra-reliable virtual reality. IEEE Netw. 2018, 32, 78–84. [Google Scholar] [CrossRef] [Green Version]
  11. Zheng, F.; Whitted, T.; Lastra, A.; Lincoln, P.; State, A.; Maimone, A.; Fuchs, H. Minimizing latency for augmented reality displays: Frames considered harmful. In Proceedings of the 2014 IEEE International Symposium on Mixed and Augmented Reality (ISMAR), Munich, Germany, 10–12 September 2014; IEEE: Piscataway, NJ, USA, 2014; pp. 195–200. [Google Scholar]
  12. Chen, K.; Li, T.; Kim, H.S.; Culler, D.E.; Katz, R.H. Marvel: Enabling mobile augmented reality with low energy and low latency. In Proceedings of the 16th ACM Conference on Embedded Networked Sensor Systems, Shenzhen, China, 4–7 November 2018; Association for Computing Machinery: New York, NY, USA, 2018; pp. 292–304. [Google Scholar]
  13. Mine, M.R. Characterization of End-to-End Delays in Head-Mounted Display Systems; TR93-001; The University of North Carolina at Chapel Hill: Chapel Hill, NC, USA, 1993. [Google Scholar]
  14. Oyekan, J.; Prabhu, V.; Tiwari, A.; Baskaran, V.; Burgess, M.; Mcnally, R. Remote real-time collaboration through synchronous exchange of digitised human–workpiece interactions. Future Gener. Comput. Syst. 2017, 67, 83–93. [Google Scholar] [CrossRef] [Green Version]
  15. Wang, P.; Bai, X.; Billinghurst, M.; Zhang, S.; Han, D.; Sun, M.; Wang, Z.; Lv, H.; Han, S. Haptic feedback helps me? A VR-SAR remote collaborative system with tangible interaction. Int. J. Hum. -Comput. Interact. 2020, 36, 1242–1257. [Google Scholar] [CrossRef]
  16. Kwon, J.U.; Hwang, J.I.; Park, J.; Ahn, S.C. Fully Asymmetric Remote Collaboration System. IEEE Access 2019, 7, 54155–54166. [Google Scholar] [CrossRef]
  17. Coburn, J.Q.; Salmon, J.L.; Freeman, I. Effectiveness of an immersive virtual environment for collaboration with gesture support using low-cost hardware. J. Mech. Des. 2018, 140, 042001. [Google Scholar] [CrossRef] [Green Version]
  18. Rhee, T.; Thompson, S.; Medeiros, D.; Dos Anjos, R.; Chalmers, A. Augmented virtual teleportation for high-fidelity telecollaboration. IEEE Trans. Vis. Comput. Graph. 2020, 26, 1923–1933. [Google Scholar] [CrossRef] [PubMed]
  19. Ens, B.; Lanir, J.; Tang, A.; Bateman, S.; Lee, G.; Piumsomboon, T.; Billinghurst, M. Revisiting collaboration through mixed reality: The evolution of groupware. Int. J. Hum. -Comput. Stud. 2019, 131, 81–98. [Google Scholar] [CrossRef]
  20. Piumsomboon, T.; Clark, A.; Billinghurst, M.; Cockburn, A. User-defined gestures for augmented reality. In Proceedings of the IFIP Conference on Human-Computer Interaction—INTERACT 2013 Lecture Notes in Computer Science, Cape Town, South Africa, 2–6 September 2013; Springer: Berlin/Heidelberg, Germany, 2013; Volume 8118, pp. 282–299. [Google Scholar]
  21. Microsoft HoloLens2. Available online: https://www.microsoft.com/en-us/hololens/hardware (accessed on 1 August 2021).
  22. Vive. Available online: https://www.vive.com/us/ (accessed on 1 August 2021).
  23. Attig, C.; Rauh, N.; Franke, T.; Krems, J.F. System latency guidelines then and now–is zero latency really considered necessary? In Proceedings of the Engineering Psychology and Cognitive Ergonomics: Cognition and Design, EPCE 2017, Lecture Notes in Computer Science, Vancouver, BC, Canada, 9–14 July 2017; Springer: Cham, Switzerland, 2017; Volume 10276, pp. 3–14. [Google Scholar]
  24. Bozgeyikli, E.; Bozgeyikli, L.L. Evaluating Object Manipulation Interaction Techniques in Mixed Reality: Tangible User Interfaces and Gesture. In Proceedings of the 2021 IEEE Virtual Reality and 3D User Interfaces (VR), Lisboa, Portugal, 27 March–1 April 2021; IEEE: Piscataway, NJ, USA, 2021; pp. 778–787. [Google Scholar]
  25. Trigueiros, P.; Ribeiro, F.; Reis, L.P. A comparison of machine learning algorithms applied to hand gesture recognition. In Proceedings of the 7th Iberian Conference on Information Systems and Technologies (CISTI 2012), Madrid, Spain, 20–23 June 2012; IEEE: Piscataway, NJ, USA, 2012; pp. 1–6. [Google Scholar]
  26. Wang, Y.; Wang, S.; Zhou, M.; Jiang, Q.; Tian, Z. TS-I3D based hand gesture recognition method with radar sensor. IEEE Access 2019, 7, 22902–22913. [Google Scholar] [CrossRef]
  27. Dey, A.; Billinghurst, M.; Lindeman, R.W.; Swan, J. A systematic review of 10 years of augmented reality usability studies: 2005 to 2014. Front. Robot. AI 2018, 5, 37. [Google Scholar] [CrossRef] [PubMed] [Green Version]
  28. Kennedy, R.S.; Lane, N.E.; Berbaum, K.S.; Lilienthal, M.G. Simulator sickness questionnaire: An enhanced method for quantifying simulator sickness. Int. J. Aviat. Psychol. 1993, 3, 203–220. [Google Scholar] [CrossRef]
  29. IBM Corp. IBM SPSS Statistics for Windows, Version 21.0; Released 2012; IBM Corp: Armonk, NY, USA, 2012. [Google Scholar]
  30. Vovk, A.; Wild, F.; Guest, W.; Kuula, T. Simulator sickness in augmented reality training using the Microsoft HoloLens. In Proceedings of the 2018 CHI Conference on Human Factors in Computing Systems, Montreal, QC, Canada, 21–26 April 2018; Association for Computing Machinery: New York, NY, USA, 2018; pp. 1–9. [Google Scholar]
  31. Pettijohn, K.A.; Peltier, C.; Lukos, J.R.; Norris, J.N.; Biggs, A.T. Virtual and augmented reality in a simulated naval engagement: Preliminary comparisons of simulator sickness and human performance. Appl. Ergon. 2020, 89, 103200. [Google Scholar] [CrossRef] [PubMed]
Figure 1. Example of saving time based on predictions.
Applsci 11 10693 g001
Figure 2. Joint trajectories with respect to grab and pinch gestures (right hand): (a) grab (at start); (b) grab (at end); (c) grab (combined (a,b)); (d) pinch (at start); (e) pinch (at end); (f) pinch (combined (d,e)).
Applsci 11 10693 g002
Figure 3. Degree of change with respect to each joint information according to grab and pinch gestures: (a) grab; (b) pinch.
Applsci 11 10693 g003
Figure 4. Cases that the tip joint greatly change: (a) case of right angle; (b) case of diagonal.
Applsci 11 10693 g004
Figure 5. Joint angles ( θ 1 θ 5 ) for each finger used as representative values: (a) back of the right hand; (b) palm of the right hand.
Applsci 11 10693 g005
Figure 6. Example of deriving consecutive joint angles.
Applsci 11 10693 g006
Figure 7. Interaction prediction procedure of the proposed method.
Applsci 11 10693 g007
Figure 8. The experimental environment allows a user to see and interact with virtual objects in the virtual object generation space (the dotted circle).
Applsci 11 10693 g008
Figure 9. Task time of each subject measured during the experiment.
Applsci 11 10693 g009
Figure 10. The average number of interaction predictions, with respect to gesture, for each subject.
Applsci 11 10693 g010
Figure 11. Comparison of the average interaction latency (with/without the proposed method) for each subject.
Applsci 11 10693 g011
Figure 12. Average SSQ scores of subjects measured through pre- and post-questionnaires.
Applsci 11 10693 g012
Table 1. Results of the normality test with the k value as 3, 5, and 7 (average prediction time for each subject).
k-NNKolmogorov–Smirnov 1Shapiro–Wilk
StatisticdfSig.StatisticdfSig.
30.19370.2000 *0.92670.514
50.19470.2000 *0.92370.490
70.19070.2000 *0.92270.485
* This is a lower bound of the true significance. 1 Lilliefors Significance Correction.
Table 2. Results of the test for equality of variance (average prediction time for each subject).
Levene Statisticdf1df2Sig.
0.0012180.999
Table 3. Results of one-way ANOVA with the k value as 3, 5, and 7 (average prediction time for each subject).
Sum of SquaresdfMean SquareFSig.
Between Groups0.00020.0000.0001.000
Within Groups4.101180.228
Total4.10120
Table 4. Results of the normality test with the k value as 3, 5, and 7 (prediction success rate of grab gestures for each subject).
k-NNKolmogorov–Smirnov 1Shapiro–Wilk
StatisticdfSig.StatisticdfSig.
30.20270.2000 *0.92770.527
50.15070.2000 *0.92370.497
70.16370.2000 *0.90970.391
* This is a lower bound of the true significance. 1 Lilliefors Significance Correction.
Table 5. Results of the test for equality of variance (prediction success rate of grab gestures for each subject).
Levene Statisticdf1df2Sig.
0.0312180.969
Table 6. Results of one-way ANOVA with the k value as 3, 5, and 7 (prediction success rate of grab gesture for each subject).
Sum of SquaresdfMean SquareFSig.
Between Groups0.00220.0010.0590.943
Within Groups0.234180.013
Total0.23620
Table 7. Results of the normality test with the k value as 3, 5, and 7 (prediction success rate of pinch gesture for each subject).
k-NNKolmogorov–Smirnov 1Shapiro–Wilk
StatisticDfSig.StatisticDfSig.
30.20670.2000 *0.90870.380
50.21070.2000 *0.84470.108
70.21570.2000 *0.84870.118
* This is a lower bound of the true significance. 1 Lilliefors Significance Correction.
Table 8. Results of the test for equality of variance (prediction success rate of pinch gesture for each subject).
Levene Statisticdf1df2Sig.
0.0062180.994
Table 9. Results of one-way ANOVA with the k value as 3, 5, and 7 (prediction success rate of pinch gesture for each subject).
Sum of SquaresdfMean SquareFSig.
Between Groups0.00220.0000.0170.984
Within Groups0.252180.014
Total0.25220
Table 10. Number of prediction successes: grab.
Trial No.No. of Successful Predictions
Subject 1Subject 2Subject 3Subject 4Subject 5Subject 6Subject 7
124211522182317
225232025142016
325212126192220
426252423182418
Table 11. Number of prediction successes: pinch.
Trial No.No. of Successful Predictions
Subject 1Subject 2Subject 3Subject 4Subject 5Subject 6Subject 7
126222412272027
226132623272627
325192327262327
425192725272427
Table 12. Number of false positives (FP) and false negatives (FN): grab.
Trial No.No. of Successful Predictions
Subject 1Subject 2Subject 3Subject 4Subject 5Subject 6Subject 7
FPFNFPFNFPFNFPFNFPFNFPFNFPFN
101010802220005
202022300150306
312002301210115
411001101220024
Table 13. Number of false positives (FP) and false negatives (FN): pinch.
Trial No.No. of Successful Predictions
Subject 1Subject 2Subject 3Subject 4Subject 5Subject 6Subject 7
FPFNFPFNFPFNFPFNFPFNFPFNFPFN
101020308000500
201080122001100
302240400010400
402140012001300
Table 14. Results of the normality test for average interaction latency for each subject.
Kolmogorov–Smirnov 1Shapiro–Wilk
StatisticdfSig.StatisticdfSig.
With proposed method0.19370.200 *0.92670.514
Without proposed method0.16770.200 *0.94970.719
* This is a lower bound of the true significance.1 Lilliefors Significance Correction.
Table 15. Results of the paired-sample t-test for average interaction latency for each subject: statistics.
MeanNStd. DeviationStd. Error Mean
With proposed method1.381570.479670.18130
Without proposed method1.571870.487760.18436
Table 16. Results of the paired-sample t-test for average interaction latency for each subject: paired differences.
Paired DifferencestdfSig.
(2-Tailed)
MeanStd. DeviationStd. Error MeanLower 1Upper 1
With proposed method
Without proposed method
−0.190250.055240.02088−0.24134−0.13916−9.11260.000
1 A 95% confidence interval of the difference.
Table 17. Results of the normality test for SSQ scores for each subject: pre-questionnaires.
Kolmogorov–Smirnov 1Shapiro–Wilk
StatisticdfSig.StatisticdfSig.
Disorientation (D)0.31170.0390.72770.007
Nausea (N)0.22670.200 *0.89370.292
Oculomotor discomfort (O)0.38570.0020.52970.000
Total Score (TS)0.29570.0670.80670.047
* This is a lower bound of the true significance. 1 Lilliefors Significance Correction.
Table 18. Results of normality test for SSQ scores for each subject: post-questionnaires.
Kolmogorov–Smirnov 1Shapiro–Wilk
StatisticdfSig.StatisticdfSig.
Disorientation (D)0.39870.0010.58270.000
Nausea (N)0.42170.0000.64670.001
Oculomotor discomfort (O)0.19170.200 *0.95570.772
Total Score (TS)0.25770.1810.80770.048
* This is a lower bound of the true significance. 1 Lilliefors Significance Correction.
Table 19. Results of the Wilcoxon signed rank test for SSQ scores for each subject.
Nausea (N)
Pre–Post
Oculomotor Discomfort (O)
Pre–Post
Disorientation (D)
Pre–Post
Total Score (TS)
Pre–Post
Z−0.315 1−0.944 2−0.677 1−1.633 2
Asymp. Sig.
(2-tailed)
0.7520.3450.4980.102
1 Based on positive ranks. 2 Based on negative ranks.
Publisher’s Note: MDPI stays neutral with regard to jurisdictional claims in published maps and institutional affiliations.

