Article

Association of Posture, Gait, and Auditory Functioning with Cognitive Status in a Cohort of Community-Dwelling Older Adults

1
Department of Healthcare Engineering, The Graduate School, Jeonbuk National University, 567 Baekje-daero, Deokjin-gu, Jeonju 54896, Korea
2
Division of Biomedical Engineering, College of Engineering, Jeonbuk National University, 567 Baekje-daero, Deokjin-gu, Jeonju 54896, Korea
3
Research Center for Healthcare and Walfare Instrument for the Elderly, Jeonbuk National University, 567 Baekje-daero, Deokjin-gu, Jeonju 54896, Korea
*
Author to whom correspondence should be addressed.
Emilija Kostic and Kiyoung Kwak contributed equally to this work as co-first authors.
Appl. Sci. 2021, 11(21), 9970; https://doi.org/10.3390/app11219970
Submission received: 7 September 2021 / Revised: 7 October 2021 / Accepted: 21 October 2021 / Published: 25 October 2021
(This article belongs to the Section Biomedical Engineering)

Abstract

:
Postural stability, hearing, and gait function deterioration are the risk factors associated with cognitive impairment. Although no method has been reported for treating severe cognitive impairment to date, developing an early detection model based on these risk factors could aid in slowing down or even reversing the deterioration process. In this study, the association between cognitive impairment and the combined predictive ability of sensory and gait features was assessed. Fifty-seven healthy community-dwelling men over the age of sixty-five participated in cognitive, postural stability, auditory, and level walking evaluations. They were divided into two groups: healthy control group (n = 39) and lower cognition group (n = 18), based on their Montreal cognitive assessment score. During gait, the center of mass of the cognitively impaired participants was confined to a smaller volume. Furthermore, the cognitively healthy participants were found to have better postural stability. Both groups possessed similar hearing ability; however, the cognitively impaired group made a significantly higher number of errors when repeating words or sentences. A logistic regression model utilizing each of these function quantifiers exhibited a high area under the receiver operating characteristic curve, suggesting excellent predictive ability. These models can be applied to smartphone or smart home healthcare technologies to detect the possibility of cognitive impairment, thus facilitating early detection.

1. Introduction

According to reports from the World Health Organization, approximately 55 million people worldwide live with some form of dementia, and this number keeps growing, with approximately 10 million cases every year [1]. Early diagnosis of dementia is currently challenging, especially in case of mild cognitive impairment (MCI). MCI is an early stage of memory loss or other cognitive ability loss in individuals who maintain the ability to independently perform most activities of day-to-day life. Detecting this stage of cognitive impairment would allow the actualization of early interventions and rehabilitation of cognitive function. Unfortunately, diagnosis of MCI requires a variety of assessments, such as electroencephalograph, neuroimaging, Pittsburgh bound positron emission tomography, etc. [2,3,4], which are often inaccessible due to their complexity and price.
Furthermore, a recent study has shown that a high percentage of elderly individuals with cognitive impairment consistent with dementia do not have reports of dementia-related diagnoses [5]. This means that a high number of elderly never seek professional help or receive a diagnosis, perpetuating the need for more easily accessible diagnostic tools.
To overcome the above-mentioned issues, motor and sensory functions have been examined because the sensory and motor regions of the central nervous system (CNS), such as auditory and vestibular systems, are affected by Alzheimer’s dementia (AD) pathology [6]. Deal [7] and Paik [8] reported people with dementia having hearing and vision impairments, while Yamada [9] and Mahrani [10] discovered that people with both sensory impairments had a higher incidence of dementia than those with only one sensory impairment. Additionally, people with MCI and dementia were confirmed to have low gait ability [11,12,13]. It was shown that for cognitively healthy elderly people with sensory or motor impairments at baseline, the cognitive function tends to deteriorate later in life, in contrast with the ones with no impairments at baseline. In other words, these findings suggest the possibility of detecting early cognitive impairment or predicting cases that can progress to cognitive impairment, through the use of motor and sensory functions.
Further, neurodegenerative dementias (Alzheimer’s, Lewy body, and frontotemporal dementia) were discovered to have characteristic auditory disfunctions with deteriorations in the temporal and parietal lobes [14]. Additionally, the executive function, which is dependent on the temporal lobe [15], has also been correlated with gait and balance disfunction [16].
Considering the previously mentioned difficulty and accessibility of clinical diagnosis of a prodromal stage of dementia, as well as the variety of functions affected by cognitive deterioration, easily accessible diagnostic tools which are sensitive to any form of cognitive impairment are needed. Such diagnostic tools can be implemented through motor and sensory parameters, and applied to smartphone and smart home healthcare technology, which could aid in more elderly people receiving a diagnosis early in the cognitive deterioration stage.
It is hence necessary to determine the functional differences and similarities between people who are cognitively healthy or cognitively impaired in the early stages and select the features that are best suited for discerning between them. Therefore, this study aimed to (1) compare gait, postural stability, and hearing ability of healthy and cognitively impaired participants, (2) assess the predictive ability of these functions’ parameters for classification of people with cognitive impairment and healthy elderly people, and (3) propose a logistic regression model that combines these parameters.

2. Materials and Methods

2.1. Participants

Sixty-nine healthy community-dwelling Korean men aged over 65 years were recruited. Only those with no reported history of neurodegenerative disease and no need for assistance participated in the study. The participants underwent cognitive assessment, level walking, and audiological and postural stability examinations. The examination comprised two sessions executed on two different days for each participant: first, a neuropsychological assessment and level walking examination, and second, audiological and postural stability evaluations. The demographic variables obtained were as follows: age (age of the participant at the time of the first visit), height (height of the participant measured during the first visit), weight (weight of the participant measured during the first visit), and years of education (information provided by the participant). All participants provided written informed consent prior to participating in the study. The present study’s design and protocol were approved by the Institutional Review Board of Jeonbuk national university (JBNU IRB File No.2019-09-015-001). The study design and protocol were executed in accordance with all relevant regulations regarding the use of human participants in a study, in accordance with the provisions of the Declaration of Helsinki.

2.2. Cognitive Testing
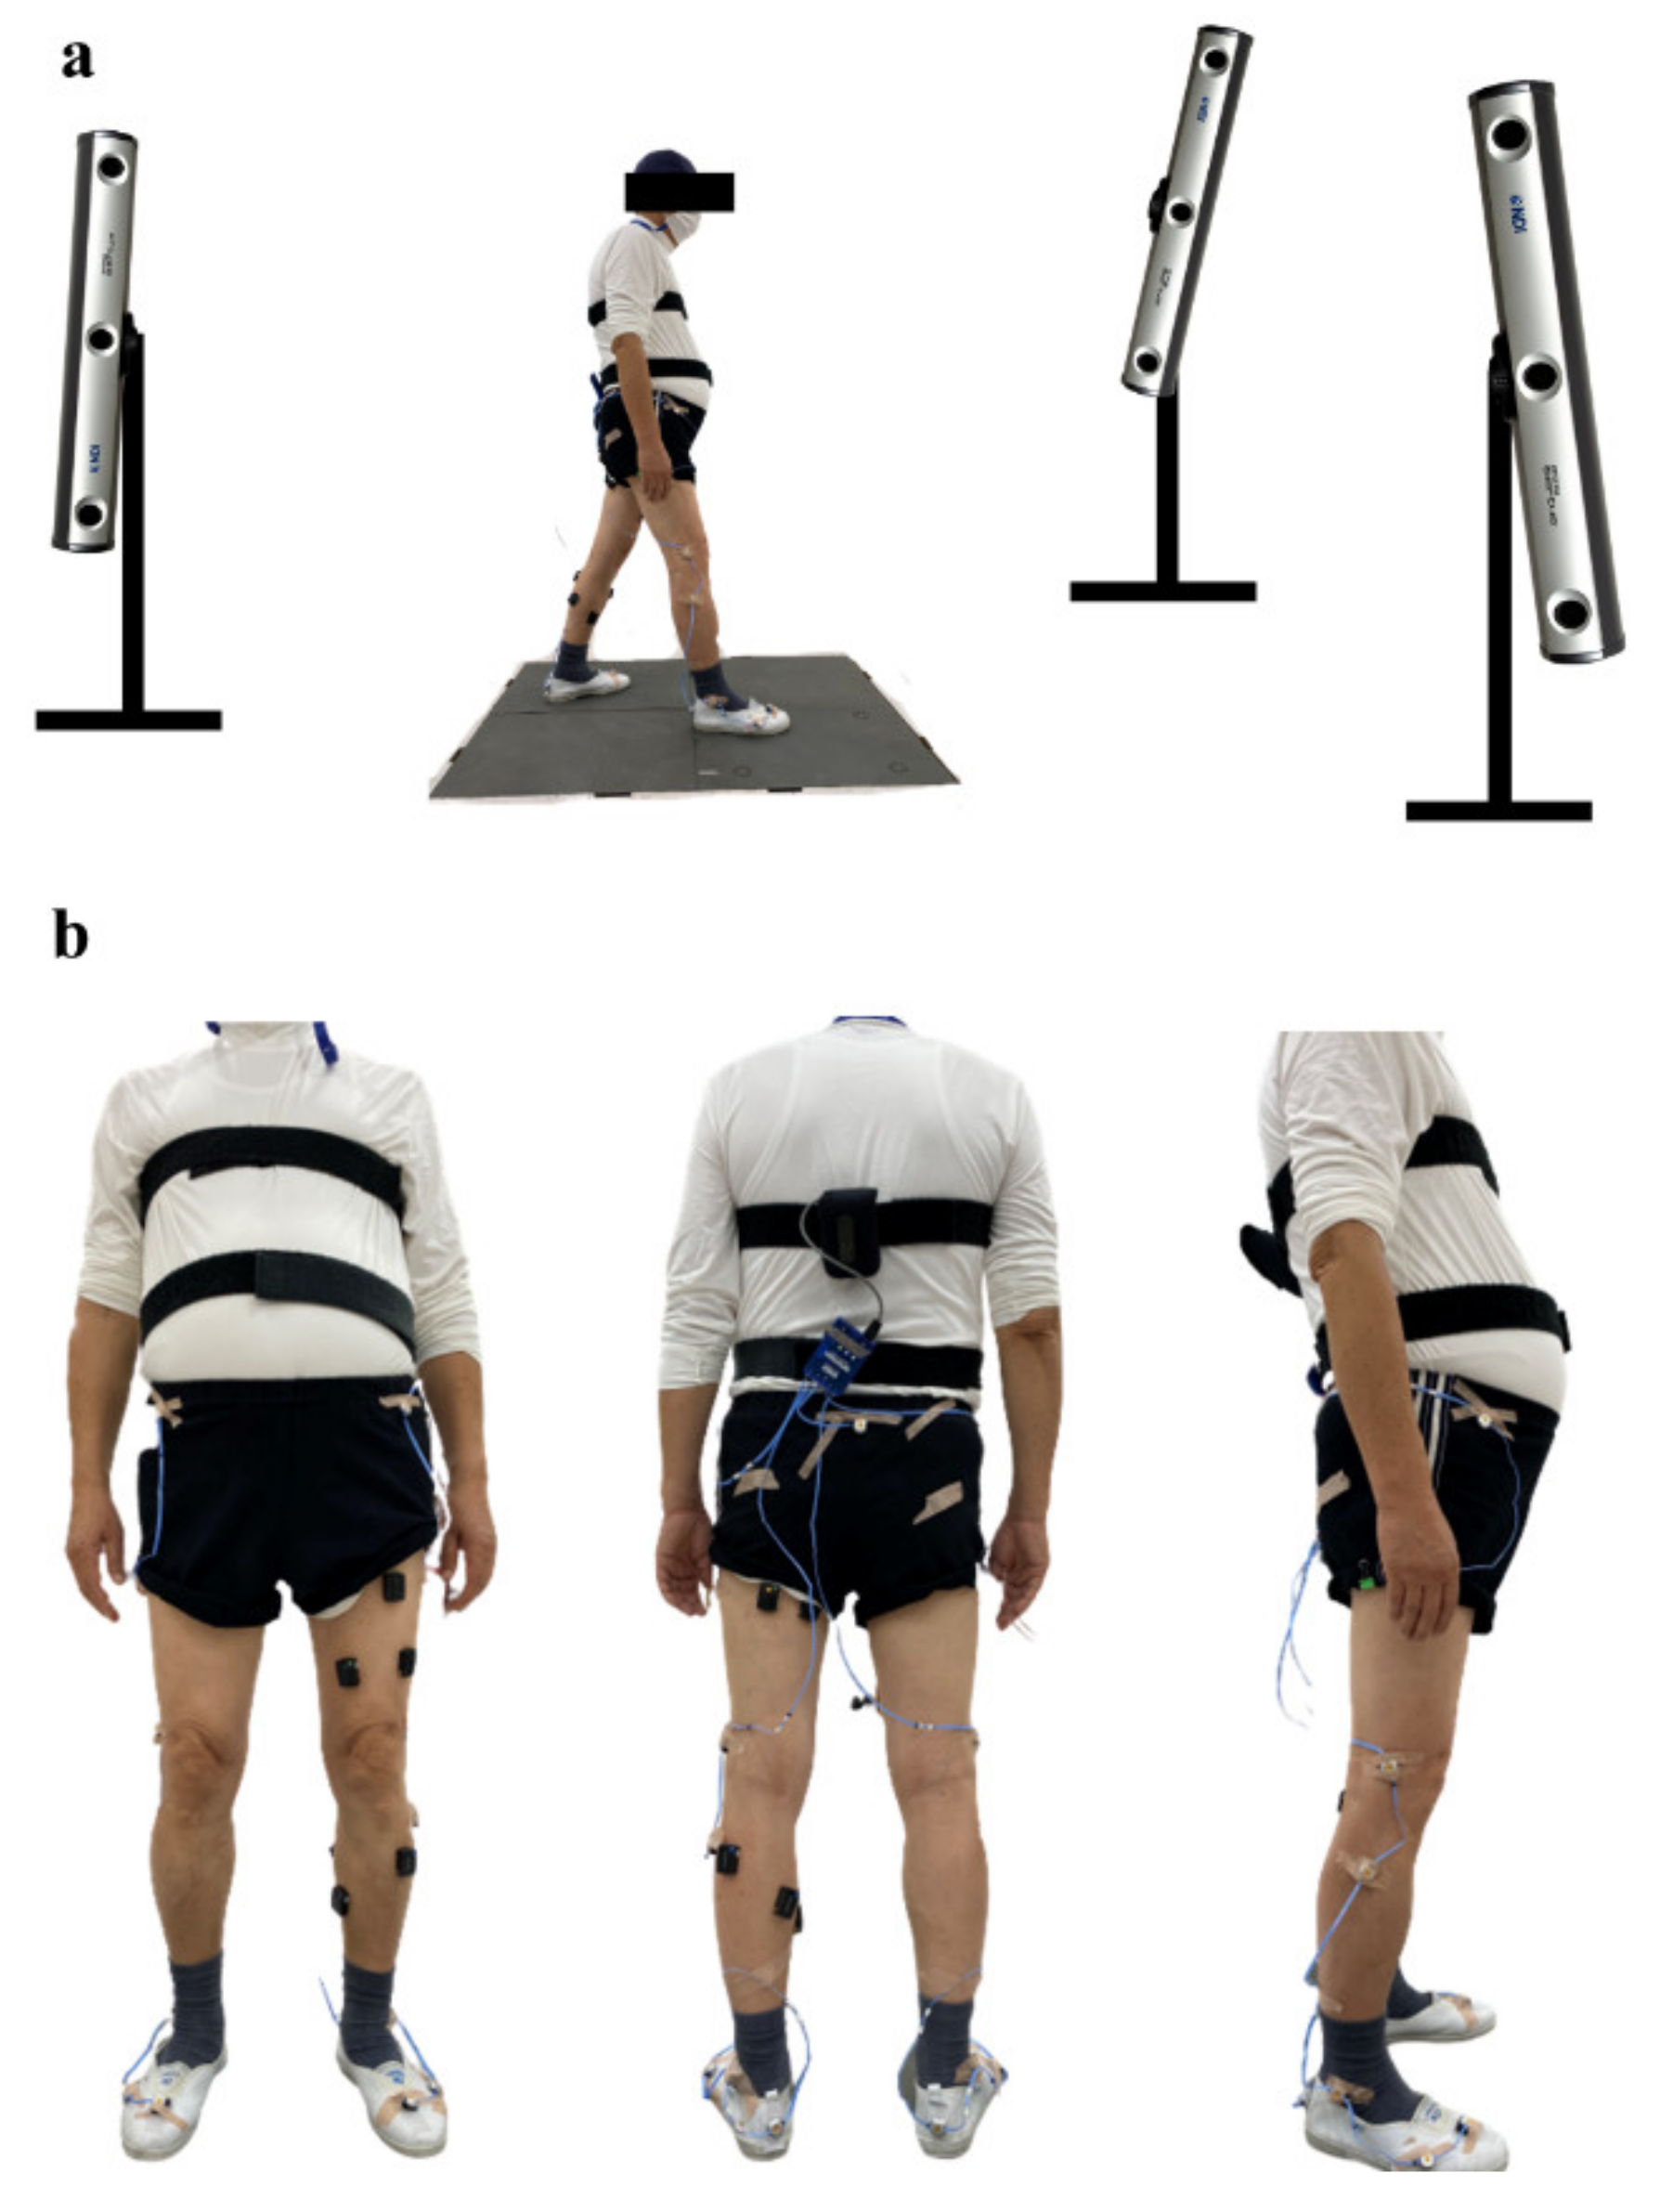
To estimate the cognitive performance and classify the participants into one of two groups: healthy control (HC) or lower cognition (LC) group, the Korean Montreal Cognitive Assessment (K-MoCA) was conducted during the first visit. The participants were classified based on the cutoff points provided in a normative study [17]. These cutoff values ranged from 6 to 26 points, depending on the age and years of education of each participant.

2.3. Level Walking

After completing the cognitive assessment, the participants proceeded with the level walking gait assessment. This was realized using a three-dimensional motion analyzer (Optotrak Certus, Northern Digital Inc., Waterloo, ON, Canada), four force plates (Bertec Ltd., Columbus, OH, USA), and motion capture software (First Principle, Northern Digital Inc., Waterloo, ON, Canada). Three position sensors were placed facing the force plates, and a total of 17 infrared light-emitting diodes (Smart marker, Northern Digital Inc., Waterloo, ON, Canada) were placed on the participants’ lower extremities in accordance with the motion module marker guide (MusculoGraphics, Inc., Santa Rosa, CA, USA), as shown in Figure 1. The employed system incorporated the standard method for motion analysis [18]. Participants were asked to walk at a self-selected pace across a 10 m long walkway. For each participant, three trials of level walking data were processed to derive the gait variables. The gait variables were derived using the human neural, musculoskeletal modeling, and analysis software (SIMM, Motion Analysis Corp., Santa Rosa, CA, USA), and normalized and ensemble averages of the three trials were calculated and used in further analysis. Center of mass (COM) trails in three-dimensional space were visualized using MATLAB R2019b (The Mathworks Inc., Natick, MA, USA), and the volume of the trail encompassing was calculated for each participant.

2.4. Audiological Exam

During the second visit, the participants underwent an audiological assessment. Korean speech audiometry tests with pre-recorded examples and an audiometer (GSI-61, Grason-Stadler, Denmark) were used, and the variables derived from the data with their respective explanations are presented as follows:
1.
PTA R and L = 0.5, 1, and 2 kHz Average Pure Tone Audiometry score for the right (R) and left (L) ears.
2.
SRT = Average Speech Recognition Threshold of both ears.
3.
WRS = Average Word Recognition Score of both ears.
4.
WRS error = Total number of errors on the word recognition test.
5.
SRS = Average Sentence Recognition Score of both ears.
6.
SRS error = Total number of errors on the sentence recognition test.
Additionally, PTA impairment was defined via the common threshold used in hearing impairment-related studies [9,19], which is PTA value > 25 dB hearing level (HL) in either ear.

2.5. Balance Function Testing

Balance system static and dynamic (Biodex Medical System. Inc., Smithtown, NY, USA) was used to measure the postural stability. The balance system platform allows for postural stability testing with different durations and numbers of trials. Three trials of 20 s measurement with 10 s rest intervals were selected to obtain this measurement. Participants were instructed to stand still in a comfortable position, eyes open, arms crossed over the chest, and both feet on the Biodex platform. The used parameters, anterior-posterior stability index (APSI), mediolateral stability index (MLSI), and the overall postural stability index (PSI), were averaged across three trials by the balance system.

2.6. Exclusion

Out of the 69 participants, 12 were excluded. The exclusion criteria were:
1.
Inadequate level walking data (disturbed digital signal obtained from position markers), 3 participants.
2.
Reported tinnitus, hearing aid or ear injury, 8 participants.
3.
Gait velocity of more than 2 standard deviations (SD) higher than the average, one participant.
The remaining 57 participants’ data were subjected to statistical analysis.

2.7. Statistical Analysis

2.7.1. Comparative Analysis

The normality of continuous variables was determined using the Shapiro–Wilk test. Based on these results, the variables with normal distribution were compared using a parametric test (Student’s t-test (t)), and the variables with a non-normal distribution were compared using a non-parametric test (Mann–Whitney test). Categorical variables were examined using the Chi-squared (χ2) test. Finally, the gait and auditory function variables that were found to be significantly correlated with the age variable were age-adjusted and assessed using ANCOVA and Quade’s non-parametric ANCOVA methods, depending on the normality of the variable. To confirm the correlation of the variables with the age variable, Pearson and Spearman’s bivariate analyses were utilized, depending on the normality of the variables.

2.7.2. Predictive Ability Assessment

After confirming the variables that exhibited a significant difference between the two groups, receiver operating characteristic (ROC) curve and area under the curve (AUC) values were determined. This was performed to simplify the logistic regression model design process and enable the selection of a few features that would produce the best models without overfitting. The AUC has been widely used to evaluate the relevance between features and binary outcomes in feature selection [20]. The predictive ability was regarded as acceptable if 0.7 ≤ AUC < 0.8, and excellent if 0.8 ≤ AUC < 0.9 [21].

2.7.3. Logistic Regression Model Design

Based on the AUC values, variables with acceptable or excellent predictive abilities were selected for inclusion in the logistic regression models. The predictive ability and significance of the effect of the variable on the result were considered when choosing the best model. Logistic regression was selected because its simplicity can be easily adjusted, by using fewer variables. Simplicity is a significant factor when selecting an algorithm to be used on small datasets, to avoid overfitting.
All statistical analyses were performed using the Statistical Package for the Social Sciences (SPSS) version 20.0.0 for Windows software (IBM Corp., Armonk, NY, USA). The level of significance for all tests was set to p < 0.05. All tests were two-tailed, and all average values were reported in the mean (SD) format, where SD represents the standard deviation.

3. Results

3.1. Comparive Analysis

3.1.1. Demographics

Of the 57 participants, 39 were classified as HC and 18 as LC. The statistical analysis of these demographics showed no significant difference, except for the age variable, where the LC group was shown to be significantly older than the HC group, as can be seen in Table 1.

3.1.2. Cognitive Function

The MoCA test consists of seven segments that evaluate visuospatial executive function, naming, attention, language, abstraction, delayed recall, and orientation. The scores for each segment and their respective p-values are presented in Table 2.
In the case of LC, the interquartile range for the MoCA score was 6.25, whereas in the case of HC it was lower, with a value of 5. The results are significantly different for every segment, except for the orientation segment, with the HC group scoring higher in each of the segments compared to the LC group.

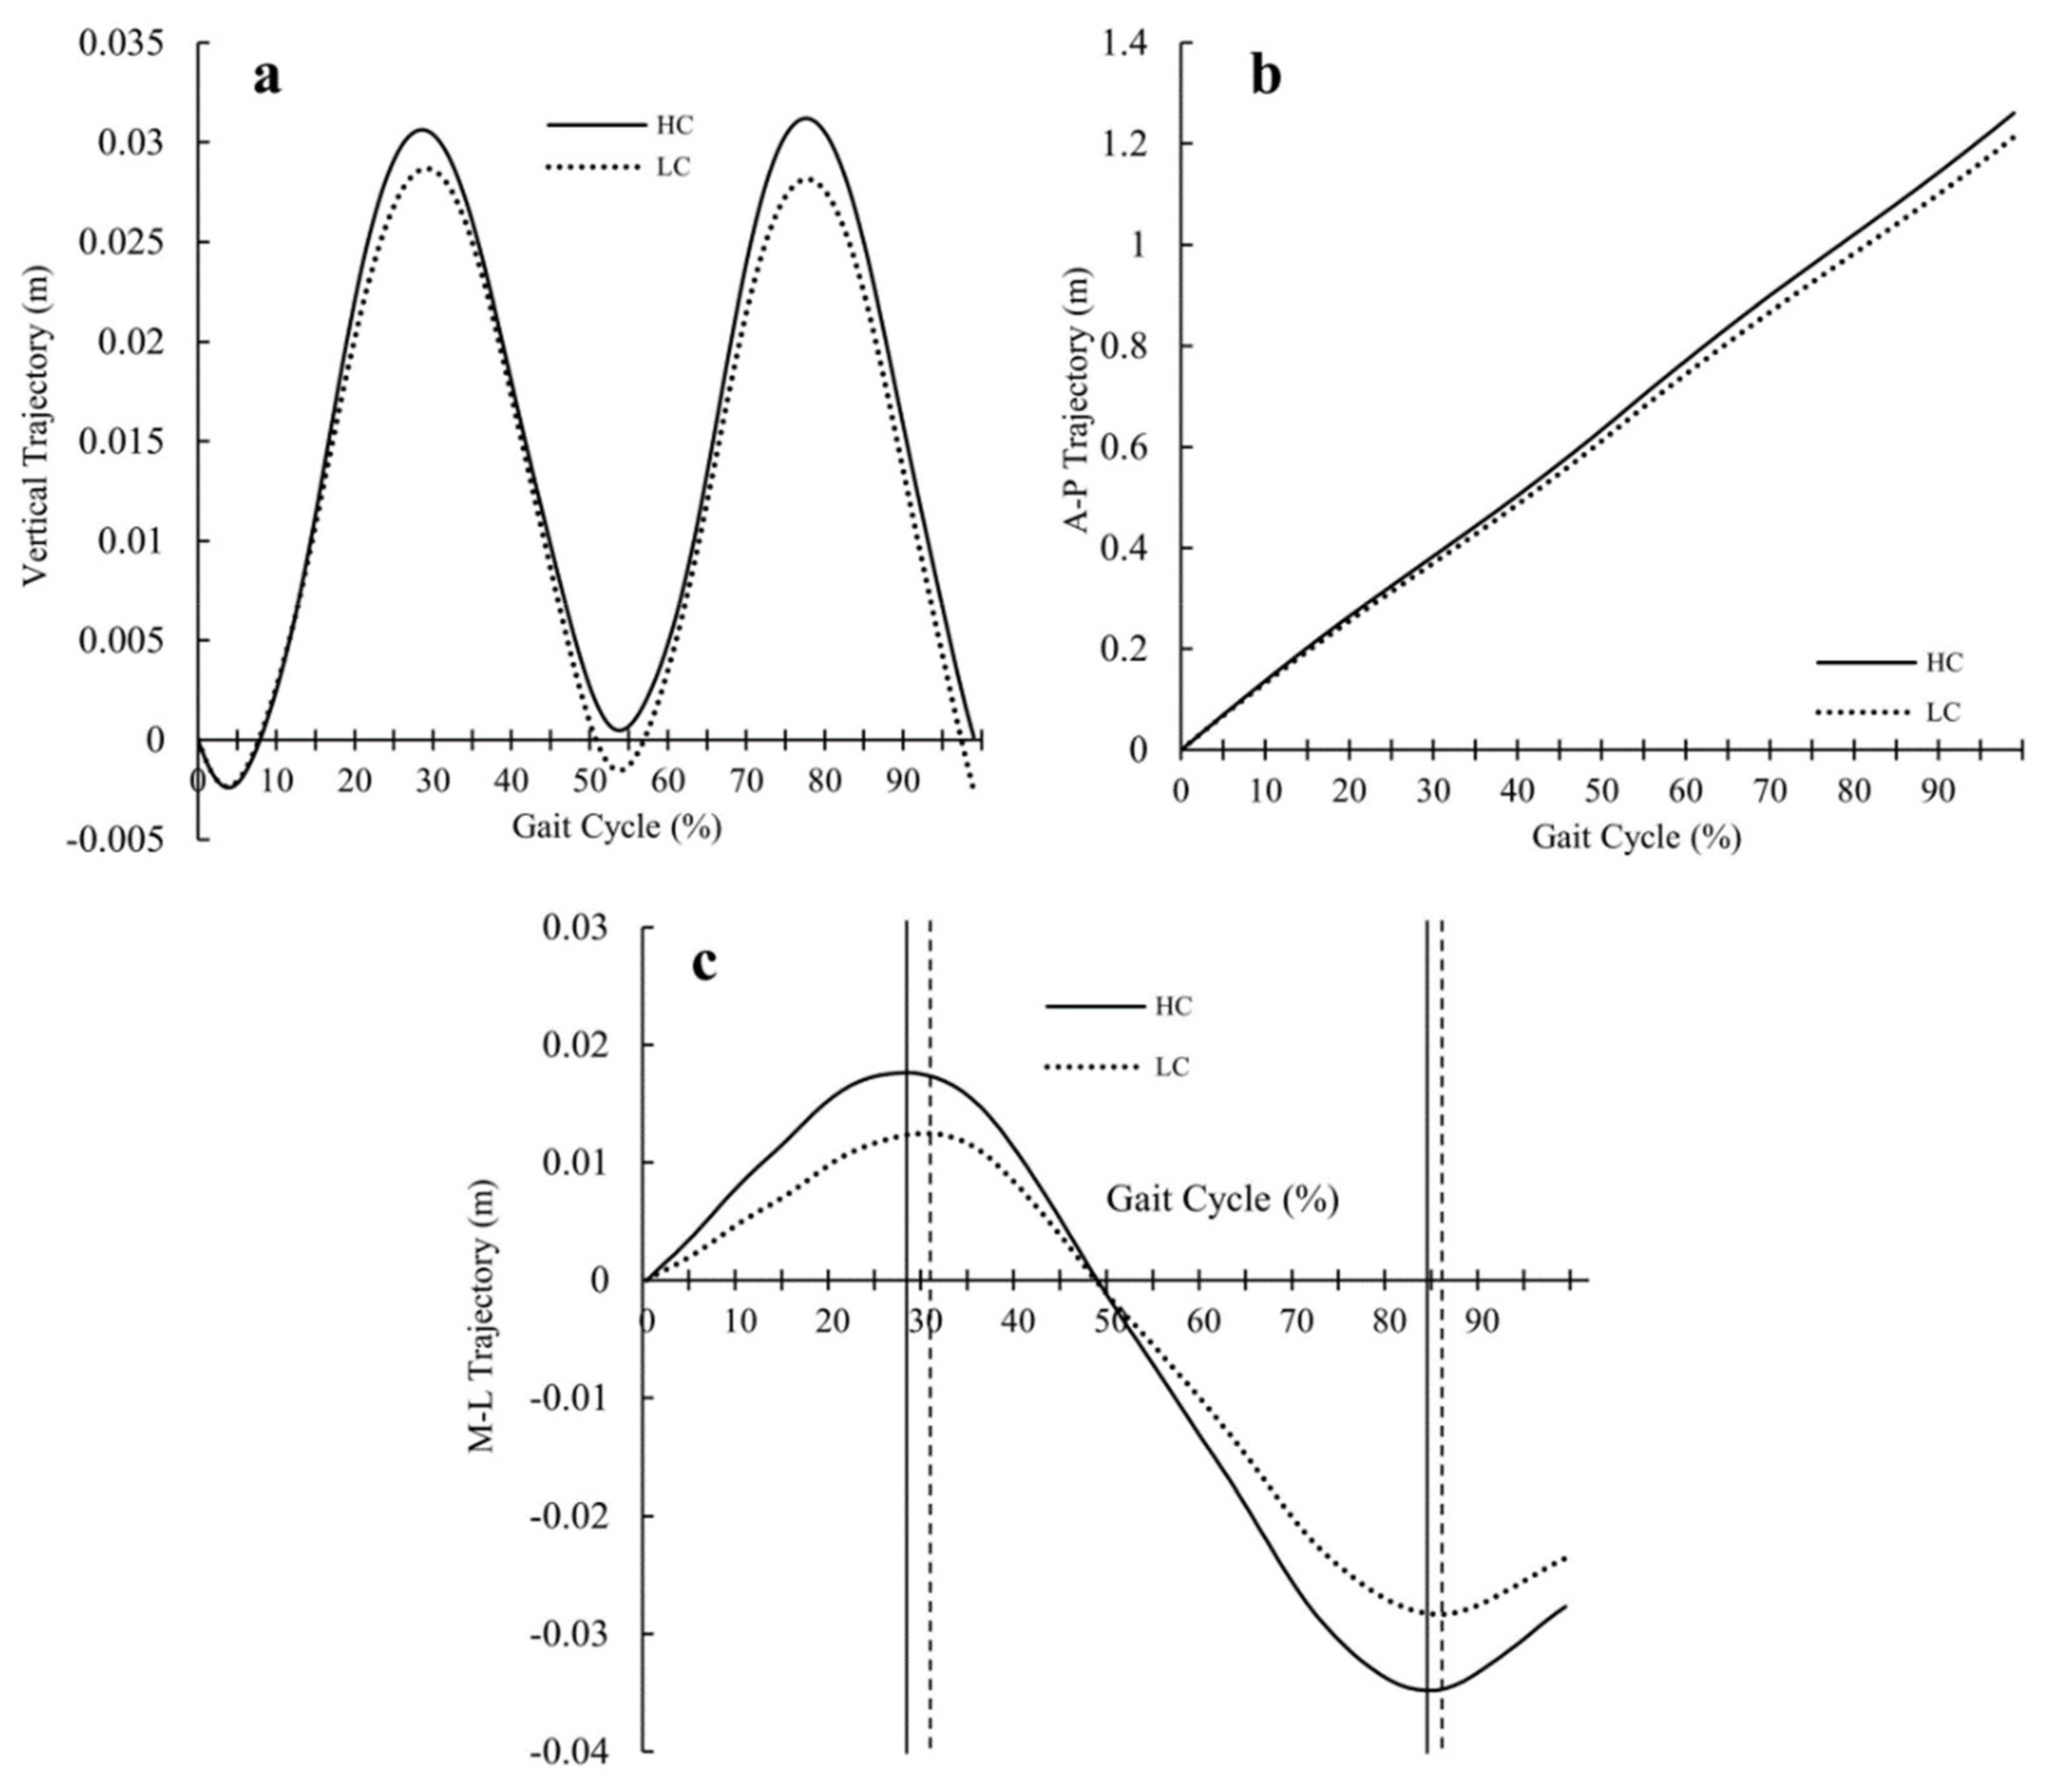
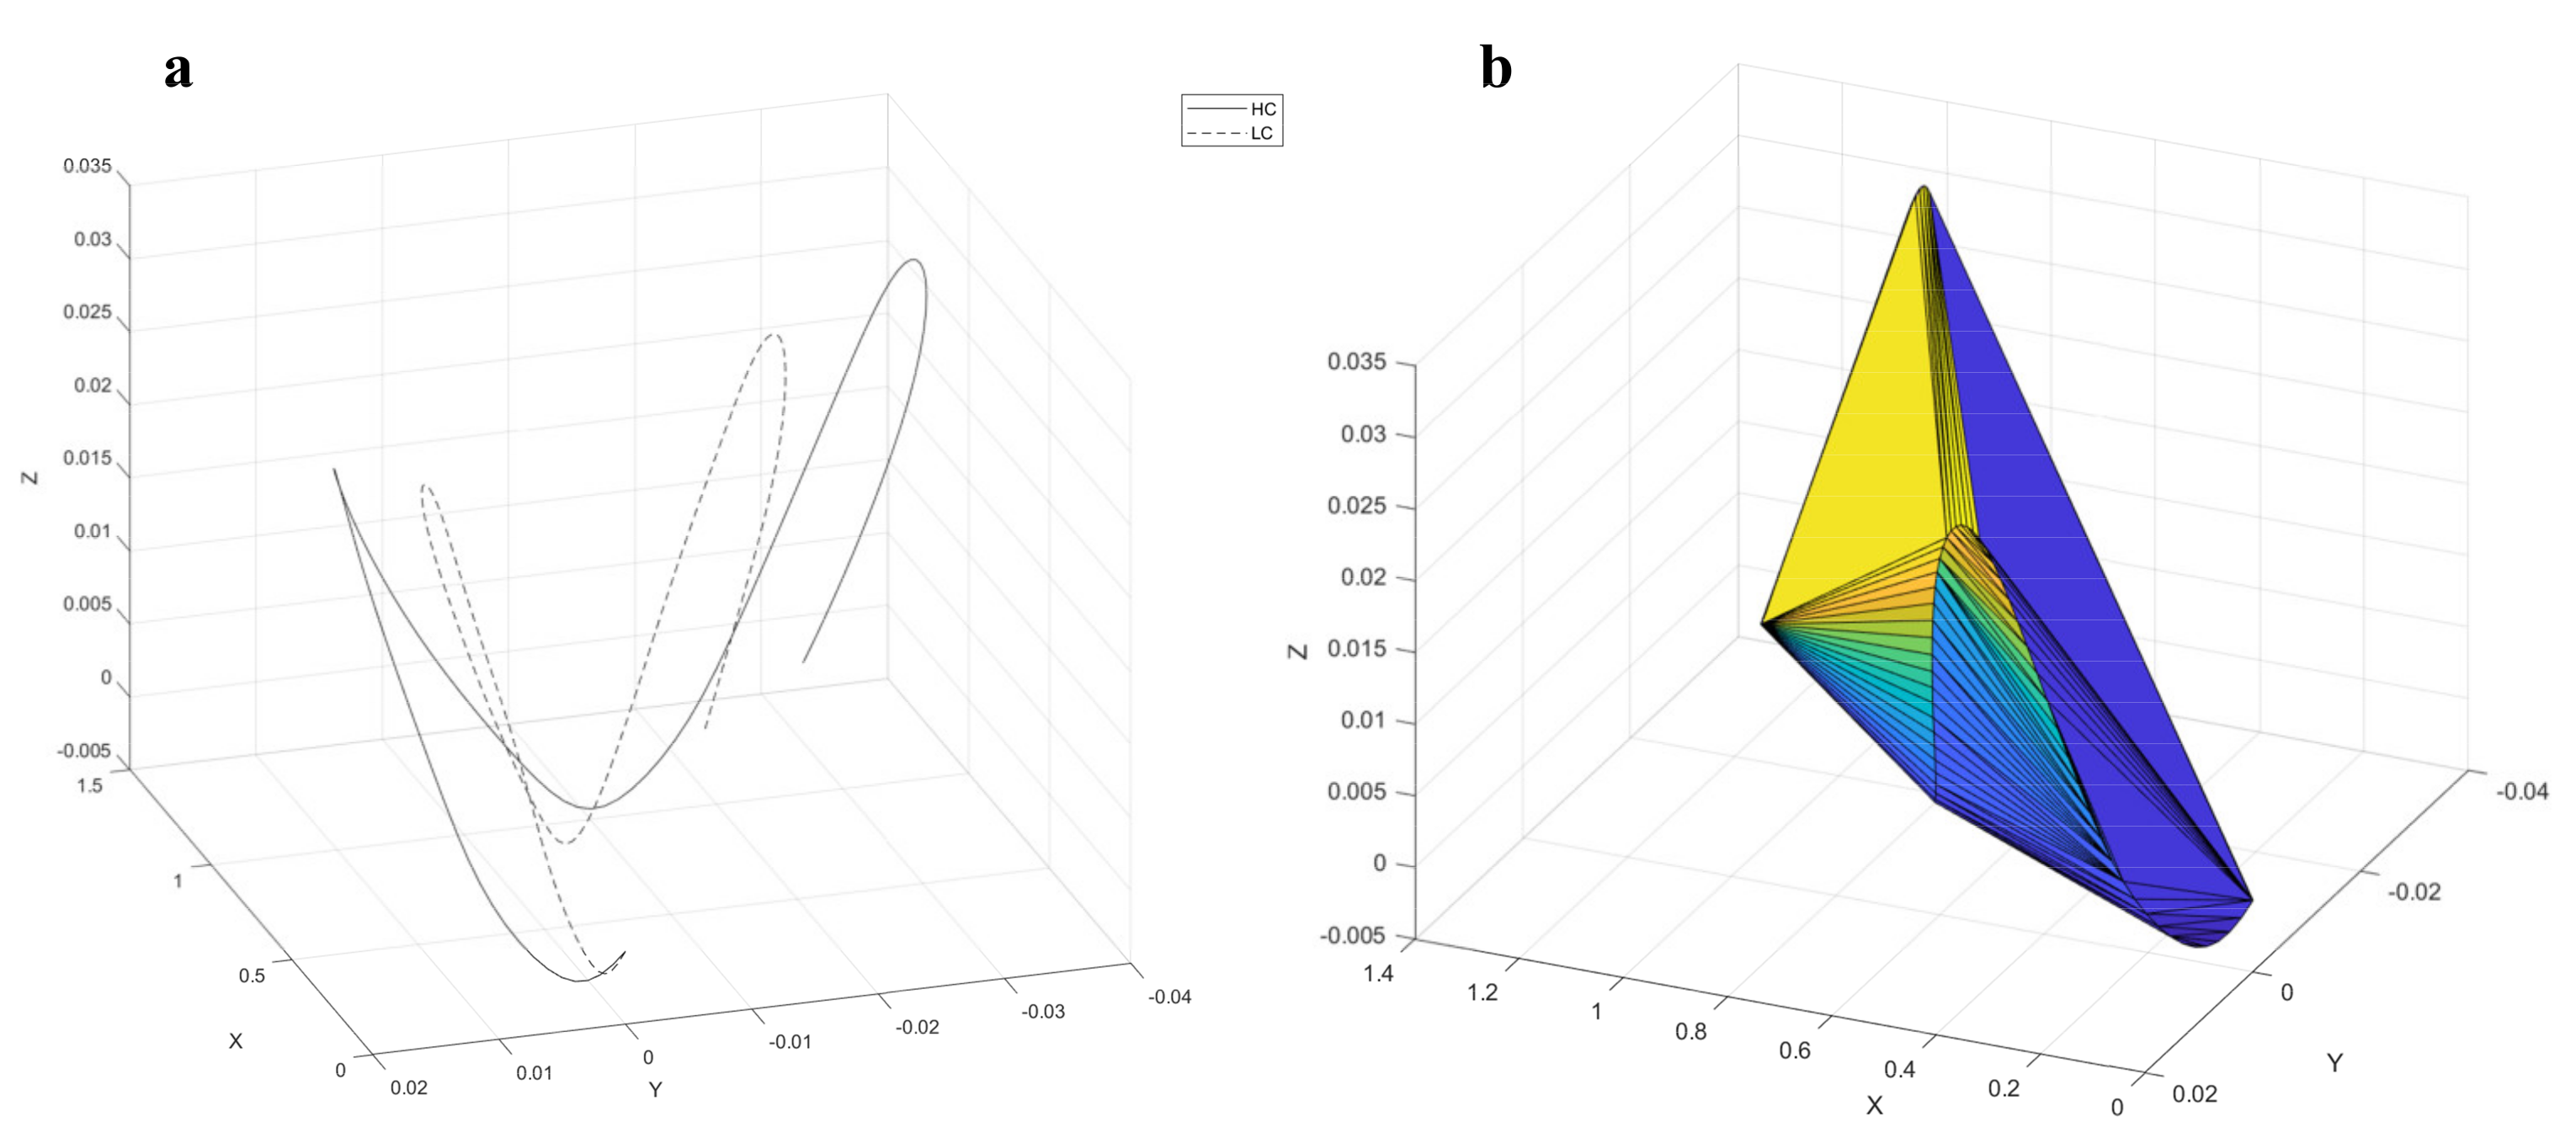
3.1.3. Level Walking

The COM trajectory graphs (Figure 2) show less vertical excursion (Figure 2a), less anterior-posterior (Figure 2b) excursion, and less mediolateral (Figure 2c) excursion in LC compared to HC. However, the comparison of average peak-to-peak values for LC and HC did not demonstrate a statistically significant difference.
The visualization of the COM trajectory in three-dimensional space (Figure 3a) illustrated a more evident difference between the two groups; moreover, the calculated volume encompassed by this trajectory (Figure 3b) was observed to be significantly smaller in LC than in HC. The mean values of these volumes are listed in Table 3.
The peak excursions in the mediolateral trajectory graph (Figure 2c) occurred later in the gait cycle of the LC in comparison to HC, exhibiting a difference in phase durations. To ascertain the significance of this observation, the following parameters were examined: percentage of gait cycle the participants spent in each of the four phases of stance (loading response (LR), mid-stance (MS), terminal stance (TS), and pre-swing (PS)), single limb support (SLS) percentage, double limb support (DLS) percentage, and the swing phase (SW) portion of the gait cycle. The average phase duration, represented as the percentage of the gait cycle, for LC and HC, and their respective p-values, are shown in Table 3.
The average LR duration and DLS duration for the LC group were significantly higher than that of the HC group. In contrast, the SLS duration was found to be significantly lower in the LC group.

3.1.4. Audiological Function

Hearing impairment (PTA > 25 dB HL in either ear) was observed in 50% of the sample, although no significant difference was found between the two groups. The results of the audiological examination are presented in Table 4. The pure tone audiometry and speech recognition threshold scores exhibited no significant difference between the LC and HC groups, although the HC group obtained better average scores. After adjusting for age, only the number of errors in the sentence recognition test was significantly different between the two groups, with HC exhibiting an overall better performance.

3.1.5. Balance Function

The mean postural indices for LC and HC as well as their respective p-values are presented in Table 5.
The results demonstrate that the mediolateral and anterior-posterior swaying when standing still were greater in the LC participants than in the HC participants. Among the three indices, the ROC curve for PSI had the highest AUC. Based on the ROC curve, an optimal cutoff value (0.75) was found, and by utilizing this cutoff, a categorical variable of PSI < 0.75 was derived. The chi-squared test revealed a significant difference between the two groups (p = 0.004), showing that there were more participants with PSI higher than 0.75 in the LC group. Specifically, 55% of LC had a PSI higher than 0.75, as opposed to 18% of HC.

3.2. Predictive Ablity and Logistic Regression Model Design

The AUC values, with a 95% confidence interval (CI), of the variables that exhibited significant differences between the two groups and have a good predictive ability (>0.7) were as follows:
(1)
Age = 0.712 (CI 95% 0.579~0.844)
(2)
SLS = 0.711 (CI 95% 0.569~0.853)
(3)
PSI = 0.725 (CI 95% 0.577~0.873)
(4)
APSI = 0.705 (CI 95% 0.555~0.856)
(5)
SRS error = 0.732 (CI 95% 0.585~0.879)
The variables that are not included above displayed a low or non-significant AUC value.
The aforementioned continuous variables and the categorical variable PSI < 0.75 were used to design logistic regression models. To avoid collinearity between the variables, the models were made to include combinations of one variable per function (gait, balance, and hearing). A dual sensory-gait model (Model 1) was found to be the best model, and was also adjusted for age (Model 2). The models include the following continuous variables: SRS error and SLS, as well as the categorical variable PSI < 0.75. Before proceeding with the analysis, some adjustments were made to the variables. Considering that it is practically impossible for a single limb stance to last 0% of the gait cycle, the SLS variable was adjusted to start from 35% instead of 0. This value was chosen as the starting point because the minimum value found in the dataset was 35.53%. A similar adjustment was made for the age variable, considering that the dataset contains only participants over the age of 65. The results of the analysis using the Wald χ2 test and the odds ratio at a 95% CI for models 1 and 2 are presented in Table 6. Based on the calculated predictions of these two models, their respective ROC curves were obtained and used to determine the predictive ability of each model. To summarize, the predictive abilities of the function quantifiers used in the logistic regression models, SLS adjusted, PSI, and SRS error, are represented by their AUC values of: 0.712, 0.725, and 0.732, respectively. In comparison, the AUC values calculated for models 1 (0.832) and 2 (0.838) were greater, indicating a better predictive ability.

4. Discussion

Old age has been found to be associated with an increased risk of dementia [22,23]; therefore, it is expected that the group of cognitively healthy participants would differ significantly from the group of cognitively impaired participants in terms of age. Both groups achieved high scores on the orientation segment. This was the expected outcome, as all the participants were healthy, highly functioning adults that had no issue arriving at the examination site without the help of a guardian. Based on the K-MoCA and orientation segment scores, it was confirmed that none of the participants in the sample lived with severely progressed dementia. The COM graphs obtained from the walking task displayed the differences in vertical, anterior-posterior, and mediolateral COM excursion peaks between HC and LC. However, when examined separately, these characteristics showed no significant differences. By plotting the excursion graphs in three-dimensional space, the differences were emphasized, which was the reason for calculating the volume of the encompassed 3D trails. Based on the results, the containment of COM in a smaller space was observed in the LC group. By avoiding higher excursion of the COM trajectory, the participants were able to avoid instability. To avoid instability, the COM must not exceed the limits of the base of support [24]. Therefore, to maintain balance, COM must be contained in a smaller space if the base of support is small. A further difference between the cognitively healthy people and people with cognitive impairment can be observed in the gait phase duration variables.
First, the LC group exhibited a higher percentage of the gait cycle spent in the loading response phase. LR is a segment of the double limb support portion; therefore, an increase in its duration correlates with an increase in DLS, which was observed in the LC group. Second, the LC group displayed a lower percentage of the gait cycle spent in the single limb support portion of the gait cycle. During this phase, the body’s entire weight is resting on one extremity. The duration of this portion of the gait cycle is the best representative index of limb support capability [25]. In other words, a shorter single limb support phase and longer double limb support phase in the LC group is an indicator of poor gait stability in people with cognitive impairment.
The results of the level walking data analysis have indicated that the participants in the LC group had poor balance in comparison with those in the HC group. The postural stability examination results confirmed the existence of balancing issues in people with cognitive impairment. The postural stability index values showed that the cognitively healthy participants were more stable than the cognitively impaired participants. Dividing the participants into poor postural stability (PSI > 0.75) and good postural stability (PSI ≤ 0.75) groups revealed that there was a significantly higher number of cognitively impaired participants with poor postural stability. This result suggests that poor postural stability is an indicator of cognitive impairment, which is in accordance with previous research [26].
The results of pure tone audiometry revealed a similar hearing level in the two groups, with 50% of participants in each group having a hearing impairment. However, the number of mistakes in the sentence recognition test displayed a lower level of ability in LC. One observation is that the impact of cognitive ability on this score is greater than the impact of hearing ability. Research has shown that sentence comprehension is lower in people with dementia [27,28].
The existence of a significant difference between the two groups was present in several variables, thus making them candidates for predictor variables. However, not all of these variables possessed high predictive ability (represented by their AUC) and therefore were not considered for further analysis. Of the variables that represented gait function, only SLS exhibited high predictive ability. In the case of postural stability, both PSI and APSI had high AUC values, and in the case of auditory function, it was the SLS and SLS error variables.
One variable representing each function (gait, balance, and auditory function) was chosen for use in the logistic regression model. Based on the AUC values and their discriminatory ability, SLS, PSI < 0.75, and SRS error were used to design the logistic regression models. Model 1 was designed using only the three aforementioned variables, and model 2 was designed to adjust for the effect of age as a confounding factor. Regarding the model characteristics, the β coefficients show the influence of a feature on the probability of having lower cognition. In the case of SLS, the negative coefficient signifies that an increase in the single limb support portion decreases the possibility of lower cognition. By observing the odds ratios (OR), it can be concluded that having a PSI lower than 0.75 lowers the possibility of having cognitive impairment by approximately 80% (OR = 0.181, model 1, and OR = 0.204, model 2). Similarly, an increase in the duration of the SLS portion of the gait cycle lowered the probability of cognitive impairment by 44% (OR = 0.559, model 1, and OR = 0.557, model 2). In contrast, an increase in the number of mistakes during the sentence recognition test resulted in a 40% increase (OR = 1.416, model 1, and OR = 1.38, model 2) in the likelihood of having cognitive impairment. The age and constant can be removed from the models because of their non-significant contribution, leaving model 1 as the best model obtained from this dataset. Based on the AUC values, it can be concluded that the models have excellent predictive ability. By comparing them with the AUC values of the individual predictive variables, it is apparent that using a dual sensory-gait prediction model produces better results than using single sensory or gait variable-based models for prediction.
Our study has the following limitations: (1) Small sample size of our dataset—an increase in the data sample could potentially improve the performance of the proposed prediction models. (2) Absence of clinically diagnosed participants—a larger study with participants who were clinically diagnosed as people with cognitive impairment is needed to confirm the effectiveness of the proposed models. (3) The prediction model was not validated on a separate sample, and the validation of the model would give more insight into its quality, apart from the obtained AUC. (4) Only one classification model algorithm was assessed: several approaches are needed to obtain the best classification model, and further research comparing different algorithms could result in the design of an optimal early detection model for cognitive impairment.

5. Conclusions

The statistical analysis showed that participants with cognitive impairment have poor postural stability, which causes them to depend more on double limb support during level walking and contain their COM to a smaller volume in space. Furthermore, the sentence recognition test revealed that despite the two groups demonstrating similar hearing ability levels, the participants with lower cognition had more difficulty repeating words and sentences correctly. The results of the logistic regression and statistical evaluations suggest that using machine learning algorithms that combine balance, hearing, and gait function variables could aid in the diagnosis of lower cognitive function. The combination of sensory, balance, and gait quantifiers was also shown to have a higher AUC than the single quantifier analysis. Considering that our sample comprised of healthy, community-dwelling adults who were highly functioning and did not require assistance from a guardian, this model has the potential to contribute to actualizing a diagnosis protocol that can be used for the detection of early stages of cognitive impairment. Training the diagnostic models on larger datasets could lead to a better predictive ability, and designing and implementing longitudinal studies would allow following the course of the disease as well.

Author Contributions

E.K. and K.K. contributed equally to this work. The experiments, data processing, and statistical analysis were performed by K.K. and E.K.; E.K. drafted the manuscript and K.K. performed revision of said manuscript; D.K. supervised the work. All authors have read and agreed to the final manuscript.

Funding

This work was supported by the National Research Foundation of Korea (NRF) grant funded by the Korea government (MSIT) (NRF-2019R1A2C2088033), and by the Basic Science Research Program through the National Research Foundation of Korea (NRF) funded by the Ministry of Education (NRF-2019R1A6A3A01092848). The APC was funded by the National Research Foundation of Korea (NRF) grant, funded by the Korea government (MSIT). The funding bodies had no role in the design or conclusions of this study.

Institutional Review Board Statement

The study was conducted according to the guidelines of the Declaration of Helsinki and approved by the Institutional Review Board of Jeonbuk National University (IRB File No. JBNU 2019-09-015-001), and this present study was registered in Clinical Research Information Service (CRIS) (trial registration number, KCT0006202).

Informed Consent Statement

Informed consent was obtained from all participants involved in the study, and written consent has been obtained from the participants to publish this paper.

Data Availability Statement

The datasets generated during and/or analyzed during the current study are available from the corresponding author upon reasonable request. The data are not publicly available due to being a part of an ongoing study.

Acknowledgments

The authors would like to thank all the participants for their cooperation.

Conflicts of Interest

The authors declare no conflict of interest. The funders had no role in the design of the study; in the collection, analyses, or interpretation of data; in the writing of the manuscript, or in the decision to publish the results.

References

  1. World Health Organization (WHO). WHO Dementia. Available online: https://www.who.int/news-room/fact-sheets/detail/dementia (accessed on 20 November 2020).
  2. Ewers, M.; Sperling, R.A.; Klunk, W.E.; Weiner, M.W.; Hampel, H. Neuroimaging markers for the prediction and early diagnosis of Alzheimer’s disease dementia. Trends Neurosci. 2011, 34, 430–442. [Google Scholar] [CrossRef] [PubMed] [Green Version]
  3. Querbes, O.; Aubry, F.; Pariente, J.; Lotterie, J.-A.; Demonet, J.-F.; Duret, V.; Puel, M.; Berry, I.; Fort, J.-C.; Celsis, P.; et al. Early diagnosis of Alzheimer’s disease using cortical thickness: Impact of cognitive reserve. Brain 2009, 132, 2036–2047. [Google Scholar] [CrossRef] [PubMed] [Green Version]
  4. Tsolaki, M. Clinical workout for the early detection of cognitive decline and dementia. Eur. J. Clin. Nutr. 2014, 68, 1186–1191. [Google Scholar] [CrossRef] [PubMed]
  5. McGrath, R.; Robinson-Lane, S.G.; Clark, B.C.; Suhr, J.A.; Giordani, B.J.; Vincent, B.M. Self-Reported Dementia-Related Diagnosis Underestimates the Prevalence of Older Americans Living with Possible Dementia. J. Alzheimer’s Dis. 2021, 82, 373–380. [Google Scholar] [CrossRef] [PubMed]
  6. Albers, M.W.; Gilmore, G.C.; Kaye, J.; Murphy, C.; Wingfield, A.; Bennett, D.A.; Boxer, A.L.; Buchman, A.S.; Cruickshanks, K.J.; Devanand, D.P.; et al. At the interface of sensory and motor dysfunctions and Alzheimer’s disease. Alzheimer’s Dement. 2015, 11, 70–98. [Google Scholar] [CrossRef] [Green Version]
  7. Deal, J.A.; Betz, J.; Yaffe, K.; Harris, T.; Purchase-Helzner, E.; Satterfield, S.; Pratt, S.; Govil, N.; Simonsick, E.M.; Lin, F.R.; et al. Hearing Impairment and Incident Dementia and Cognitive Decline in Older Adults: The Health ABC Study. J. Gerontol. Ser. A Biomed. Sci. Med. Sci. 2016, 72, 703–709. [Google Scholar] [CrossRef] [PubMed]
  8. Paik, J.-S.; Ha, M.; Jung, Y.H.; Kim, G.-H.; Han, K.-D.; Kim, H.-S.; Lim, D.H.; Na, K.-S. Low vision and the risk of dementia: A nationwide population-based cohort study. Sci. Rep. 2020, 10, 9109. [Google Scholar] [CrossRef]
  9. Yamada, Y.; Denkinger, M.D.; Onder, G.; Henrard, J.-C.; van der Roest, H.G.; Finne-Soveri, H.; Richter, T.; Vlachova, M.; Bernabei, R.; Topinkova, E. Dual Sensory Impairment and Cognitive Decline: The Results From the Shelter Study. J. Gerontol. Ser. A Biomed. Sci. Med. Sci. 2016, 71, 117–123. [Google Scholar] [CrossRef] [PubMed] [Green Version]
  10. Maharani, A.; Dawes, P.; Nazroo, J.; Tampubolon, G.; Pendleton, N. Visual and hearing impairments are associated with cognitive decline in older people. Age Ageing 2018, 47, 575–581. [Google Scholar] [CrossRef] [PubMed] [Green Version]
  11. Taniguchi, Y.; Yoshida, H.; Fujiwara, Y.; Motohashi, Y.; Shinkai, S. A Prospective Study of Gait Performance and Subsequent Cognitive Decline in a General Population of Older Japanese. J. Gerontol. Ser. A Biomed. Sci. Med. Sci. 2012, 67, 796–803. [Google Scholar] [CrossRef] [Green Version]
  12. Verghese, J.; Wang, C.; Lipton, R.B.; Holtzer, R.; Xue, X. Quantitative gait dysfunction and risk of cognitive decline and dementia. J. Neurol. Neurosurg. Psychiatry 2007, 78, 929–935. [Google Scholar] [CrossRef] [PubMed]
  13. Doi, T.; Makizako, H.; Tsutsumimoto, K.; Hotta, R.; Nakakubo, S.; Makino, K.; Suzuki, T.; Shimada, H. Combined effects of mild cognitive impairment and slow gait on risk of dementia. Exp. Gerontol. 2018, 110, 146–150. [Google Scholar] [CrossRef] [PubMed]
  14. Johnson, J.C.S.; Marshall, C.R.; Weil, R.S.; Bamiou, D.-E.; Hardy, C.J.D.; Warren, J.D. Hearing and dementia: From ears to brain. Brain 2021, 144, 391–401. [Google Scholar] [CrossRef]
  15. Diamond, A. Executive Functions. Annu. Rev. Psychol. 2013, 64, 135–168. [Google Scholar] [CrossRef] [PubMed] [Green Version]
  16. Dorfman, M.; Herman, T.; Brozgol, M.; Shema, S.; Weiss, A.; Hausdorff, J.M.; Mirelman, A. Dual-Task Training on a Treadmill to Improve Gait and Cognitive Function in Elderly Idiopathic Fallers. J. Neurol. Phys. Ther. 2014, 38, 246–253. [Google Scholar] [CrossRef] [PubMed]
  17. Kang, Y.; Park, J.S.; Yu, K.H.; Lee, B.C. A Reliability, Validity, and Normative Study of the Korean-Montreal Cognitive Assessment(K-MoCA) as an Instrument for Screening of Vascular Cognitive Impairment(VCI). Korean J. Clin. Psychol. 2009, 28, 549–562. [Google Scholar] [CrossRef]
  18. Bidabadi, S.S.; Murray, I.; Lee, G.Y.F. Validation of foot pitch angle estimation using inertial measurement unit against marker-based optical 3D motion capture system. Biomed. Eng. Lett. 2018, 8, 283–290. [Google Scholar] [CrossRef] [PubMed]
  19. Lin, F.R.; Yaffe, K.; Xia, J.; Xue, Q.-L.; Harris, T.B.; Purchase-Helzner, E.; Satterfield, S.; Ayonayon, H.N.; Ferrucci, L.; Simonsick, E.M.; et al. Hearing Loss and Cognitive Decline in Older Adults. JAMA Intern. Med. 2013, 173, 293–299. [Google Scholar] [CrossRef] [PubMed]
  20. Sun, L.; Wang, J.; Wei, J. AVC: Selecting discriminative features on basis of AUC by maximizing variable complementarity. BMC Bioinform. 2017, 18 (Suppl. 3), 50. [Google Scholar] [CrossRef] [PubMed] [Green Version]
  21. Mandrekar, J.N. Receiver Operating Characteristic Curve in Diagnostic Test Assessment. J. Thorac. Oncol. 2010, 5, 1315–1316. [Google Scholar] [CrossRef] [Green Version]
  22. Kim, K.W.; Park, J.H.; Kim, M.-H.; Kim, M.D.; Kim, B.-J.; Kim, S.-K.; Kim, J.L.; Moon, S.W.; Bae, J.N.; Woo, J.I.; et al. A Nationwide Survey on the Prevalence of Dementia and Mild Cognitive Impairment in South Korea. J. Alzheimer’s Dis. 2011, 23, 281–291. [Google Scholar] [CrossRef] [Green Version]
  23. Van Der Flier, W.M. Epidemiology and risk factors of dementia. J. Neurol. Neurosurg. Psychiatry 2005, 76 (Suppl. 5), v2–v7. [Google Scholar] [CrossRef] [Green Version]
  24. Meyer, G.; Ayalon, M. Biomechanical aspects of dynamic stability. Eur. Rev. Aging Phys. Act. 2006, 3, 29–33. [Google Scholar] [CrossRef] [Green Version]
  25. Perry, J.; Burnfield, J.M. Phases of Gait in Gait Analysis: Normal And Pathological Function, 1st ed.; SLACK Inc.: Thorofare, NJ, USA, 1992; pp. 9–16. [Google Scholar]
  26. Kido, T.; Tabara, Y.; Igase, M.; Ochi, N.; Uetani, E.; Nagai, T.; Yamamoto, M.; Taguchi, K.; Miki, T.; Kohara, K. Postural Instability Is Associated with Brain Atrophy and Cognitive Impairment in the Elderly: The J-SHIPP Study. Dement. Geriatr. Cogn. Disord. 2010, 29, 379–387. [Google Scholar] [CrossRef] [PubMed]
  27. Liu, X.; Wang, W.; Wang, H.; Sun, Y. Sentence comprehension in patients with dementia of the Alzheimer’s type. PeerJ 2019, 7, e8181. [Google Scholar] [CrossRef] [PubMed] [Green Version]
  28. Kim, J.K.; Sung, J.E.; Jeong, J.H. Effects of syntactic complexity on sentence comprehension in persons with mild cognitive impairment and dementia of Alzheimer’s type. Commun. Sci. Disord. 2012, 17, 338–355. [Google Scholar] [CrossRef] [Green Version]
Figure 1. Motion analysis position sensor and marker placement: (a) position sensor placement: posterior, left anterior, and right anterior to the walkway, and (b) lower extremity marker placement: anterior, posterior, and lateral view.
Applsci 11 09970 g001
Figure 2. Average COM trajectory excursion graphs for LC and HC: (a) vertical trajectory graph, (b) anterior-posterior trajectory graph, and (c) mediolateral trajectory graph (the continuous and dotted vertical lines mark the peak occurrences for HC and LC).
Applsci 11 09970 g002
Figure 3. Visualization of three-dimensional COM trajectory: (a) HC and LC average COM trajectory, and (b) example of the volume encompassed by the COM trajectory.
Applsci 11 09970 g003
Table 1. Demographics.
Score (/Max)ALL (n = 57)HC (n = 39)LC (n = 18)p-Value *
MEAN (SD)MEAN (SD)MEAN (SD)
Age (years)74.42 (4.56)73.46 (4.51)76.5 (4.04)0.01 *
Height (cm)166.96 (5.53)167.15 (5.91)166.56 (4.73)0.708
Weight (kg)67.34 (8.42)67.4 (8.8)67.19 (7.76)0.932
Education (years)13.07 (3.41)13.1 (3.35)13.0 (3.63)0.917
HC, Healthy Control; LC, Lower Cognition; SD, Standard Deviation; * significance level p-value < 0.05.
Table 2. Cognitive scores of lower cognition and healthy control groups.
Score (/Max)HC (n = 39)LC (n = 18)p-Value *
MEAN (SD)MEAN (SD)
MoCA score (/30)23.3 (2.7)17.44 (3.4)<0.001 *
Visuospatial executive function (/5)4.13 (1.0)2.39 (0.9)<0.001 *
Naming (/3)2.89 (0.3)2.67 (0.5)0.035 *
Attention (/6)5.28 (0.76)4.44 (1.1)0.005 *
Language (/3)2.36 (0.67)1.44 (1.15)0.003 *
Abstraction (/2)1.02 (0.81)0.56 (0.51)0.038 *
Delayed recall (/5)1.79 (1.28)0.56 (0.78)0.001 *
Orientation (/6)5.82 (2.72)5.39 (3.4)0.055
HC, Healthy Control; LC, Lower Cognition; SD, Standard Deviation; MoCA, Montreal Cognitive Assessment; * significance level p-value < 0.05.
Table 3. Level walking variables of LC and HC groups.
VariableHC (n = 39)LC (n = 18)p-Value *
MEAN (SD)MEAN (SD)
LR (%)10.55 (1.13)11.44 (1.49)0.016 *
MS (%)21.16 (2.51)19.67 (2.67)0.217
TS (%)18.34 (2.84)18.91 (2.64)0.693
PS (%)11.05 (1.13)11.77 (1.06)0.065
SLS (%)39.5 (1.25)38.6 (1.30)0.014 *
DLS (%)21.61 (2.04)23.2 (2.29)0.011 *
SW (%)38.88 (1.32)38.21 (1.28)0.250
COM volume
(cm3)
442.07 (193.08)344.37 (168.10)0.039 *
HC, Healthy Control; LC, Lower Cognition; SD, Standard Deviation; LR, Loading Response; MS, Mid-Stance; TS, Terminal Stance; PS, Pre-Swing; SLS, Single Limb Support; DLS, Double Limb Support; SW, Swing; COM, Center of Mass. * significance level p-value < 0.05.
Table 4. Auditory examination variables of LC and HC.
VariableHC (n = 39)LC (n = 18)p-Value *
MEAN (SD)MEAN (SD)
PTA R23.5 (10.05)26.4 (10.50)0.290
PTA L23.38 (10.84)32.3 (19.32)0.075
SRT19.23 (8.61)25 (13.26)0.221
WRS76.99 (12.14)71.61 (13.07)0.140
WRS error11.05 (5.02)14.33 (6.62)0.223
SRS98.27 (1.94)95.2 (4.85)0.063
SRS error1.38 (1.55)4 (3.91)0.049 *
HC, Healthy Control; LC, Lower Cognition; SD, Standard Deviation; PTA, Pure Tone Audiometry; SRT, Speech Recognition Threshold; WRS, Word Recognition Score; SRS, Sentence Recognition Score. * significance level p-value < 0.05.
Table 5. Postural stability variables of LC and HC.
VariableHC (n = 39)LC (n = 18)p-Value *
MEAN (SD)MEAN (SD)
PSI0.68 (0.37)1.16 (0.86)0.006 *
APSI0.54 (0.36)0.86 (0.64)0.012 *
MLSI0.27 (0.15)0.59 (0.62)0.017 *
HC, Healthy Control; LC, Lower Cognition; SD, Standard Deviation; PSI, Postural Stability Index; APSI, Anterior-Posterior stability index; MLSI, Mediolateral Stability Index. * significance level p-value < 0.05.
Table 6. Logistic regression characteristics, models 1 and 2.
PVβS.E. Wald   χ 2 p-ValueOR95% CI of ORAUC (95% CI)
Model 1SLS adjusted−0.5820.2894.0680.044 *0.5590.317 to 0.9840.832 (0.725~0.938)
PSI < 0.75−1.7080.7475.2270.022 *0.1810.042 to 0.784
SRS error0.3480.1724.0980.043 *1.4161.011 to 1.983
Constant1.711.1990.020.8871.186
Model 2SLS adjusted−0.5840.2904.0480.044 *0.5570.315 to 0.9850.840 (0.735~0.946)
PSI < 0.75−1.590.7654.3210.038 *0.2040.045 to 0.913
SRS error0.3220.1763.3470.0671.3800.977 to 1.948
Age adjusted0.0610.0790.6030.4381.0630.911 to 1.242
Constant−0.3271.3660.0570.8110.721
PV, Predictor Variable; S.E., Standard Error; OR, Odds Ratio or Exp (β); AUC, Area Under the Curve; CI, Confidence Interval; SLS, Single Limb Support; PSI, Postural Stability Index; SRS, Sentence Recognition Score. * significance level p-value < 0.05.
Publisher’s Note: MDPI stays neutral with regard to jurisdictional claims in published maps and institutional affiliations.

