Abstract
Additive manufacturing (AM) has drawn tremendous interest in engineering applications because it offers almost unlimited possibilities of innovative structural design to save weight and optimize performance. However, fatigue properties are one of the limiting factors for structural applications of AM materials. The recently developed Tanaka–Mura–Wu (TMW) model is modified to include the microstructure and surface roughness factors, in addition to the material’s elastic modulus, surface energy and Burgers vector, to predict the fatigue curves as functions of stress or plastic strain for several typical AM materials as well as their conventional (wrought) counterpart. Furthermore, with statistical characterization of the microstructural effect, the model can be established to evaluate fatigue design allowables.
1. Introduction
Additive manufacturing (AM) is quickly growing in the automotive and aerospace industries because it not only offers rapid prototyping but also almost unlimited possibilities of innovative structural design to save weight and optimize performance. AM processes offer the ability to fabricate parts with complex geometry that are very challenging or even impossible to produce by subtractive manufacturing methods. In addition, on-site fabrication of replacement parts and efficient production of parts in small numbers are among the other advantages of AM methods, enabling lean and effective logistics for maintenance. Owing to these reasons, nowadays, AM methods have gained popularity in various industries.
With the development of more advanced AM technologies, such as laser-based powder bed fusion (LB-PBF), including selective laser melting (SLM) and direct metal laser sintering (DMLS), and directed energy deposition (DED) methods, the mechanical properties of AM materials are getting closer to and sometimes even exceeding the conventional materials [1,2,3]. Extensive efforts have also been devoted to studies on fatigue performance of AM materials, which are summarized in recent reviews [4,5]. Both tensile and fatigue properties are pertinent to the development of material allowables and design values for certification of the designed products. By these requirements, it is quite challenging to fully characterize the effects of all the variables that influence the resulting performance in the intended application of AM materials through conventional testing.
AM materials commonly have manufacturing defects, such as lack of fusion (LOF) defects, porosities, and un-melted particles, which inevitably affect the fatigue behaviour of AM materials [5,6]. The process and design parameters could influence the density, size, shape, and location of the internal defects, surface roughness and residual stresses. In addition, the complex thermal cycles during the fabrication of AM parts, accompanied by the variations in the part geometry, can influence the orientation and geometry of the defects as well. Therefore, it can be said that individually built coupons may not fully represent local variations in parts. Therefore, the applicability and fitness of the use of coupon-generated bulk material allowables and design values have to be demonstrated for each individual component [7]. This requires a quantitative correlation of the fatigue properties with surface finish and microstructure per manufacturing process.
The present paper summarizes the results of a study assignment during a graduate course MECH 5602 at Carleton University, Ottawa, ON, Canada. The participating students curated the fatigue data for various AM materials such as SLM Al-Si-10Mg, DLMS Ti-6Al-4V, and LB-PBF 17-4 PH from the literature, and analyzed the data using a modified Tanaka-Mura-Wu model [8,9]. The effects of surface roughness, microstructure and post-heat treatment, e.g., hot isostatic pressing (HIP), on fatigue life are examined with respect to low cycle fatigue (LCF) and high cycle fatigue (HCF). Preliminary statistical analysis is also conducted for defining the fatigue strength allowables.
2. The Fatigue Theory and Assumptions for AM Materials
The fundamental model of mechanical fatigue was initially developed by Tanaka and Mura based on the formation of surface extrusions and intrusions via dislocation dipole pileups [8]. The model has been further revised by Wu [9,10] using the true strain definition, and the fatigue crack nucleation life is given by:
where is the surface energy (), is the shear modulus (), is the Poisson’s ratio, is the Burgers vector (), is the lattice friction stress (), Δγ is the cyclic plastic shear strain range, and Δτ is the cyclic shear stress range. Equation (1) is applicable to fatigue crack nucleation life with appreciable plastic strain, typically for LCF, which has been validated on a number of conventional metals and alloys [9]. Equation (2) is applicable to stress-controlled fatigue crack nucleation where plastic strain is negligible, typically in the HCF regime. Therefore, the model in the context of Equations (1) and (2) is called the Tanaka–Mura–Wu (TMW) model. An extensive application of the TMW model over the full range of fatigue life (LCF + HCF) for commonly used engineering alloys has been documented elsewhere [11].
With regards to AM materials, it has been recognized that the effects of intrinsic AM defects, both surface and internal, on fatigue performance are the most critical properties of the AM metal components. The morphology of various internal defects such as LOF defects, keyhole or gas porosities, and un-melted particles have been characterized in the review articles [1,2,3,4,5], which will not be discussed in this paper. Considering the characteristics of AM materials with the microstructure and surface roughness profile, as schematically shown in Figure 1 and Figure 2, two effect factors are introduced into Equations (1) and (2) such that:
Figure 1.
Schematic of LOF/porosity in AM materials. It generally has a high aspect ratio of ellipticity in the (a) horizontal direction but low aspect ratio in the (b) vertical direction, relative to the built direction.
Figure 2.
A schematic profile of surface roughness and its parameters, where Ra is the arithmetic average of the roughness measurement, Rt is the maximum peak vales and Rv is the maximum valley value.
Here, the surface roughness factor, Rs, and microstructure factor, M, are introduced with the following assumptions:
- As the applied stress is uniform within the material coupon, in the continuum sense, the presence of LOF defects and pores raise the local stress concentration such that it effectively reduces the microstructural resistance to fatigue by a factor M, in accordance with the Murakami–Endo model [12], as opposed to M = 1 for the baseline (wrought) microstructure. Note that is the fatigue limit for the baseline material.
- The surface roughness may either facilitate the formation of extrusions and intrusions directly or cause local stress concentration at the surface, so the effect can be represented by a surface finish factor . Note that for idealized smooth surface.
The Taylor factor is used to convert stress/strain from shear to normal components as: and . Equation (3) applies above the material’s yield strength and Equation (4) applies below the material’s yield strength.
3. AM Materials and Fatigue Tests
In this study, LB-PBF 17-4 PH [13], SLM AlSi10Mg and DMLS Ti6Al4V [14] in various conditions from as fabricated, machined/polished, and heat-treated to HIPed are selected to compare with their counterpart wrought materials, which are listed in Table 1. The microstructural characteristics of these AM materials are detailed in the respective references and will not be repeated here. For fatigue life prediction though, the basic material properties and physical constants of the corresponding metals are given in Table 2. Note that the surface energy values are evaluated from the base metals of the corresponding alloys at ambient temperatures based on the surface energy and entropy information given in Ref. [15], as the composition contains more than 80% of the base metal element and other major elements with comparable surface energies. Surface energies for complex engineering alloys are rarely available in the literature.
Table 1.
Material conditions and surface roughness (data taken from [13,14].
Table 2.
Material physical properties.
Fully reversed (R = −1) fatigue tests were conducted on these material coupons in either strain or stress control of axial or rotational bending loading, as reported in the original work [13,14]. The fatigue data were either read in numbers or digitized—using WebPlotDigitizer—from the data plots in the above references.
4. Fatigue Analysis and Discussion
As the fatigue test results include all influences from coupon microstructure to surface finish and loading parameters (i.e., stress or strain amplitudes, stress ratio, etc.), it is difficult to quantify the effect of each factor using empirical relationships. Therefore, in this section, the modified TMW model, Equations (3) and (4), will be used to separate individual effects in a stepwise manner. The discussion will address the fatigue performance of each type of material in the following sub-sections.
4.1. LB-PBF 17-4 PH
The conventional 17–4 PH is a martensitic stainless steel. Due to the high cooling rates during SLM, which are much faster than the critical cooling rate specified in the CCT diagram for 17–4 PH stainless steels, similar proportions of α’ and γ phases during martensitic transformation could form in LB-PBF 17–4 PH. Therefore, LB-PBF 17–4 PH samples might not be completely martensitic and contain retained austenite due to high solidification speeds during fabrication. The material chosen in this study has gone through the same heat treatment as its wrought counterpart, hoping to resume to the martensite phase as much as possible.
The fatigue test data of H1025 heat-treated wrought 17-4 PH, CA-H1025 heat-treated LB-PBF 17-4 PH and the HIPed and CA-H1025 heat-treated LB-PBF 17-4 PH stainless steel specimens are shown in Table 3, Table 4 and Table 5, respectively. First, Equation (4) is used to analyze the fatigue data below the yield strength. Rearranging Equation (4), the fatigue strength for a given number of cycles can be expressed as:
where is the stress amplitude.
Table 3.
Fatigue test results of H1025 heat-treated wrought 17-4 PH stainless steel with the machined surface under axial loading (test information and data taken from [13]).
Table 4.
Fatigue test results of CA-H1025 heat-treated AM 17-4 PH stainless steel with the machined surface under axial loading (test information and data taken from [13]).
Table 5.
Fatigue test results of HIPed LB-PBF 17-4 PH stainless steel with the machined surface under axial loading (test information and data taken from [13]).
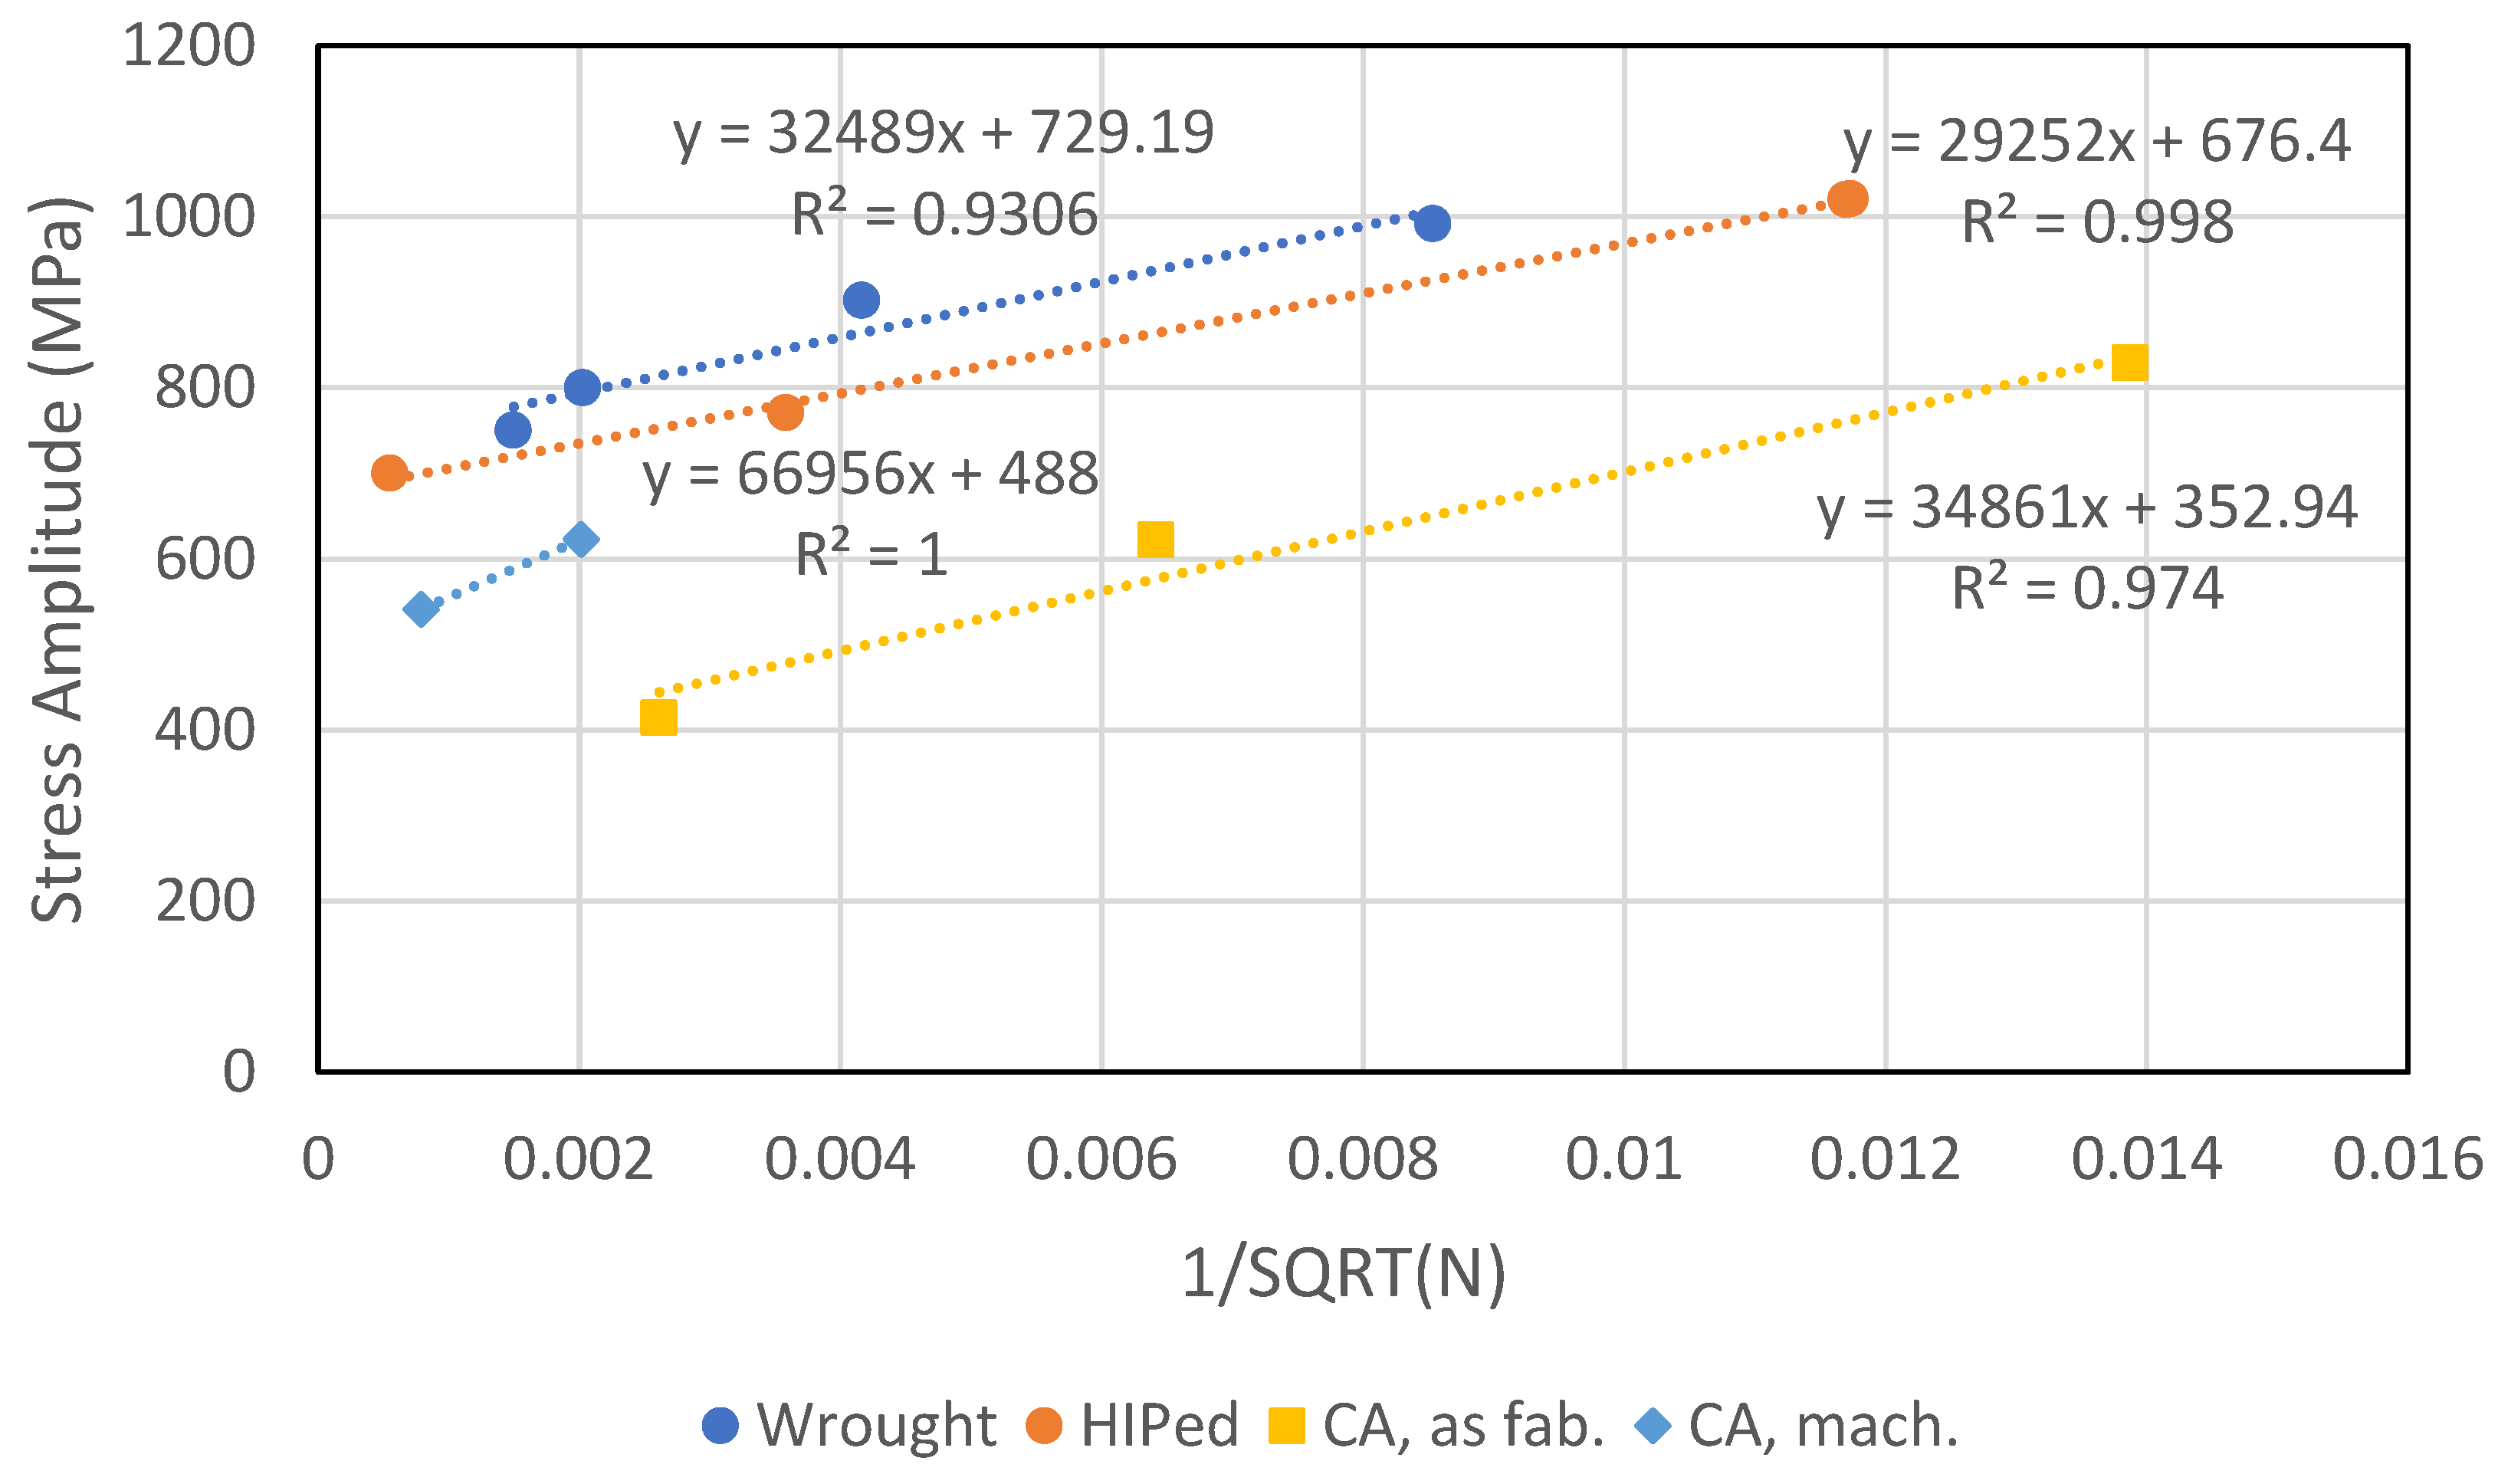
Equation (5) can be used to perform linear regression analysis of the experimental data below the yield strength (<1100 MPa), as shown in Figure 3. Especially, factors M and Rs can be obtained from the intercept and slope of the regression line:
Figure 3.
Fatigue strength vs. inverse square root of cycle number.
The surface finish factor and the microstructural factor M for these material conditions are summarized in Table 6.
Table 6.
Surface finish and microstructural factors for 17-4 PH ( MPa).
Above the yield strength, as seen from Table 3, plastic strain accumulates at nearly constant stress, causing the shortening of fatigue life. Therefore, the fatigue processes in this regime is LCF, and Equation (3) is used with = 0.25. Note that the surface roughness effect for LCF is different from that for HCF. This is not totally unexpected as roughness may cause stress concentration under elastic loading, but it rather contributes directly to the formation of extrusions/intrusions during LCF when plasticity commences. The calculated fatigue lives are given in Table 3, Table 4 and Table 5 and the curves are shown in Figure 4 in comparison with the experimental data.
Figure 4.
The TMW model-calculated fatigue life in comparison with the experimental data (arrow indicates runout) for 17-4 PH stainless steel.
It can be inferred from Table 6 results that the surface roughness in the range from 0.01 μm to 9 μm only causes about a factor of 3 variations in fatigue life. Normally, the surface finish factor is less than 1; whereas surface enhancement treatment or residual stresses may cause it to be greater than 1, in the current context of the present model. It is noticed that in the case of CA-H1025-treated 17-4 PH with a machined surface, = 1.5. It is uncertain whether this is due to a physical effect or simply an error in linear regression, as the data points are few.
On the other hand, the AM microstructure, perhaps together with roughness too, has a significant effect, reducing the fatigue strength, i.e., the fatigue endurance limit, to the maximum by a factor of 2 for 17-4 PH steel. Generally, the microstructural factor M reflects the effect of inclusions, as described by the inclusion theory of Eshelby [16]. Shibata and Ono used Eshelby’s formulation to calculate the stress concentration factors of oblate inclusions with various aspect ratios and found that the stress concentration factor of a spherical void is 2.5 [17]. Wu also used Eshelby’s theory to evaluate the effect of graphite inclusions (flake-like, vermicular or nodular) on the fatigue strength of cast irons [
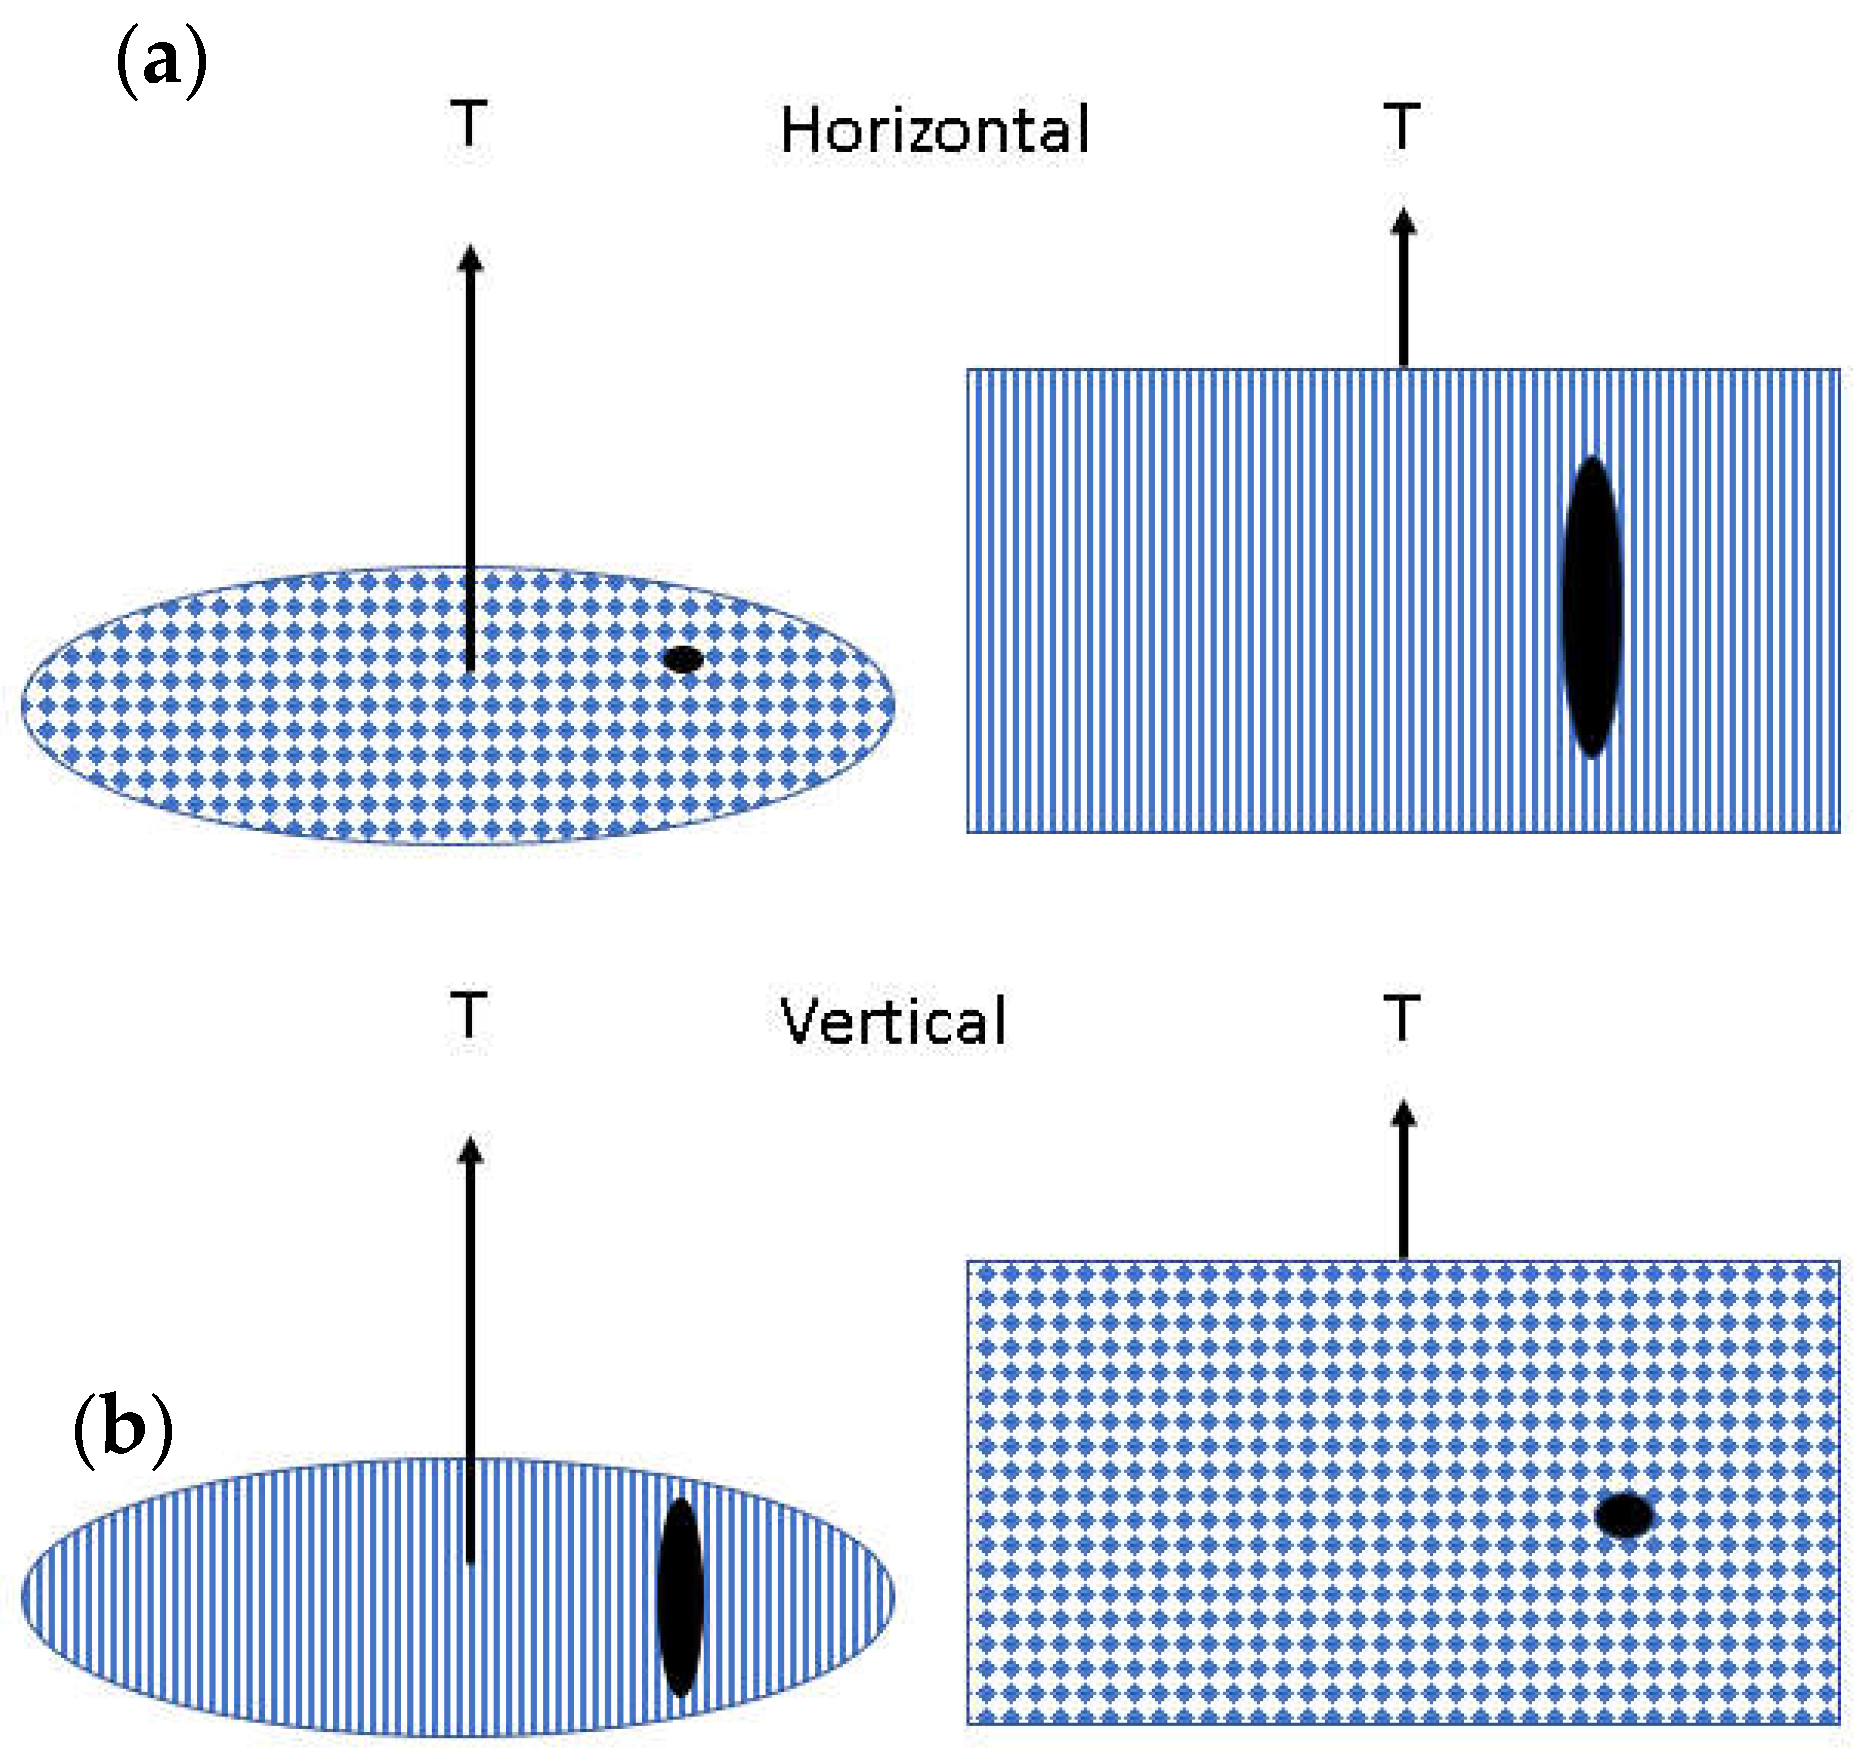
18]. As porosities in AM materials are elongated in the horizontal direction, as depicted in Figure 1, it should have a lesser stress concentration effect. The authors of the original experimental work examined the AM microstructure. They observed that the size of the pores in non-HIPed AM 17-4 PH was about 80 μm, and it was reduced to less than 20 μm after HIPing [13]. Apparently, pores could not be fully eliminated due to the presence of pressurized entrapped argon gas inside the defects which could not escape or diffuse into the material. The effectiveness of the HIP process in reducing the porosities depends on the characteristics of the initial defects. In the case of large defects, the HIP process may not be effective [19]. Pores may also appear on the as-built surface or be exposed by machining, which may or may not be reflected in the roughness measurement on selected areas. Nonetheless, the modified TMW model sheds light on the interpretation of the fatigue data and separates the convoluted microstructure-surface effects into what causes life scatter and what causes reduction in fatigue strength.
4.2. DMLS Ti6Al4V
Ti-6Al-4V is perhaps one of the most studied alloys in AM [4,5,6,14,20,21,22,23,24]. Since titanium alloys are generally lightweight, bio-compatible and resistant to corrosion, it has a potential of wide applications in various industries with AM. The conventional wrought Ti-6Al-4V processes a dual-phase microstructure with equiaxed α + β grains or lamellar α + β colonies interspersed between nearly equiaxed α grains. The as-built SLM Ti-6Al-4V has a martensitic acicular α’ microstructure. Therefore, it has high static strength but poor ductility compared with cast or wrought Ti-6Al-4V [4].
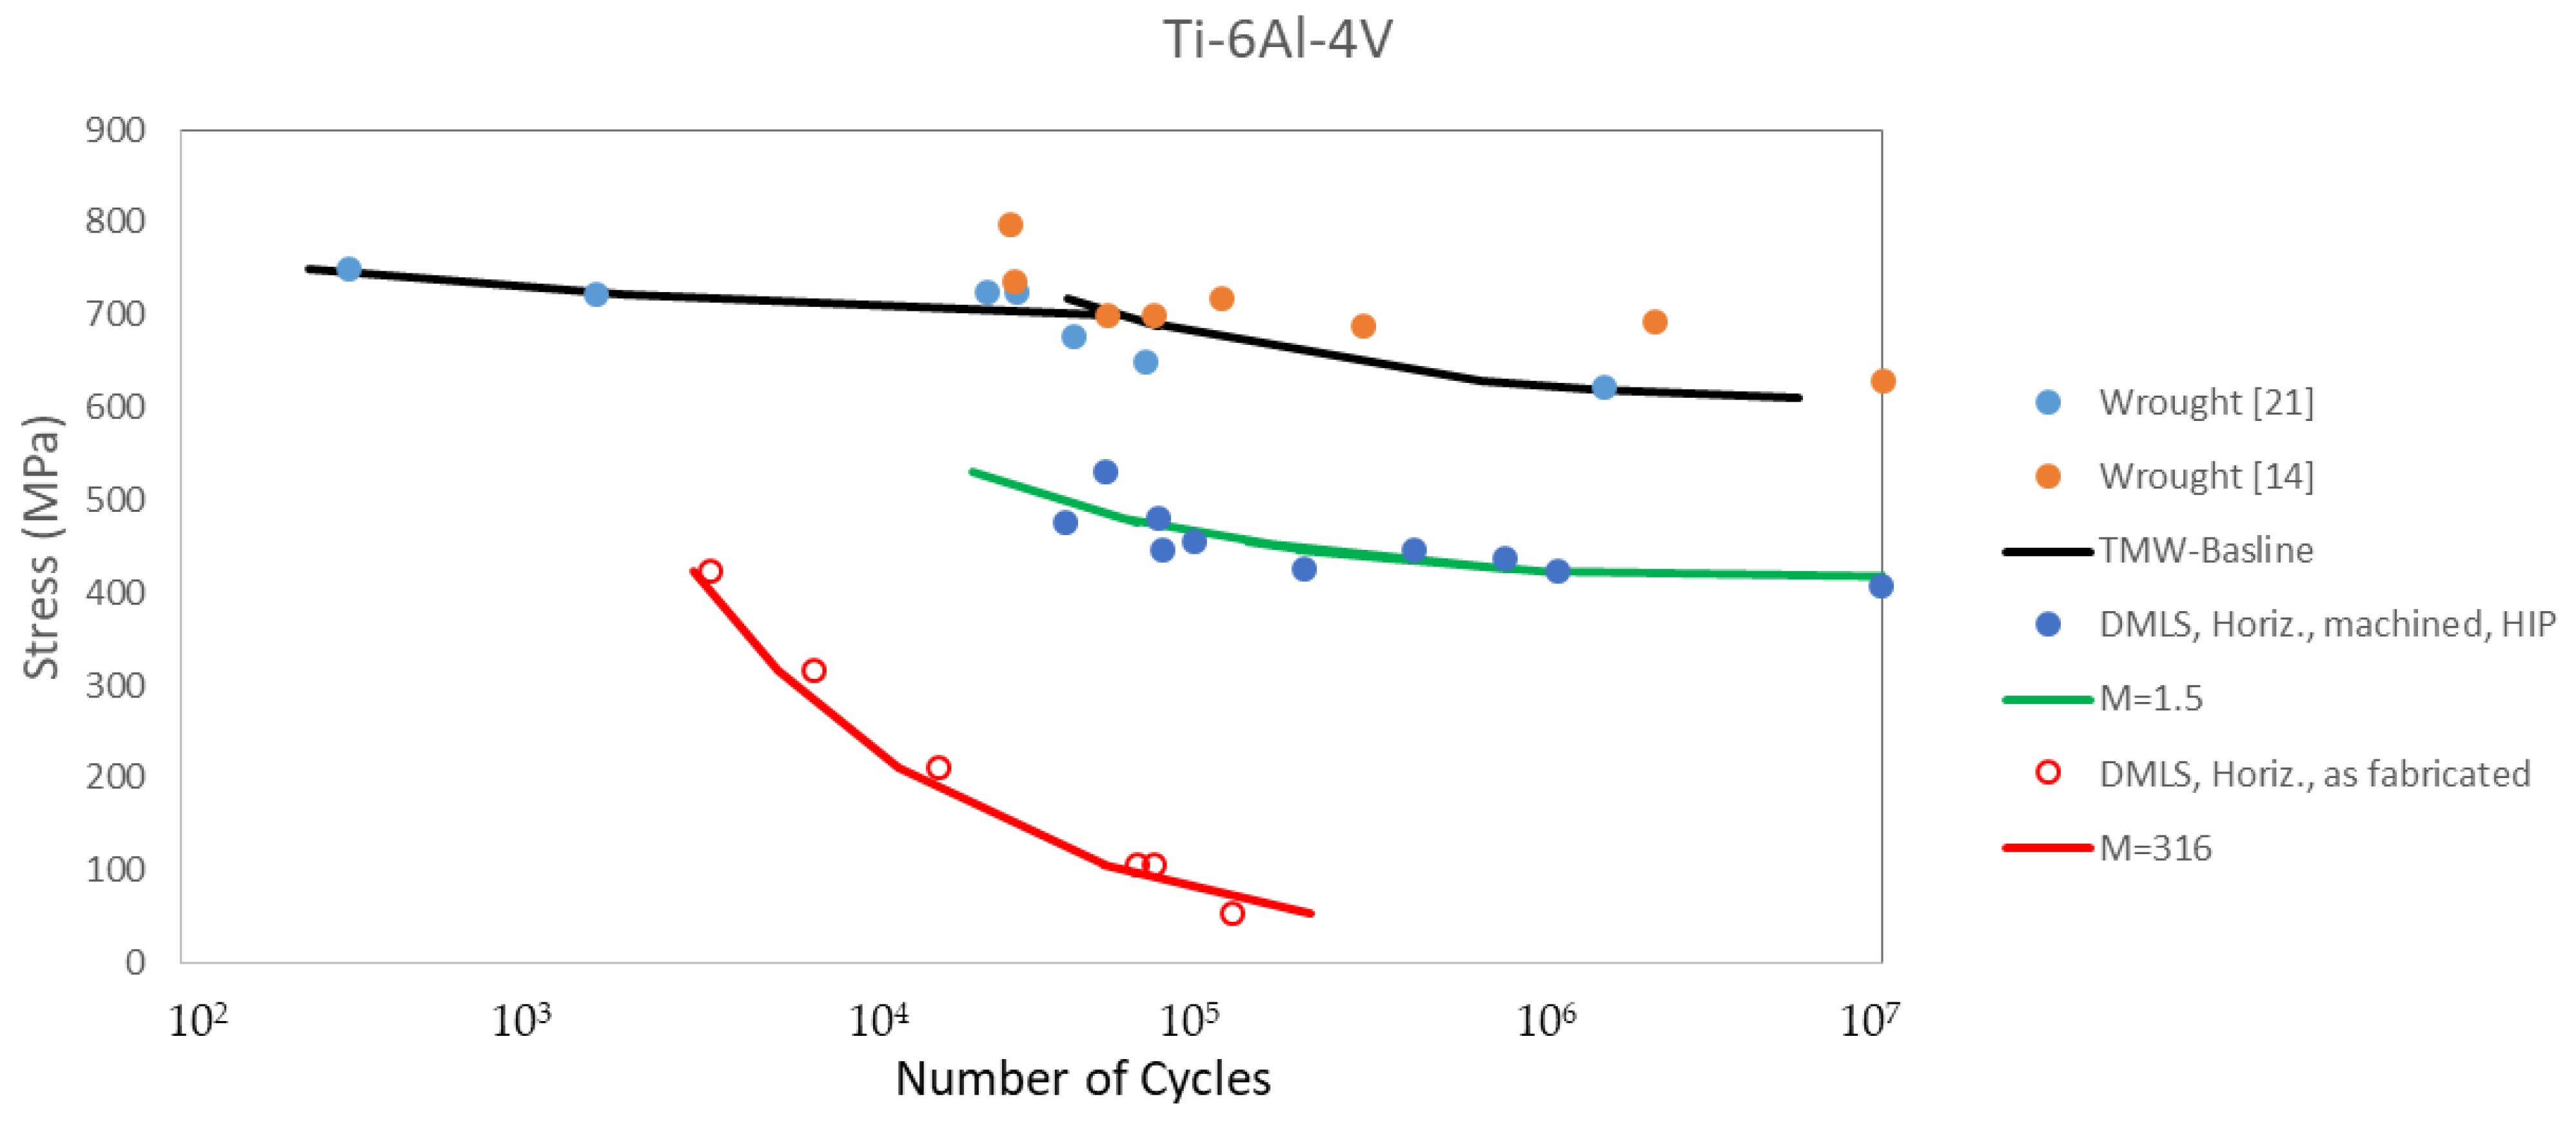
Due to the limited scope, the current analysis cannot cover all previous studies but can only take data from references [14,21]. The wrought material fatigue data are taken from reference [21], which is considered as the baseline, and the behaviour is described by Equations (3) and (4) with = 1 and M = 1, i.e., the baseline Equations (1) and (2), as given in Table 7. The DMLS Ti6Al4V fatigue data are digitized from reference [14]. The fatigue behaviours of AM Ti6Al4V are described by Equations (3) and (4), while and M are evaluated in a similar way by Equations (5) and (6), and the values are given in Table 8. The calculated curves are shown in Figure 5, which are in good agreement with the experimental data.
Table 7.
Fatigue test results of wrought Ti-6Al-4V with the machined surface under axial loading (test information and data taken from [21]).
Table 8.
Surface finish and microstructural factors for Ti6Al4V ( MPa).
Figure 5.
Fatigue behaviours of wrought and AM Ti6Al4V.
The HIPed DMLS Ti6Al4V has a microstructure factor of 1.5, which is comparable to AM 17-4 PH, reasonably, with pores. However, the as-fabricated DMLS Ti6Al4V has a microstructural factor of 316, which is much larger than that raised by round pores. Therefore, it is suspected that this must be caused by LOF defects, which are usually larger and sharper than pores. The post-mortem fractographic examination in the original work revealed that fatigue crack initiation did start from surface defects, which propagated, linked up and prompted the final failure. Although mechanical polishing might remove some of the obvious defects on the surface, some remained due to the emergence of occasional voids from within the bulk during material removal. Treatment of DMLS specimens with either mechanical polishing or electropolishing produced negligible improvement in fatigue life. The surface finish factor has values ranging from 0.57 to 1, but it does not seem to correlate with the arithmetic average surface roughness, , for Ti6Al4V.
4.3. SLM AlSi10Mg
Aluminum alloys are also commonly used materials in AM. A recent review is provided by Aboulkhair et al. [25]. Even though the number of Al alloys that are now processable by SLM with high fidelity is still limited, ongoing studies are expanding, aiming to widen the range. Most of the existing fatigue studies concentrate on SLM AlSi10Mg with its conventional counterpart Al 6061 [14,25,26,27,28]. The microstructure of SLM AlSi10Mg typically consists of overlapping, segregated melt pools with distinct boundaries. The bulk material of SLM AlSi10Mg contains voids, which grow in both horizontal and vertical directions, but are more numerous in the material grown in the vertical orientation [4,14]. In addition, voids are more prevalent in the surface layers [14,27].
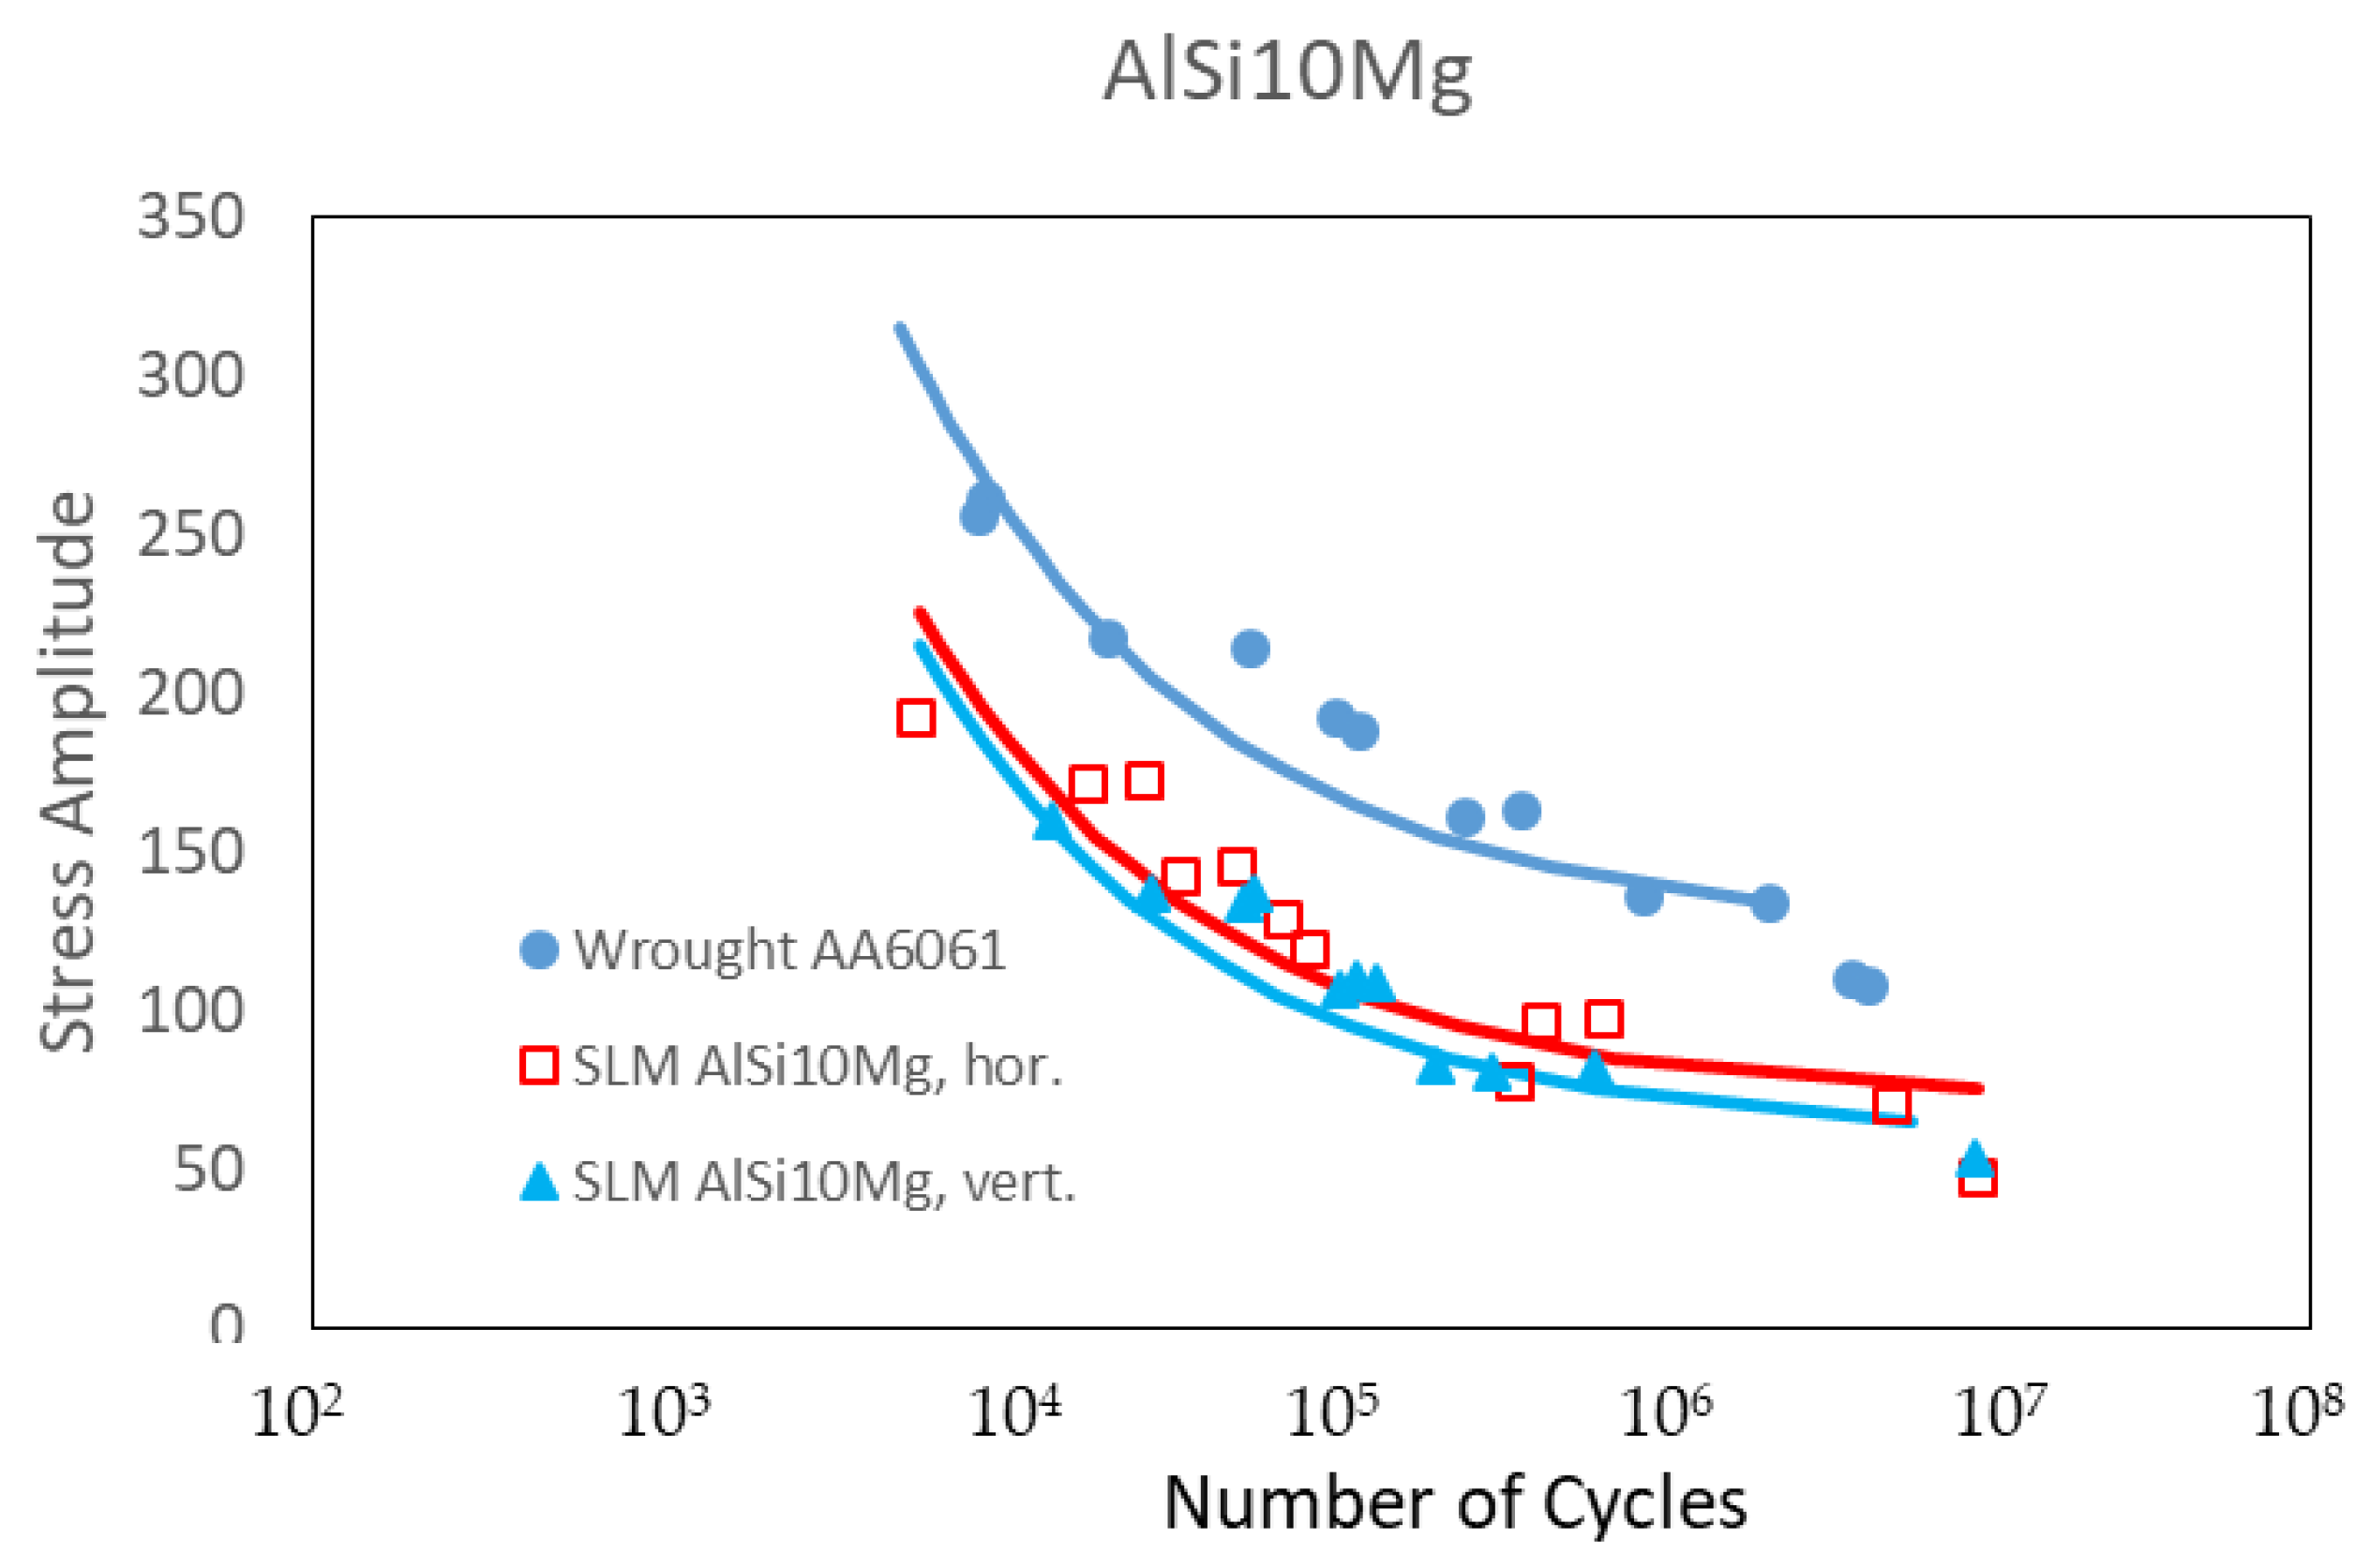
In the present study, the fatigue behaviours of wrought Al 6061, SLM AlSi10Mg in both horizontal and vertical orientations are analyzed using the modified TMW model, following the methods as described in the previous sections. The fatigue behaviours of SLM AlSi10Mg are described using Equations (3) and (4) with and M values obtained using the method of Equations (5) and (6) as given in Table 9. The calculated S-N curves are shown in Figure 6 in comparison with the experimental data.
Table 9.
Surface finish and microstructural factors for AlSi10Mg ( MPa).
Figure 6.
Fatigue behaviours of wrought and AM Ti6Al4V.
Interestingly, the horizontal AM microstructure factor (M = 1.7) is close to the other AM materials analyzed in this study. The vertical direction has a slightly higher microstructural factor (M = 2.08), but all within the range as caused by round ellipsoidal voids. The surface finish factor of SLM AlSi10Mg is 0.756 in both directions, as the polished surface roughness is quite low with = 1.5 μm. Fatigue crack nucleation in SLM AlSi10Mg was found to originate from pores, either internal or at the surface [14].
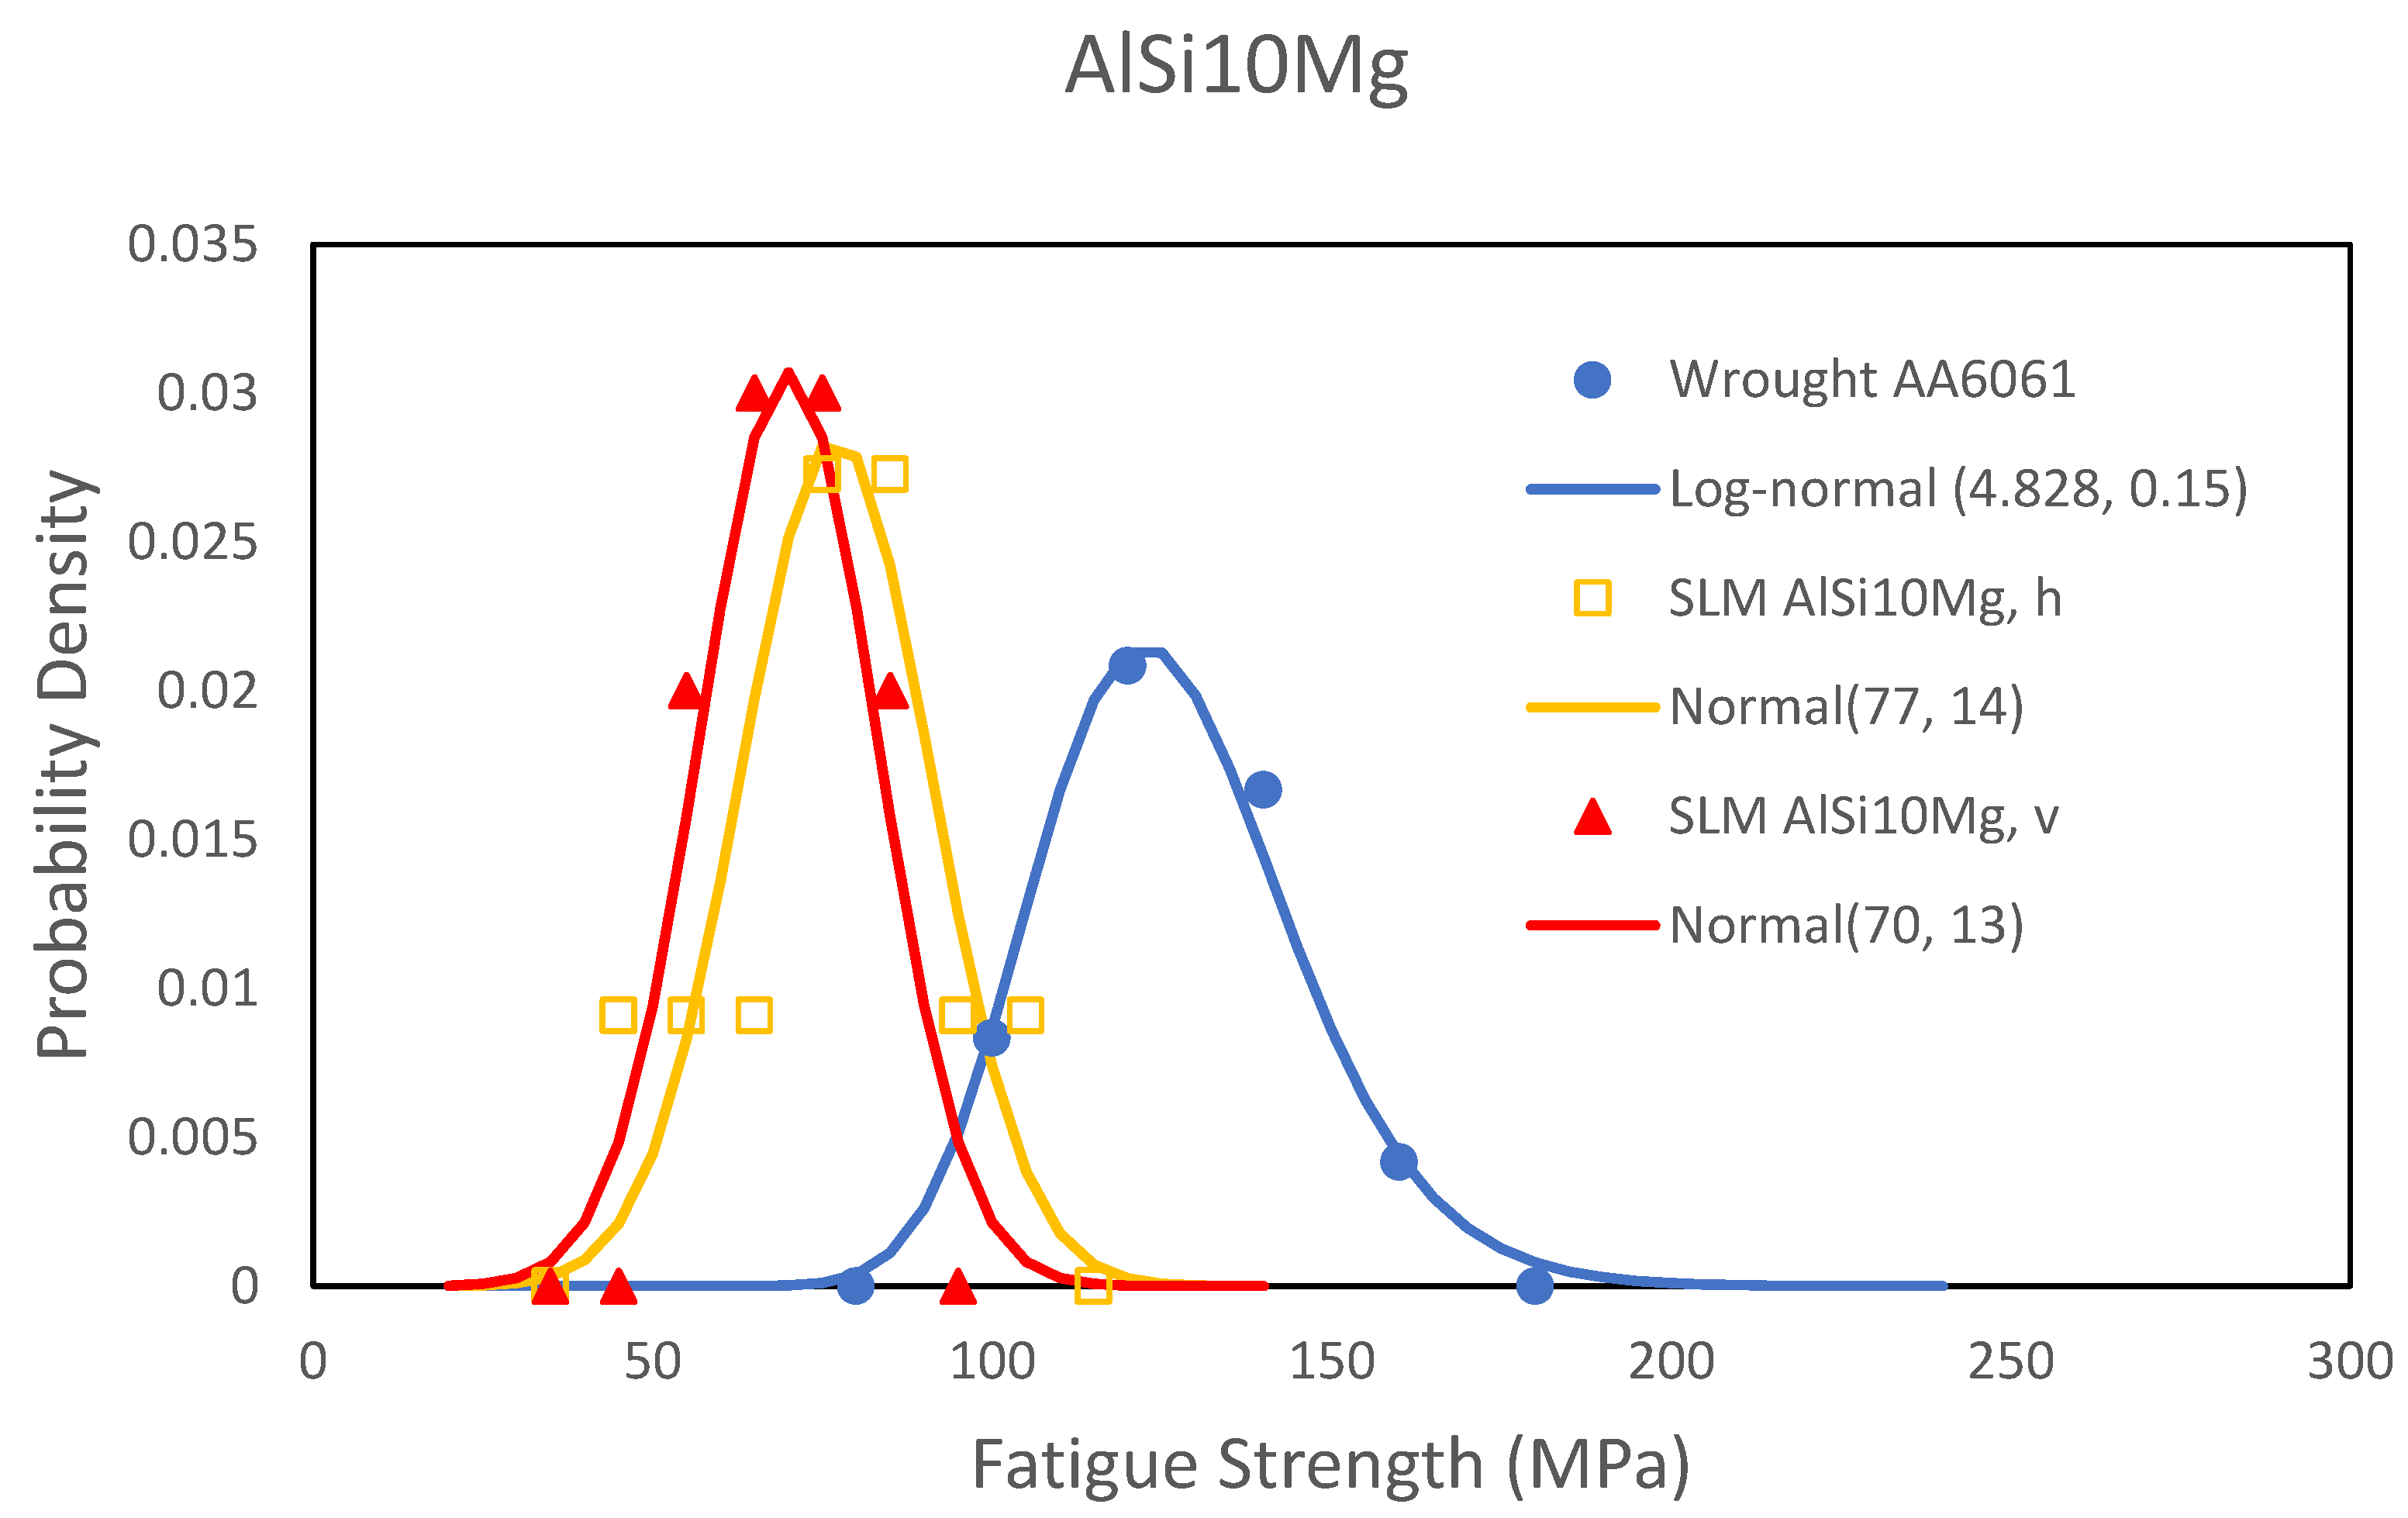
Once the surface finish factor is determined, the TMW model can be used to assess the fatigue endurance limit per coupon such that a statistical distribution may be obtained as follows.
First, rearranging Equation (5), we have:
Then, Equation (8) is used to evaluate the coupon level for every test, and the results are given in Table 10 for wrought Al 6061 and SLM AlSi10Mg. This set of data can be turned into statistical distributions as shown in Figure 7, and the distribution functions and parameters are given in Table 11. The fatigue endurance limit of wrought Al 6061 can be represented by a log-normal distribution, but interestingly, that of the AM AlSi10Mg materials appear to be a normal distribution. During the AM process, the material’s microstructure is formed from powders under high energy input by a laser, which reasonably creates a new microstructure with a normal (symmetrical) distribution of properties. On the other hand, the wrought material has gone through complex thermomechanical processing, which may skew the property distribution. Other examples of the statistical distribution of properties can be found in metallic glasses [29,30]. It is beyond the scope of the current study to completely characterize the statistical distribution of processing-microstructure-property relationships for AM materials, but it is certainly an interesting point of future study. Nevertheless, once the AM material property distribution is determined, the design allowables can be evaluated for application of AM materials, as schematically shown in Figure 8 [7]. The TMW model can facilitate such evaluation by means of its simple analysis and fewer tests to determine the fatigue endurance limit, as opposed to the conventional method to conduct many material fatigue tests, up to 107 cycles.
Table 10.
Fatigue endurance limits of AlSi10Mg per coupon test.
Figure 7.
Distributions of fatigue endurance limit in wrought Al 6061 and SLM AlSi10Mg materials.
Table 11.
Distribution function of fatigue endurance limit of AlSi10Mg.
Figure 8.
Approach to design allowable determination, after [4].
5. Conclusions
The dislocation pileup-based TMW model is further modified to include two factors: (i) the surface finish factor , and (ii) the microstructural factor M, which reflect the effects of surface roughness and microstructure pertinent to AM materials. Through analyses of the fatigue data on wrought and AM forms of 17-4 PH steel, Ti6Al4V and AlSi10Mg, the following conclusions can be made:
- The AM microstructure has an effect of M~1.5–2 times of reduction in fatigue strength on average, relative to their wrought forms, which can be attributed to the presence of porosities in AM materials. HIPing can reduce the value of the microstructural factor relative to the non-HIPed state, but does not fully recover its original microstructural state, i.e., M = 1. It should also be noted that the microstructural factor for plastic strain concentration is not necessarily the same as that for stress concentration. More plastic strain-related data are needed to confirm this effect on AM materials;
- The surface roughness generally contributes to the fatigue life scatter at high stresses (at low stresses, a significant part of life scatter is due to variations in fatigue endurance limit per coupon), but a definite relationship with the arithmetic average surface roughness is not found;
- The modified TMW model can be used to evaluate the distribution of fatigue endurance limit from the whole set of test data, which can facilitate the determination of fatigue strength allowables.
Author Contributions
Conceptualization, X.W.; methodology, X.W.; validation, X.W.; formal analysis, P.K., H.M., J.M., P.S., J.M.T.; data curation, P.K., H.M., J.M., P.S., J.M.T.; writing—original draft preparation, P.K., H.M., J.M., P.S., J.M.T.; writing—review and editing, X.W.; supervision, X.W. All authors have read and agreed to the published version of the manuscript.
Funding
The APC was funded by NSERC CRD Grant#:CRDPJ500913-16.
Data Availability Statement
Available upon request.
Acknowledgments
The first author would like to acknowledge that his activity related to this study was conducted within the Aeronautical Product Development and Certification Program of the National Research Council Canada.
Conflicts of Interest
The authors declare no conflict of interest.
References
- Lewandowski, J.J.; Seifi, M. Metal additive manufacturing: A review of mechanical properties. Annu. Rev. Mater. Res. 2016, 46, 151–186. [Google Scholar] [CrossRef] [Green Version]
- Lopez Taborda, L.L.; Maury, H.; Pacheco, J. Design for additive manufacturing: A comprehensive review of the tendencies and limitations of methodologies. Rapid Prototyp. J. 2021, 27, 918–966. [Google Scholar] [CrossRef]
- Gonzalez Alvarez, A.; Evans, P.L.; Dovgalski, L.; Goldsmith, I. Design, additive manufacture and clinical application of a patient-specific titanium implant to anatomically reconstruct a large chest wall defect. Rapid Prototyp. J. 2021, 27, 304–310. [Google Scholar] [CrossRef]
- Sanaei, N.; Fatemi, A. Defects in additive manufactured metals and their effect on fatigue performance: A state-of-the-art review. Prog. Mater. Sci. 2020, 117, 100724. [Google Scholar] [CrossRef]
- Becker, T.H.; Kumar, P.; Ramamurty, U. Fracture and fatigue in additively manufactured metals. Acta Mater. 2021, 219, 117240. [Google Scholar] [CrossRef]
- Fatemi, A.; Molaei, R.; Simsiriwong, J.; Sanaei, N.; Pegues, J.; Torries, B.; Phan, N.; Shamsaei, N. Fatigue behaviour of additive manufactured materials: An overview of some recent experimental studies on Ti-6Al-4V considering various processing and loading direction effects. Fatigue Fract. Eng. Mater. Struct. 2019, 42, 991–1009. [Google Scholar] [CrossRef]
- AIA Additive Manufacturing Working Group. Recommended Guidance for Certification of AM Component; Aerospace Industries Association: Arlington, VA, USA, 2020. [Google Scholar]
- Tanaka, K.; Mura, T. A dislocation model for fatigue crack initiation. J. Appl. Mech. 1981, 48, 97–103. [Google Scholar] [CrossRef]
- Wu, X.J. On Tanaka-Mura’s fatigue crack nucleation model and validation. Fatigue Fract. Eng. Mater. Struct. 2018, 41, 894–899. [Google Scholar] [CrossRef] [Green Version]
- Wu, X.J. Deformation and Evolution of Life in Crystalline Materials: An Integrated Creep-fatigue Theory; CRC Press: Boca Raton, FL, USA, 2019. [Google Scholar]
- Li, S.; Liu, R.; Wu, X.J.; Zhang, Z. Full-range fatigue life prediction of metallic materials using Tanaka-Mura-Wu model. SAE Mobil. Rxiv 2021, 2016, 1–26. [Google Scholar] [CrossRef]
- Murakami, Y.; Endo, M. Effects of defects, inclusions and inhomogeneities on fatigue strength. Int. J. Fatigue 1994, 16, 163–182. [Google Scholar] [CrossRef]
- Molaei, R.; Fatemi, A.; Phan, N. Multiaxial fatigue of LB-PBF additive manufactured 17–4 PH stainless steel including the effects of surface roughness and HIP treatment and comparisons with the wrought alloy. Int. J. Fatigue 2020, 137, 105646. [Google Scholar] [CrossRef]
- Mower, T.M.; Long, M.J. Mechanical behavior of additive manufactured, powder-bed laser-fused materials. Mater. Sci. Eng. A 2016, 651, 198–213. [Google Scholar] [CrossRef]
- Tyson, W.R.; Miller, W.A. Surface free energies of solid metals: Estimation from liquid surface tension measurements. Surf. Sci. 1977, 62, 267–276. [Google Scholar] [CrossRef]
- Eshelby, J.D. The determination of the elastic field of an ellipsoidal inclusion, and related problems. Proc. R. Soc. Lond. Ser. A Math. Phys. Sci. 1957, 241, 376–396. [Google Scholar]
- Shibata, M.; Ono, K. Internal stresses due to an oblate spheroidal inclusion: Misfit, Inhomogeneity and Plastic Deformation Effects. Acta Metall. 1978, 26, 921–932. [Google Scholar] [CrossRef]
- Wu, X.J. Microstructure-Fatigue Relationships for Cast Irons. SAE Tech. Pap. 2020. [Google Scholar] [CrossRef]
- Yadollahi, A.; Shamsaei, N. Additive manufacturing of fatigue resistant materials: Challenges and opportunities. Int. J. Fatigue 2017, 98, 14–31. [Google Scholar] [CrossRef] [Green Version]
- Fatemi, A.; Molaei, R.; Sharifimehr, S.; Shamsaei, N.; Phan, N. Torsional fatigue behavior of wrought and additive manufactured Ti-6Al-4V by powder bed fusion including surface finish effect. Int. J. Fatigue 2017, 99, 187–201. [Google Scholar] [CrossRef]
- Fatemi, A.; Molaei, R.; Sharifimehr, S.; Phan, N.; Shamsaei, N. Multiaxial fatigue behavior of wrought and additive manufactured Ti-6Al-4V including surface finish effect. Int. J. Fatigue 2017, 100, 347–366. [Google Scholar] [CrossRef]
- Molaei, R.; Fatemi, A.; Phan, N. Significance of hot isostatic pressing (HIP) on multiaxial deformation and fatigue behaviors of additive manufactured Ti-6Al-4V including build orientation and surface roughness effects. Int. J. Fatigue 2018, 117, 352–370. [Google Scholar] [CrossRef]
- Sterling, A.J.; Torries, B.; Shamsaei, N.; Thompson, S.M.; Seely, D.W. Fatigue behavior and failure mechanisms of direct laser deposited Ti–6Al–4V. Mater. Sci. Eng. A 2016, 655, 100–112. [Google Scholar] [CrossRef]
- Pegues, J.; Roach, M.; Williamson, R.S.; Shamsaei, N. Surface roughness effects on the fatigue strength of additively manufactured Ti-6Al-4V. Int. J. Fatigue 2018, 116, 543–552. [Google Scholar] [CrossRef]
- Aboulkhair, N.T.; Simonelli, M.; Parry, L.; Ashcroft, I.; Tuck, C.; Hague, R. 3D printing of Aluminium alloys: Additive Manufacturing of Aluminium alloys using selective laser melting. Prog. Mater. Sci. 2019, 106, 100578. [Google Scholar] [CrossRef]
- Uzan, N.E.; Shneck, R.; Yeheskel, O.; Frage, N. Fatigue of AlSi10Mg specimens fabricated by additive manufacturing selective laser melting (AM-SLM). Mater. Sci. Eng. A 2017, 704, 229–237. [Google Scholar] [CrossRef]
- Romano, S.; Brückner-Foit, A.; Brandão, A.; Gumpinger, J.; Ghidini, T.; Beretta, S. Fatigue properties of AlSi10Mg obtained by additive manufacturing: Defect-based modelling and prediction of fatigue strength. Eng. Fract. Mech. 2018, 187, 165–189. [Google Scholar] [CrossRef]
- Siddique, S.; Awd, M.; Tenkamp, J.; Walther, F. High and very high cycle fatigue failure mechanisms in selective laser melted aluminum alloys. J. Mater. Res. 2017, 32, 4296. [Google Scholar] [CrossRef]
- Du, Y.; Zhou, Q.; Jia, Q.; Shi, Y.; Wang, H.; Wang, J. Imparities of shear avalanches dynamic evolution in a metallic glass. Mater. Res. Lett. 2020, 8, 357–363. [Google Scholar] [CrossRef]
- Zhou, Q.; Han, W.; Luo, D.; Du, Y.; Xie, J.; Wang, X.-Z.; Zou, Q.; Zhao, X.; Wang, H.; Beake, D. Mechanical and tribological properties of Zr–Cu–Ni–Al bulk metallic glasses with dual-phase structure. Wear 2021, 474, 203880. [Google Scholar] [CrossRef]
Publisher’s Note: MDPI stays neutral with regard to jurisdictional claims in published maps and institutional affiliations. |
© 2021 by the authors. Licensee MDPI, Basel, Switzerland. This article is an open access article distributed under the terms and conditions of the Creative Commons Attribution (CC BY) license (https://creativecommons.org/licenses/by/4.0/).