Article

Cloud-Based Analytics Module for Predictive Maintenance of the Textile Manufacturing Process

1
Department of Engineering Science and Ocean Engineering, National Taiwan University, Taipei 10617, Taiwan
2
Department of Industrial Engineering and Management, National Yunlin University of Science and Technology, Yunlin 640301, Taiwan
*
Author to whom correspondence should be addressed.
Appl. Sci. 2021, 11(21), 9945; https://doi.org/10.3390/app11219945
Submission received: 31 August 2021 / Revised: 9 October 2021 / Accepted: 21 October 2021 / Published: 25 October 2021
(This article belongs to the Special Issue Information and Communications Technology for Industry 4.0)

Abstract

:
Industry 4.0 has remarkably transformed many industries. Supervisory control and data acquisition (SCADA) architecture is important to enable an intelligent and connected manufacturing factory. SCADA is extensively used in many Internet of Things (IoT) applications, including data analytics and data visualization. Product quality management is important across most manufacturing industries. In this study, we extensively used SCADA to develop a cloud-based analytics module for production quality predictive maintenance (PdM) in Industry 4.0, thus targeting textile manufacturing processes. The proposed module incorporates a complete knowledge discovery in database process. Machine learning algorithms were employed to analyze preprocessed data and provide predictive suggestions for production quality management. Equipment data were analyzed using the proposed system with an average mean-squared error of ~0.0005. The trained module was implemented as an application programming interface for use in IoT applications and third-party systems. This study provides a basis for improving production quality by predicting optimized equipment settings in manufacturing processes in the textile industry.

1. Introduction

Internet of things (IoT) is a system of interconnection and communication between physical objects, sensors, and software; it comprises a perception layer, network layer, and application layer. IoT technologies include edge components (e.g., device, sensors, and actuators) and network-to-cloud connectivity (e.g., software and system). The industrial IoT (IIoT) integrates data, devices, and industrial systems to facilitate automation, monitoring, and intelligence. Due to the rapid development of IIoT-related technologies, large amounts of device data are uploaded to the cloud [1] IIoT is focused on value creation or cocreation by the improved management of industrial assets, production quality, and quantity. Depending on the nature of the industry, most IIoT providers offer several applications. The most well-known examples are Microsoft Azure, Amazon Web Services, and Cloudera; however, in the factory production line, each industry has its unique manufacturing processes and equipment set. In the textile industry, current manufacturing process planning usually depends on the operating experience of senior employees. Most related studies aim to solve the energy waste problem and supplier management selection for manufacturing. Some studies examined predictive maintenance (PdM) for product quality by analyzing the equipment set for textile manufacturing. For the textile industry, the equipment is extremely expensive; one advanced textile equipment average cost is $140,178. Learning the equipment setting from the existing data through data analytics technologies is an efficient approach for the manufacturing process. Data analytics is an economic approach to enable equipment intelligence without purchasing new equipment by optimizing the parameter setting of equipment in the production line. To address these challenges, herein, we developed a hybrid method combining the best practice of the existing manufacturing process and to-be Industry 4.0 to analyze equipment data, predict the quality of production, and maintain equipment settings in the textile manufacturing process. Compared with other modules, this study provides integrated functionalities from data analytics and machine learning (ML) model deployment. Users can then import data and use trained data model to monitor current equipment settings and modify parameter settings in a timely manner. For effective industrial management, the effective use of industrial Big Data to enhance the manufacturing efficiency is important. In this study, data analysis methods were applied to equipment data for improving production quality in textile manufacturing processes. This study is split into two parts: data analysis and deployment of trained model. The former focuses on PdM for improved production quality, whereas the latter targets value creation through smart manufacturing. We surveyed cloud computing-related research and employed ML to analyze data from different industries. The aims of this study are listed below:
To examine the prediction outcome of different ML algorithms in real textile equipment data.
To make an economic approach to predict product quality using existing equipment data in the ML module without purchasing a new intelligent device.
To provide PdM application programming interface (API) to predict textile production quality in the textile manufacturing field.

1.1. Textile Manufacturing

Textile manufacturing involves several processes and equipment. Considering one textile factory as an example, the manufacturing facility contains ~2000 textile carts [2]. The textile industry heavily depends on manufacturing technologies and must account for factors such as materials, equipment settings, and facility planning. IoT-related technologies are efficient tools for textile companies to manage complex manufacturing plans and facilities. Herein, as a case study, we used one global textile company, applying data analytics to predict the equipment settings required to improve product quality in their factory. Such textile products must pass via four manufacturing steps, including warping, sizing, beaming, and weaving, all of which can influence quality of finished goods (Figure 1).
  • Warping
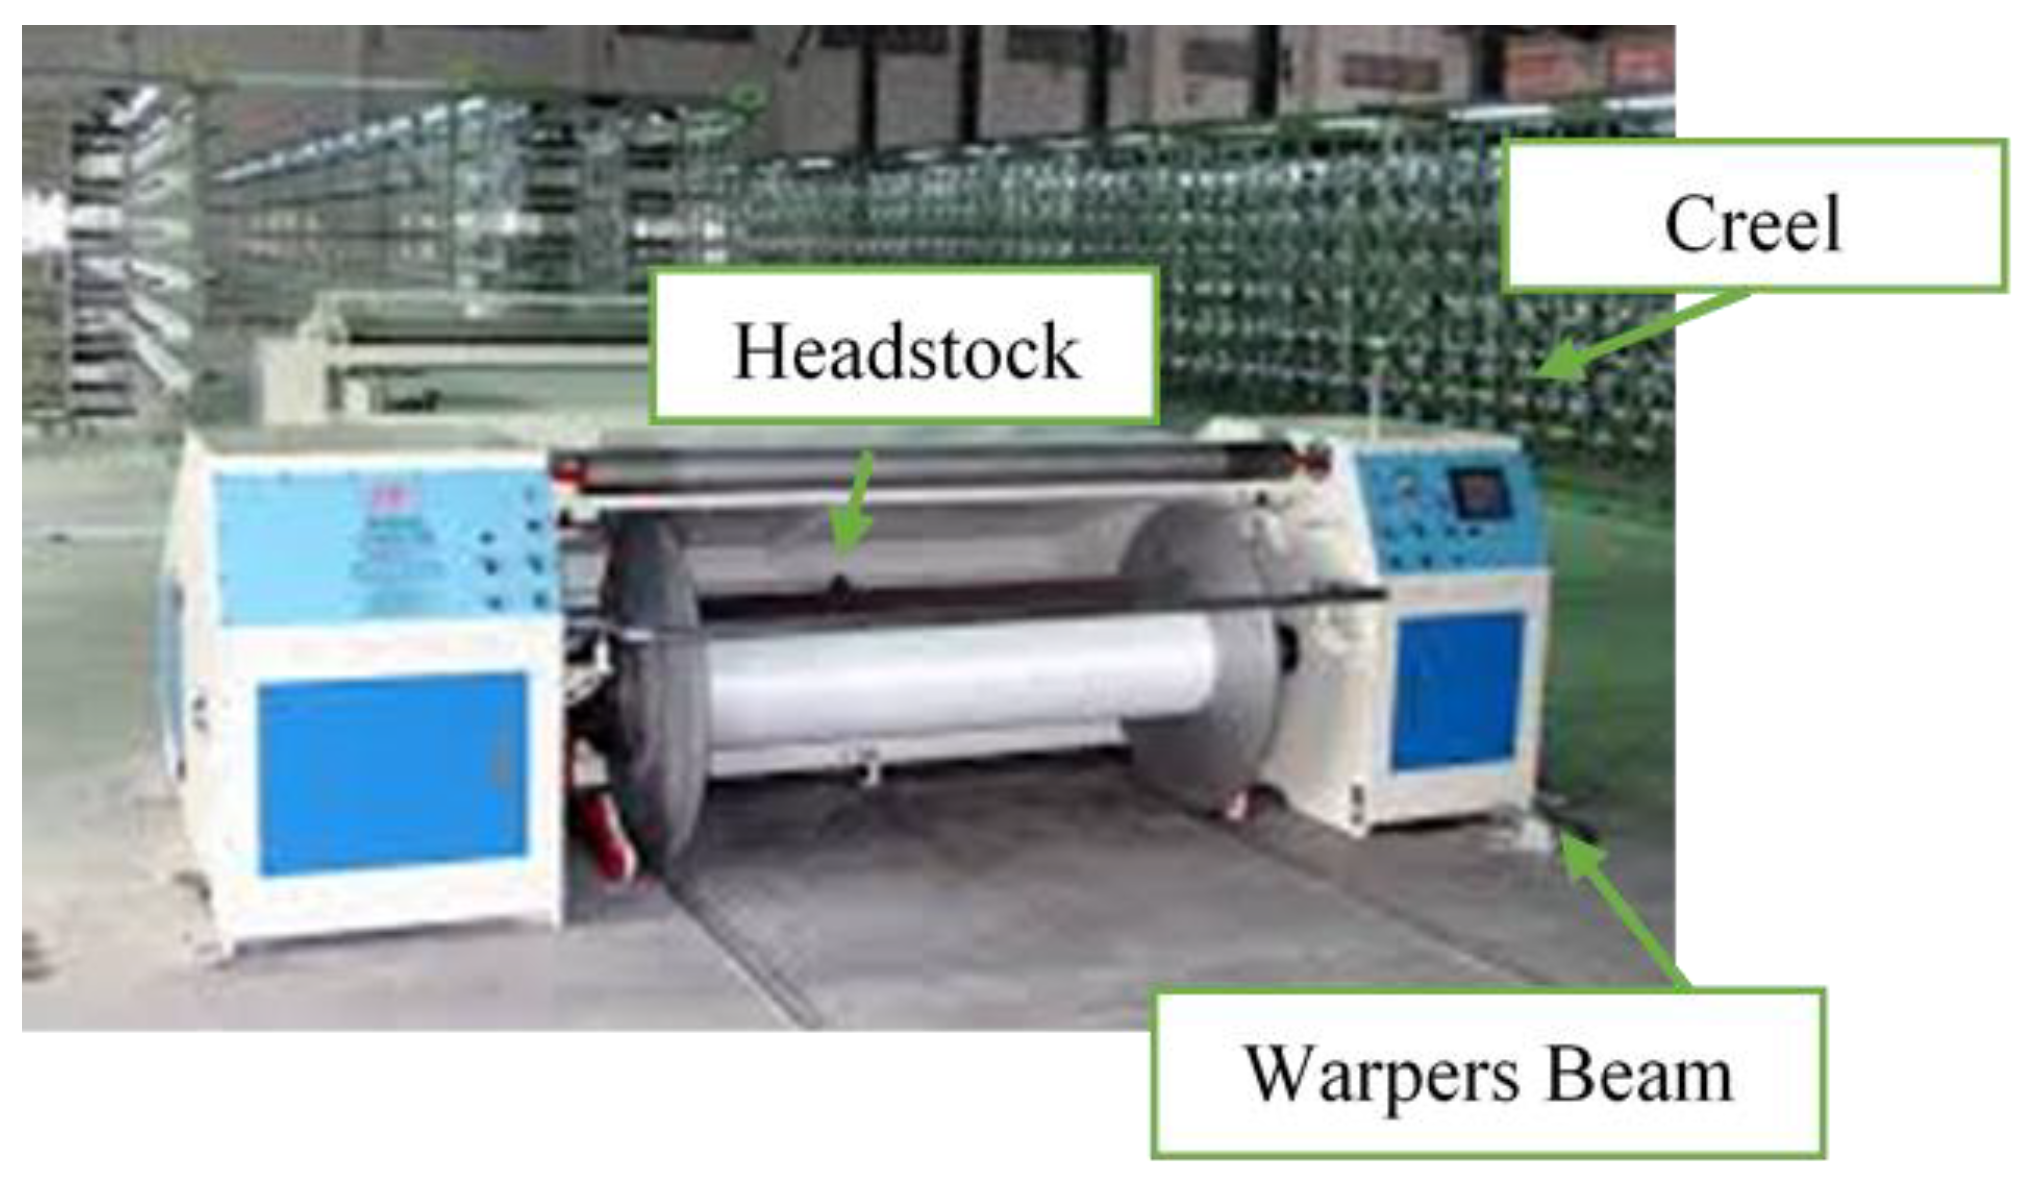
Warping involves the parallel winding of yarns onto a warp beam of the desired width. During warping, yarn is transferred in parallel from cones positioned on the creel onto the warper beam [3,4]. A warping machine comprises several parts, including the warping drum, creel, and headstock. For the warping process, the warping machine is used to bind multiple yarns from individual yarns (Figure 2).
2.
Sizing
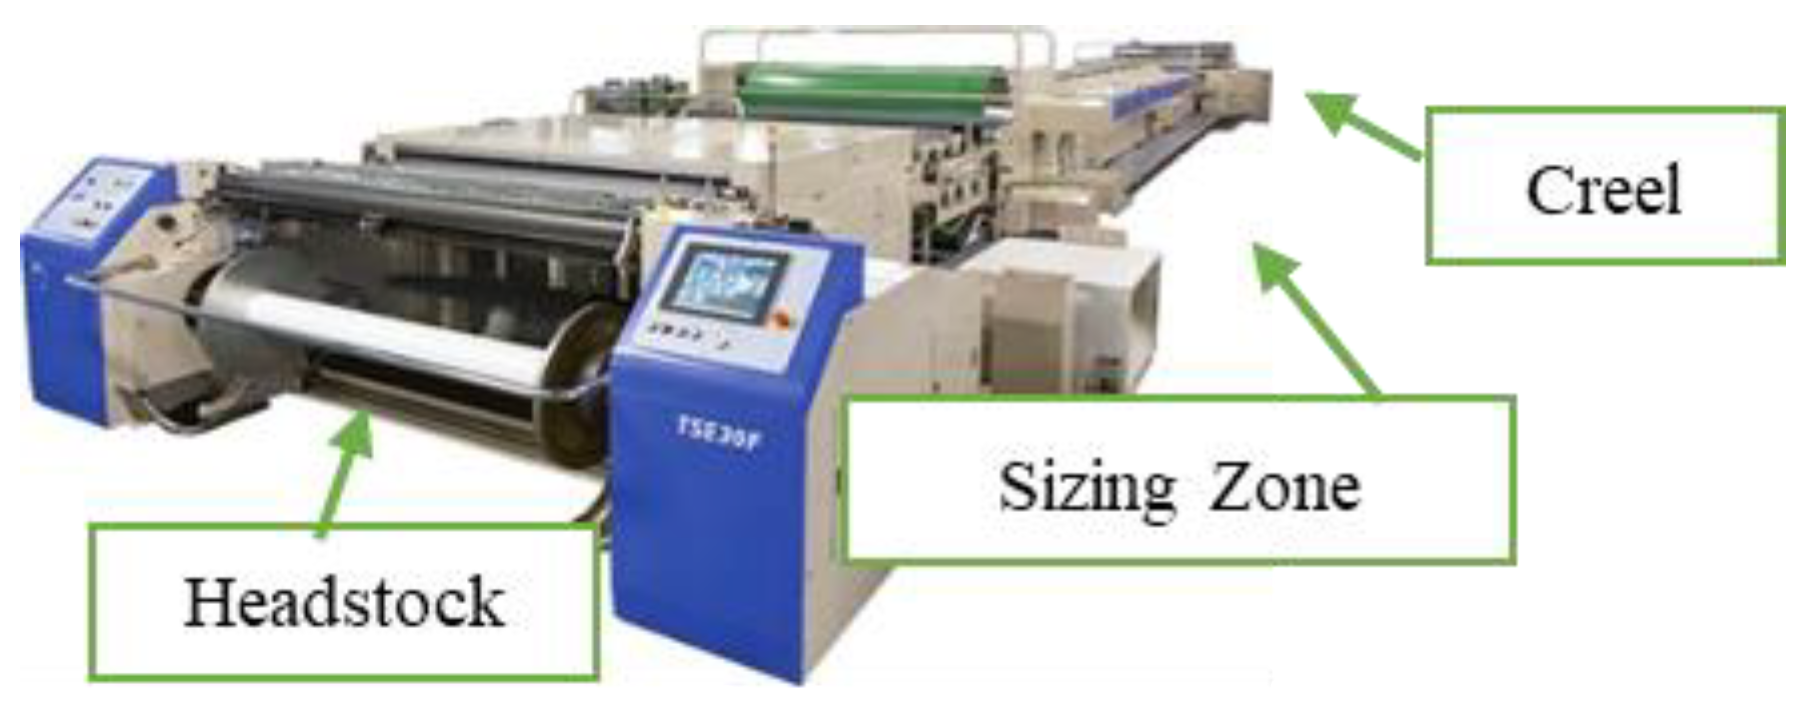
Sizing is the next step after warping; it involves applying a protective coating to the yarn to minimize breakage during the weaving process and to improve the absorption and wear characteristics of finished fabric. The sizing machine coats the yarn surface with an appropriate film-forming polymeric material and impregnates the yarn’s core using a binding agent (Figure 3).
3.
Beaming
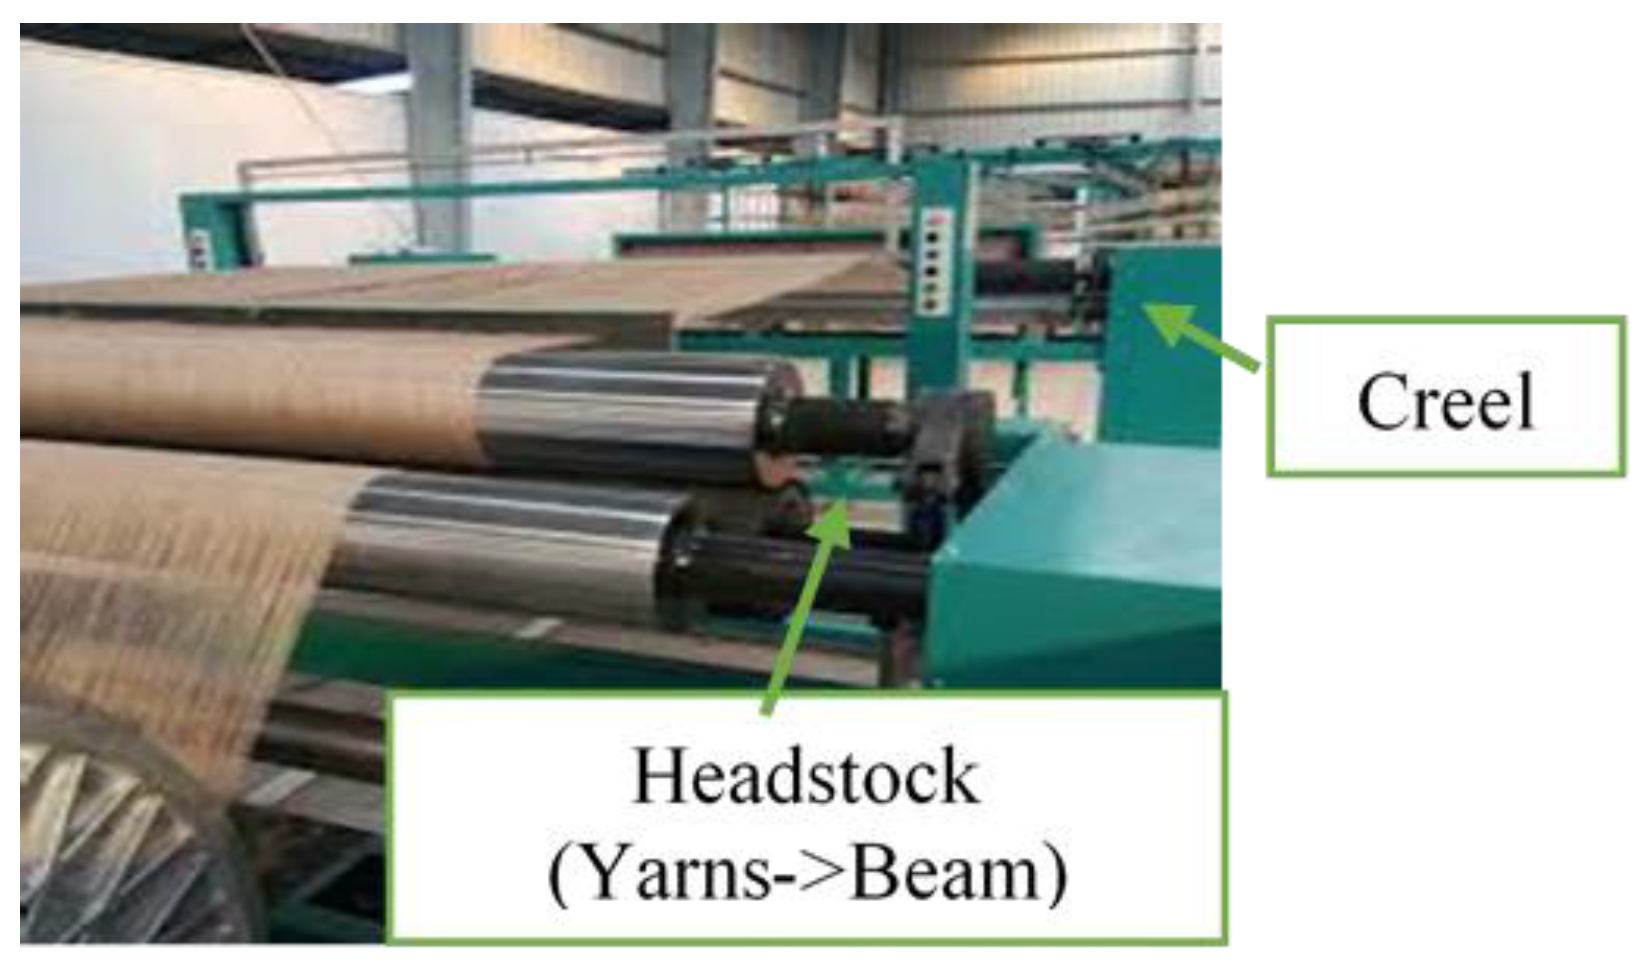
In the beaming process, warp yarns are withdrawn from individual packages on creel and wound onto a single creel or warping beam. The beaming machine is then used to wind beams using a yarn (Figure 4).
4.
Weaving
In textile manufacturing, product quality depends on the quality of the Work in Process (WIP) at each stage of the process. Warping, beaming, and sizing affect the quality of textiles in the weaving process.

1.2. IIoT and Textile Manufacturing

On a factory production line, different equipment is used for different processes, and equipment settings differ as per process specifics. Speed is an important factor in the warping process [5], and tension is important in the weaving process [6]. In beaming, the focus is on material density settings. In general, equipment speed and tension are important factors for determining the quality of WIP in warping, beaming, sizing, and weaving. Excessively high tension may cause yarns to fracture, whereas excessively low tension may cause yarn breakage [6,7]. Equipment settings account both for the type of process and the composition of raw materials. Settings are determined based on the particular specifications of a textile product, including its weave structure and material. Considerable amount of data are generated by complex manufacturing equipment and raw materials used in textile manufacturing. At each stage in the manufacturing process, effective communication and data sharing are important for efficient quality management. IIoT can connect multiple equipment and other physical objects using network technologies via software platforms such as supervisory control and data acquisition (SCADA). Data can be collected from the edge to the cloud, and the user can access the integrated information and make extended applications such as manufacturing visualization, predictive analytics, and operation management. Recently, IIoT technology has been applied to textile manufacturing [2,8]; textile manufacturing facilities, materials, and other sources of industrial management data can be used in an IIoT application for digitalization, automation, and learning purposes. IIoT technology has been employed in PdM analytics for yarn [9] and seam quality [10]. The primary applications of IIoT in textile manufacturing include equipment and supply chain management; however, quality management is an important issue in the textile industry. To address the challenges of quality management in a complex textile production line, we applied ML algorithms to equipment data for quality prediction. Manufacturing processes and equipment settings can be promptly analyzed and visualized on a cloud platform. The aims of this study are listed below:
  • To predict textile production quality using ML.
  • To create a PdM API for cloud data analytics that can be integrated with third party IoT.
  • To enhance production line performance and enable smart manufacturing.
We predicted production quality and employed an integrated trained module for further use. In Section 1.3, we discuss the trend in IIoT technologies and review the PdM-related literature on manufacturing. In Section 2, we describe the primary ML algorithms used to analyze equipment data in a practical factory and the dataset and evaluation criteria. The results of our analyses are presented in Section 3. Section 4 discusses the impact of cloud data analytics and related matters. Finally, Section 5 concludes this study, describing the study’s significance and limitations and providing suggestions for future work.

1.3. Current Trends in IIoT and PdM

As per an International Data Corporation (IDC) report, the global sales of IoT-related technologies reached USD 726 billion in 2019 and are expected to reach USD 1.1 trillion in 2023, a 51% increase, based on the latest forecast by IDC, with manufacturing operations accounting for 13% market share [11]. IIoT is projected to rapidly grow with the market size reaching USD 949 billion by 2025, as per a report by Grand View Research [12]. Worldwide spending on IIoT-related software and hardware is projected to increase from USD 68.8 billion in 2019 to USD 98.2 billion in 2024 as per a report by a market research firm [13]. Most IoT market reports indicate a significant potential for IoT technologies and predict growth for the rapidly developing IIoT market. IIoT-related technologies include data connection, cyber networks, cloud platforms, data storage, and software applications. Zhou et al. analyzed the effects of energy consumption on data processing and system design [14]. Other studies examined 5G communication technology for IIoT [15]. Recently, certain researchers have focused on data analytics to address IIoT challenges using computational approaches such as ML and data mining [16,17]. Technologies for secure device communication have been employed in IIoT system development [18,19], and many studies have been dedicated for deploying cloud systems in IoT application layers such as a Blockchain-based platform [20], production-logistics systems [21], and visualization applications [22]. IIoT technologies are associated with software, hardware, and firmware. IIoT systems include devices, networks, security, data analytics, and software applications. Most previous studies independently focused on one of the above issues. In this study, for PdM analysis, we combined data analytics and system design to develop a restful API.
The high expense and complexities of maintaining the sophisticated equipment used in modern manufacturing drive the demand for enhanced production efficiency. PdM for Industry 4.0 involves the prediction of equipment failure by analyzing data (e.g., equipment, production, and environmental data) to identify patterns and predict issues before anomalies are noticed. PdM has attracted considerable attention in the manufacturing industry, and global companies, such as Microsoft, GE, and Bosch, already provide PdM solutions for manufacturing. We reviewed 1154 PdM-related studies for the last five years, thus analyzing the time trends and disciplinary distributions of emerging PdM-related topics. We reported that intelligence and automation are the primary concerns driving PdM-related studies with the most common forms of research being system design, systematic analysis, and critical review. High-frequency keywords for PdM-related studies include “Cloud”, “Industry”, “IoT”, “Big Data”, and “Intelligent.” For a better understanding of the PdM-related trend, we analyzed the comprehensive profile of PdM by reviewing studies from Google Scholar. Publish or Perish (PoP) software was used to survey relevant and related studies from 2010 to 2019. PdM is extensively employed in manufacturing processes (Table 1).
PdM-related studies focused on equipment vibration and temperature monitoring [23], systemic failure of electric power transformers [24], remaining useful life prediction for machining equipment [25], optimization of maintenance decision variables [26], fault diagnosis [27], car maintenance [30], airline maintenance scheduling [31], and wind turbine maintenance [32]. Moreover, we examined existing cloud solutions for implementing PdM in a cloud-based ML module. The results show that cloud computing solutions offer convenient tools for users to analyze their equipment data and develop maintenance strategies. Recently, PdM has been employed for maintaining textile manufacturing equipment, including sewing machines [33], textile machines [34], and maintenance scheduling [35]. Existing studies used fuzzy logic [35], statistical methods [36], and data mining to predict textile equipment failure. Some studies have indicated that industry 4.0 can assistant enterprises understand their maintenance and production activities [37]. Edge computing has been employed in prognostic health management (PHM) from machinery producers’ or production management perspective [38,39].

2. Preliminary Function

2.1. Linear Regression

Linear regression is a linear productive approach for modeling the relationship between independent and dependent variables. It is expressed as follows:
y ^ i = β ^ 0 j + j = 1   k x j   β ^ 1 j + ε i ,
where y is the i-th independent value, x the i-th dependent value, B0 the intercept, B1 the regression slope coefficient from a sample of k data points, and ε the error.

2.2. Least Absolute Shrinkage Selector Operator Regression

The least absolute shrinkage selector operator (LASSO) is a regression analysis algorithm that performs regularization and variable selection to increase prediction accuracy. It is expressed as follows:
B ^ lasso = argmin i = 1 N ( y i B 0 j = 1 p x ij B j ) 2 subject   to = j = 1 p | B j | t ,  
where yi is the i-th observation value on the target variable from n data points, xij the vector of feature measurement for explanatory variables p, and B ^ lasso the LASSO estimator. LASSO regression minimizes the residual sum of squares, and L1 regularization is the penalty term in LASSO regression.

2.3. Ridge Regression

Ridge regression is a method used to estimate the correlations between predictor and observation variables. Its cost function is calculated by adding a penalty equivalent to the square of the magnitude of coefficients. The ridge estimates of coefficients are similar to those of LASSO regression. The difference between these two forms of regression is the regularization penalty term: Ridge regression uses an L2 regularization penalty term, whereas LASSO regression uses an L1 penalty term. The equation for ridge regression is listed below:
B ^ ridge = argmin i = 1 N ( y i B 0 j = 1 p x ij B j ) 2 subject   to = j = 1 p B j 2 t
where yi is the i-th observation value on the target variable from the n data points, xij the vector of feature measurement for explanatory variables p, and β the estimator. Ridge regression minimizes the residual sum of squares, and B ^ ridge is the ridge regression estimate.

2.4. Elastic Net Regression

Elastic net is a regularized regression method similar to LASSO and ridge regression. Penalty calculation is the difference between elastic net and other two algorithms. Elastic net employs the aggregation of the L1 and L2 penalties of LASSO and ridge regression, respectively.
B ^ elastic = argmin i = 1 N ( y i B 0 j = 1 p x i j B j ) 2 subject   to = j = 1 p B j 2 t + j = 1 p | B j | t

3. Method

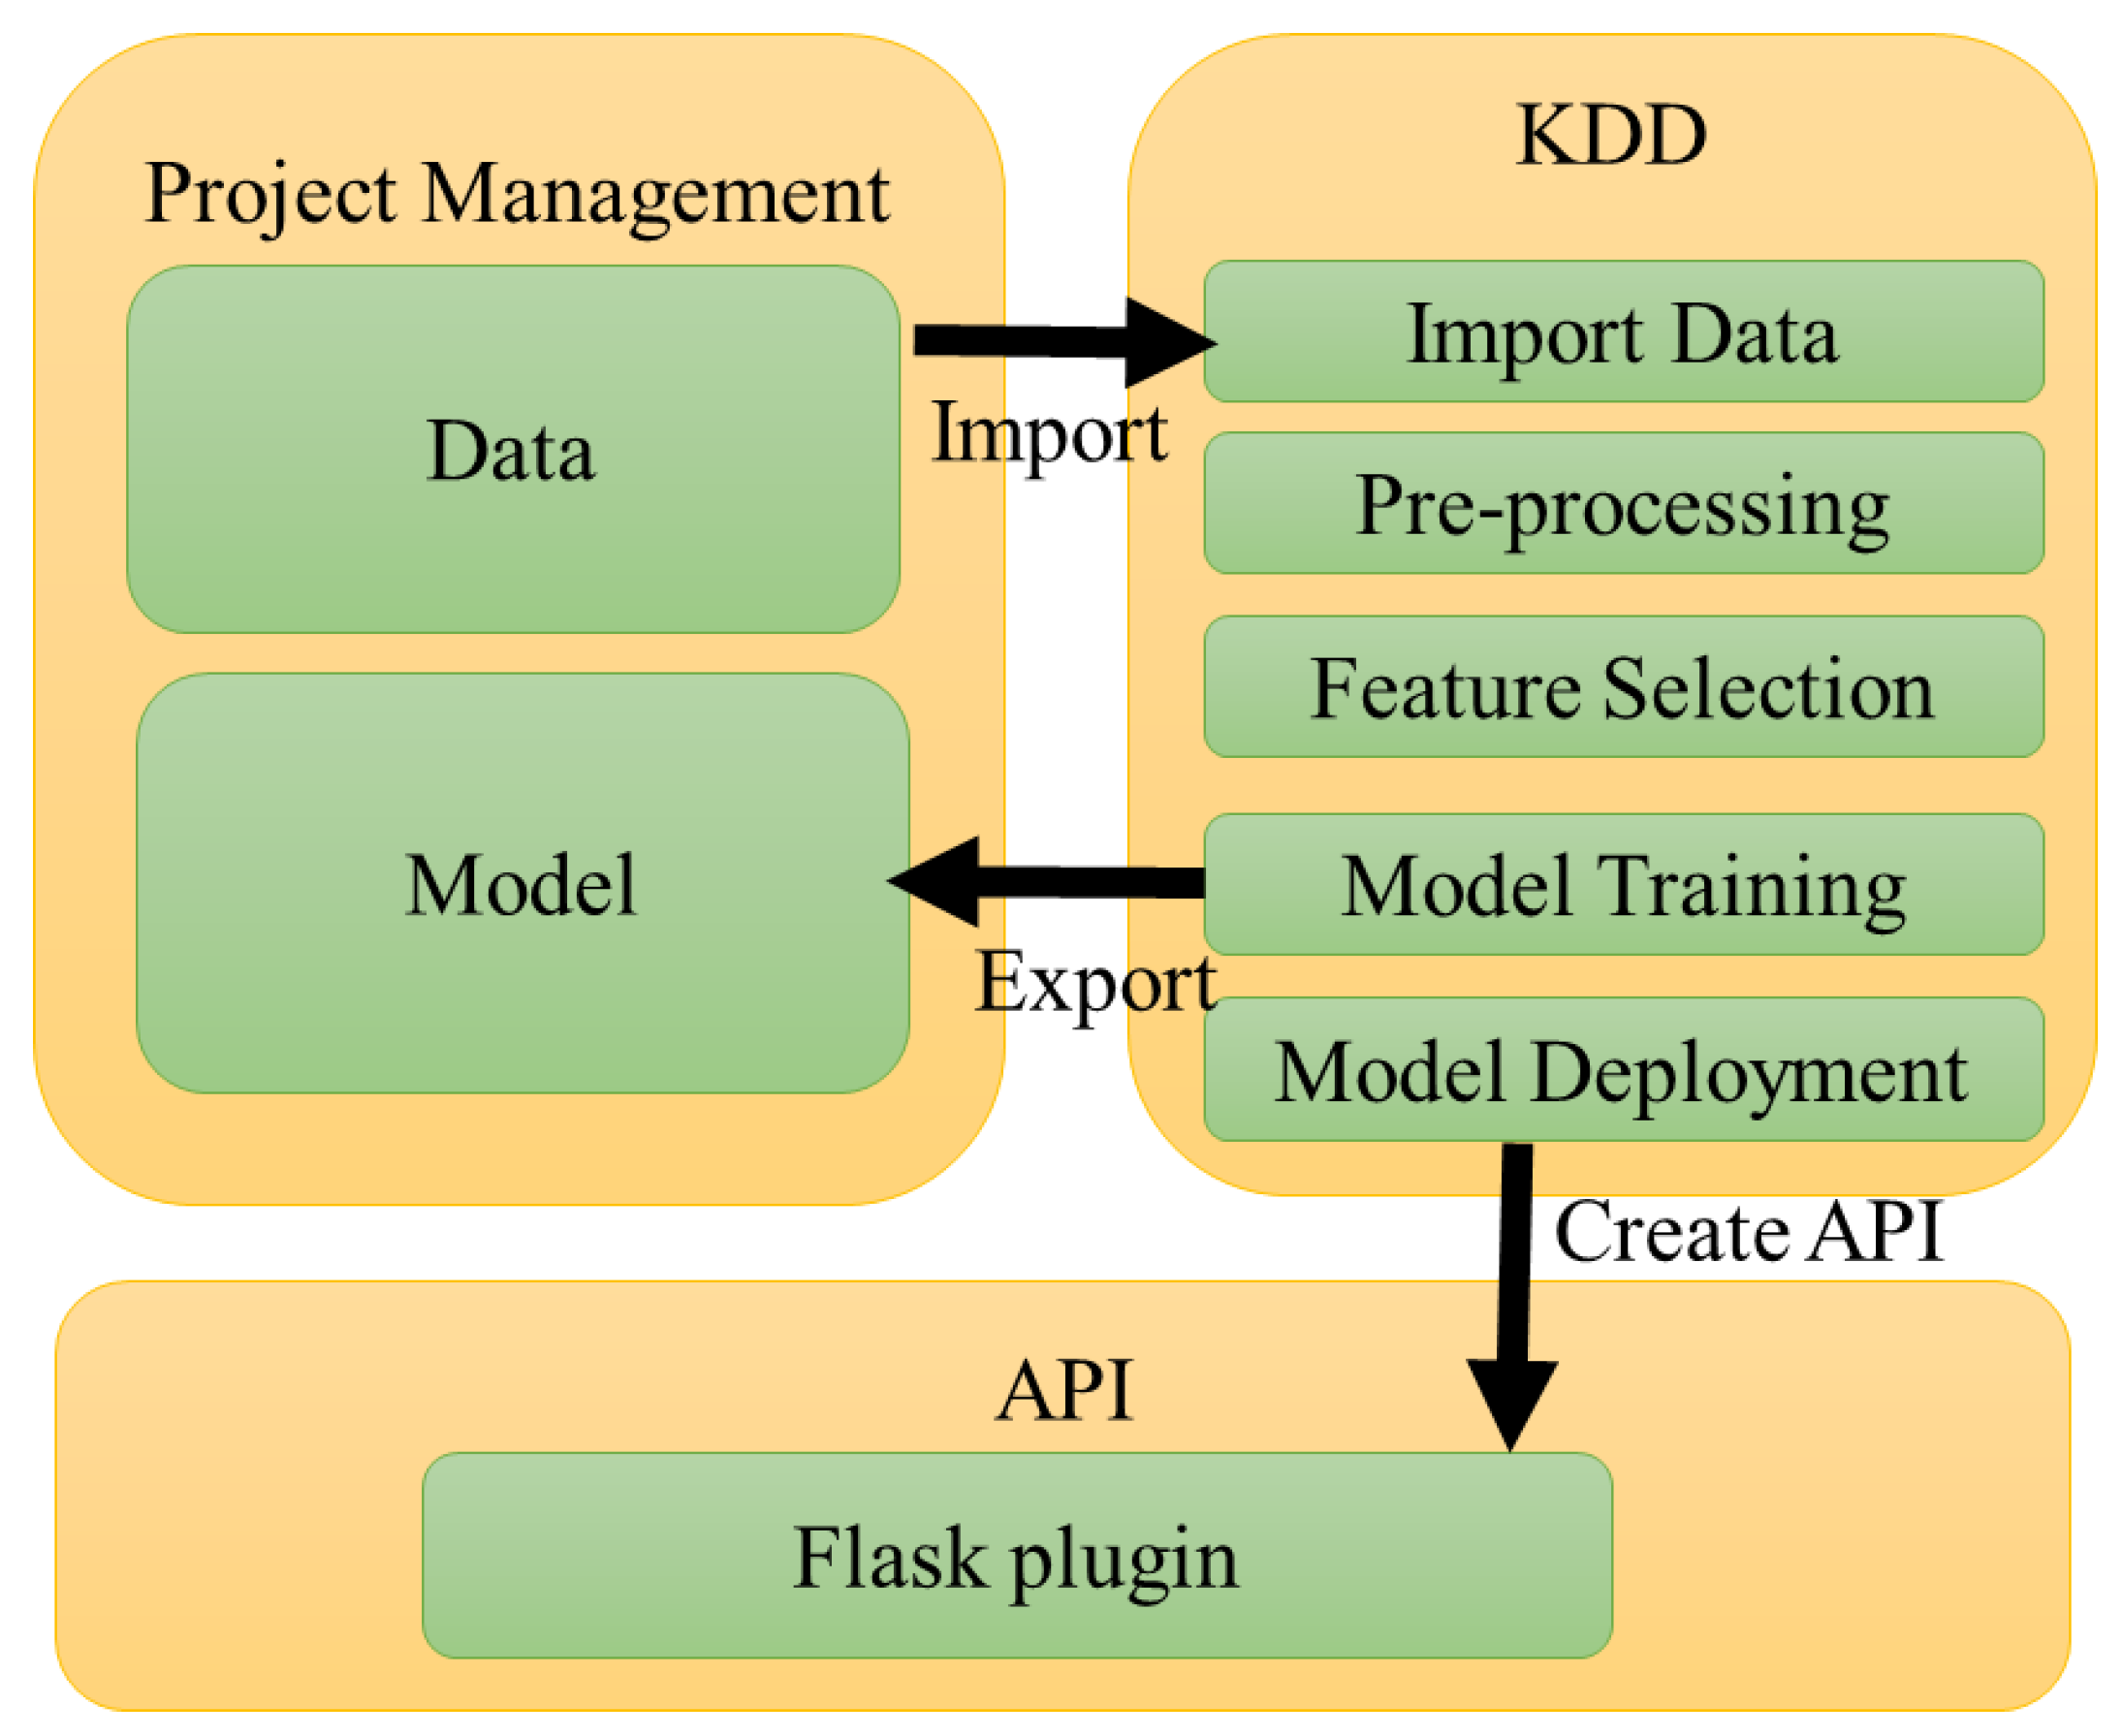
In this study, we employed the standard knowledge discovery in database (KDD) process to analyze equipment data. KDD is a standard procedure used to obtain valuable information from imported data; it involves data collection and preprocessing, data modeling, model evaluation, and knowledge deployment (Figure 5). Previous studies reported that KDD has considerable potential for manufacturing by applying different ML algorithms in multiple stages of KDD. Therefore, it can provide better insights into processes, allowing for predicting unqualified products and machine failure for preventive maintenance [37]. There is considerable interest and a recent trend to use data mining KDD in various areas, including manufacturing and logistics; it has shown considerable impact on manufacturing processes. The proliferation of IIoT applications in this area has far-reaching implications in industrial data analytics. Usually, the KDD procedure is executed on a local server. To improve the use of data computing, we herein run the KDD procedure on a cloud platform. The functions of each KDD stage are then packaged as an API library; thus, it can support real-time and automation analytics. The real-time equipment data are then submitted to the cloud, and then KDD automatically processes each stage with different algorithms. Compared with the local server, the proposed framework can be applied on a timely basis to diverse databases and different types of source platforms using API communication. In this study, to enhance the quality of the weaving preparation process, equipment data from a textile process were used in processing, analysis, evaluation, and deployment steps.

3.1. Data Model

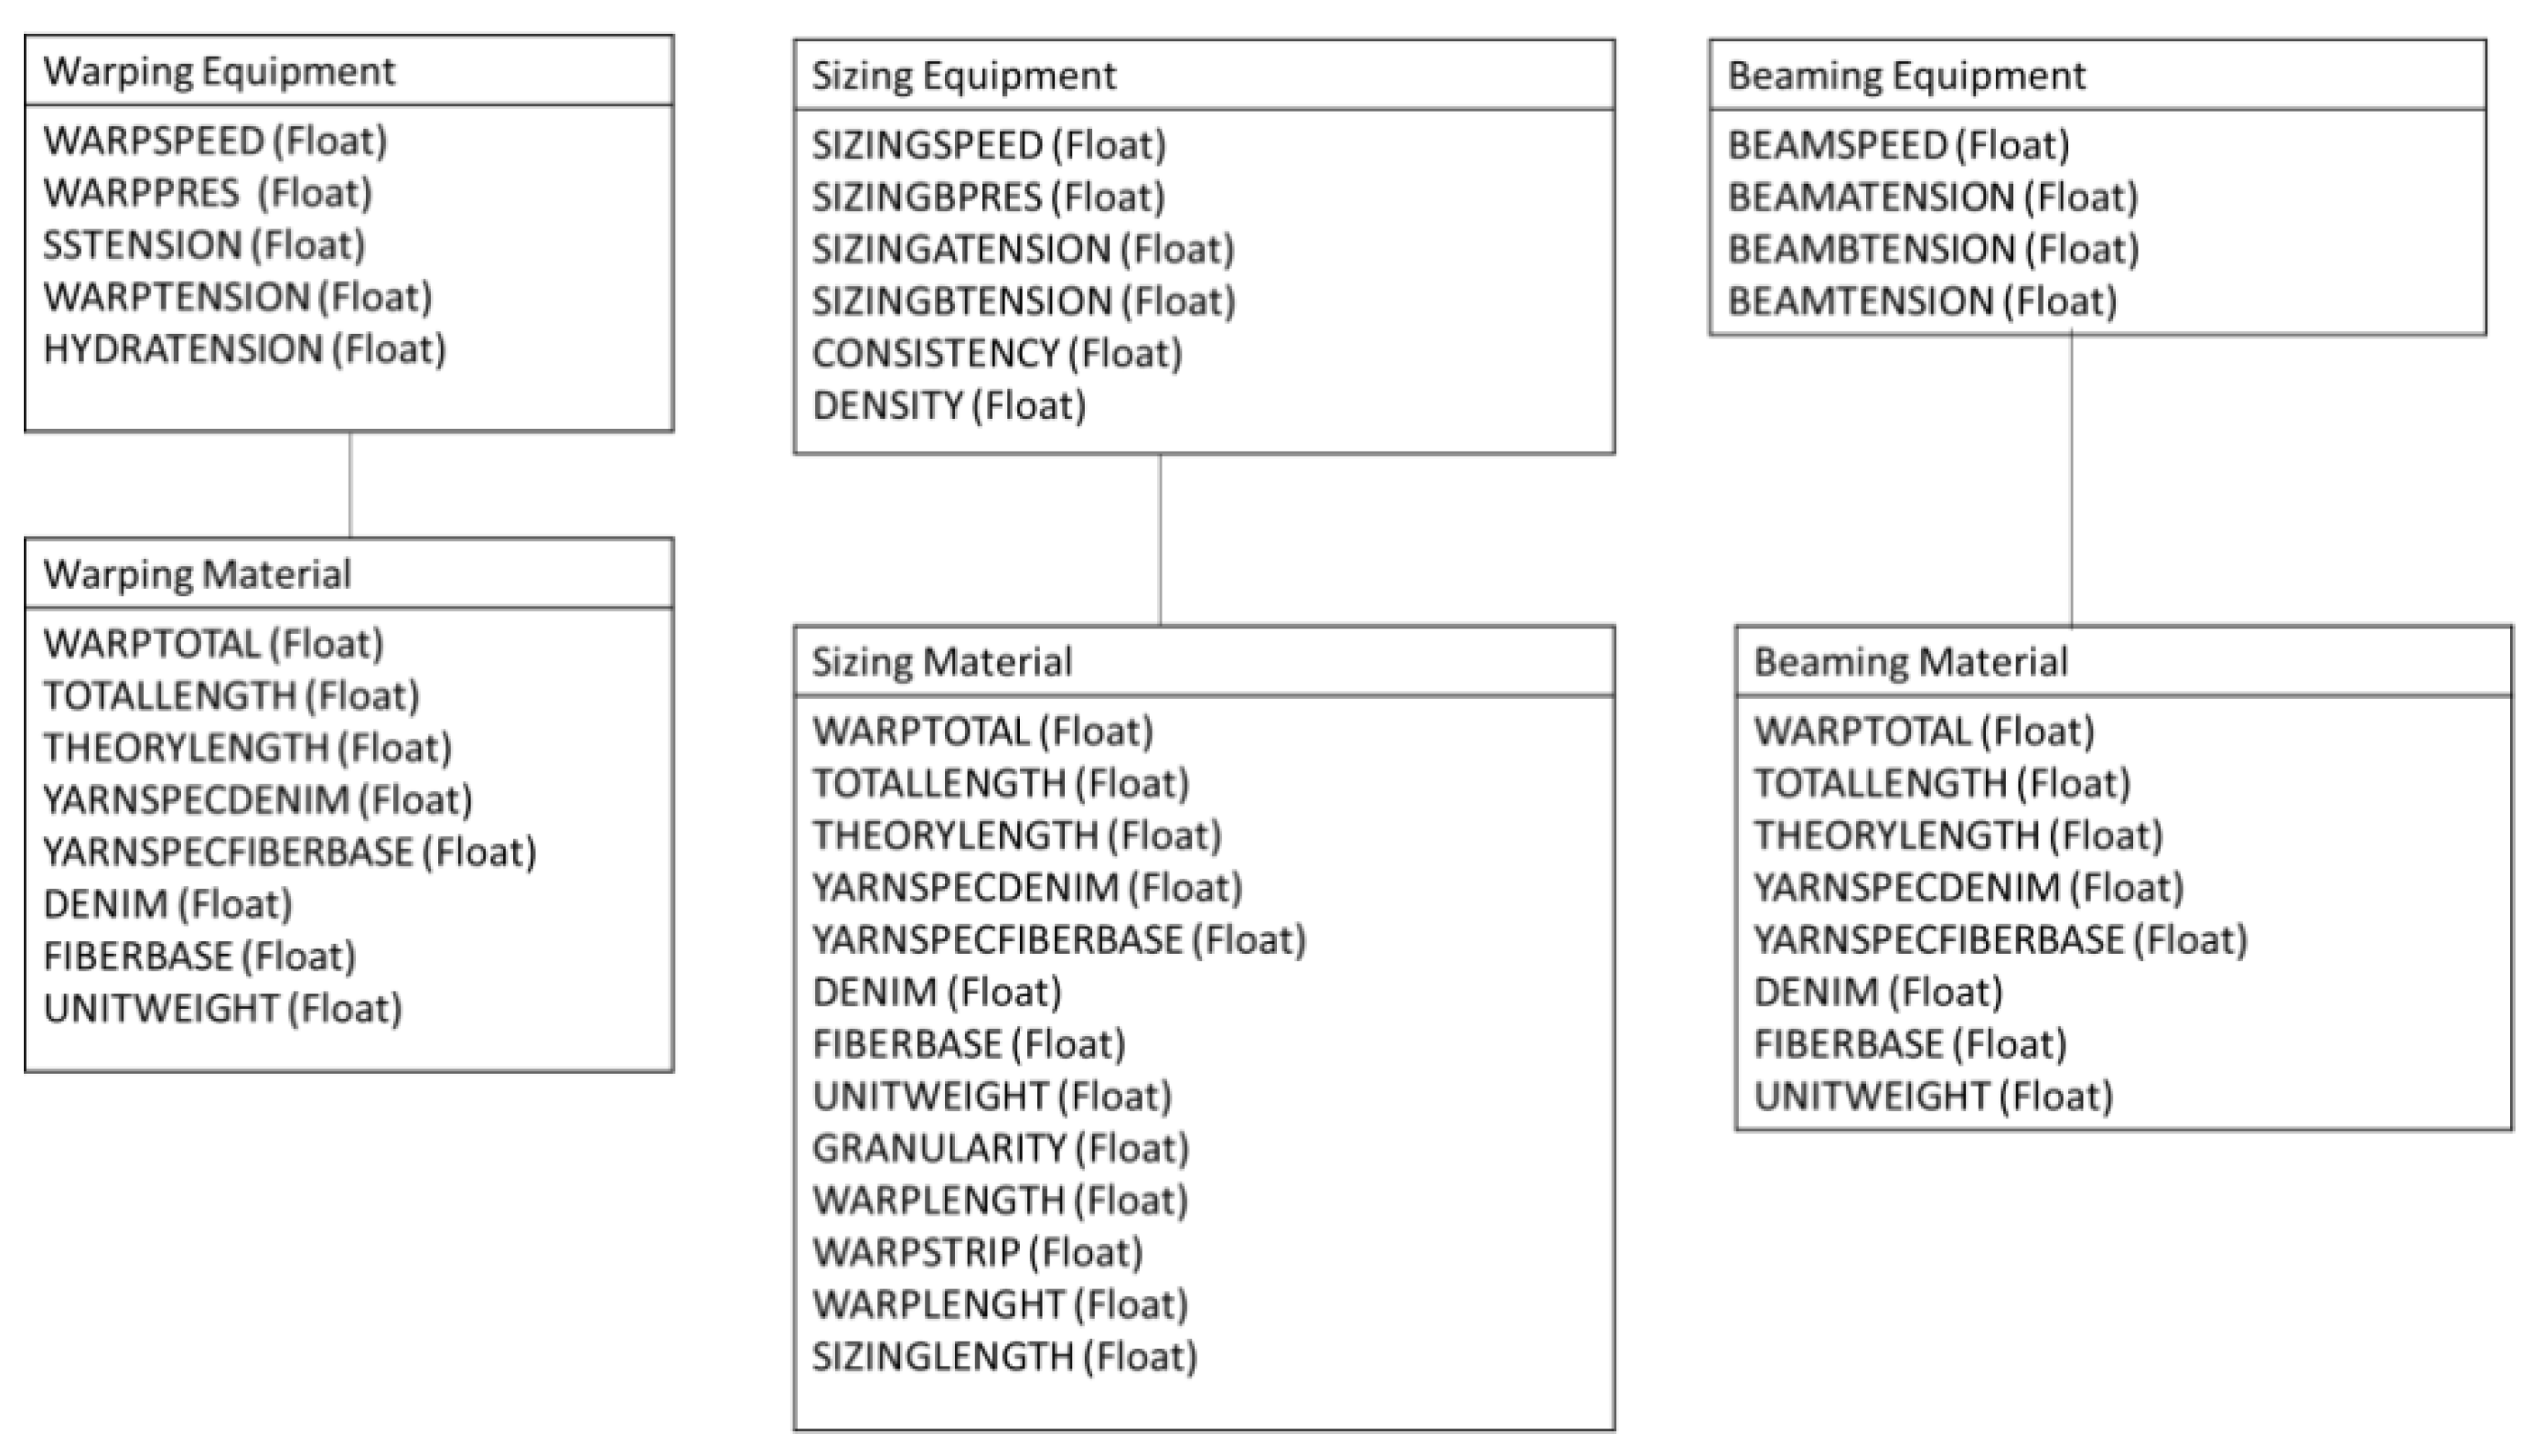
The Enterprise resource planning (ERP) system comprises the production management module. The complex equipment setting parameter integrates into the ERP system with multiple attributes. Material, equipment, finished good data were collected and stored in the manufacturing process data warehouse of the ERP system. For the original data, each column comprised hybrid properties; thus, we are required to parse the original column data and split them into individual properties. Duplicate and incorrect data exist in the original ERP database, which may lead to data entry errors in data analytics. Duplicate or incorrect raw data were removed before data analytics. Figure 6 shows the data model of the equipment data after initial processing, and each manufacturing process has two entity types: equipment and material. There are six conception entities, including warping equipment, warping material, sizing equipment, sizing material, beaming equipment, and beaming material).

3.2. Original Data Preprocessing

Data from textile manufacturing processes are complex because they come from a diverse range of equipment used in multiple manufacturing processes. The original data must be processed, and its attributes are identified using the extract–transform–load (ETL) method. ETL refers to the data preprocessing approach in which original data are corrected and cleaned, and their formats are confirmed. First, we extracted equipment data from an ERP system. These data were transformed in a machine-readable format. Regular expressions (regex) were then used to split the aggregated attributes of equipment data (e.g., “0020/24N Navy Blue“) as individual attributes. For example, the yarn specification attribute is the aggregate of three independent attributes: denier, fiber base, and material. Then, the features of the ML model were selected from disaggregated, preprocessed data.

3.3. Data Training-Regression Analysis

In this study, we demonstrate different regression algorithms used to predict textile equipment settings. Regression-based classification and clustering algorithms are the primary ML approaches for regression analysis, which is the primary predictive method in which ML and statistical approaches are combined to predict continuous outcomes for target variables because of a set of predictor variables. Linear regression is a classical method for predicting target variables. LASSO, Ridge, and Elastic Net are used to improve the performance of linear models. LASSO is used to solve overfitting problems in linear models and eliminate the features. Ridge is used to eliminate unnecessary features in predicting targets. Elastic Net integrates feature coefficient reduction from a Ridge model and feature elimination from Lasso and to improve prediction performance. Each regression algorithm has advantages and disadvantages. This study presents diverse regression algorithms to analyze complex manufacturing data. The applications of regression analysis in PdM include the remaining useful lifetime predictions. Since the target variables are continuous, linear, LASSO, ridge, and elastic net regression can be used to predict equipment settings for textile manufacturing.

3.4. Model Deployment

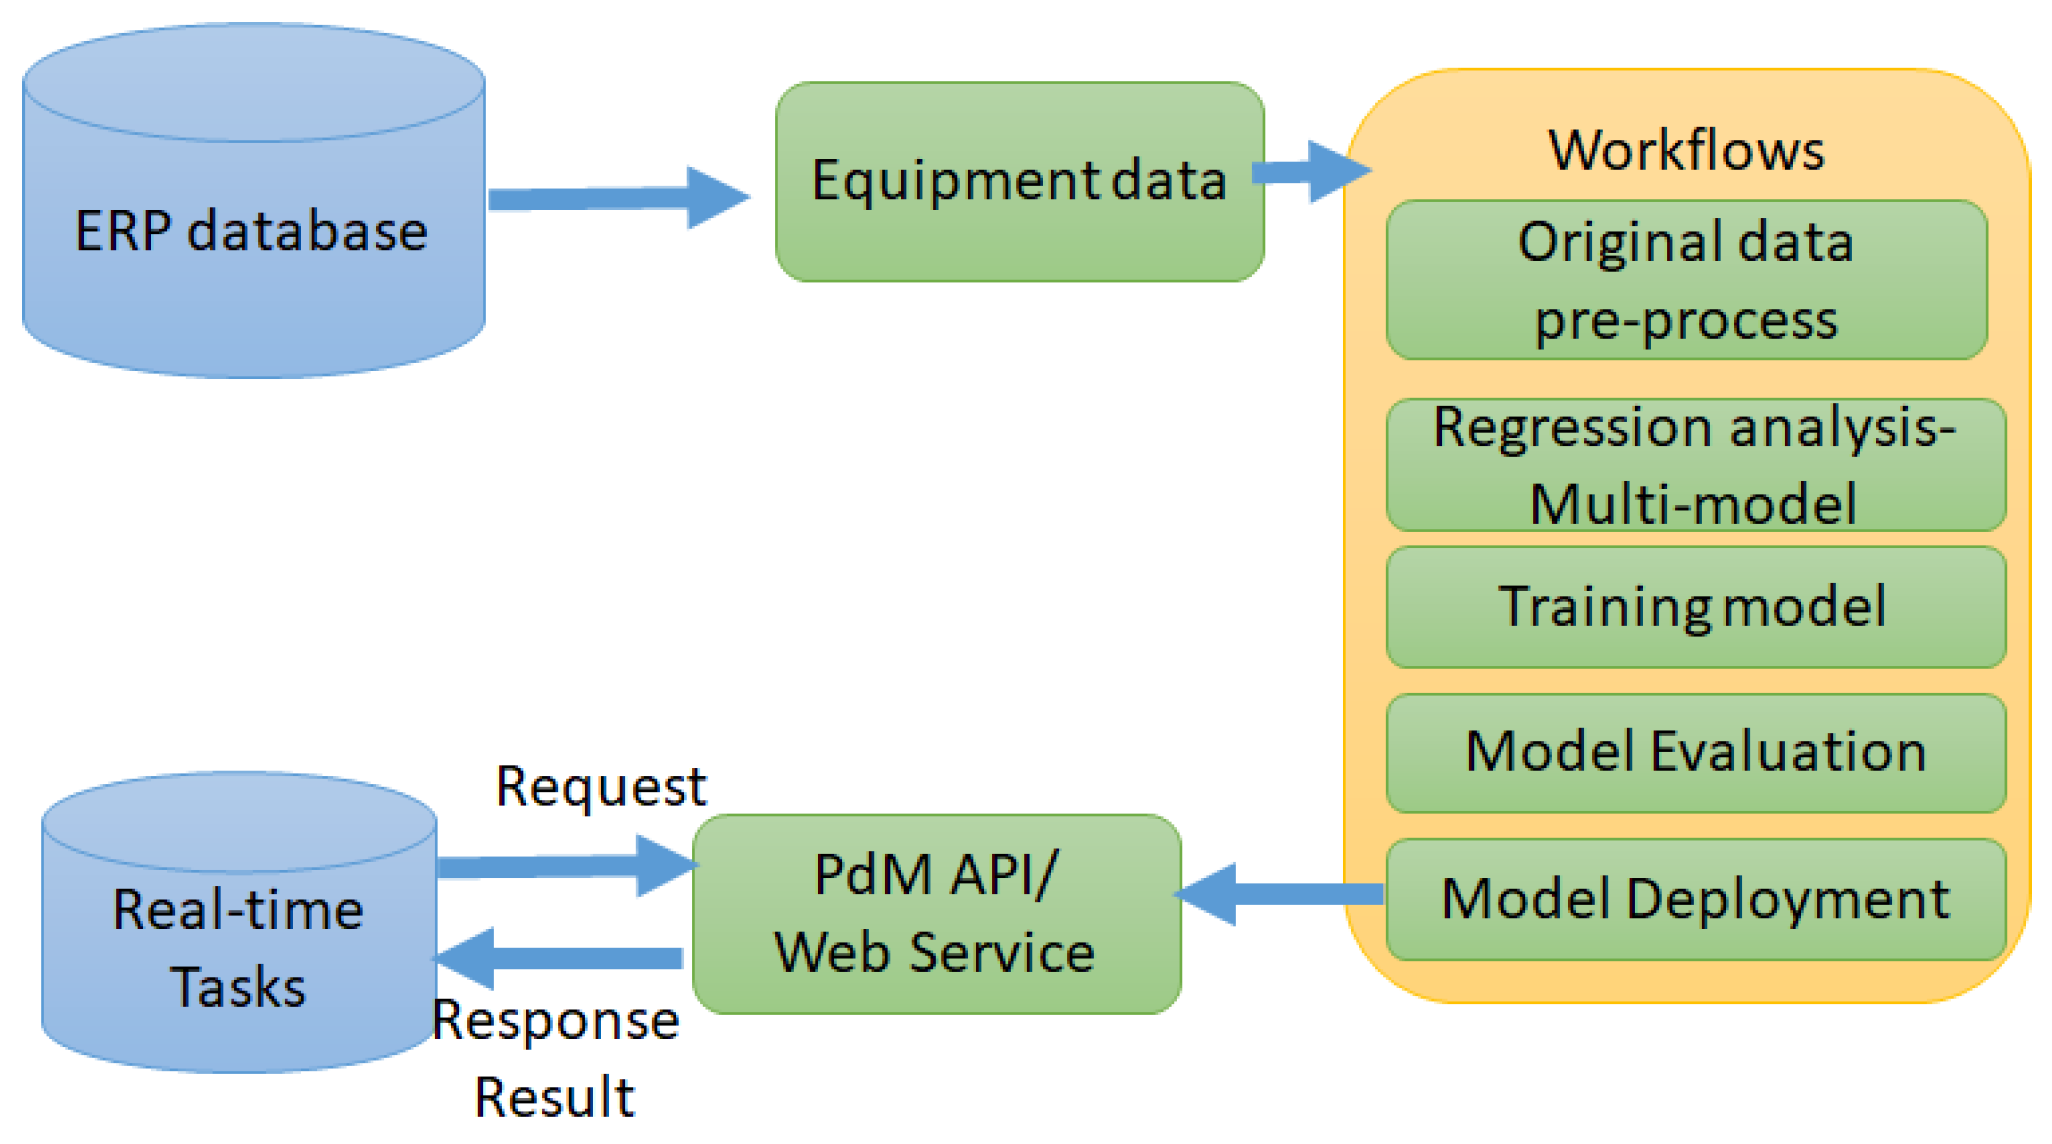
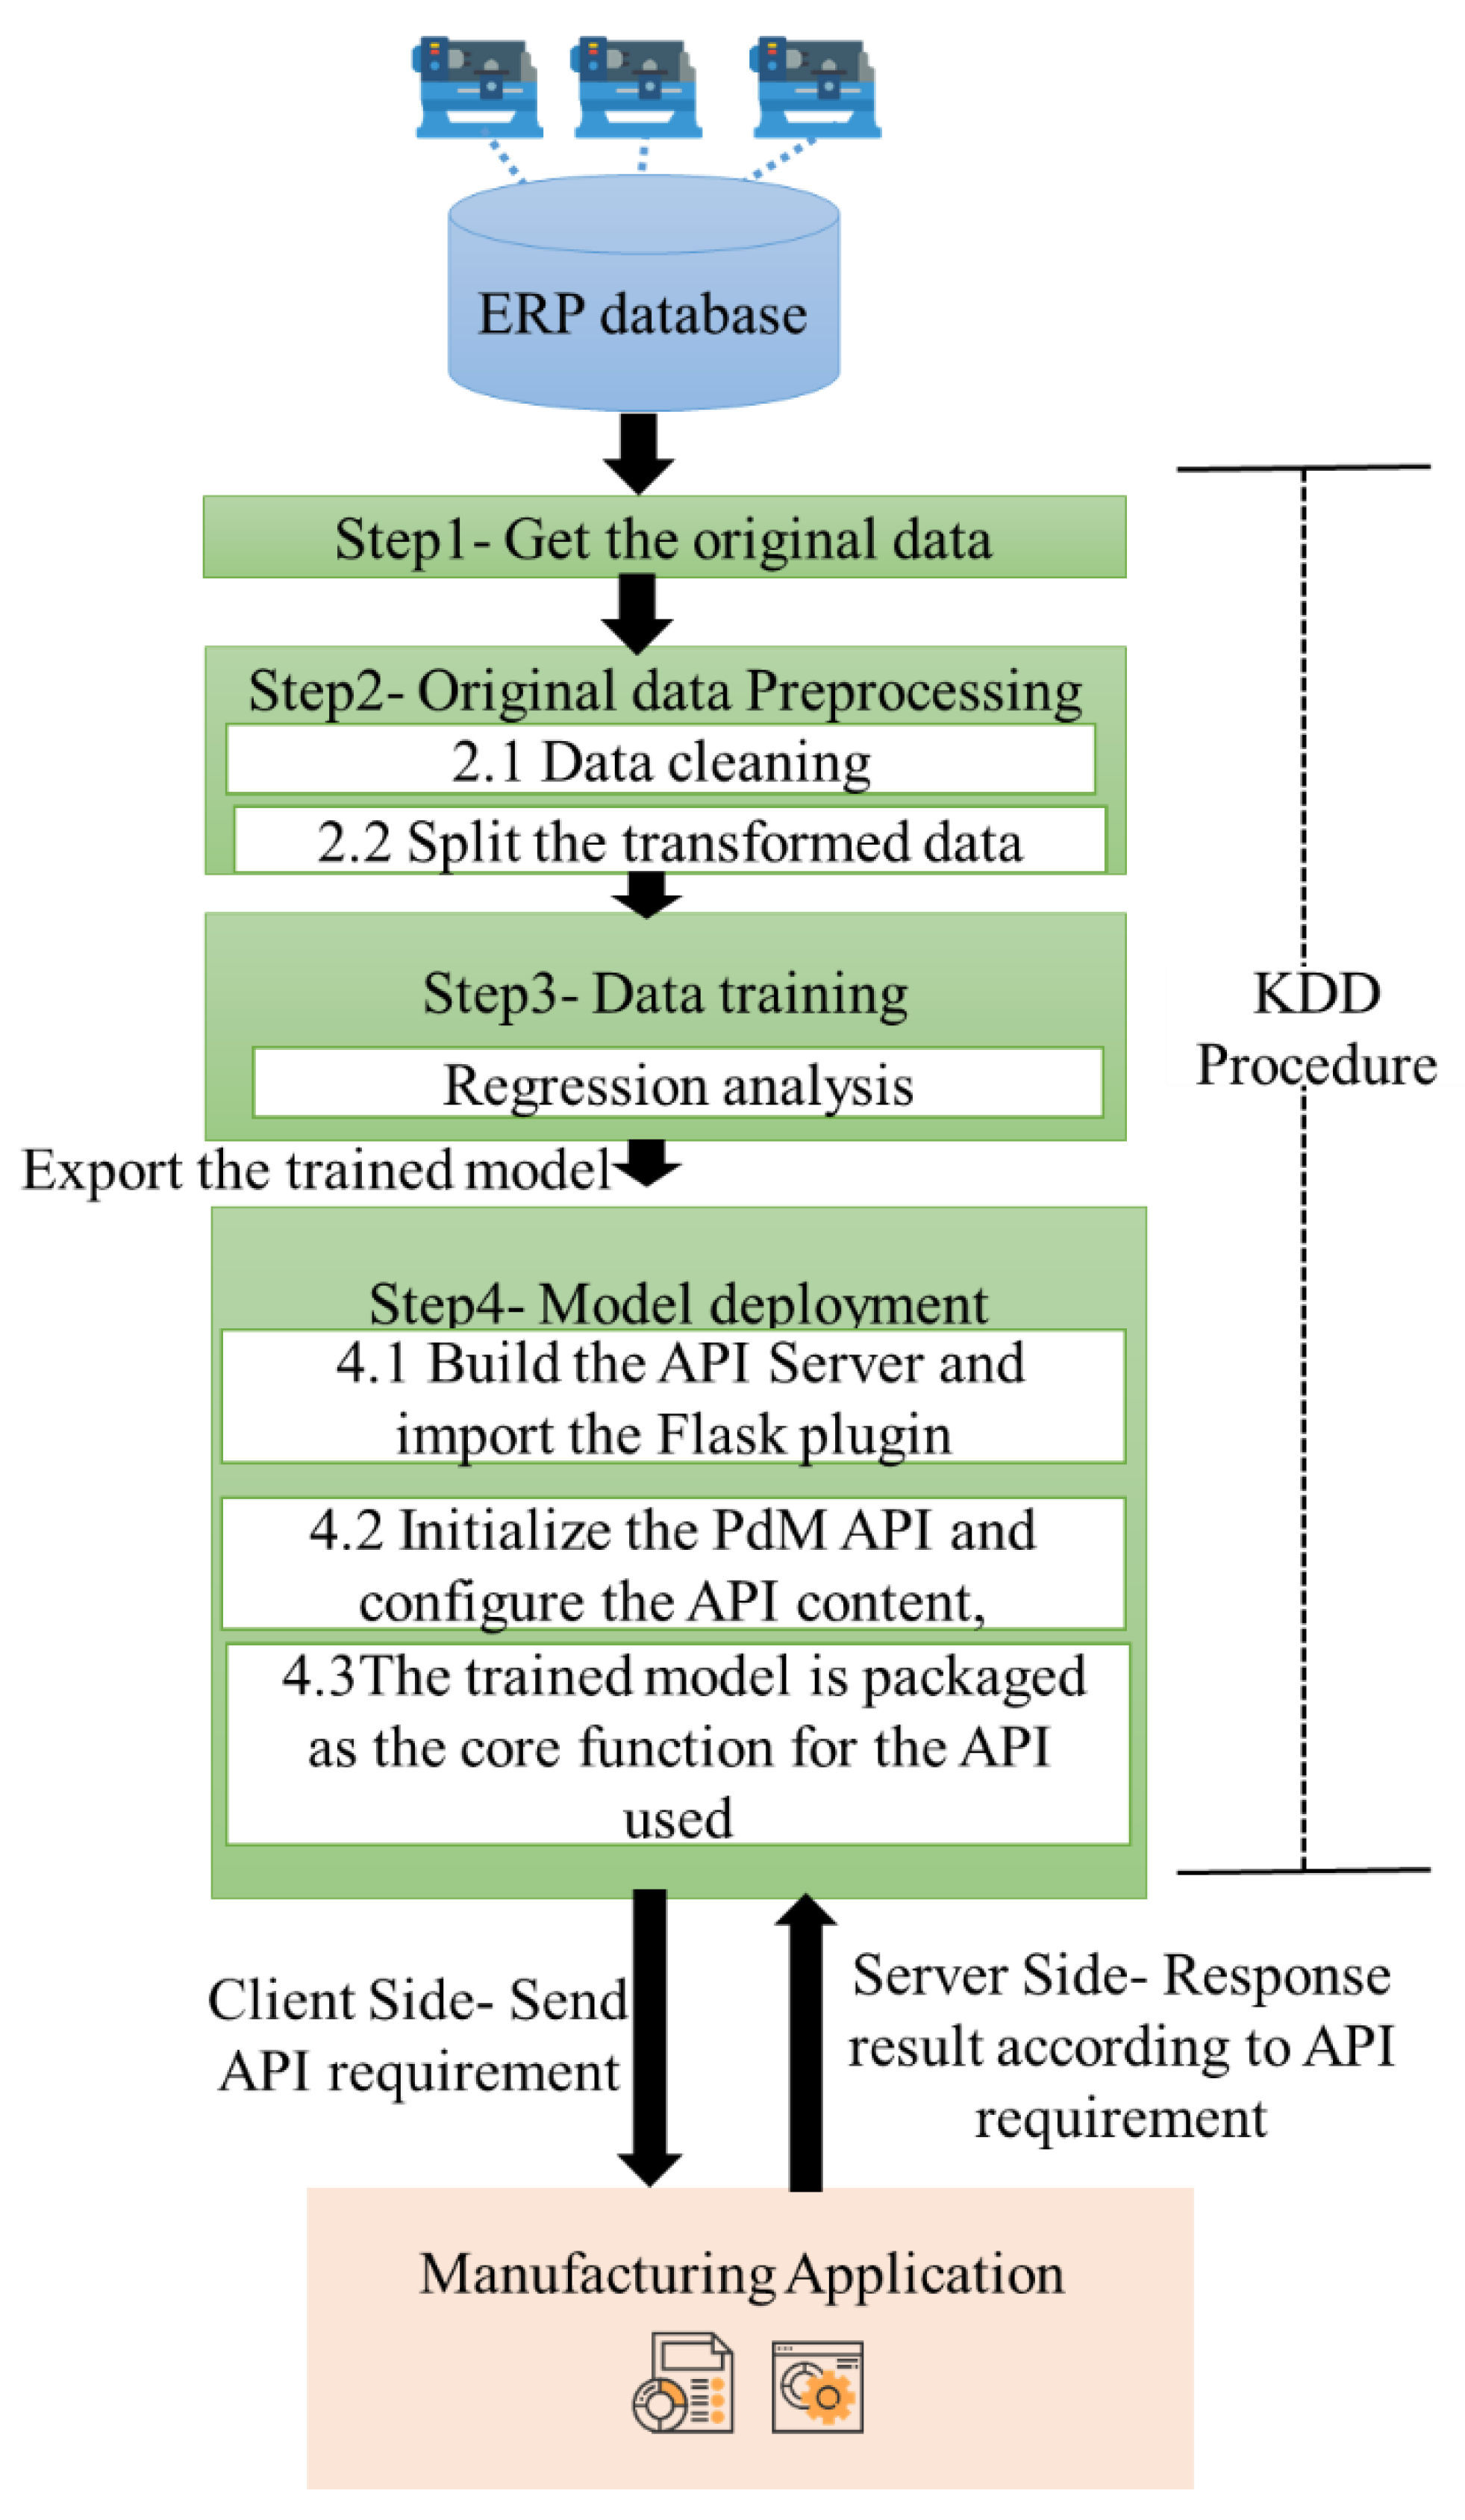
Model deployment is the last step of the KDD procedure. A model can be deployed in different types, such as functions. Most studies have provided trained models as a function for users to further use such as making the maintenance recommendation. Users call functions in the programming language used by the developer; thus, the use of the function relies on a specific programming language (e.g., Python plugin and MATLAB libraries). To improve the use of the trained model developed herein, it was deployed as API, which can be used with different programming languages. API is an interactive interface between multiple software. It is a communication medium between users and developers. Users can use any programming language to access APIs without considering the programming language used by the developer. For example, when a developer uses C# to create an API and deploy it on the server, a user or other applications developed can access the API through Swift or Java. The trained model herein is deployed as a PdM API on the cloud. The history database is imported to the KDD procedure by preprocessing and ML. For the trained model deployed as API, once the equipment data are submitted, the user can use the API in the web form or mobile application for data analysis. The data analysis process is completely automated after sending the analysis requirement to the server-side through API. The submission is detected using the server-side process and automatically mapped to a calculation workflow that specifies task types (e.g., preprocess and ML training modules) as per the message from the API. The server-side sends a response, i.e., the equipment setting information as analysis result, to the client-side. Equipment data can be imported to the cloud to improve textile quality by predicting equipment settings. Herein, the Flask framework used to build the trained model is API with Python language. In the beginning, we build the API Server and import the Flask plugin in our PdM project. Next, we initialize the PdM API and configure the API type, query and response data format, and name. The trained model is packaged as the core function for the API used while it receives the client-side sent requirement. Finally, the API waits for the core function response to the result and sends the response messages to the client side (See Figure 7).
Herein, we used Python to create the proposed PdM APIs based on the representational state transfer (REST) pattern for the web. RESTful APIs use commands to obtain resources. The state of a resource at any given timestamp is called a resource representation. RESTful APIs have different execution types: “GET”, “PUT”, “POST”, or “DELETE”. The function “GET” retrieves information, “PUT” passes information, changes the state of or updates information, “POST” passes and creates resources, and “DELETE” deletes information. The proposed APIs can be managed using the Swagger platform. The PdM APIs allow users to directly access trained models through Hypertext Transfer Protocol (HTTP) and provide an efficient approach for users to programmatically query the analytic results rather than rely on browser-based interfaces. For a common API design, the user can send a request for API with HTTP media-type and respond to the information. Herein, we consistently use the JSON format as the API response format. It can be extensively employed in web or mobile applications.

4. Experiments

A large textile manufacturing enterprise was selected as a representative use case. Data from equipment used for weaving preparation (warping, sizing, and beaming) were used as a training dataset for predicting product quality.

4.1. Use Case

A case study was conducted to investigate the requirements of a practical textile factory. Hence, we selected a leading textile manufacturing company as a case study (referred to herein as “the use case”). The use case is the largest nylon manufacturer in Asia. They own integrated manufacturing technologies and advanced production facilities and produce nylon-based products, filament yarns, and fabric products. They use advanced manufacturing techniques and have a production capacity of up to 1600 tons per day per plant. The use case is dedicated to quality management, environmental protection, hygiene, and safety management. They hold quality certifications, including ISO 9001, ISO 14001, and the Global Recycling Standard. Table 2 and Table 3 show the equipment scale and production capacity of the use case, respectively.

4.2. Dataset Description

Our results show the application of ML to textile manufacturing. The dataset was obtained from an ERP equipment database at the factories used as a case study. Table 4 and Table 5 list the dataset and prediction targets, respectively. In particular, we examined the prediction of yarn quality in the textile manufacturing process (i.e., warping, sizing, and beaming). The training model was developed as a PdM API for the enterprise optimization of equipment settings. The manufacturing dataset was the input, and the primary equipment setting parameters were the predictive outcomes. Linear, lasso, ridge, and elastic net regression were used to predict equipment settings from the input dataset. Manufacturing data were separately analyzed at the warping, sizing, and beaming stages.

4.3. Evaluation Criteria

We used mean-squared error (MSE) and mean absolute error (MAE) to evaluate prediction errors.
  • Mean-squared error
MSE is used to estimate errors by calculating the difference between the predicted and actual values. Equation (5) shows the formula for MSE. The value is the average squared error between the expected and actual values. MSE is considered a risk function, concerned with the predicted squared error loss. It is extensively used as an estimator to predict performance. It is the sum of squared distances between the target and predicted values. It is a common metric for loss functions in regression analytics. Herein, MSE is used as the loss function for estimating the prediction performance.
MSE = 1 m i = 1 m ( y i y ^ i ) 2 ,
where a vector of m predictions is generated from a sample of k data points on all variables, and y is the vector of observed values of the predicted variable, and y′ is the predicted value.
2.
Mean absolute error
MAE is a measure of the absolute errors between predicted and actual values, where each error has equal weight. MAE estimates the average magnitude of the differences in a set of predictive values. Equation (6) shows the formula for MAE, where the value is the average of the absolute difference between the predicted and actual values. Commonly, MAE is used to assess the accuracy of continuous variable predictions. Herein, MAE is employed to estimate prediction performance.
MAE = 1 n i = 1 n | y i y ^ i | ,
where a set of k predictions is generated from a sample of k data points on all variables, y and y′ are the observed and predicted values, respectively.
3.
K-fold cross-validation
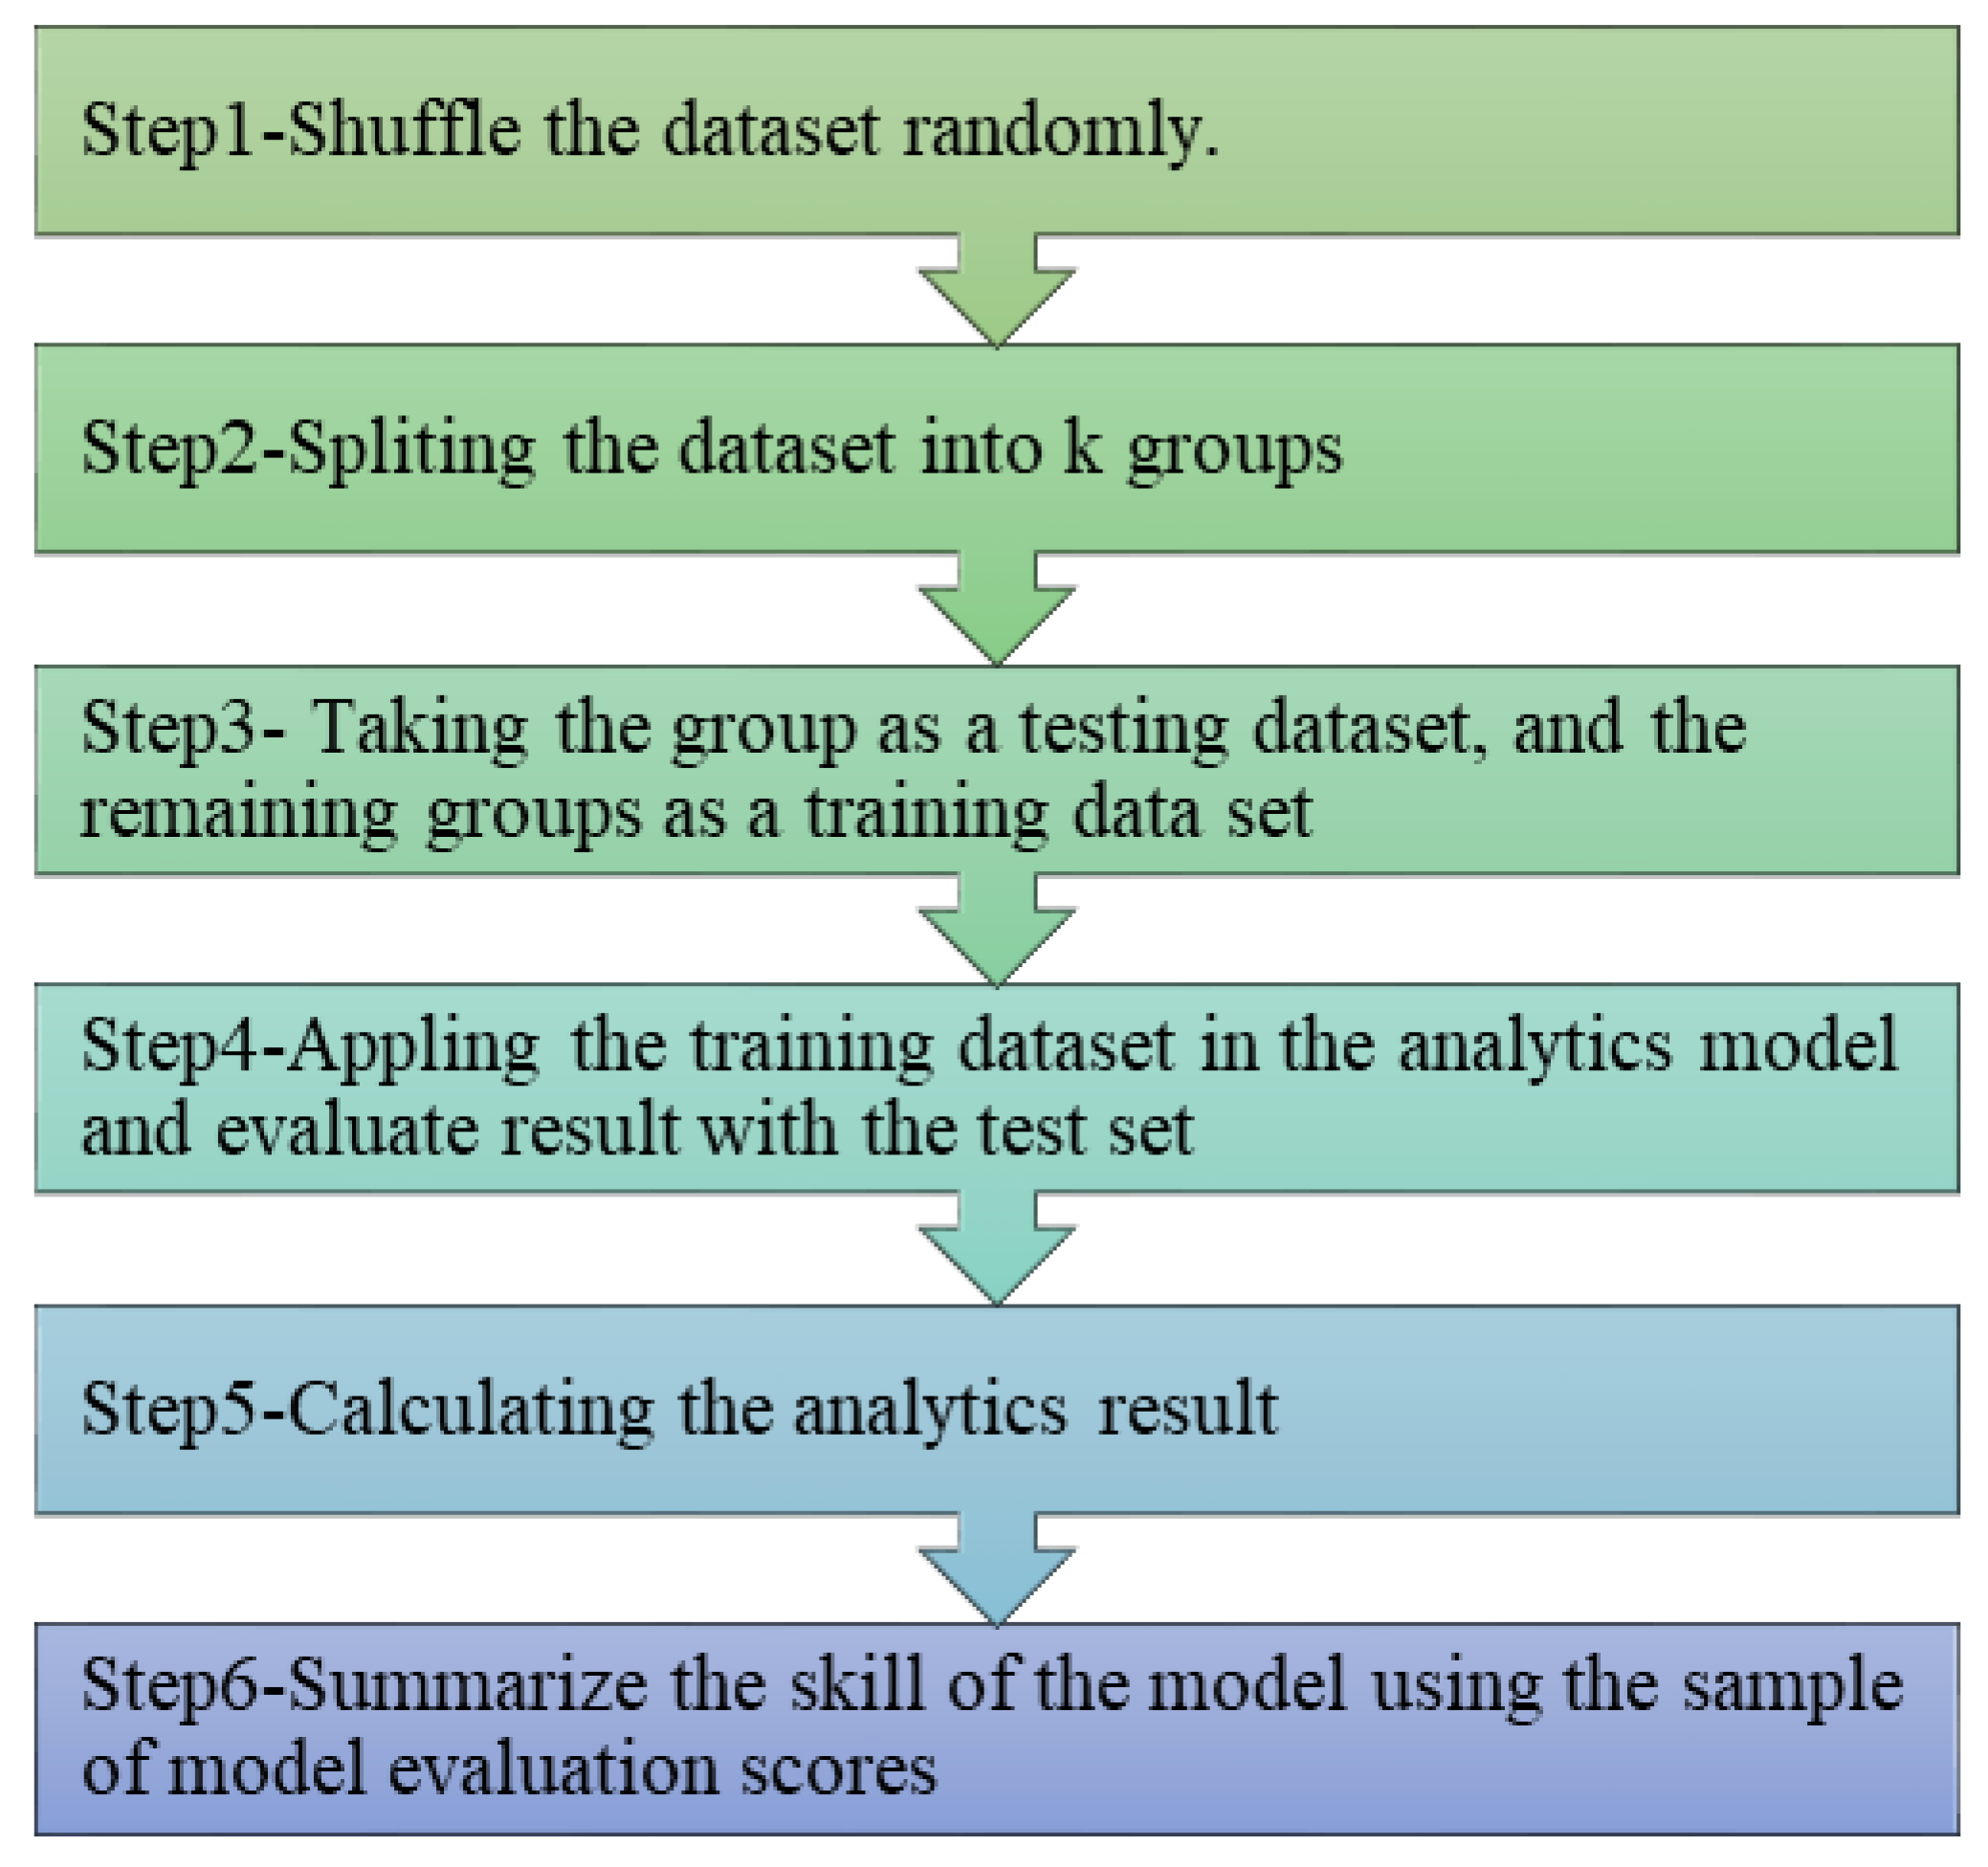
Cross validation is a statistical approach commonly used to estimate the performance of ML models. It is extensively used to compare and select a model for a given predictive task by recursively resampling the dataset. In this study, we used the K-fold cross-validation to evaluate the trained model because it reduces the possibility of bias from the data split. The K-fold cross-validation recursively split an original set into several subgroups and computes an average value across all partitions. Figure 8 shows the procedure for the K-fold cross-validation.
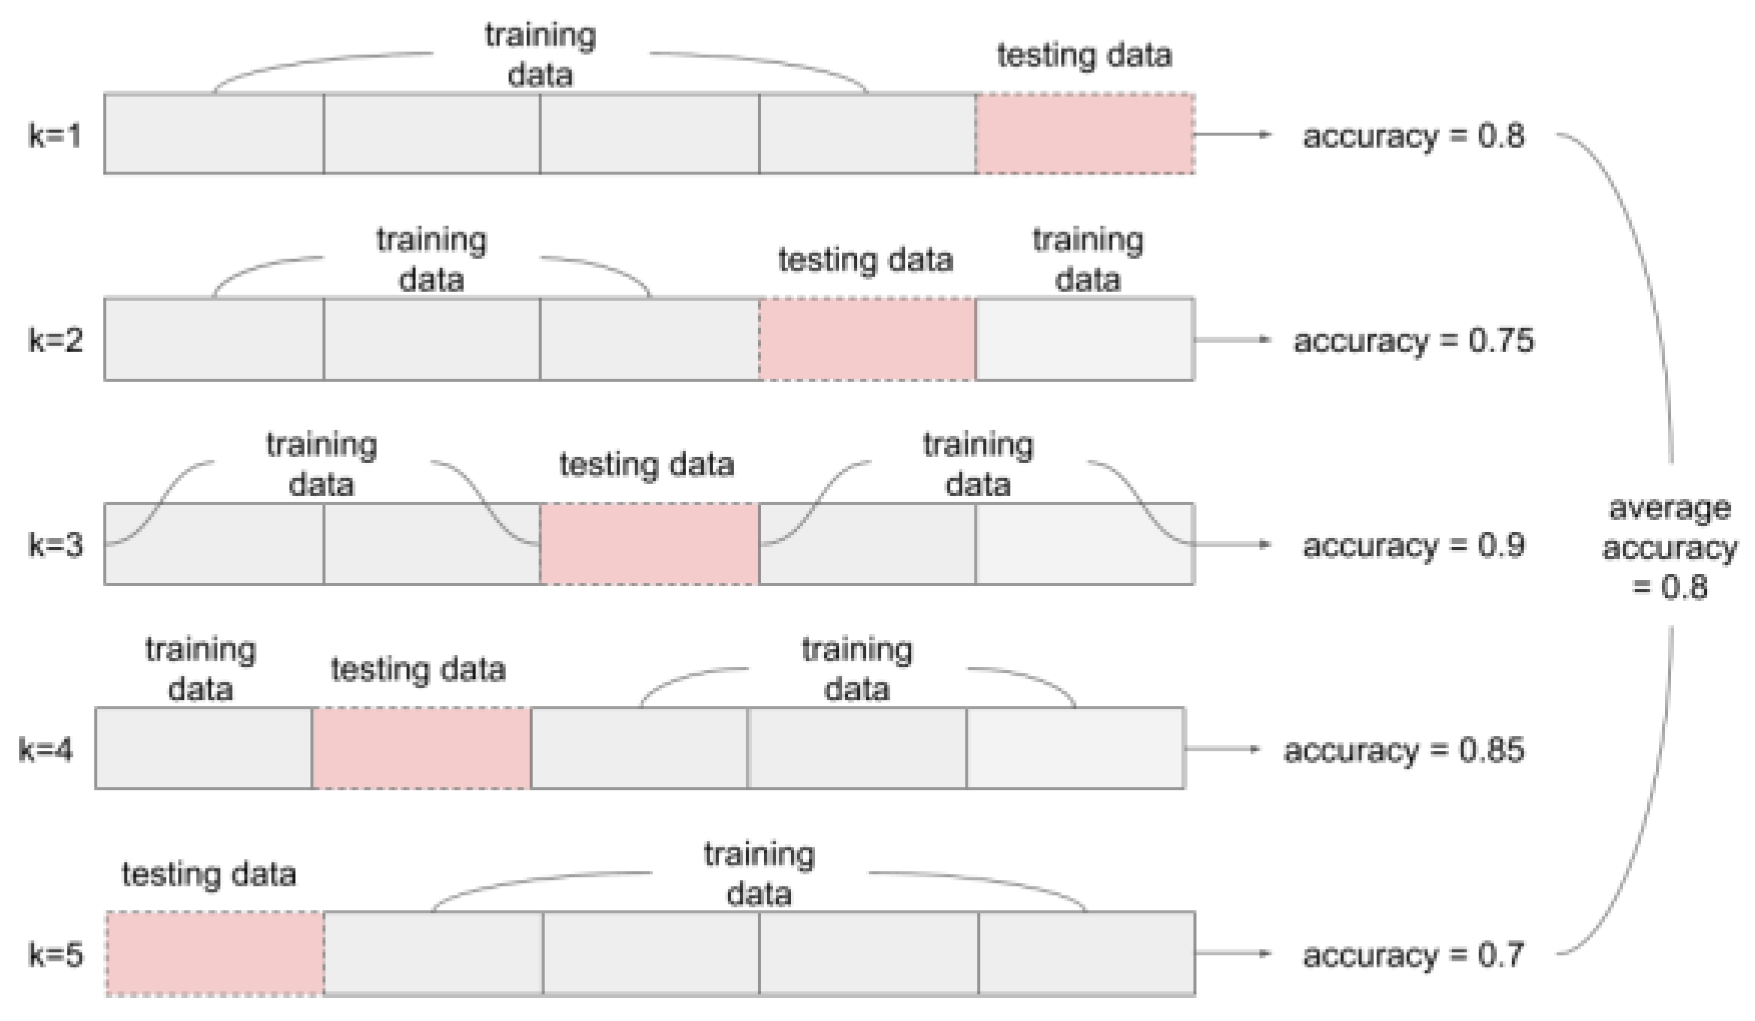
Herein, we used 10-fold cross-validation (K = 10). At every epoch, data are divided into 10 subsets. Nine of the total subsets are used as the training dataset, and the remaining subset is used as the test dataset. The training dataset is applied to the ML model, and the test dataset is used to confirm the model performance using the selected evaluation metrics. We used MSE to estimate the model performance of each epoch. A smaller MSE value indicates less error between actual and predicted values, indicating improved predictive performance. The average analysis result for each epoch can be used to represent the ML model’s performance.

5. Results

Herein, ML was employed in textile manufacturing. The results indicate how ML analytics can be used to assist managers and machine operators for selecting equipment parameters to improve product quality. A trained model was deployed as a RESTful API in a cloud system for real-time analytics, and the results of the analysis could be displayed on the cloud dashboard for PdM. The data analysis procedure involves data importing, preprocessing, and selection, followed by model training, evaluation, and deployment.

5.1. Data Preprocessing and Feature Selection

We used data transformation techniques to process the original dataset. The contents of raw data from the specified format must be parsed as the readable attribute. All columns of the original dataset are processed. For example, if the content of an aggregated yarn-related attribute is “0020/24N Navy Blue”, it can be split into separate variables such as denier (value = 20), fiber base (value = 24), material (value = Nylon), and color (value = Navy Blue). The expert label the preprocessed data as the features of PdM. Table 6 lists the preprocessed attributes included in the training dataset. Features are classified into two categories: the common use and sizing only (GRANULARITY, WARPLENGTH, WARPSTRIP, WARPLENGHT, and SIZINGLENGTH).

5.2. Machine-Learning Modeling and Evaluation

Linear, LASSO, ridge, and elastic net regression algorithms are used with the preprocessed data to predict equipment settings at the warping, sizing, and beaming stages. Figure 9 shows the procedure of the K-fold cross-validation. Herein, 10-fold cross-validation is used to evaluate the model.

5.2.1. Warping Process Prediction

In the warping stage, the equipment manufacturing parameters include WARPSPEED, WARPPRES, SSTENSION, WARPTENSION, and HYDRATENSION. Warping equipment includes important components, such as the warper beam, headstock, and creel. Controlling the warping equipment tension and speed is important for textile quality. Relevant manufacturing parameters include warping speed and tension, warper beam tension, monofilament tension, and hydraulic warping tension. Table 7, Table 8, Table 9 and Table 10 list the evaluations of equipment manufacturing predictions for the warping process. The results show that linear regression has the lowest prediction error for the warping process; its average MSE and MAE are 0.05 and 0.13, respectively.

5.2.2. Sizing Process Prediction

Sizing equipment has a drying component, headstock, and creel. Parameters, including the density and type of polymeric material used, sizing pressure, and rolling tension, can affect fabric quality at this stage in the production process. The equipment parameters used herein include SIZINGSPEED, SIZINGBPRES, DENSITY, CONSISTENCY, SIZINGATENSION, and SIZINGBTENSION, thus relating to the control of sizing speed, sizing pressure, sizing tension (roll-out), sizing tension (winding), the density of film-forming polymeric material, and density of sizing, respectively. Table 11, Table 12, Table 13 and Table 14 list the evaluations of the equipment setting predictions for the sizing process. Linear regression demonstrated the lowest prediction error for the sizing process with average MSE and MAE of 0.05 and 0.13, respectively.

5.2.3. Beaming Process Prediction

The beaming process involves winding the full width of the warp yarns in a single winding operation onto the warper beam. Yarns can be wound from the creel or warper beam to form a single beam. Beaming is a cohesion process in textile manufacturing, which includes winding and rolling. Equipment parameters for the beaming stage include BEAMSPEED, BEAMATENSION, BEAMBTENSION, and BEAMTENSION, relating to beaming speed and tension, roll-out tension, and winding tension, respectively. Table 15, Table 16, Table 17 and Table 18 list the evaluations of the equipment manufacturing predictions for the beaming process. Linear regression demonstrated the lowest prediction error for the beaming process, with average MSE and MAE of 0.05 and 0.13, respectively.

5.3. Trained Model Deployment

The trained model in this study can be deployed as a RESTful API on a cloud platform, and equipment data can be uploaded from the edge to the cloud. The trained API analyzes the imported data and displays the results (Figure 10). The API can be used to import data from the edge into the trained model where a manager can use it to predict equipment settings and make quality management decisions in the cloud. This combination of data connectivity, real-time analytics, and data visualization offers users access to real-time analytics anytime anywhere. The trained model can be used not only in the proposed cloud implementation but also in third-party IoT systems.

6. Discussion

Herein, we demonstrate the application of ML algorithms in textile quality PdM by optimizing equipment settings in the warping, beaming, and sizing processes. API can be deployed in the cloud for further use and has extensive application in the current cloud system, current ERP, and third-party platforms. IIoT World, a global consulting company, has reported on the importance of IIoT and data integration [40]. Both McKinsey and IDC highlighted the challenges of data interoperability and integration [41]. This study implements data analytics and cloud-based integration with improved predictive performance. However, there is a requirement for advanced technologies in competitive textile industries to address problems in the production line. Machine vision and edge computing can increase the efficiency of textile manufacturing processes, tackling challenges, such as visible/invisible defect detection in textile products, to save costs and improve operating time.

6.1. Potential of Machine Vision

This study optimizes equipment settings for weaving preparation processes, including warping, beaming, and sizing, where product quality relies on the equipment settings. However, other textile manufacturing processes, such as weaving, heavily rely on product specifications, including the warp and weft structure, proportions of raw materials, and product strength. Visible or invisible anomalies can occur in textile products because of the manufacturing process (e.g., dyeing, weaving, knitting) or raw materials. Such product defects can incur additional manufacturing costs. In certain stages of the textile manufacturing process, textile quality depends on operator examination, which is tedious. Machine vision can provide imaging-based hardware and software analysis to capture, process, and analyze images; moreover, it has been used for quality control in textile manufacturing processes [42,43]. Machine vision tools that can automatically determine product quality based on the image of the fabric’s construction can reduce human error and operating time.

6.2. Use of Edge Computing

An ML model was deployed in the cloud as an API; data can be uploaded and analyzed using a cloud-based computing analytics service. Many IIoT applications employ a cloud data center as a central server for processing data. For textile manufacturing, cloud computing is not suitable for all practical manufacturing problems; edge computing may be more suitable in certain situations. Edge computing is predicated on moving certain computational loads toward the edge of the network to harness computational capabilities currently untapped in edge nodes such as base stations, routers, and switches [44]. Edge computing can assist equipment in making autonomous setting decisions based on anomaly detection and assessments of product quality. In certain manufacturing processes, where anomaly detection currently relies on the inspection of the product by an operator, machine vision can be implemented by edge computing to provide rapid responses for production line problems. In 5G communication technology, vision is the primary application for edge computing. Certain researchers have reported that edge computing can be used for continuous manufacturing processes such as weaving in fiber production and textile manufacturing [44,45].

7. Conclusions

IoT is transforming multiple fields, including the textile manufacturing industry. IIoT is concerned with industrial frameworks in which several devices or pieces of equipment are connected and synchronized using gateway software in human-to-machine and machine-to-machine communications. Recently, IIoT applications in PdM have attracted considerable attention from enterprises [46]. In this study, we surveyed PdM-related literature, examining results from 3697 publications associated with PdM and related studies. We used descriptive statistics, PoP, to analyze studies from 2010 to 2019 in Google Scholar. The PdM-related concept has rapidly developed across diverse manufacturing applications, including quality management, scheduling, facility management, and capacity optimization. PdM-related studies are highly cited. Most studies focused on building ML models to address PdM challenges, whereas only a few studies have examined the deployment and validation. The primary IoT consulting company has reported manufacturing operation and production asset management in IoT applications to be cloud deployment of IoT software and vertical IIoT platforms [11]. For practical and research applications, sustainable use of a trained model is important for data analytics in a range of industries. We demonstrated a complete data analytics process based on the standard KDD procedure for a practical textile manufacturing use case. We built an ML model and deployed the trained model as a PdM API on a cloud platform. The PdM API can be integrated with third-party platforms and used for ML analysis workflows. Quality management is important in the textile industry. Substandard textile products are discarded, requiring the entire manufacturing process to be repeated to achieve certified quality management. In this study, data analytics was employed to achieve PdM associated with quality management. The production line could produce high-quality products by optimizing equipment settings in warping, beaming, and sizing processes. The equipment data were preprocessed, and the features of the preprocessed data were selected by professionals using strong domain knowledge. ML algorithms were applied to the equipment data to predict equipment settings required to optimize product quality. The results demonstrate that linear regression had significantly less error than other regression approaches. The trained model could enable optimized equipment management to improve quality management. Many consulting institutions emphasized the importance of PdM. Herein, we conducted a case study for textile manufacturing to demonstrate data analytics and developed a PdM API that provides users cloud-based alternatives to on-premise infrastructure such that enterprises can avoid poor quality and high return and defect rates.

7.1. Study Limitation

Domain knowledge and experience are important for complex manufacturing processes. Usually, equipment setting is the responsibility of senior operators and managers who are familiar with raw materials, product quality evaluation, equipment settings, and anomaly detection. The explainable ability of data is determined by the professionals’ knowledge and experience. This study is limited by the size of data samples and the nature of the industry. Larger equipment data will be used for data analytics in future studies.

7.2. Future Work

Intelligent manufacturing is a production line trend for the manufacturing industry [46,47,48]. Manufactured textiles and related products, such as face masks and clothes, are commonly used. The quality of raw materials and WIP affect the quality of finished goods. Adequate integration of ML and ICT is a prerequisite to meet the rapid increase in the complexity of textile manufacturing processes. The textile industry is labor-intensive. The industry has been severely affected by the COVID-19 pandemic because of the increased demand for face masks. Recently, the global spread of COVID-19 has impacted the textile industry supply chain. Textile manufacturing is important in face mask production. In this study, we developed a real-time data analysis model to predict equipment settings in textile manufacturing. The automation of equipment settings can increase the production efficiency and product quality for the stable supply of textile products to face mask producers. Face mask producers can timely control the supply of textile products. Advanced automation and intelligent analysis technologies can improve manufacturing efficiency, reducing the impact of sudden events (e.g., disease and natural disaster). The fuzzy assessment approach is employed to ensure sustainable manufacturing in factories [47]. The literature shows that ICT technologies provide contactless operations to maintain sustainable manufacturing without interruptions. Compared with traditional human operations, ICT technologies provide less human operations, which reduces the risk of immense contact restrictions during the COVID-19 pandemic [48]. In this study, we deployed a trained model as PdM API, a convenient interface to programmatically query and interact with equipment databases based on REST patterns for the web. A RESTful API provides a transaction to create several small modules. Each module addresses an underlying part of the transaction. This modularity makes the function utilization is quite flexible. Amazon S3, Microsoft Azure, OpenStack Swift, and other primary service providers support the models for developers. Most APIs, including Azure REST and Facebook APIs, follow the REST pattern design. Based on RESTful designs, the proposed PdM APIs can extensively deploy HTTP infrastructure and related standards. The design provides an efficient flexible interface for users and developers who are not familiar with the programming language or server side programming language. Note that studies will address additional textile manufacturing cases and develop API and web services for additional efficient manufacturing management to manage complex textile manufacturing processes in future. We shall implement intelligent control using dynamically virtualized and scalable resources provided as a service over the Internet.
To summarize, the various items of equipment or raw materials influence equipment settings in textile manufacturing processes. Herein, we employed mathematical and statistical methods to address production challenges in textile manufacturing. Few studies investigated PdM for the quality management of textile products. Recently, other tools have been used to predict yarn quality and seam quality. This study demonstrates a PdM model using ML methods to optimize equipment settings in textile manufacturing processes.

Author Contributions

Conceptualization, R.-I.C. and Y.-H.H.; Data curation, C.-Y.L.; Formal analysis, C.-Y.L.; Funding acquisition, R.-I.C. and Y.-H.H.; Investigation, R.-I.C., C.-Y.L. and Y.-H.H.; Methodology, C.-Y.L.; Software, R.-I.C. and C.-Y.L.; Supervision, R.-I.C. and Y.-H.H.; Validation, Y.-H.H.; Writing—original draft, R.-I.C. and Y.-H.H.; Writing—review & editing, Y.-H.H. All authors have read and agreed to the published version of the manuscript.

Funding

This work was funded by Taiwan Ministry of Science and Technology (MOST), under Grant no. MOST 110-2410-H-002-094-MY2, MOST 110-2221-E-224-047, MOST 109-2221-E-224-038, and MOST 108-2635-E-224-001.

Conflicts of Interest

The authors declare no conflict of interest.

References

  1. Centerity, “IoT & IIoT Making Data-Driven Business Decisions. Available online: http://www.centerity.com/wp-content/uploads/2016/11/IoT-WhitePaper.pdf (accessed on 1 January 2019).
  2. Advantech Inc. IoT Applications and Upgrades in Textile Plant. Available online: https://www.iotone.com/casestudy/iot-applications-and-upgrades-in-textile-plant/c749 (accessed on 10 October 2019).
  3. Gandhi, K. (Ed.) Woven Textiles: Principles, Technologies and Applications, 2nd ed.; Woodhead Publishing: Sawston, UK, 2019. [Google Scholar]
  4. Adanur, S. Handbook of Weaving, 1st ed.; CRC Press: Boca Raton, FL, USA, 2020. [Google Scholar]
  5. Dorgham, M.E. Warping parameters influence on warp yarns properties: Part 1: Warping speed and warp yarn tension. J. Text. Sci. Eng. 2013, 3, 1–6. [Google Scholar] [CrossRef] [Green Version]
  6. Gloy, Y.S.; Renkens, W.; Herty, M.; Gries, T. Simulation and optimisation of warp tension in the weaving process. J. Text. Sci. Eng. 2015, 5, 179. [Google Scholar] [CrossRef] [Green Version]
  7. Karnoub, A.; Kadi, N.; Azari, Z.; Bakeer, E.S. Find the suitable warp tension to get the best resistance for jacquard fabric. J. Text. Sci. Eng. 2015, 5, 222. [Google Scholar] [CrossRef] [Green Version]
  8. Perez, J.B.; Arrieta, A.G.; Encinas, A.H.; Queiruga-Dios, A. Industrial cyber-physical systems in textile engineering. In Proceedings of the International Joint Conference SOCO’16-CISIS’16-ICEUTE’16, San Sebastián, Spain, 19–21 October 2016; Springer: Cham, Switzerland, 2016; pp. 126–135. [Google Scholar]
  9. Nurwaha, D.; Wang, X. Prediction of rotor spun yarn strength using support vector machines method. Fibers Polym. 2011, 12, 546–549. [Google Scholar] [CrossRef]
  10. Pavlinić, D.Z.; Geršak, J.; Demšar, J.; Bratko, I. Predicting seam appearance quality. Text. Res. J. 2006, 76, 235–242. [Google Scholar] [CrossRef]
  11. IDC. 2019. Available online: https://www.idc.com/getdoc.jsp?containerId=prUS45197719 (accessed on 15 October 2020).
  12. Grand View Research Inc. 2019. Available online: https://www.grandviewresearch.com/press-release/global-industrial-internet-of-things-iiot-market (accessed on 6 December 2019).
  13. Marketsandmarkets Inc. 2019. Available online: https://www.marketsandmarkets.com/pdfdownloadNew.asp?id=129733727 (accessed on 1 March 2020).
  14. Zhou, L.; Wu, D.; Chen, J.; Dong, Z. When computation hugs intelligence: Content-aware data processing for industrial IoT. IEEE Internet Things J. 2017, 5, 1657–1666. [Google Scholar] [CrossRef]
  15. Heng, J.; Chen, W.; Tao, F.; Lin, C.-L. Industrial IoT in 5G environment towards smart manufacturing. J. Ind. Inf. Integr. 2018, 10, 10–19. [Google Scholar] [CrossRef]
  16. Zhang, Q.; Yang, L.T.; Chen, Z.; Li, P.; Bu, F. An adaptive dropout deep computation model for industrial IoT big data learning with crowdsourcing to cloud computing. IEEE Trans. Ind. Inform. 2018, 15, 2330–2337. [Google Scholar] [CrossRef]
  17. Hung, Y.-H. Investigating how the cloud computing transforms the development of industries. IEEE Access 2019, 7, 181505–181517. [Google Scholar] [CrossRef]
  18. Esfahani, A.; Mantas, G.; Matischek, R.; Saghezchi, F.B.; Rodriguez, J.; Bicaku, A.; Maksuti, S.; Tauber, M.G.; Schmittner, C.; Bastos, J. A lightweight authentication mechanism for M2M communications in industrial IoT environment. IEEE Internet Things J. 2017, 6, 288–296. [Google Scholar] [CrossRef]
  19. Pinto, S.; Gomes, T.; Pereira, J.; Cabral, J.; Tavares, A. IIoTEED: An enhanced, trusted execution environment for industrial IoT edge devices. IEEE Internet Comput. 2017, 21, 40–47. [Google Scholar] [CrossRef]
  20. Teslya, N.; Ryabchikov, I. Blockchain-based platform architecture for industrial IoT. In Proceedings of the 2017 21st Conference of Open Innovations Association (FRUCT), Helsinki, Finland, 6–10 November 2017; IEEE: New York, NY, USA, 2017; pp. 321–329. [Google Scholar]
  21. Zhang, Y.; Guo, Z.; Lv, J.; Liu, Y. A Framework for smart production-logistics systems based on CPS and industrial IoT. IEEE Trans. Ind. Inform. 2018, 14, 4019–4032. [Google Scholar] [CrossRef] [Green Version]
  22. Mahmoodpour, M.; Lobov, A.; Lanz, M.; Mäkelä, P.; Rundas, N. Role-based visualization of industrial IoT-based systems. In Proceedings of the 2018 14th IEEE/ASME International Conference on Mechatronic and Embedded Systems and Applications (MESA), Oulo, Finland, 2–4 July 2018; IEEE: New York, NY, USA, 2018; pp. 1–8. [Google Scholar]
  23. Civerchia, F.; Bocchino, S.; Salvadori, C.; Rossi, E.; Maggiani, L.; Petracca, M. Industrial internet of things monitoring solution for advanced predictive maintenance applications. J. Ind. Inf. Integr. 2017, 7, 4–12. [Google Scholar] [CrossRef]
  24. De Faria, H.J.; Costa, J.G.S.; Olivas, J.L.M. A review of monitoring methods for predictive maintenance of electric power transformers based on dissolved gas analysis. Renew. Sustain. Energy Rev. 2015, 46, 201–209. [Google Scholar] [CrossRef]
  25. Yan, J.; Meng, Y.; Lu, L.; Li, L. Industrial big data in an industry 4.0 environment: Challenges, schemes, and applications for predictive maintenance. IEEE Access 2017, 5, 23484–23491. [Google Scholar] [CrossRef]
  26. Nguyen, K.-A.; Do, P.; Grall, A. Multi-level predictive maintenance for multi-component systems. Reliab. Eng. Syst. Saf. 2015, 144, 83–94. [Google Scholar] [CrossRef]
  27. Wang, J.; Zhang, L.; Duan, L.; Gao, R.X. A new paradigm of cloud-based predictive maintenance for intelligent manufacturing. J. Intell. Manuf. 2017, 28, 1125–1137. [Google Scholar] [CrossRef]
  28. Selcuk, S. Predictive maintenance, its implementation and latest trends. Proc. Inst. Mech. Eng. Part B J. Eng. Manuf. 2017, 231, 1670–1679. [Google Scholar] [CrossRef]
  29. Wang, K. Intelligent predictive maintenance (IPdM) system–Industry 4.0 scenario. WIT Trans. Eng. Sci. 2016, 113, 259–268. [Google Scholar]
  30. Dhall, R.; Solanki, V. An IoT based predictive connected car maintenance. Int. J. Interact. Multimed. Artif. Intell. 2017, 4, 16–22. [Google Scholar] [CrossRef] [Green Version]
  31. Baptista, M.; Sankararaman, S.; de Medeiros, I.P.; Nascimento, C.J.; Prendinger, H.; Henriques, E.M. Forecasting fault events for predictive maintenance using data-driven techniques and ARMA modeling. Comput. Ind. Eng. 2018, 115, 41–53. [Google Scholar] [CrossRef]
  32. Canizo, M.; Onieva, E.; Conde, A.; Charramendieta, S.; Trujillo, S. Real-time predictive maintenance for wind turbines using Big Data frameworks. In Proceedings of the 2017 IEEE International Conference on Prognostics and Health Management (ICPHM), Dallas, TX, USA, 19–21 June 2017; IEEE: New York, NY, USA, 2017. [Google Scholar]
  33. Şuteu, M.D.; Baban, C.F.; Baban, M.; Dragomir, G.; Toth, K.E. Predictive Maintenance of the Automated Sewing Machines in Textitle Industry; Universitatea din Oradea: Oradea, Romania, 2019. [Google Scholar]
  34. Baban, C.F.; Baban, M.; Suteu, M.D. Using a fuzzy logic approach for the predictive maintenance of textile machines. J. Intell. Fuzzy Syst. 2016, 30, 999–1006. [Google Scholar] [CrossRef]
  35. Baban, M.; Baban, C.F.; Suteu, M.D. Maintenance decision-making support for textile machines: A knowledge-based approach using fuzzy logic and vibration monitoring. IEEE Access 2019, 7, 83504–83514. [Google Scholar] [CrossRef]
  36. Boukili, A.; Hammoumi, M.E.; Haouache, S. Statistical study on the use of the measurement techniques in predictive maintenance taking Moroccan companies as an example. Int. J. Ind. Syst. Eng. 2019, 31, 38–69. [Google Scholar]
  37. Pech, M.; Vrchota, J.; Bednář, J. Predictive maintenance and intelligent sensors in smart factory: Review. Sensors 2021, 21, 1470. [Google Scholar] [CrossRef] [PubMed]
  38. Calabrese, F.; Regattieri, A.; Bortolini, M.; Gamberi, M.; Pilati, F. Predictive maintenance: A novel framework for a data-driven, semi-supervised, and partially online prognostic health management application in industries. Appl. Sci. 2021, 11, 3380. [Google Scholar] [CrossRef]
  39. Bergmann, A. Data Mining for Manufacturing: Preventive Maintenance, Failure Prediction, Quality Control; Salzgitter Mannesmann Forschung GmbH: Duisburg, Germany, 2012. [Google Scholar]
  40. IIoT World. 2019. Available online: https://iiot-world.com/connected-industry/industrial-iot-and-the-data-sharing-economy/ (accessed on 31 December 2019).
  41. McKinsey. The Age of Analytics: Competing in a Data-Driven World. 2016. Available online: http://www.cosmeticinnovation.com.br/wp-content/uploads/2017/01/MGI-The-Age-of-Analytics-Full-report.pdf (accessed on 23 June 2019).
  42. Mou, X.G.; Cai, Y.; Zhou, X.; Chen, G. On-line yarn cone defects detection system based on machine vision. J. Text. Res. 2018, 39, 139–145. [Google Scholar]
  43. Dema, M.; Turner, C.; Sari-Sarraf, H.; Hequet, E. Machine vision system for characterizing horizontal wicking and drying using an infrared camera. IEEE Trans. Ind. Inform. 2016, 12, 493–502. [Google Scholar] [CrossRef]
  44. Varghese, B.; Wang, N.; Barbhuiya, S.; Kilpatrick, P.; Nikolopoulos, D.S. Challenges and opportunities in edge computing. In Proceedings of the 2016 IEEE International Conference on Smart Cloud (SmartCloud), New York, NY, USA, 18–20 November 2016; IEEE: New York, NY, USA, 2016; pp. 20–26. [Google Scholar]
  45. Yin, S.; Bao, J.; Li, J.; Zhang, J. Real-time task processing method based on edge computing for spinning CPS. Front. Mech. Eng. 2019, 14, 320–331. [Google Scholar] [CrossRef] [Green Version]
  46. Hawkins, M. Cyber-physical production networks, internet of things-enabled sustainability, and smart factory performance in industry 4.0-based manufacturing systems. Econ. Manag. Financ. Mark. 2021, 16, 73–83. [Google Scholar]
  47. Chen, T.; Lin, C.-W. Smart and automation technologies for ensuring the long-term operation of a factory amid the COVID-19 pandemic: An evolving fuzzy assessment approach. Int. J. Adv. Manuf. Technol. 2020, 111, 3545–3558. [Google Scholar] [CrossRef] [PubMed]
  48. Rahman, A.; Chakraborty, C.; Anwar, A.; Karim, R.; Islam, J.; Kundu, D.; Rahman, Z.; Band, S.S. SDN–IoT empowered intelligent framework for industry 4.0 applications during COVID-19 pandemic. Clust. Comput. 2021, 1–18. [Google Scholar] [CrossRef]
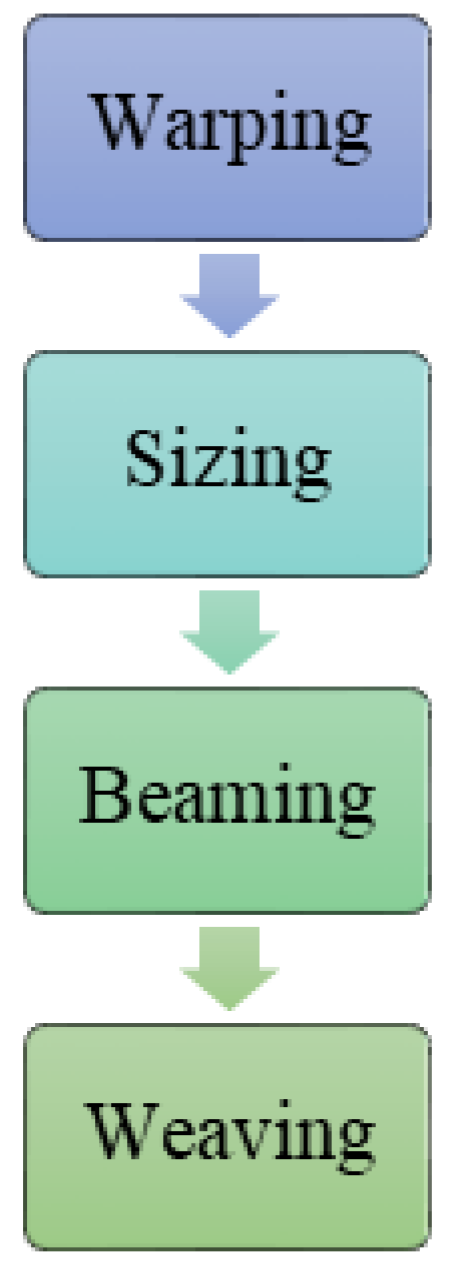
Figure 1. Textile manufacturing process.
Applsci 11 09945 g001
Figure 2. Warping machine structure.
Applsci 11 09945 g002
Figure 3. Sizing machine structure.
Applsci 11 09945 g003
Figure 4. Beaming machine structure.
Applsci 11 09945 g004
Figure 5. PdM procedure in the textile manufacturing process.
Applsci 11 09945 g005
Figure 6. Data model in the textile manufacturing process.
Applsci 11 09945 g006
Figure 7. Procedure of model deployment.
Applsci 11 09945 g007
Figure 8. Procedure of K-fold cross-validation.
Applsci 11 09945 g008
Figure 9. Concept of the K-fold cross-validation.
Applsci 11 09945 g009
Figure 10. PdM analytics on the cloud.
Applsci 11 09945 g010
Table 1. Highly cited PdM-related studies.
YearHighlights of Thestudies
[23]2017Proposed an intelligent system for maintaining vibration and temperature in an electricity power plant
[24]2015Predicted electric power transformer failure by monitoring dissolved gases in oil
[25]2017Analyzed industrial data to predict the remaining life of important components of machining equipment
[26]2015Proposed a cost evaluation model for optimizing maintenance decision variables
[27]2017Predicted fault diagnosis and remaining useful life and implemented a maintenance schedule based on the proposed system
[28]2017Surveyed PdM-related trends and techniques and provided suggestions for implementing factory PdM
[29]2016Reported that intelligent PdM can satisfy customers’ needs and change global markets in the manufacturing industry
[30]2017Discussed vehicular IoT and car PdM with connected technologies
[31]2018Used data analytics to predict airline maintenance scheduling
[32]2017Reported the evolution of PdM-related solutions in a Big Data environment
Table 2. Production facilities of the use case.
TypeMain Equipment
Polyamide Main Factory
TMT automatic spinning and winding equipment.
Six production lines in two plants
Weaving Plant
The drawing-in machines
Weaving and Dyeing Plant
The dye weighting, resolving, and conveying system
Automated color matching systems
Table 3. Production capacity of the use case.
Product NameCapacityUnit
Nylon Chip580,000ton/year
Filament Yarn36,000ton/year
Weaving5,000,000yards/month
Piece Dye8,000,000 (Woven)
700,000 (Knitting)
yards/month
kg/month
Yarn Dye250,000kg/month
Table 4. Manufacturing dataset.
Filename
(.csv)
Size
(MB)
Number of ColumnsNumber of Raw DataDescription
warpop7.13726,103operation parameters in the warping process
sizeop54615,950operation parameters in the sizing process
beamop8.63137,089operation parameters in the beaming process
weaveop50.925161,821operation parameters in the weaving process
Table 5. Target equipment setting parameters.
ProcessNameDescription
warpingWARPSPEEDThe speed of warping
WARPPRES The tension of the Warper’s Beam
SSTENSIONThe tension of monofilament
WARPTENSIONThe tension of warping
HYDRATENSIONThe tension of hydraulic warping.
sizingSIZINGSPEEDThe speed of sizing.
SIZINGBPRESThe pressure of sizing
SIZINGATENSIONThe tension of sizing (roll-out)
SIZINGBTENSIONThe tension of sizing (winding)
CONSISTENCYThe density of forming polymeric material
DENSITYThe density of the sizing
beamingBEAMSPEEDThe speed of beaming
BEAMATENSIONThe tension of roll-out
BEAMBTENSIONThe tension of winding
BEAMTENSIONThe tension of beaming
Table 6. Features of the training dataset.
Attribute NameDescriptionData TypeProcess Stage
1WARPTOTALThe number of warpNUMBERWarping
Sizing
Beaming
2TOTALLENGTHThe actual total length of warpingNUMBER
3THEORYLENGTHThe theoretical total length of warpingNUMBER
4YARNSPECDENIMThe denier number of yarn specificationNUMBER
5YARNSPECFIBERBASEThe fiber number of yarn specificationNUMBER
6DENIMThe theoretical denier numberNUMBER
7FIBERBASEThe theoretical fiber numberNUMBER
8UNITWEIGHTThe weight per unitNUMBER
9GRANULARITYThe granularity of yarnNUMBERSizing
10WARPLENGTHThe length of warpNUMBER
11WARPSTRIPThe length of beamingNUMBER
12WARPLENGHTThe length of the warpingNUMBER
13SIZINGLENGTHThe length of the sizingNUMBER
Table 7. Linear regression results for the warping process.
ParametersMSEMAE
WARPSPEED0.054410.19
WARPPRES0.000740.02
SSTENSION0.003470.03
WARPTENSION0.031610.11
HYDRATENSION0.017040.08
Table 8. Lasso regression results for the warping process.
ParametersMSEMAE
WARPSPEED0.057200.18
WARPPRES0.000850.02
SSTENSION0.023790.13
WARPTENSION0.060670.17
HYDRATENSION0.040030.14
Table 9. Ridge regression results for the warping process.
ParametersMSEMAE
WARPSPEED0.055030.17
WARPPRES0.000770.02
SSTENSION0.003870.04
WARPTENSION0.060670.01
HYDRATENSION0.016890.08
Table 10. Elastic net results for the warping process.
ParametersMSEMAE
WARPSPEED0.057300.18
WARPPRES0.000840.02
SSTENSION0.023700.13
WARPTENSION0.060320.17
HYDRATENSION0.039110.13
Table 11. Linear regression results for the sizing process.
ParametersMSEMAE
SIZINGSPEED0.051620.19
SIZINGBPRES0.058510.21
DENSITY0.001710.02
CONSISTENCY0.000850.02
SIZINGATENSION0.004220.04
SIZINGBTENSION0.006110.05
Table 12. Lasso regression results for the sizing process.
ParametersMSEMAE
SIZINGSPEED0.077310.24
SIZINGBPRES0.071200.25
DENSITY0.002020.03
CONSISTENCY0.001240.02
SIZINGATENSION0.008210.07
SIZINGBTENSION0.011600.09
Table 13. Ridge regression results for the sizing process.
ParametersMSEMAE
SIZINGSPEED0.052700.19
SIZINGBPRES0.060800.21
DENSITY0.001700.02
CONSISTENCY0.000840.02
SIZINGATENSION0.004820.05
SIZINGBTENSION0.069800.06
Table 14. Elastic Net results for the sizing process.
ParametersMSEMAE
SIZINGSPEED0.077010.24
SIZINGBPRES0.071110.24
DENSITY0.002010.03
CONSISTENCY0.001230.03
SIZINGATENSION0.008140.07
SIZINGBTENSION0.011570.09
Table 15. Linear regression results for the beaming process.
ParametersMSEMAE
BEAMSPEED0.007230.07
BEAMATENSION0.000720.01
BEAMBTENSION0.000710.01
BEAMTENSION0.000560.01
Table 16. Lasso regression results for the beaming process.
ParametersMSEMAE
BEAMSPEED0.007900.08
BEAMATENSION0.000850.01
BEAMBTENSION0.000880.01
BEAMTENSION0.001530.03
Table 17. Ridge regression results for the beaming process.
ParametersMSEMAE
BEAMSPEED0.007350.07
BEAMATENSION0.000750.01
BEAMBTENSION0.000750.01
BEAMTENSION0.000800.01
Table 18. Elastic Net results for the beaming process.
ParametersMSEMAE
BEAMSPEED0.007800.08
BEAMATENSION0.000840.01
BEAMBTENSION0.000870.01
BEAMTENSION0.001500.03
Publisher’s Note: MDPI stays neutral with regard to jurisdictional claims in published maps and institutional affiliations.