Article

Framework for Developing an Information Technology Maturity Model for Smart City Services in Emerging Economies: (FSCE2)

by
Wilson Nieto Bernal
* and
Keryn Lorena García Espitaleta
*
Facultad de Ingeniería, Departamento de Ingeniería de Sistemas, Universidad del Norte, Puerto Colombia, Barranquilla 080001, Atlántico, Colombia
*
Authors to whom correspondence should be addressed.
Appl. Sci. 2021, 11(22), 10712; https://doi.org/10.3390/app112210712
Submission received: 22 July 2021 / Revised: 10 October 2021 / Accepted: 11 October 2021 / Published: 13 November 2021
(This article belongs to the Special Issue Information and Communications Technology for Industry 4.0)

Abstract

:
The goal of this research is to design a framework to develop an information technology (IT) maturity model to guide the planning, design, and implementation of smart city services. The objectives of the proposed model are to define qualitatively and measure quantitatively the maturity levels for the IT dimensions used by smart cities (IT governance, IT services, data management and infrastructure), and to develop an implementation model that is practical and contextualized to the needs of any territory that wants to create or improve smart city services. The proposed framework consists of three components: a conceptual model of smart city services, IT dimensions and indicators, and IT maturity levels. The framework was validated by applying it to a case study for the evaluation of the IT maturity levels for the city of Cereté, Colombia.

1. Introduction

The introduction should briefly place the study in a broad context and highlight why the percentage of the world’s population living in urban areas will increase to 60% by 2030 and around 70% by 2050 (United Nations, 2018), with repercussions on society, the economy and the environment. Because of the above, it is essential that governments promote the use of new information technologies to improve the quality of life of citizens.
In Colombia, 75% of the population lives in urban centers, and it is estimated that this proportion will increase to 85% by 2050. This indicates that approximately 20 million people will arrive in cities, with housing, transportation, services public for social services, among others (Department National Planning, 2014).
For this reason, the Colombian government must promote sustainable practices for the country, ensure that cities are more productive and intelligent, in order to improve the quality of life of citizens, care for the environment and allow connectivity in all cities. Information technologies are the fundamental pillar for the success of smart cities, as they make governments and private entities more transparent, improve the efficiency of urban goods and services, and that citizens interact with the city, thus improving the quality of life and smarter decision-making [1].
The issue of smart cities is evolving in Colombia and there are significant advances based on the public policy of the intelligent cities and territories system of the Ministry of ICT [2], but most Colombian cities lack a defined roadmap, which would serve as a guide for the implementation of smart city initiatives. Therefore, it takes a great deal of effort for Colombia’s local governments to align the way with the macro trends that are imposed in the smart cities that exist in the world today.
This research work aims to design a framework to develop a model of maturity of Information Technologies (IT) that can be applied in smart city initiatives in Colombia, which will allow the determination of the level of technological development in the following IT dimensions: IT government, IT services, data management, and technological infrastructure.
The intention with the proposed model is that it is practical and contextualized and can be implemented in any city that wants to transform into a smart city or for those that already are but want to improve their level of IT maturity. The proposed IT maturity framework will improve the identification of the current level of maturity of IT for the cities under study. Those cases will serve to establish a smart services implementation roadmap. Adopting maturity levels will align IT investments in local development plans.
Then, in Section 2: State of the Art, a systematic review of literature on smart cities is presented, identifying reference standards, conceptual models and architecture, measurement indicators and maturity for IT. Part III Description of the IT Maturity Framework defines the information technology maturity model that guides the planning, design, and implementation of services applied to smart cities. Part IV Application Methodology describes the steps to apply the proposed framework to the case study in the city of Cereté, Córdoba (Colombia). Finally, Part V Results and Conclusions show the results, conclusions and recommendations for the adoption of the framework.

2. State of the Art

2.1. Definition of Smart Cities

The transformation of urban centers has become one of the key challenges in the development of cities, the articulation between the strategic objectives of the cities and the demand for services by citizens gives rise to the creation of new communication and communication environments interaction, primarily virtual and digital. The fund is to improve and develop new organizational, technological, and operational capabilities. In this way, it seeks to provide fast, reliable, safe, portable services, disruptive technologies such as big data, IoT, machine learning, artificial intelligence, cloud computing, virtual platforms, mobile applications and high-speed networks in all their formats play a key role. They facilitate citizen to developed transactions with the digital city, giving rise to type interactions (Ci2Co cities to costumer), the universal interface or the delivery channel for the citizen must reflect in digital or virtual format, which can be accessed with any personal device (phone, tablet, PC, hybrid, etc.). This implies that the public management bodies of the cities integrate emerging technologies and disruptive models to manage different government areas, such as public transport, public services, urban security, health controls, budgets and monitoring, monitoring of pandemics or endemics, such as is the case with COVID-19. All these scenarios lead to tackling strategies to accelerate digital transformation processes, as described in other works [3]. This rapid transformation of urban centers, driven by the different political, economic, cultural, social dimensions, spatial planning, can configure a highly interconnected digital space to provide services from the context of the city to its citizens.
In the work of [4], the concern that exists in the economic world regarding the developments of smart cities is also exposed. In this work, the economic approach is addressed, focusing on specific theories of economic development, laying the foundations of the so-called circular economy. Likewise, the areas of health and mobility once again play a key role in the development of smart cities.

2.2. Smart City Conceptual Model

The concept of smart cities has become important in the last decade because it allows the improvement of the quality of life of citizens, makes intensive use of information technologies, facilitates intelligent decision-making in real time, increases competitiveness, economic growth and complies with the principles of sustainable development. In recent decades, population growth has progressively increased, and cities have become key in socio-economic development by concentrating population and economic activity in urban centers. According to the estimated United Nations report, approximately 70% of the world’s population will live in cities by 2050 [5].
A smart city integrates information and communication technology with physical, digital and human systems to ensure a sustainable and prosperous future for citizens. It can improve the quality of life of its inhabitants in many areas, such as smart home, smart healthcare, transportation and the smart community [6].
The smart city’s objectives are to improve the efficiency of the cities of the future and the quality of life of their inhabitants, to promote the socio-economic development of cities, not only by making use of new technological applications but also by making existing processes smarter [7].
With the application of information and communication technologies (ICTs), smart cities are more efficient in their use of physical infrastructure and resources and learn and adapt efficiently to any type of change and participate with citizens in local government [8].
The realm of smart cities is probably where the Internet of things (IoT) has been most forcefully applied so far because what surrounds us has to be connected and, at the same time, interconnected with each other.
IoT describes a world where everyday objects are always connected to the Internet, allowing them to communicate and interact with each other. By connecting these everyday objects to the Internet and making them available anywhere at any time, IoT allows you to remotely monitor, manage, and collect status information about them and their environment [9].
A smart city is one that undertakes initiatives in at least one or more of the following six features: smart mobility, smart governance, smart economy, smart people, smart Living and Smart Environment. This classification is well known and used by many researchers [10].
Additionally, according [11] present a holistic approach for the conceptualization of a smart city, where is key to consider the components, technological, management, and policy components. In some cases, the cities are considered as smart. However, the important thing is to distinguish between the degree and the nature of intelligence, rather than a dichotomy between “being intelligent” or “not being intelligent”. Intelligence should be seen as a continuum in which local government officials, citizens, and other stakeholders could think and implement initiatives that try to make a city smarter: “a better place to live and work. [12] presents a brief description of smart cities, followed by the features, generic architecture, composition and real-world implementations of smart cities among the various concepts that use ICT in urban environments, for example, digital city, green city, sustainable city, smart city, etc.
In the work of [13], discussed information technology as a fundamental and transversal element in the development of smart cities, to generate added value to the sectors of a smart city and its economy, environment, education, mobility, etc. Colombian cities do not have valuation models on technology management capabilities, so the proposed model is an instrument for the implementation of smart city initiatives.

2.3. IT Maturity Frameworks

A maturity model is a tool that has proven valuable in measuring different aspects of a process or organization. It represents a path to an increasingly organized and systematic way of doing business in organizations. A maturity model consists of several “maturity levels”. The number of levels may vary, depending on the domain and concerns that motivate the model [14].
The maturity model represents the level of effectiveness and efficiency of the organization. Measuring maturity is a concept used to make measurements in your organization toward an organization process or activity. Among the recognized models, we can cite: CMMI, OPM3, etc., [15].
The goal of CMMI is to provide guidance to improve the organization’s processes to manage the development, acquisition, and maintenance of products or services. There are six capacity levels, designated by numbers 0 through 5 from lowest to highest (see Table 1). [16].
Using a maturity model can help a government or organization achieve its goals successfully, efficiently, and systematically during efforts, such as strategy and operations [17].
Maturity models are used to help assess the level of maturity of the smart cities and determine the critical capabilities that should to developed for consolidated the goods and services digitals [15].
Maturity models for smart cities are defined to help city leaders assess the current state of the city and provide guidance for its evolution. Among the different maturity models existing in the domain of smart cities, there is the maturity model for measuring and comparing inequality in Brazilian cities (Br-SCMM) and a smart city maturity model developed by Sustainability Outlook (SO SCMM) [18].
The IDC model better identifies the stages, key measures results, and actions required for cities to effectively move through the stages and progress towards the long-term goal of becoming a smart city (see Table 2).
Other models toward intelligent maturity in a city are the IDC government insight, smart city governance maturity framework, IBM intelligent transportation assessment, smart city readiness and Garuda smart city models (GSCM)—(see Table 3) and [15,20].
The Scottish smart city maturity model, an intelligent city framework adapted from the IDC model and the PAS 181 British Standard Institution, can be used as a reference to determine the concept and direction of the implementation of a smart city. It identifies and measures the existing condition of a city to map the city’s capabilities (see Table 4) and [21].
As It shows [22], that smart cities are based on autonomous and distributed infrastructure that includes a heterogeneous intelligent information processing and control network infrastructure and ubiquitous detection involving millions of sources of information. The paper mentions that due to the continued growth in data volume and the number of IoT devices connected, problems such as high latency, bandwidth bottlenecks, security, privacy, and scalability occur.
In [13], describes how the smart city’s ICT adoption maturity model (SCIAMM) defines 5 domains (e-government strategy, public innovation, data, infrastructure and services), 15 key domain areas (KDA), and 48 critical variables (CVs). This model was applied in Colombia, using public data from the Ministry of ICT (MinTIC) for Colombia’s seven largest cities, and presented results such as the strong correlation between the presence of national programs and the improvement of local KDA.

3. Proposed Framework for Developing an IT Maturity Model for Smart City Services in Emerging Economics

The framework proposed to develop an IT maturity model for smart city services, consists of three components Figure 1, a conceptual model of smart city service, IT dimensions, indicators and IT maturity levels. The framework components are designed to be adopted in a practical and contextualized way for the implementation of smart city services. The framework components are described below.

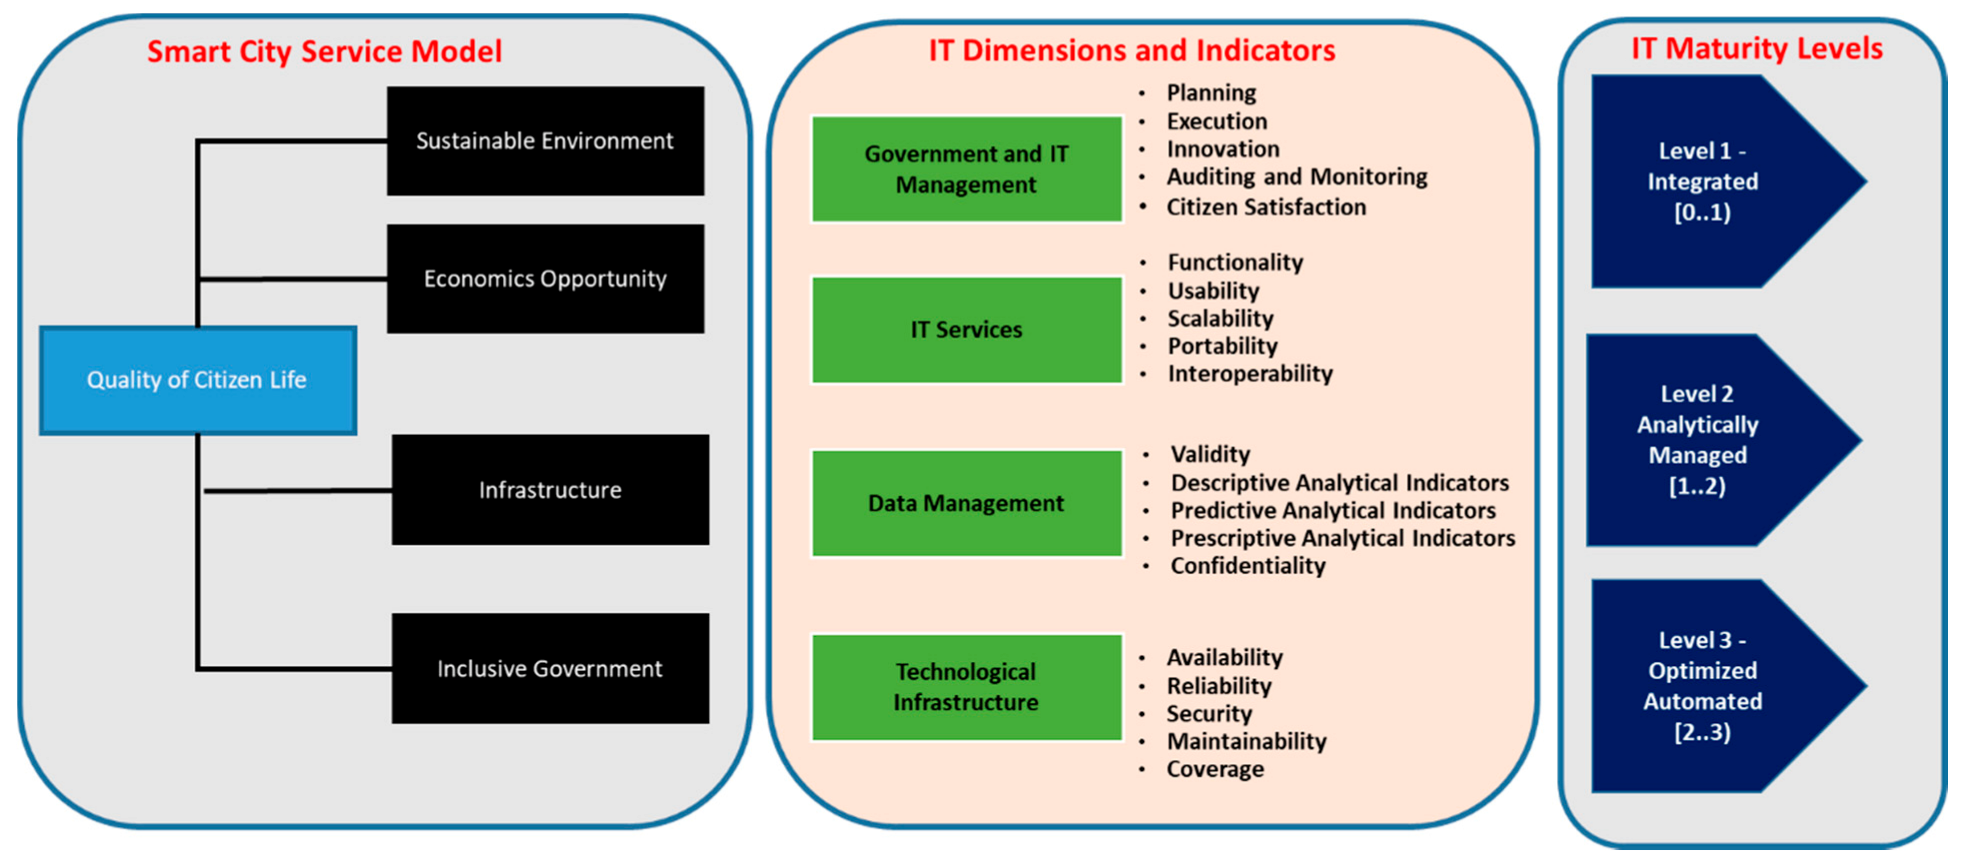
3.1. Conceptual Model Smart City Services

The proposed maturity framework considers a city to be smart if it has at least one information technology initiative, impacting one of the areas of service in the area of citizen quality of life, and is integrated into other services in the following four areas of the city: opportunity economy, infrastructure, including government and sustainable environment.

3.1.1. Quality of Citizen Life

It aims to increase the quality of life of the people who are part of the city. It is aimed at enhancing the social and human capital of the city and promoting collective intelligence. It includes the following service areas: health, education, housing, security, culture and recreation.

3.1.2. Sustainable Environment

It is focused on the efficient and sustainable management of the city’s resources: renewable water and energy resources, urban planning and green areas, and waste management.

3.1.3. Economics Opportunity

It focuses on the economic and competitive development of the city based on information technologies: employment and entrepreneurship, industry and commerce, and the innovation ecosystem.

3.1.4. Infrastructure

It aims to improve the provision of public services, mobility and transport, and accessibility to information technology: utility infrastructure, road and transport infrastructure, and information technology infrastructure.

3.1.5. Inclusive Government

It is directed towards an open and transparent government, which relies on technology to achieve quality and efficiency in the services it offers to its citizens. It includes the following service areas: strategic planning, transparent and online governance, and social collaboration.

3.2. IT Dimensions and Indicators

Table 5 describes the four information technology dimensions considered (government and IT management, IT services, data management, and technological infrastructure) and the corresponding indicators to assess their maturity level based on the selection of ITIL model factors that were improved and adopted for the proposed framework.
In the proposed conceptual model, IT dimensions are based on industry standards, using a layer model similar to TOGAF but well defined and associating the most important indicators of the ITIL and COBIT standards.

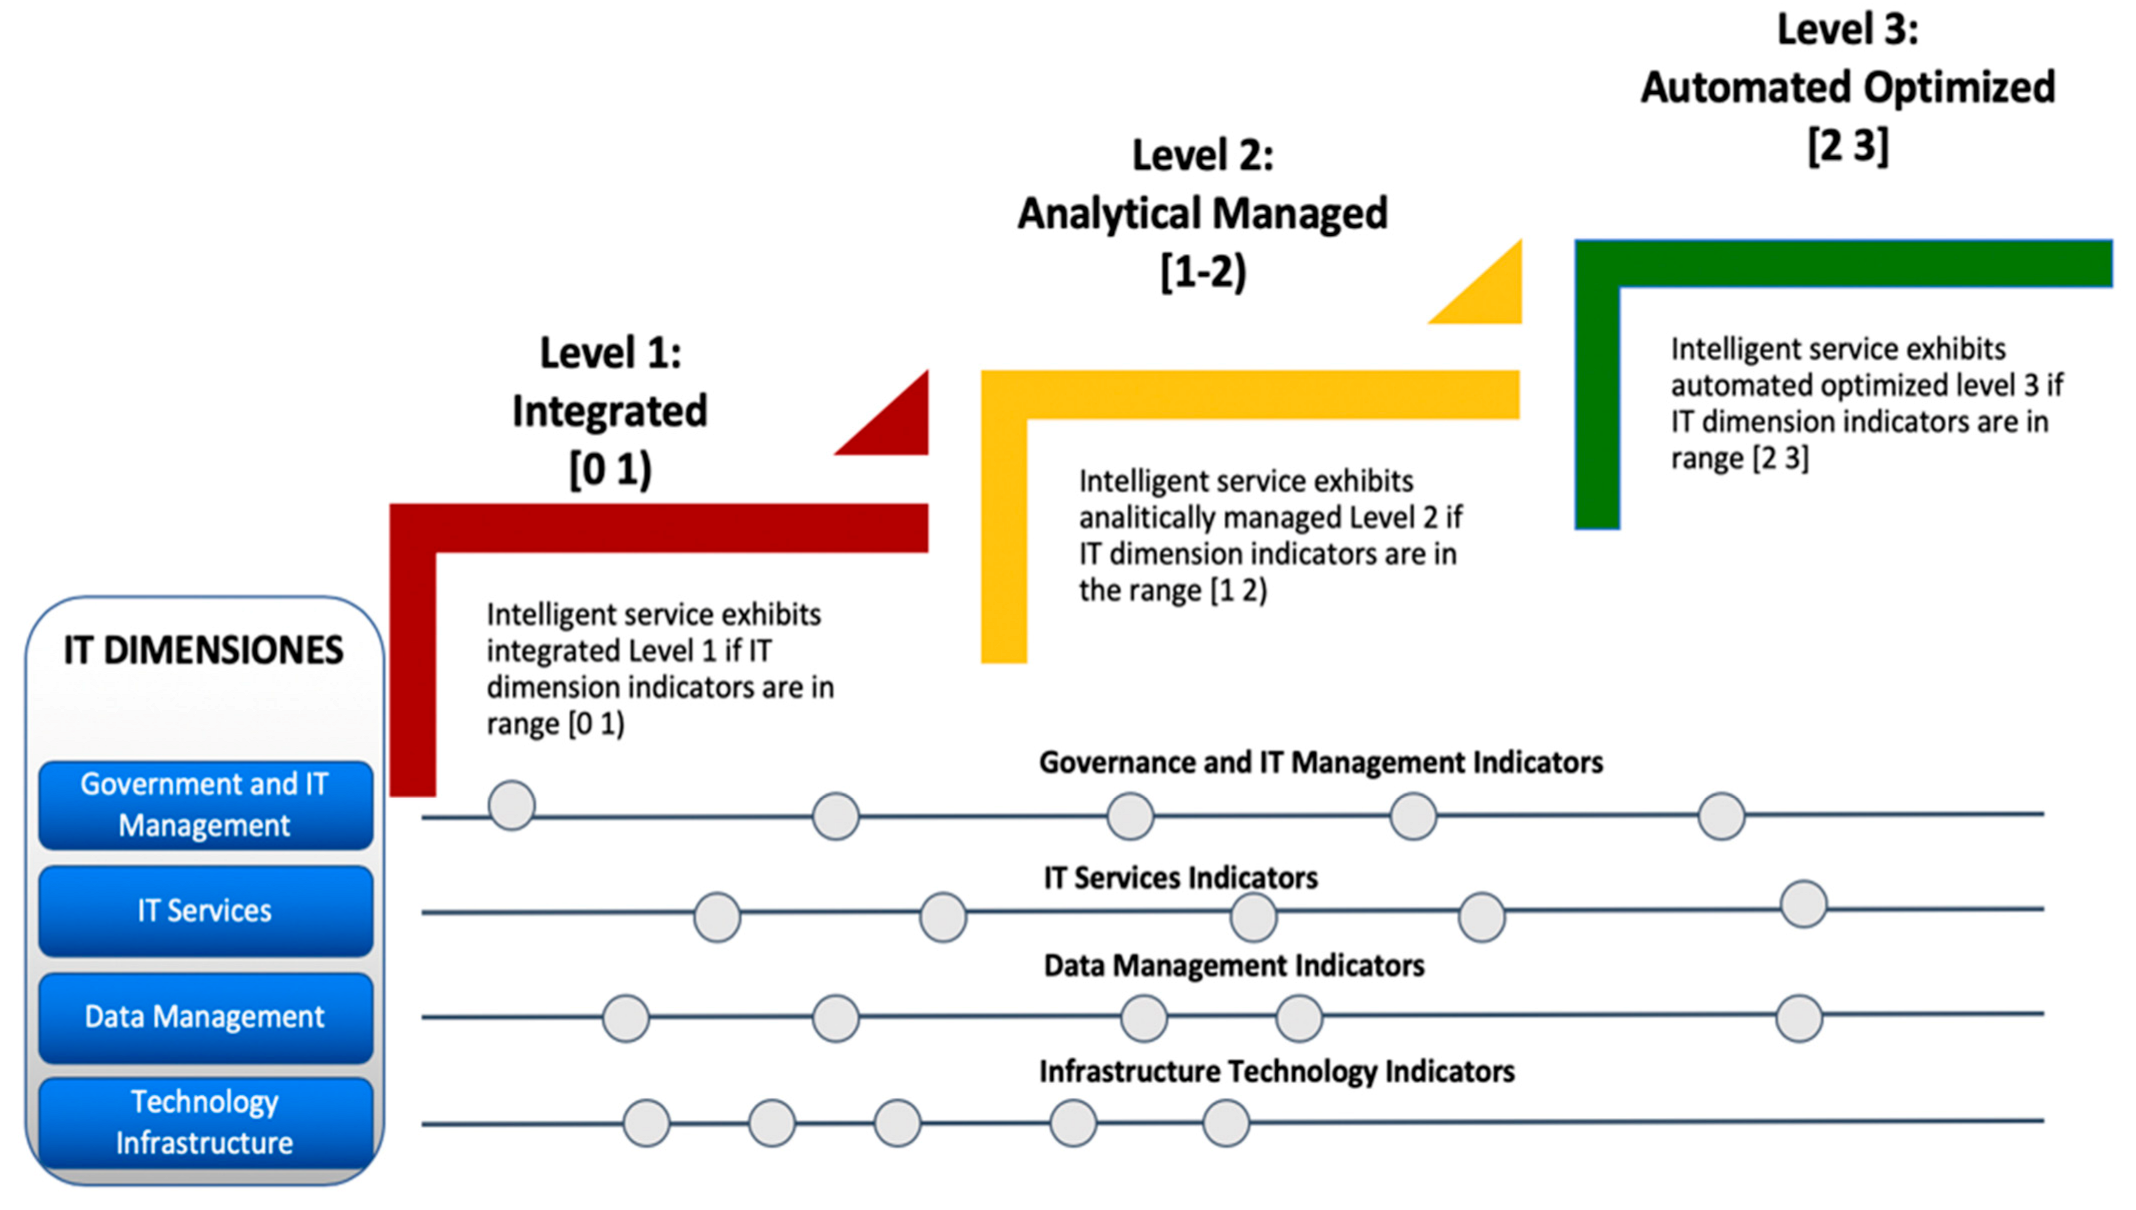
3.3. IT Maturity Model

The IT maturity model consists of three maturity levels: (Figure 2).

3.3.1. Level 1 Integrated

When information is collected stored, integrated and available for use by smart services. Intelligent service exhibits integrated level 1 if IT dimension indicators are in the range of [0 1].

3.3.2. Level 2 Analytically Managed

When descriptive, predictive, prescriptive analytics can be managed and applied to generate smart dashboards for decision making. Intelligent service exhibits analytically managed level 2 if IT dimension indicators are in the range of [1 2].

3.3.3. Level 3 Optimized Automated

In addition to having information integrated and managed analytically, it can be automated by applying artificial intelligence with the aim of improving decision-making, efficiency and the efficiency of systems. Intelligent service exhibits automated optimized level 3 if IT dimension indicators are in the range of [2 3].

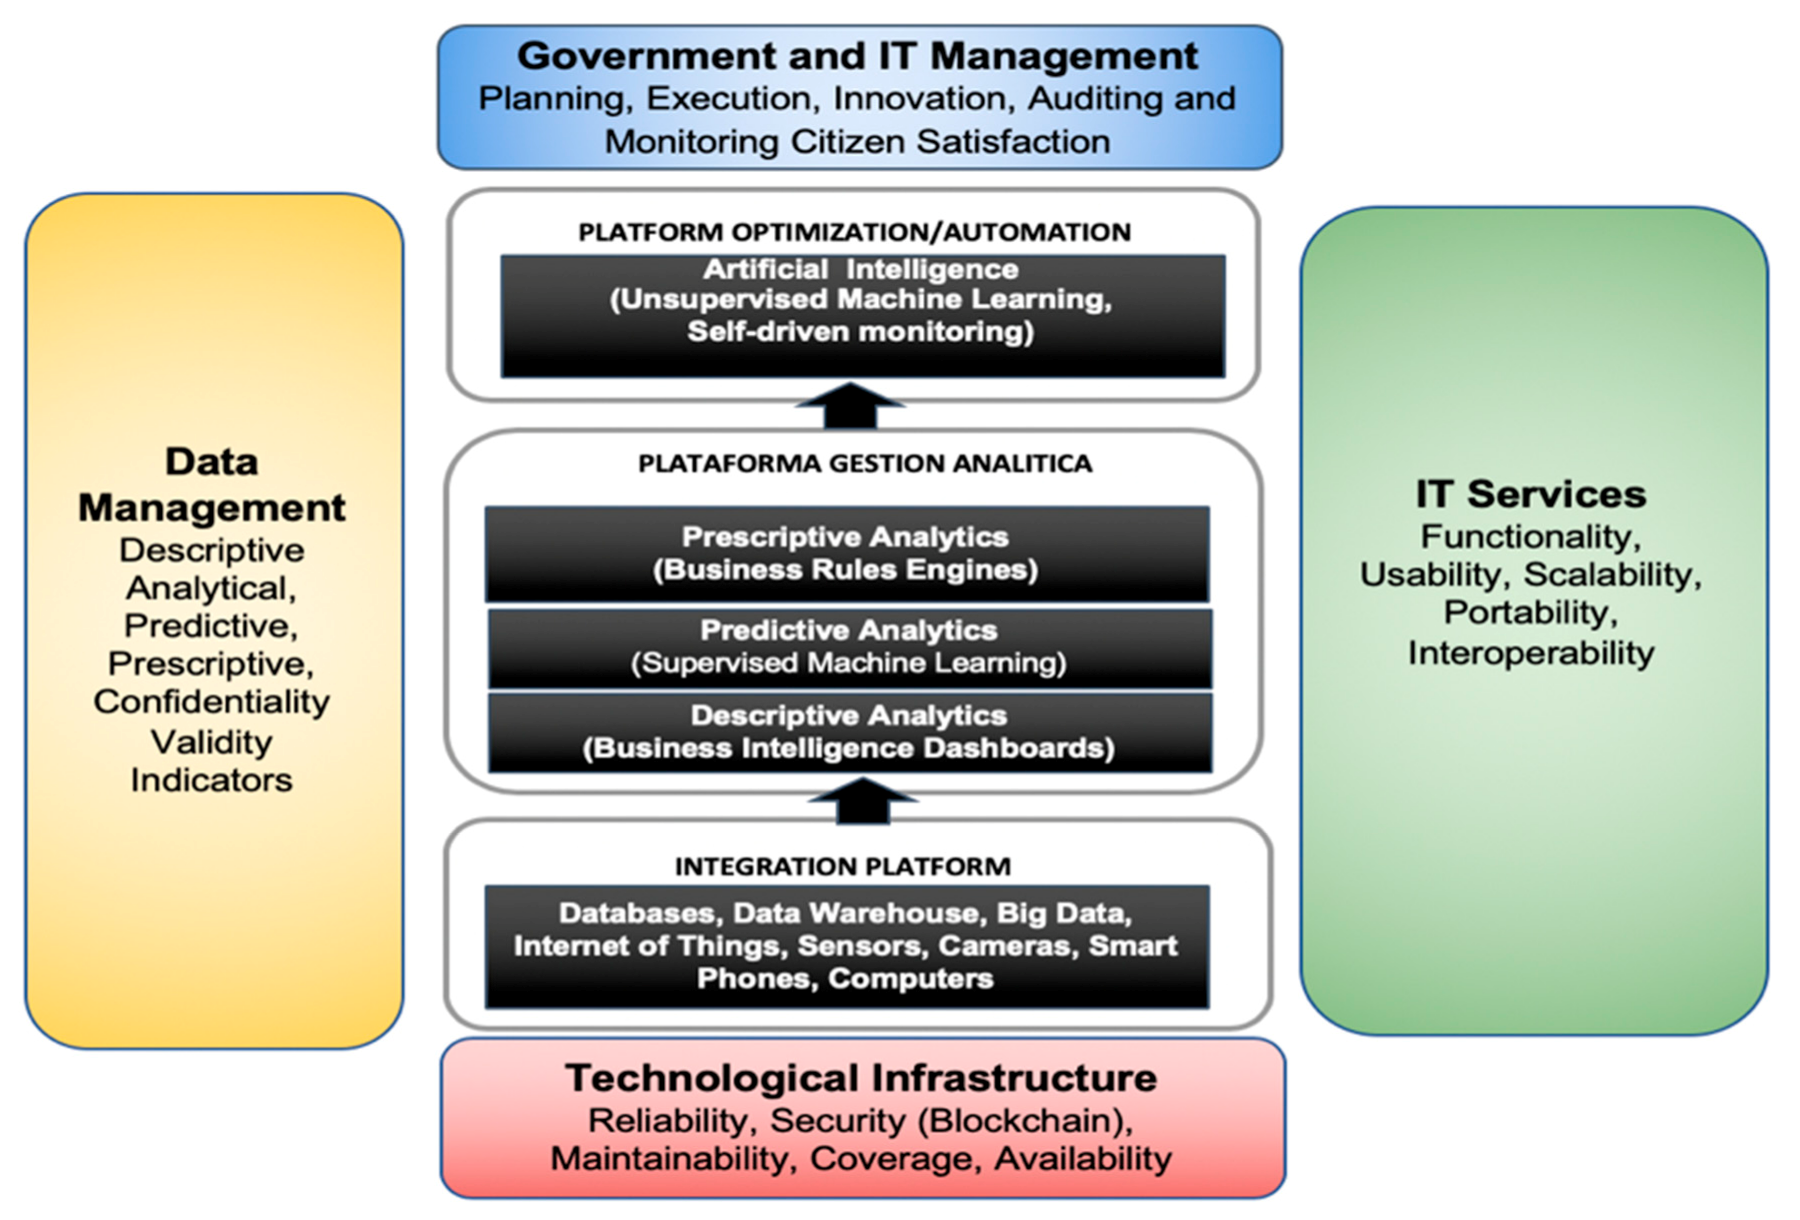
3.4. Information Architecture

The information architecture supports IT dimensions and consist of three platforms (Figure 3).

3.4.1. Integration Platform

Data sources of the different information tools such as big data (Hadoop), data warehouses, databases, internet of things, sensors, cameras, smart phones, computers.

3.4.2. Analytical Management Platform

Built-in data to generate decision boards using descriptive, predictive, and prescriptive analytics tools.

3.4.3. Optimization and Automation Platform

Utilizes tools for optimization and automation and real-time decision-making. Includes artificial intelligence and machine learning tools for real-time decision making.

3.5. Special Features of This Proposed Framework (Advantages and Challenges)

Generate value: It provides strategic value for all stakeholders (city governance actors, those responsible for city management and citizens in general), facilitates public policy decision-making and allows the development of strategies to consolidate a smart city.
Holistic approach: A framework that assesses the structural components of the smart city system, taking into account its components that work together in a holistic way.
A dynamic framework: This means that each time one or more design factors are changed (for example, a change in strategy or technology), the impact of these changes in the framework must be considered, through a dynamic vision aligned with the objectives and strategies of the city and its digital transformation processes.
An adaptable framework: This means that it can cover end-to-end governance, management and measure the level of growth of the smart city, focusing not only on the technological aspects, but also on the related dimensions (for example, economic, social, cultural, environmental, and politics) in order to achieve the objectives of the smart city and contribute to the urban digital transformation.

3.6. Comparing with Other Standards

Many of the criteria proposed for governance and management of smart cities only remain in the definition of dimensions and indicators, for this it is valid to bring up what is proposed in [23]. With the comparison of smart city standards, implementation and cluster models of Cities in North America and Europe, they say that the city managers need indicators for target setting, performance assessment, monitoring, management, and decision-making purposes. The choice of the most suitable indicator framework is crucial but difficult, as it requires expert knowledge. This paper compares seven recently published indicator standards for smart, sustainable cities.
However, one of the aspects to improve in the different frameworks, lies in finding a holistic version that goes from the strategic component until the operational component, guaranteeing the delivery services for the citizen in a digital environment.

4. Application Methodology

For each case study, the five steps of the framework methodology for the IT maturity model were applied and they are described in Table 6: (1) select smart city services for the quality of life; (2) determine the importance of each IT dimension; (3) determine the magnitude of each indicator; (4) determine the maturity index of each IT dimension, using an optimization application on Python language.

5. Results

To validate the framework, the 2020–2023 development plan for the city of Cereté, an agro-industrial city located in Cordoba (Colombia).
A total of 12 smart city services were identified and classified according to the service areas defined for the quality of life (Table 7).
Leaders in the area of information technology assigned importance values to each of the IT dimensions, asking comparison questions and using values from 1 to 9 as shown in Table 8, based on the ranking of AHP analytical hierarchical process [24], where 1 represents equal importance and 3, 5, 7, 9 represent levels of more importance and 1/3, 1/5, 1/7, 1/9 levels of less importance.
Using the analytical hierarchical process (AHP) method the importance of each IT dimension is calculated in two steps. Step 2a (Table 8) shows the pairwise comparison of IT dimensions and the value assigned for the Cereté stakeholders.
Step 2b (Table 9) shows how the comparison values are normalized (converted to percentage values between 0 and 1) and then calculate the importance of each IT dimension as the average, as presented in the Table 10. The important value obtained for each IT dimension was as follows: governance and IT management (12%), IT services (48%), data management (15%), infrastructure technology (25%). It can be concluded that, for the Cereté case study stakeholders, the most important dimension is IT services with 48% importance. The least important dimension was 12% governance and IT management.
Similarly, Cereté mayoral information technology leaders assigned comparison values for the indicators of each IT dimension, which allowed the percentages of importance of each indicator to be calculated using AHP, as shown in Table 10.
The most important indicators for each IT dimension are governance and IT management the most important indicator is planning with 40%. In IT services, the most important indicator is functionality at 53%. In data management, the most important indicator is validity at 60%. In technological infrastructure, the most important indicator is availability at 41%.
In the proposed framework, the indicator is the level of granularity to determine the maturity of each IT dimension. Therefore, each indicator is evaluated by the information technology leaders of the city of Cereté, assigning values between [0 3] to represent the maturity state of the indicator in each service area.
The results for each indicator evaluated by service area are presented in Table 11. For example, for the planning indicator, it was evaluated at what level the indicator is in the area of health services (0.5), education (1.5) and so on.
Table 12 presents the maturity indices for each IT dimension, calculated considering the level of importance of each indicator and the maturity values assigned to each indicator. The total maturity levels for each smart services area is calculated by considering the weighted average maturity levels of each dimension of the service areas multiplied by the importance of each dimension.
The housing area is the least developed in terms of data integration and project availability (0.19). The areas of education and health services have the highest maturity rate (1.63 and 1.60, respectively) which means that these areas are managed analytically with indicators for decision-making and certain levels of predictive and prescriptive analytics. The areas of security, culture and recreation have an average integrated level (0.5 and 0.49), indicating a certain level of data and information integration.
Finally, step 5 uses the maturity levels of each IT dimension to optimize the investments in smart services projects. Table 13 describes the optimization for the 12 projects considered, the costs, the maturity index for each dimension. A linear programming optimization was executed, as decision variable Xi representing if a project will be selected or not to satisfy the objective function, (see Equation (1)):
Objective Function = [Xi] × [Government Maturity Index and IT Management + Maturity Index IT Services + Maturity Index Data Management + Infrastructure Maturity Index].
The results of optimizing the objective function using the Solver tool in Microsoft Excel, with the following restrictions: a budget [Cost] × [Xi] maximum of 5055 million of COP (Colombia Pesos) and at least one project selected for each service area.
The result of the optimization is to select the following project investments P1, P4, P6. P9, and P11. These are the projects that satisfy the budget constraints and maximize the objective function based on the index of maturity IT.
The decision variable X[i] = P1, P4, P6, P9, P11, represents the project in the portfolio of smart city services for Cereté that will satisfy the budget and maximization of index of maturity constraint.
The projects with X[i] = P2, P3, P5, P7, P8, P10, P12 do not satisfy the budget constraints and maximization of the maturity model in the linear programming optimization model.

6. Conclusions

The design of the IT maturity framework and the methodology of application to case studies are based on the revision of smart city models and the revision of IT maturity frameworks in the literature. The smart city model review considered service areas or areas, structural components, mediation variables, and actors. The IT maturity framework review considered IT dimensions, measurement, and IT indicators and application methodologies.
A framework was designed to develop an information technology maturity (IT) model, which allows the determination of the level of technological development in the following four IT dimensions: government and IT management, IT services, data management, technological infrastructure.
The IT maturity model was applied to the analysis of smart service initiatives in the city’s 2020–2023 development plan case study (Cereté, Córdoba, Colombia), demonstrated its applicability to measure quantitative and qualitative the level of IT maturity for each of the service areas of the quality of life of a smart city: health, education, safety, housing, recreation and culture.
The proposed model is practical and contextualized and can be implemented in any city that wants to transform into a smart city or for those that already are but want to improve their level of IT maturity.
The proposed IT maturity model is flexible and recommended to be adjusted with different levels of granularity, not only by intelligent services, by service areas, by smart city areas, but you can also determine the overall level of IT maturity for cities case study.
The proposed IT maturity model is also scalable and is recommended to fit the particularities of each smart city to define more or less IT dimensions, indicators, service areas, and city scopes.
The maturity indices found for each service area allow you to use the model to optimize investments in smart services. We recommend that you use linear programming-based models that aim to maximize the maturity rate of IT dimensions by intelligent service area, while meeting the budget constraints targeted in the development plan for these service areas.
Finally, the application of the IT maturity model to case studies has received positive feedback from the different leaders of the Cereté Mayoral Government. It is recommended to use the IT maturity framework and model to the intelligent territories and cities assessment implemented by the Ministry of Information and Communications Technologies, to have a quantitative and more reliable assessment of the maturity levels of each IT dimension.

Author Contributions

All authors contributed equally to this work. All authors have read and agreed to the published version of the manuscript.

Funding

This research received no external funding.

Conflicts of Interest

The authors declare no conflict of interest.

References

  1. Góngora, G.P.M. Review of Literature on Smart Cities: A ICT-Focused Perspective. Ingeniare 2016, 19, 137–149. [Google Scholar]
  2. MinTIC. ICT Plan 2018–2022 The Digital Future Is Everyone’s; MinTIC: Bogotá, Colombia, 2018; pp. 1–105. Available online: https://micrositios.mintic.gov.co/plan_tic_2018_2022/ (accessed on 12 December 2020).
  3. Oliveira, F.; Costa, D.G.; Lima, L.; Silva, I. iBikeSafe: A Multi-Parameter System for Monitoring, Evaluation and Visualization of Cycling Paths in Smart Cities Targeted at Cycling Adverse Conditions. Smart Cities 2021, 4, 56. [Google Scholar] [CrossRef]
  4. Parra-Domínguez, J.; Santos, J.H.; Márquez-Sánchez, S.; González-Briones, A.; De la Prieta, F. Technological Developments of Mobility in Smart Cities. An Economic Approach. Smart Cities 2021, 4, 50. [Google Scholar] [CrossRef]
  5. Hernafi, Y.; Ben Ahmed, M.; Bouhorma, M. An Approaches’ based on Intelligent Transportation Systems to Dissect Driver Behavior and Smart Mobility in Smart City. In Proceedings of the 2016 4th IEEE International Colloquium on Information Science and Technology (CiSt), Tangier-Assilah, Morocco, 24–26 October 2016; pp. 886–895. [Google Scholar]
  6. Enayet, A.; Razzaque, M.A.; Hassan, M.M.; Alamri, A.; Fortino, G. A Mobility-Aware Optimal Resource Allocation Architecture for Big Data Task Execution on Mobile Cloud in Smart Cities. IEEE Commun. Mag. 2018, 56, 110–117. [Google Scholar] [CrossRef]
  7. Eckhoff, D.; Wagner, I. Privacy in the Smart City – Applications, Technologies, Challenges and Solutions. IEEE Commun. Surv. Tutor. 2017, 20, 489–516. [Google Scholar] [CrossRef] [Green Version]
  8. Andrisano, O.; Bartolini, I.; Bellavista, P.; Boeri, A.; Bononi, L.; Borgheti, A. The Need of Multidisciplinary Approaches and Engineering Tools for the Development and Implementation of the Smart City Paradigm. Proc. IEEE 2018, 106, 738–760. [Google Scholar] [CrossRef]
  9. Freitas, A.; Brito, L.; Baras, K.; Silva, J. Smart mobility: A survey. In Proceedings of the 2017 International Conference on Internet of Things for the Global Community (IoTGC), Funchal, Portugal, 10–13 July 2017. [Google Scholar]
  10. Mishbah, M.; Census, D.I. Information System Implementation in Smart Cities Based on Types, Region, Sub-area. In Proceedings of the 2017 International Conference on Information Technology Systems and Innovation (ICITSI), Bandung, Indonesia, 23–24 October 2017; p. 7. [Google Scholar]
  11. Gil-Garcia, J.R.; Pardo, T.A.; Nam, T. What makes a city smart? Identifying core components and proposing an integrative and comprehensive conceptualization. Inf. Polity 2015, 20, 61–87. [Google Scholar] [CrossRef]
  12. Silva, B.N.; Khan, M.; Han, K. Towards sustainable smart cities: A review of trends, architectures, components, and open challenges in smart cities. Sustain. Cities Soc. 2018, 38, 697–713. [Google Scholar] [CrossRef]
  13. Maestre, G.P.; Astudillo, H.; Nieto, W.; Concha, G. Empirical evidence of Colombian national e-government programs’ impact on local Smart City-Adoption. In Proceedings of the 11th International Conference on Theory and Practice of Electronic Governance, Galway, Ireland, 4–6 April 2018; pp. 517–525. [Google Scholar]
  14. Proenca, D.; Borbinha, J. Enterprise architecture: A maturity model based on TOGAF ADM. In Proceedings of the 2017 IEEE 19th Conference on Business Informatics (CBI), Thessaloniki, Greece, 24–27 July 2017; Volume 1, pp. 257–266. [Google Scholar]
  15. Firmanyah, H.S.; Supangkat, S.H.; Arman, A.A.; Ariani, Y. Identifying Component for Building Smart City Maturity Model Through Document Based Weighting and City Problem in Indonesia. In Proceedings of the 2017 6th International Conference on Electrical Engineering and Informatics, Banda Aceh, Indonesia, 18–20 October 2017; Volume 21. [Google Scholar]
  16. Barclay, C. Sustainable security advantage in a changing environment: The cybersecurity capability maturity model (CM2). In Proceedings of the 2014 ITU Kaleidoscope Academic Conference: Living in a Converged World-Impossible without Standards? St. Petersburg, Russia, 3–5 June 2014; pp. 275–282. [Google Scholar]
  17. Jaquire, V.; Von Solms, S. Developing a cyber-counterintelligence maturity model for developing countries. In Proceedings of the 2017 IST-Africa Week Conference (IST-Africa), Windhoek, Namibia, 30 May–2 June 2017; pp. 1–8. [Google Scholar]
  18. Torrinha, P.; Machado, R.J. Assessment of maturity models for smart cities supported by maturity model design principles. In Proceedings of the 2017 IEEE International Conference on Smart Grid and Smart Cities (ICSGSC), Singapore, 23–26 July 2017; pp. 252–256. [Google Scholar]
  19. Tobergte, D.R.; Curtis, S. Mapping Smart Cities in the EU. J. Chem. Inf. Model. 2013, 53, 1689–1699. [Google Scholar]
  20. Ishaq, A.; Mukhtar, M.; Wahyudi, M.; Indriani, K. Information technology governance using cobit 4.0 domain delivery support and monitoring evaluation. J. Theor. Appl. Inf. Technol. 2017, 95, 5304–5315. [Google Scholar]
  21. The Scottish Government, Scottish Cities Alliance and Urban Tide. Smart Cities Maturity Model and Self-Assessment Tool: Guidance Note for Completion of Self-Assessment Tool; Scotland Yard, The Scottish Government, Scottish Cities Alliance, and Urban Tide: London, UK, 2014; p. 44. [Google Scholar]
  22. Sharma, P.K.; Park, J.H. Blockchain based hybrid network architecture for the smart city. Future Gener. Comput. Syst. 2018, 86, 650–655. [Google Scholar] [CrossRef]
  23. Kubina, M.; Šulyová, D.; Vodák, J. Comparison of Smart City Standards, Implementation and Cluster Models of Cities in North America and Europe. Sustainability 2021, 13, 3120. [Google Scholar] [CrossRef]
  24. Saaty, R.W. The analytic hierarchy process—What it is and how it is used. Math. Modeling 1987, 9, 161–176. [Google Scholar] [CrossRef] [Green Version]
Figure 1. Proposed IT maturity framework for smart city services.
Applsci 11 10712 g001
Figure 2. Quantitative model levels of maturity for dimensions TI.
Applsci 11 10712 g002
Figure 3. Information architecture.
Applsci 11 10712 g003
Table 1. Maturity levels.
Maturity LevelDescription
Level 0Incomplete
Level 1Performed
Level 2Managed
Level 3Defined
Level 4Quantitatively Managed
Level 5Optimized
Source: based on the published information of [16]
Table 2. Smart cities maturity levels.
Level MaturityDescription
Level 1A smart city strategy or policy only
Level 2In addition to Level 1, a project plan or project vision, but there is no pilot or implementation
Level 3In addition to Level 2, smart city initiative pilots
Level 4A smart city with at least one smart city initiative fully launched or implemented
Source: based on the published information of [19].
Table 3. IDC maturity levels.
Level 1: Ad-HocLevel 2: OpportunisticLevel 3: Purposeful & RepeteableLevel 4: OperationalisedLevel 5: Optimised
City Management StatusSiloedSystem collaborationSystem integrationManaged systemSustainable and open “System of System”
Smart City StatusOperation focused digital and date driven service improvementHolistic system thinking and emergent sharing of dataStrategy led and outcome driven. Enabled by system-wide technology investmentTechnology and data enabled dynamic sense and response systemsContinuously adaptive city-wide “smart” deployment
Effect on OutcomesCapturing evidence and building business caseCross boundary partnerships emerging to focus on shared out comesShared accountability for outcomes and joint system-wide investment programmeImproved prediction, prevention and real-time response delivers improved outcomesCity-wide open “system of systems” approach drives innovation that enhances city competitiveness
Source: based on the published information of [20].
Table 4. Dimension maturity IDC.
ConceptOutline
Strategic IntentSuccessful smart cities have a strategic roadmap on how investment in data and digital technologies enable service reform and partner collaboration. An effective strategy focuses on delivering improved outcomes aligned to the city’s strategic priorities
DataSuccessful smart cities make effective use of their data assets to secure better outcomes. They invest in system-wide data capture, integration and analytics capabilities. Open data underpins their commitment to transparency and innovation
TechnologySuccessful smart cities invest in open, flexible, integrated and scalable ICT architectures that enable accelerated service innovation, such as the provision of automated and real time dynamic response capabilities
Governance and Service Delivery ModelsSuccessful smart cities adapt the traditional organizational model of delivery to realize the opportunities of data and digital technologies. They invest in system-wide partnership models focused on shared outcomes
Stakeholder EngagementSuccessful smart cities make the best use of data and digital technologies to invest in enhanced openness and transparency. Stakeholder engagement and stakeholder ownership of service reform is central within a smart city. Smart cities are proactive in improving take up of digital services while supporting the digitally excluded
Source: based on the published information of [21].
Table 5. Indicators for IT smart cities’ dimensions.
IT DimensionsIndicators
Government and IT Management
It includes IT investments, their objectives, the scope of the strategy, value and competitive advantages for citizens, regulation and policies
  • Planning
  • Execution
  • Innovation
  • Auditing and Monitoring
  • Citizen Satisfaction
IT Services
Services implementing the goals to be achieved
  • Functionality
  • Usability
  • Scalability
  • Portability
  • Interoperability
Data Management
Data capture, integration and analytical applications
  • Validity
  • Descriptive Analytical Indicators
  • Predictive Analytical Indicators
  • Prescriptive Analytical Indicators
  • Confidentiality
Technological Infrastructure
Software, hardware and networking architecture to support intelligent services
  • Availability
  • Reliability
  • Security
  • Maintainability
  • Coverage
Table 6. Application steps framework methodology.
Steps to Apply the FrameworkDescription
1.
Select smart city service for service areas of citizen quality of life
Identify smart city services in the city development plan. The service must have an IT component to be an evaluation candidate. In addition, the service must impact one of the service areas of the area of quality of citizen life: health, education, housing, security, culture and recreation
2.
Determining the importance of each IT dimension and each indicator
2a. Determine the importance of each IT dimension (IT governance and management, IT Services, data management, technology infrastructure)
2b. Determine the importance of each indicator
3.
Determine the level of maturity of each indicator
Assign the level of maturity for each indicator, using the following scale of possible values according to maturity levels:
Level 1: Integrated [0 1] if intelligent service information is integrated;
Level 2: Analytically Managed [1 2] if smart service information has smart dashboards with analytics;
Level 3: Optimized/Automated [2 3] if the information is optimized and automated for decision making.
4.
Determine the maturity index of each IT dimension
Determine the index of maturity for each IT dimension
SUMPRODUCT ((importance IT indicator) X (magnitude indicators IT dimension))
5.
Optimization
Use maturity for each IT dimension to solve optimization problems by making investment decisions in smart services.
Table 7. Step 1: Select smart city services.
Quality of LifeDescriptionSmart City Service
Development Plan (2020–2023)
HealthAccessibility to health services with opportunity and integrality for CordobaActions to inspect and monitor acute respiratory infections and COVID-19 by health care providers by 100%
Increase access to COVID-19 transmission prevention services by 100% of the population through information and mass communication days
Updating the system for registering information for persons with disabilities and crossing databases
EducationEducational coverage with equity for the Welfare of the CordobesesCordoning learning environments with new information technologies
Implement a monitoring and monitoring program to the management of the education sector
Implement literacy program for out-of-school youth and adults
SecuritySecurity, legality and itizen cohabitationInstall security cameras in the suburbs of Cereté municipality
Provide the central police command and rural IADs with telecommunications equipment
Increase community alarms triggered in neighborhoods and articulated with neighborhood quadrants and community leaders
HousingProduce preserving and preserving producingEstablish educational projects for the promotion, dissemination and training in disaster prevention and care
Culture and RecreationCreation and access to educationRecreational parks and improved sports venues
Table 8. Step 2a: Determine the importance of the IT dimensions.
IT Dimension
Pair-Wise Comparison
Level of Importance
Assigned
IT Servicesvs.Government and IT Management5—More Important
IT Servicesvs.Data Management7—More Important
IT Servicesvs.Infrastructure1—Equal Important
Data Managementvs.Government and IT Management3—More Important
Data Managementvs.IT Services1/7—Less Importance
Data Managementvs.Infrastructure1—Equal Importance
Infrastructurevs.Government and IT Management1—Equal Importance
Infrastructurevs.IT Services1—Equal Importance
Infrastructurevs.Data Management1—Equal Importance
Government and IT Managementvs.IT Services1/5—Less Importance
Government and IT Managementvs.Data Management1/3—Less Importance
Government and IT Managementvs.Infrastructure1—Equal Importance
Table 9. Step 2b: Apply AHP to determine % importance.
AHP Comparison of
IT Dimensions
Government and IT ManagementIT ServicesData ManagementInfrastructure
Government and IT Management1.000.200.331.00
IT Services5.001.007.001.00
Data Management3.000.141.001.00
Infrastructure1.001.001.001.00
AHP Comparison of
IT Dimensions
Government and IT ManagementIT ServicesData ManagementInfrastructure% Importance
Government and IT Management0.100.090.040.250.12
IT Services0.500.430.750.250.48
Data Management0.300.060.110.250.18
Infrastructure0.100.430.110.250.22
Total1.001.001.001.001.00
Table 10. Step 2c: Determine importance of indicators.
IT Dimension% ImportanceIndicator% Importance
Government and IT Management0.12Planning 0.40
Execution0.27
Innovation0.17
Auditing and Monitoring 0.11
Citizen Satisfaction0.05
IT Services0.48Functionality0.53
Usability 0.24
Scalability 0.11
Portability0.07
Interoperability0.05
Data Management0.15Validity0.60
Descriptive Analytics Indicators 0.14
Predictive Analytic Indicators 0.10
Prescriptive Analytics Indicators0.11
Confidentiality0.05
Infrastructure0.25Availability 0.41
Reliability 0.27
Security 0.20
Maintainability0.06
Coverage0.05
Table 11. Step 2c: Determine the level of maturity for each indicator.
Dimension ITIndicatorHealthEducationHousingSegurityCulture and Recreation
Government and IT ManagementPlanning 0.5 1.5 0.0 0.5 0.3
Execution1.5 1.7 0.3 0.5 0.5
Innovation1.5 1.5 0.3 0.5 0.5
Auditing and Monitoring 1.5 1.5 0.3 0.5 0.5
Citizen Satisfaction1.5 1.7 0.3 0.3 0.5
IT ServicesFunctionality1.7 1.7 0.0 0.5 0.5
Usability 1.7 1.7 0.0 0.5 0.5
Scalability 1.5 1.3 0.0 0.3 0.5
Portability1.5 1.5 0.0 0.3 0.5
Interoperability2.0 1.5 0.0 0.3 0.5
Data ManagementValidity1.7 1.7 0.3 0.7 0.5
Descriptive Analytic Indicators. 1.5 1.5 0.3 0.7 0.5
Predictive Analytic Indicators.1.5 1.5 0.3 0.7 0.5
Prescriptive Analytic Indicators.1.5 1.5 0.3 0.7 0.5
Confidentiality1.7 1.7 0.3 0.7 0.5
InfrastructureAvailability 1.7 1.7 0.5 0.5 0.5
Reliability 1.7 1.7 0.5 0.5 0.5
Security 1.5 1.5 0.5 0.5 0.5
Maintainability1.5 1.5 0.5 0.5 0.5
Coverage1.7 1.7 0.5 0.3 0.5
Table 12. Determine the level of maturity for each IT dimension.
Importance 0.120.480.180.22Index Total
Area of Services/Maturity IndexMaturity Index Government and IT ManagementMaturity Index IT ServiceMaturity Index Data ManagementMaturity Index InfrastructureQuantitative ValueQualitative Value
Health1.101.681.631.651.60Level 2—Analytics Managed Service
Education1.561.861.821.711.79Level 2—Analytics Managed Service
Housing0.180.180.100.050.14Level 1—Integrated Service
Security0.490.550.540.490.53Level 1—Integrated Service
Culture & Recreation0.420.560.550.520.54Level 1—Integrated Service
Table 13. Step 5–Optimization.
Area Service ProjectCostXi = Decision Variable to Select Project InvestmentMaturity Index Government IT ManagementMaturity Index IT ServiceMaturity Index
Data Management
Maturity Index InfrastructureObjective
Function
Cost * Xi
HealthP1187611.101.681.631.656.061876
P2258001.101.681.631.652.661134
P35401.101.681.631.650.000
EducationP450013.003.003.003.0012.00500
P540001.561.861.821.710.000
P621511.561.861.821.716.96215
HousingP743000.180.180.100.050.000
SecurityP822000.490.550.540.490.000
P920010.490.550.540.491.19115
P1013000.490.550.540.490.8855
Culture & RecreationP11116110.420.560.550.522.061161
p1249700.420.560.550.520.000
Original Cost MAXOptimized Cost
32
8263 5055
Publisher’s Note: MDPI stays neutral with regard to jurisdictional claims in published maps and institutional affiliations.

