Abstract
Distance learning has been adopted as a very extended model during COVID-19-related confinement. It is also a methodology that can be applied in environments where people do not have easy access to schools. In this study, we automatically classify students as a function of their performance and we describe the best self-learning methodologies in distance learning, which will be useful both in confinement or for people with difficult access to schools. Due to the different learning scenarios provided by the different confinement conditions in the COVID-19 pandemic, we have performed the classification considering data before, during, and after COVID-19 confinement. Using a field experiment of 396 students, we have described the temporal evolution of students during all courses from 2016/2017 to 2020/2021. We have found that data obtained in the last month before the final exam of the subject include the most relevant information for a correct detection of students at risk of failure. On the other hand, students who obtain high scores are much easier to identify. Finally, we have concluded that the distance learning applied in COVID-19 confinement changed not only teaching strategies but also students’ strategies when learning autonomously.
1. Introduction
In the 2030 Agenda for Sustainable Development [1], the United Nations proposed a decalogue of objectives in order to evaluate the degree of approximation to them in the year 2030 [1]. In order to achieve the first two objectives, the end of poverty and the end of hunger (the most important ones), another eight have been developed. The fourth one, ODS 4, addresses the problem of improving quality of education, which allows socio-economic mobility and is key to getting out of poverty.
According to the United Nations [2], in 2018, more than 250 million children were out of school, representing 20% of the world population in this age range. In 2020, the arrival of the coronavirus pandemic made the situation much worse since, as the COVID-19 pandemic spread across the globe, a majority of countries made the decision to temporarily close of schools, highly impacting more than 91 percent of students worldwide. “By April 2020, almost 1.6 billion children and youth were out of school.” [2]. In this context, more than ever, the application of educational methodologies that allow students to work at home as autonomously as possible became essential.
However, this was an idea that was not new. Sugata Mitra had already begun to work in 1982 on the idea of learning with the help of computers and without the supervision of teachers [3]. The idea was to bring quality training closer to environments where there was a lack of good teachers who could meet the training needs of young people in the region. Since then, experiences of this type have multiplied, and most of them have collided with the question of how to adapt evaluation to distant learning [4,5,6]. The main problem is that novel methodologies and didactics to improve the quality of distant learning can be proposed, but if the evaluation systems are the traditional ones, the innovative pedagogies collide with the reality of not having an adequate and adapted assessment methodology.
Understanding evaluation as a component of classroom teaching research as well as a resource for the orientation of students, several studies have been developed to adapt the assessment process to the new distant learning methodologies [7,8].
Regarding the background of similar initiatives, predicting the final grade of students can be useful to correct wrong learning strategies. An example of a study about this is [9], which also uses data of this study to apply supervised machine learning algorithms. In addition, [10] shows that good predictors in soft skills can be found in bad attitudes or strategies.
As mentioned above, the prediction of grades has the potential of improving educational outcomes. Reference [11] provides a review of articles that tackle that aspect. In addition, there are already some studies which predict academic grades and dropout using classification [12,13] and regression [14,15] in higher education and high school [16]. Finally, other studies apply clustering to predict students’ scores [17].
From the point of view of the student, some studies were done to measure student satisfaction during the pandemic. Results show that first-year students were more satisfied with the teaching strategies [18]. Some studies have predicted students’ satisfaction using machine learning techniques [19]. These results suggest the need for both quality and quantity of modified assessments accommodated for emergency remote learning (ERL).
In this article, we propose the use of artificial intelligence (AI) to help teachers to evaluate students’ performance automatically in a context where most of the learning process is conducted over a distance. Our methodology is based on data extracted from adaptive tests used by students in their self-regulated learning and uses AI to classify students that are at risk of failure. This method allows teachers to optimize their work (it is virtually impossible to manually analyze these huge amounts of data) and gives them the opportunity to detect and correct wrong learning strategies in students that are not able to attend face-to-face methodologies.
In this article, we propose a methodology for data acquisition in distant learning environments, a classification system and also a first pilot experience with real students.
This article is structured as follows:
2. Context
In 1913, Edison explained to the journalist Frederick James Smith his opinion on the future of the film as educational technology. Edison had patented in 1891 one of the first motion picture cameras and a display device (the kinetoscope), and the improvements that Edison and others had made led to a new industry in 1913, with motion pictures centered in both New York and Hollywood [20].
Years ago, in 1911, Edison had announced that the cinema he invented would be an excellent complement to educational tools. “The motion picture art,” Edison said as early as 1911, “will eventually, if it has not already done so, supplement the art of printing for the transmission and diffusion of knowledge.” In a 1913 interview, the inventor made a bolder prediction. “Books,” Edison told Smith, “will soon be obsolete in the public schools. Scholars will be instructed through the eye. It is possible to teach every branch of human knowledge with the motion picture. Our school system will be completely changed inside of ten years.” [20].
The prediction has not come true, and other predictions for the future of educational technology have also failed.
It is only with the arrival of COVID-19 in 2020 that we have widely looked to technology from home lockdowns to solve online teaching. Many resources have been used:
- The use of learning management platforms (learning management systems, or LMS) such as Google Classroom or Moodle, which contain assessment tools with the possibility of creating open-ended, multiple-choice or true-false questions, among others;
- The use of video call tools with Teams, Zoom or Meet, which have been used in evaluations and tutoring.
However, the current school system, despite technological innovations, has not changed substantially in the way that Thomas Edison predicted. An author, Daisy Christodoulou, affirms that “Children still attend school buildings and sit at desks in ways that are similar to their counterparts in the 19th Century. Compared to the change and disruption that technology has brought to practically every other part of our society, education is an outlier.” [21].
The same author affirms that this opposition to change has not been produced due to a lack of effort or economic investment. “Many developed countries have made big investments in education technology, but data from the Organization for Economic Co-operation and Development (OECD) shows that these have led to ‘no appreciable improvements ’in educational achievement. In developing countries, many big philanthropic technology projects have been similarly unsuccessful.” [21].
In the past 20th century, a consolidation of kindergarten and primary education was observed, perhaps supported by the International Convention on the Rights of the Child (adopted and opened for signature, ratification and accession by General Assembly resolution 44/25 of 20 November 1989) [22], which has provided world literacy rates that have never been so high. Despite progress, in both developed and developing countries, challenges remain. One of them is innovation in evaluation systems. “To get an insight into different countries’ education systems, we can look at the data from Programme for International Student Assessment (PISA) tests. The PISA tests are run by the Organisation for Economic Co-operation and Development (OECD), and every three years they assess thousands of 15-year-olds in dozens of countries on their achievement in mathematics, science and reading. The results consistently show that even in developed countries, significant minorities have weak skills, which makes it hard for them to participate in modern society” [21].
The 21st century has seen the emergence of so-called formative evaluation processes, which are considered one of the most-appreciated teaching models thanks to their positive effects on the quality of learning. These models, which are self-directed by the students, portfolios and rubrics, have not been followed by training systems that allow self-diagnostics of the student’s learning process [23].
On the other hand, there are studies that argue some of the aspects that evaluate the pedagogical effectiveness of these tools, such as:
- the positive predisposition of users towards the tool;
- technographic and demographic data describing the use of technological solutions and their rates of use [24].
Currently, Sustainable Development Goal (SDG) 4 refers to the quality of education and contains, like the rest of the objectives for sustainable development, targets and indicators. The first of the target of this SDG 4 proposes reaching 2030 with “Free, equitable and quality primary and secondary education”. We hope that, as in the last century, this target can be accompanied by technological tools that promote quality education.
In these contexts, the assessment systems of students’ competences continue to be based on written tests, giving both students and teachers a single tool for preparing these tests, which is none other than the resolution of test models from previous years.
As can be read from [25], “The UIS identified nine cross-national learning assessments which meet the criteria to measure SDG 4 Indicator 4.1.1, the proportion of children and young people achieving minimum proficiency in reading and mathematics: LaNA (Literacy and Numeracy Assessment), PASEC (Programme d’Analyse des Systèmes Éducatifs de la CONFEMEN), PILNA (Pacific Islands Literacy and Numeracy Assessment), PIRLS (Progress in International Reading Literacy Study), PISA (Programme for International Student Assessment), SACMEQ (Southern and Eastern Africa Consortium for Monitoring Educational Quality), SEA-PLM (Southeast Asia Primary Learning Metrics), TERCE (Tercer Estudio Regional Comparativo y Explicativo) and TIMSS (Trends in International Mathematics and Science Study). Using these data sources, the UIS has calculated key indicators related to learning outcomes for SDG 4”.
3. Materials and Methods
It is well-known that the success of classification strongly depends on the quality of the data set. In the case of distant learning, the challenge is how to get data from students’ activities. To solve this problem, we have developed a methodology where students have access to the final exam questions from the very beginning of their learning process. Indeed, if students have access to their final exam, they will practice with it often in order to increase their chances of success. On the other side, at the same time, we must control them in order to avoid misbehavior such as learning only those specific questions or forgetting other content. To solve these problems, we have created a significant number of questions that also change every time a student uses the system by the modification of some numerical parameters in order to force students to learn the procedures instead of just the correct answers. In other words, since numerical parameters always change, students cannot learn the final results and are forced to calculate all the steps from the beginning.
However, we must be careful with the fact that students can still learn only formulas and apply them without fully understanding what they are doing. In previous works [26], we demonstrated that students who correctly answer questions from our test also demonstrated a good performance in tests where a full answer, including programming code and explanations, were required.
The reasons for this success are related to the format of the test and questions. First, the subject Applied Computing requires the development of programming code instead of only a simple application of formulas. In that sense, students should create a code of 5–7 lines at minimum to get the answer. In this scenario, we have several options to modify numerical values and also some concepts that change the nature of the procedure drastically. For example, some questions are related to loops, but changing a simple equation will completely change the use of the loop, for example, from a simple “for” statement to a recursive procedure. In that sense, there are some questions in the test that look rather similar, but they are very different (not only because of the change in the numbers). Students must carefully read all the questions and understand them. If they only learn some formulas and try to apply them, they will probably make a mistake, because they will not be able to distinguish the procedure just by having a quick look at the question.
All tests carried out by the students were registered by the platform, including numerical parameters such as the score, date and hour, and were used by the AI algorithms to predict the performance of all students [26,27,28].
This methodology can be also used as tools for students to self-evaluate their continuous progress, not only as instruments at the service of the teacher to qualify the student’s performance quantitatively.
We have used e-valUAM as the software for obtaining data both for self-evaluation and final exams. It has been described previously [26], and only a brief description is given here. The main idea underpinning this application is to apply an assessment process where students are evaluated through adaptive tests. This method allows us to sort contents by importance, relevance or difficulty. The basic idea is that test items are selected by the computer to individually match users’ ability level. It also implies that all students will need to firstly understand the contents that teachers consider more relevant (included in the first levels).
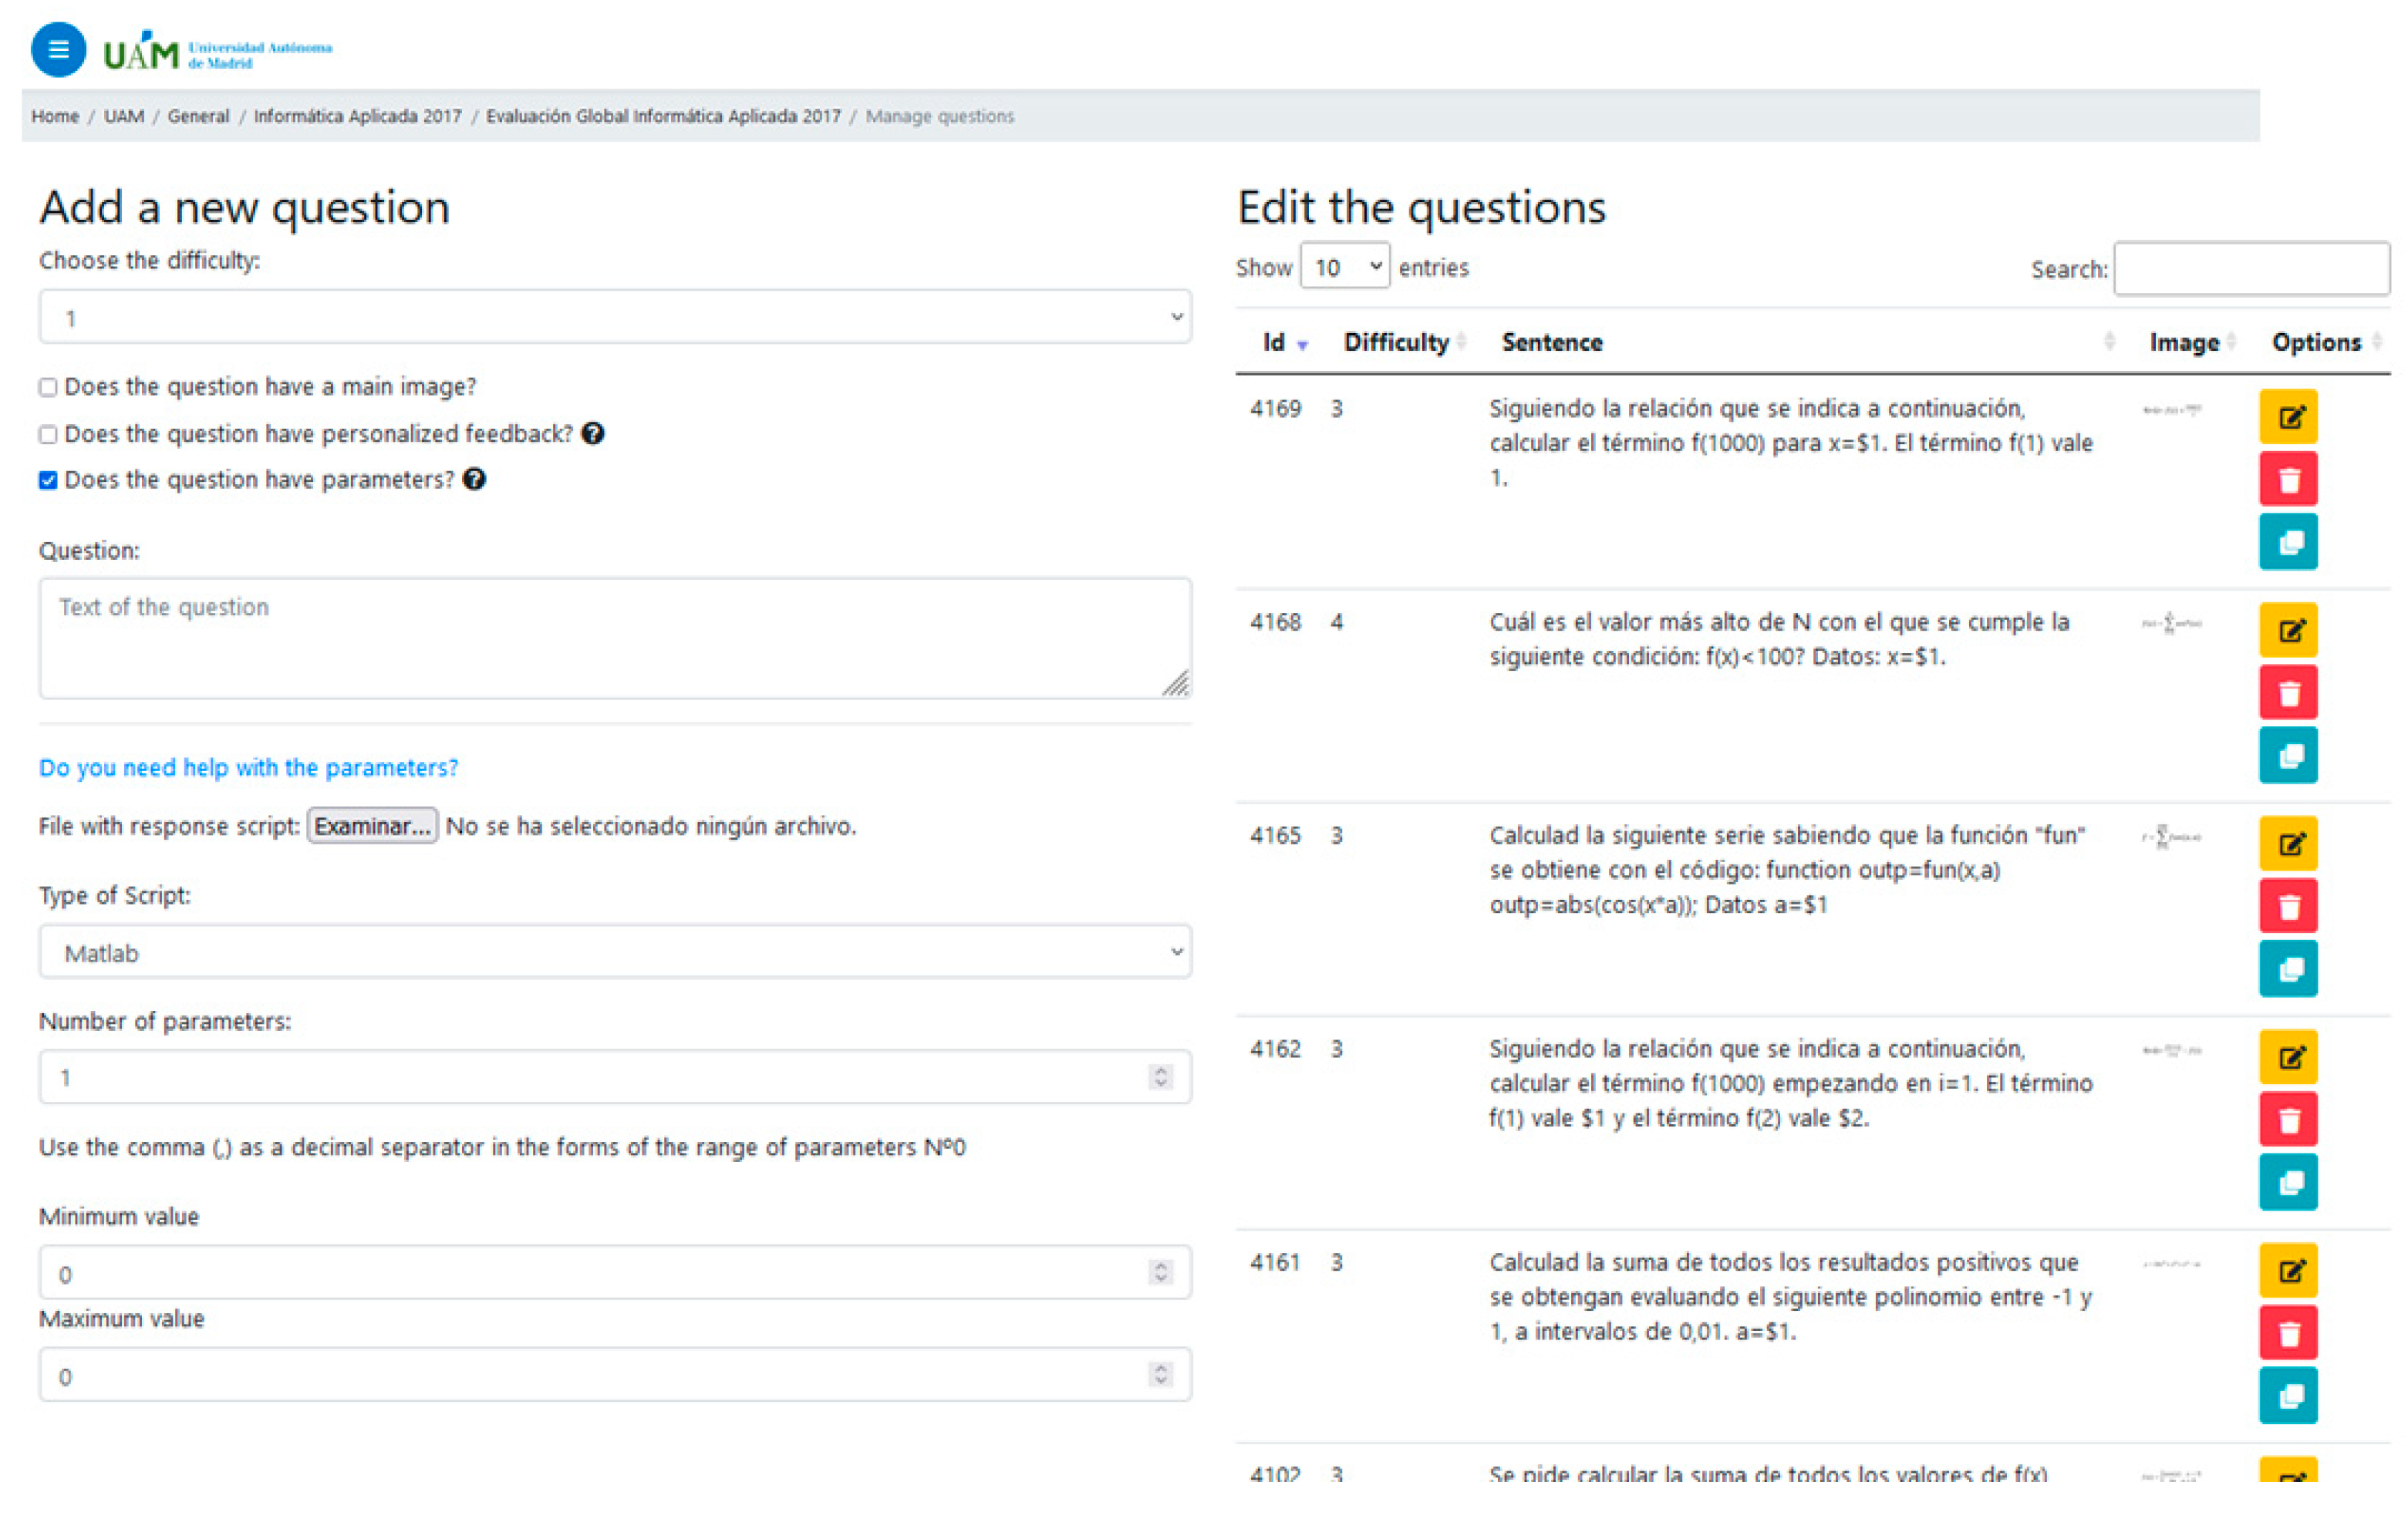
In Figure 1 and Figure 2 we show examples of the e-valUAM interface for teachers and students, respectively. In Figure 1, we can see that teachers have the option of including free parameters that will change dynamically every time a student uses the application again. The parameter must be defined between two values (minimum and maximum). Since the correct answer will change every time the free parameter changes its value, a programming code must be included to allow the system to calculate the correct answer. In this case, the application is asking for a Matlab code.
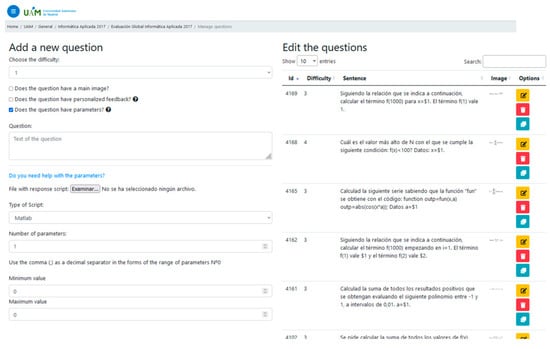
Figure 1.
e-valUAM interface for teachers, showing the questions management window.
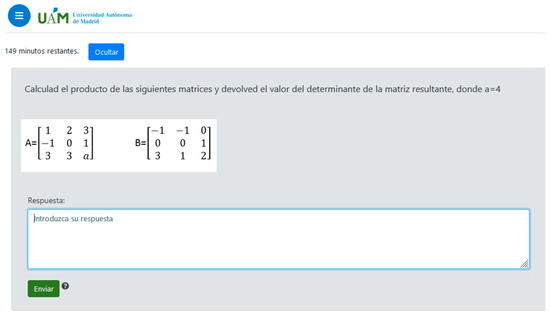
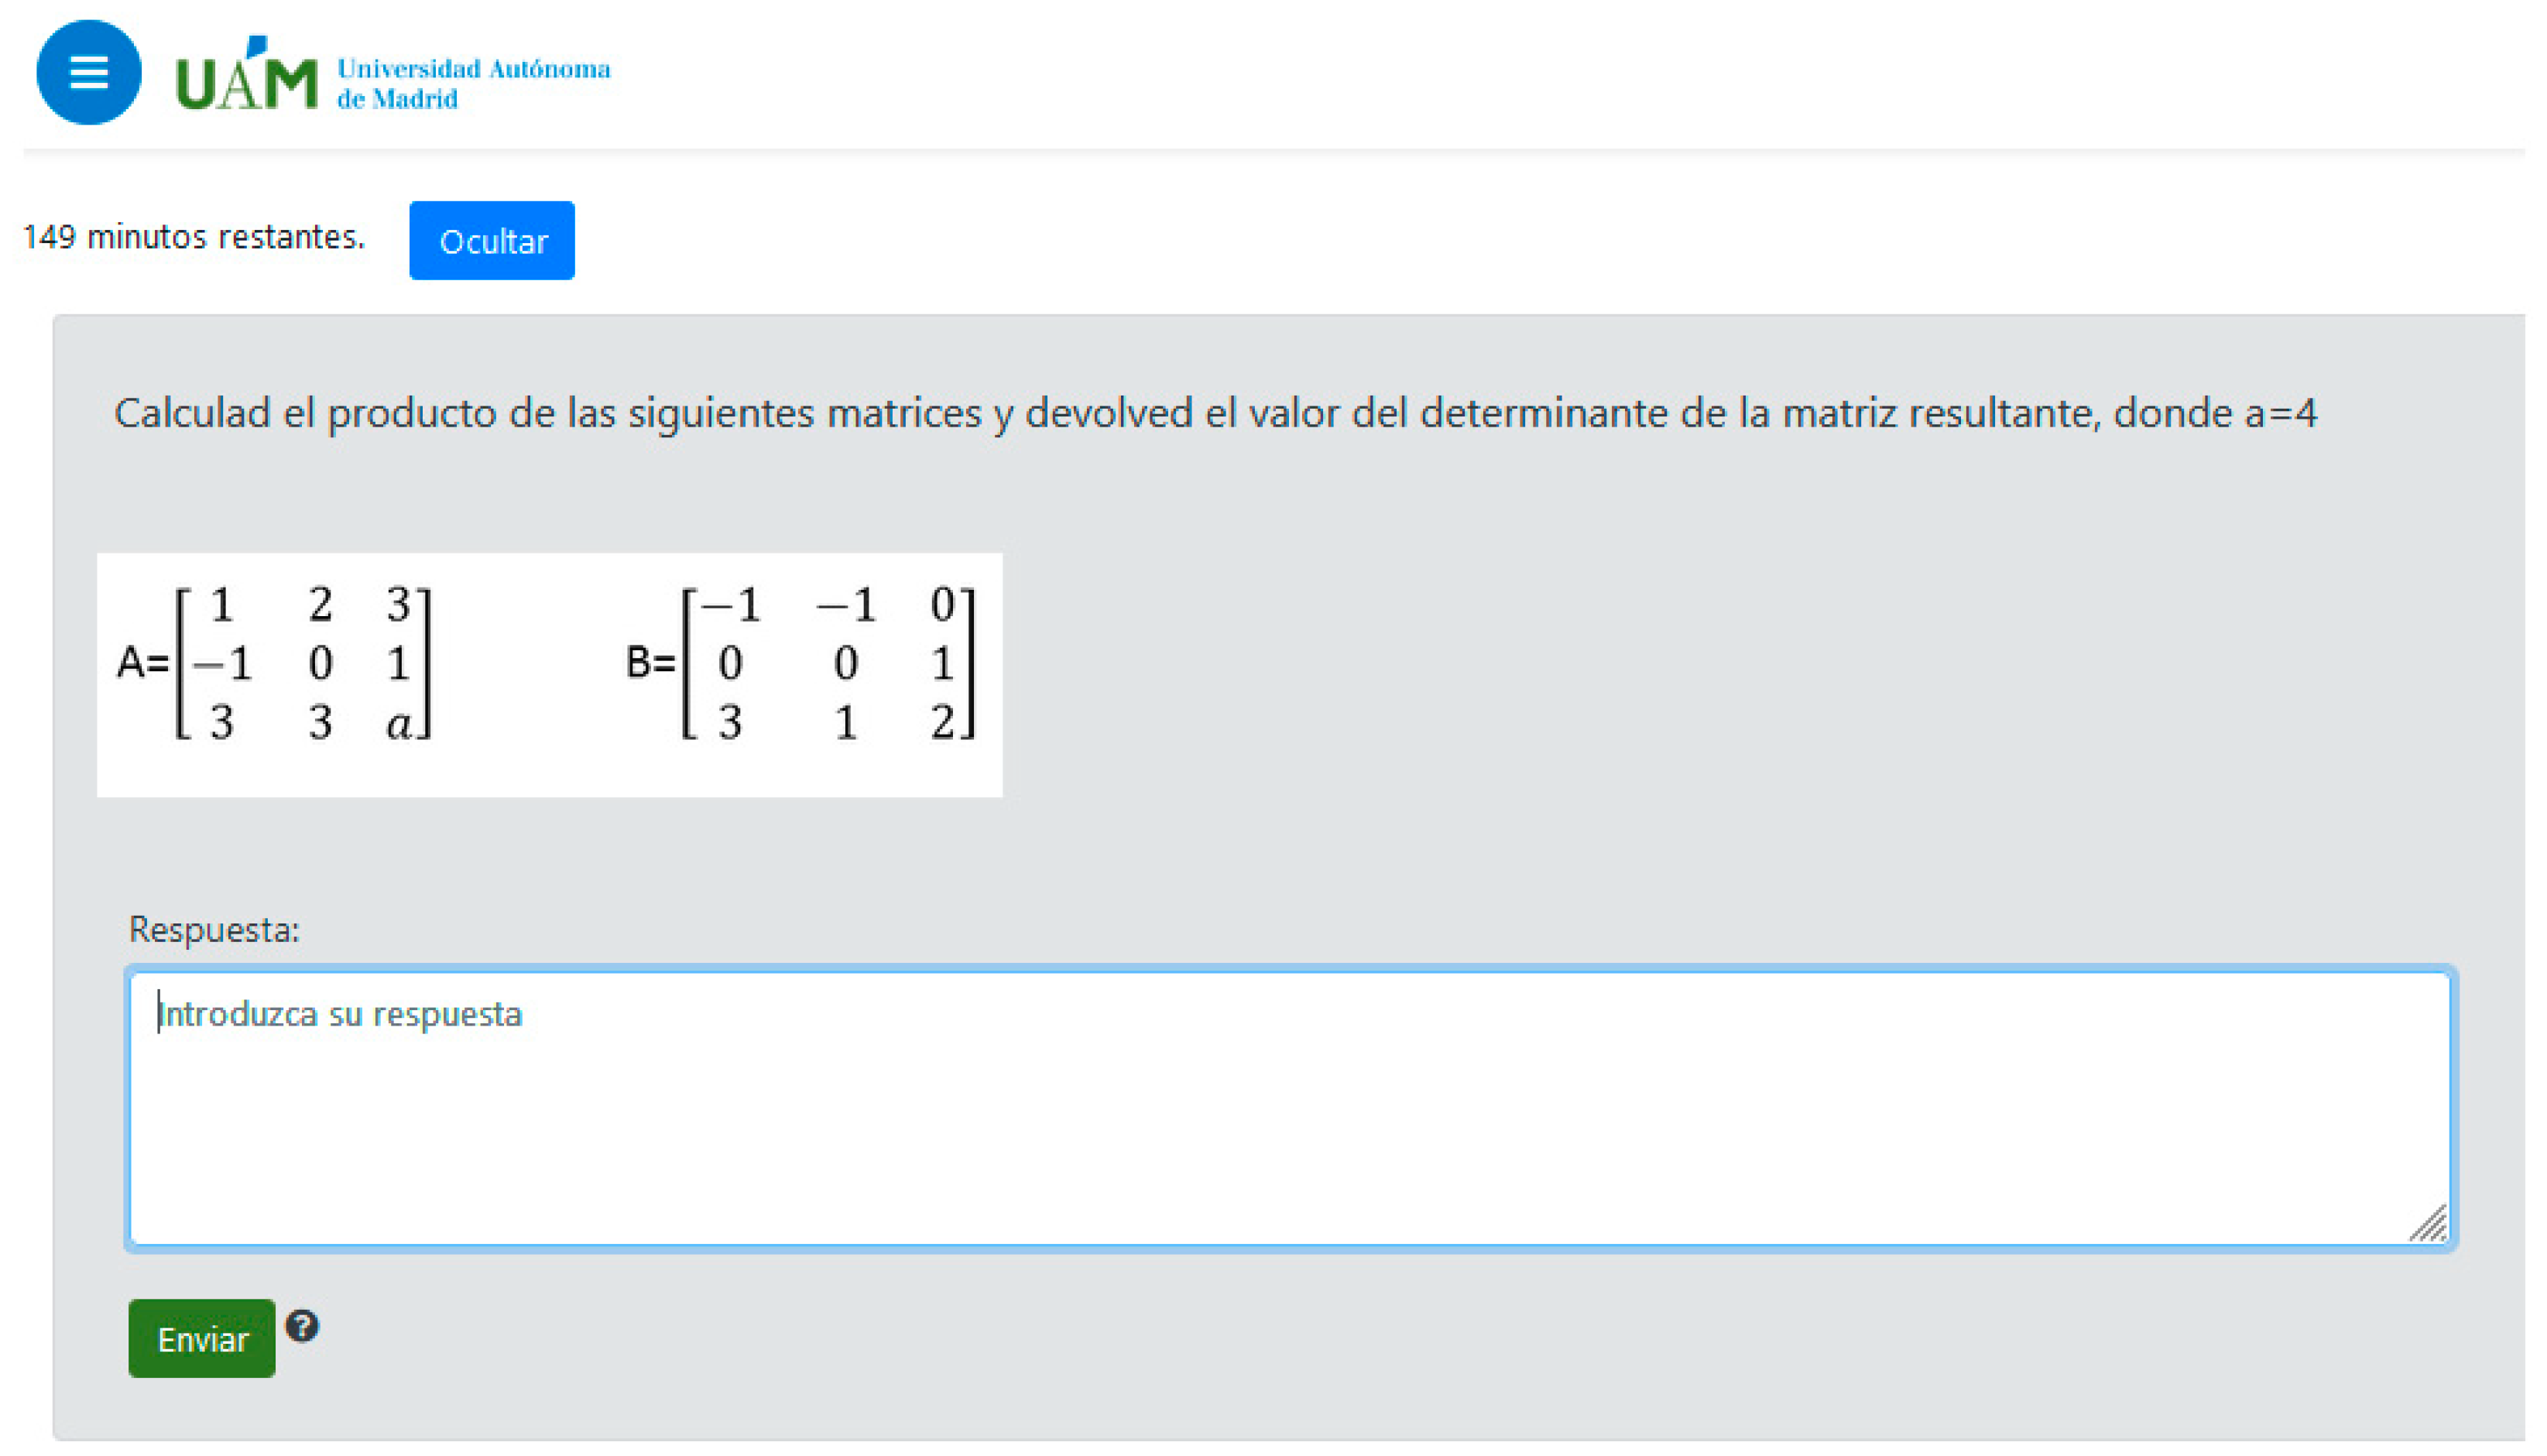
Figure 2.
e-valUAM interface for students, showing one question from a self-evaluating test in the subject Applied Computing. The question in English would read “Calculate the product of the following matrices and return the value of the determinant of the resulting matrix, where a = 4”.
In the case of the students’ interface, we show an example of a question from the subject Applied Computing. As we can see, there is no information about the level of the question, since this is something internal to the algorithm. There is no information or clue about which parameter is changing, since the system already includes the calculated value in the question. In this case, the free parameter is a = 4.
The dataset includes 396 instances of students from the academic courses 2017 to 2021, with a set of 110, 78, 79, 86 and 73 students each year in the first-year subject “Applied Computing” of the Degree in Chemical Engineering at the Universidad Autónoma de Madrid. This course corresponds to 6 ECTS. The total number of students (counting all of them) would be 426. However, some students did not finish their classes. For this reason, we only have 396 useful instances of students. Students’ age is around 18–19 years old. This subject does not require any initial skill since it is a first-year course and starts from very basic programming contents.
This dataset includes information from 7490 self-evaluation tests done by the students through the adaptive test platform [29]. These tests, done in their autonomous learning stage, can be done anytime between the beginning of the course and the final exam. Actually, a significant percentage of tests are performed the day before the final exam or even on the same day. Information extracted from the application includes the date and hour when every single test is performed.
In this part, our goal is to check how continuous working is related to students’ performance, extending the analysis to students from five academic years in a subject that did not change its methodology and contents in all that period (i.e., this subject had the same contents, teachers, teaching methods, exams and online material in the whole five academic courses). The only exception is that, due to the COVID-19 confinement, we have data from three scenarios that only change face-to-face or distant learning.
- (1)
- Pre-COVID-19. Both teaching and assessment were done face-to-face. This happened in academic years 2016/2017, 2017/2018 and 2018/2019;
- (2)
- COVID-19 confinement. Academic year 2019/2020;
- (3)
- Post-COVID-19 confinement. In academic year 2020/2021, students were not confined at their homes, so some restrictions could be softened. In the case of our subjects, teaching was online but final exams were face-to-face.
In all of these academic years, students were able to use the online platform for autonomous study and final exams. The same questions have been used in Applied Computing tests, since their contents are related to numerical problems. In this case, open answer questions were developed with at least one free parameter that changes with each execution of the application. This kind of question requires the following elements:
- A statement with an explicit indication of the modifiable parameter(s);
- Minimum and maximum values of each parameter;
- A programming code (Matlab in e-valUAM) that calculates the answer of the problem as a function of the values of the parameters
It is also possible to include multimedia files. However, multimedia options are only available for the statement, as the answers can be numerical only.
In order to find a way to predict students’ low performance and correct it, we have structured the dataset in seven attributes related to time, with the last one being the predicted class (final score in the final exam). We have done this selection because, in this way, we can decide if we use data until the date of the final exam or exclude data for the last month (or even two months).
The 7 attributes used in this study are described in Table 1. In this table, we can find the description of the attribute, the mean value, standard deviation, and the distribution of data in quartiles. As we can see, by using these attributes, we have divided the information extracted from the students in three months, counting backwards from the final exact date. It is also shown that there are six numerical attributes and one categorical attribute, which is the predicted class. One of the main goals of this study is to evaluate the effectiveness of a classification system using these data, focusing on the possibility of an estimation of failure that can be used to improve the performance of those students who need it the most. Obviously, this will be only effective if the classification can be performed with enough time before the final exam to give teachers the opportunity to apply additional reinforcement. For that reason, all the classifications shown in the following sections will be separated into two options: using the full dataset and excluding data from the last month. In this case, teachers would have the results one month before the final exam, with enough time to react.

Table 1.
Exploratory data analysis of the dataset. In the 1st quartile, 25% of the data is below this point. In the 2nd quartile, 50% of the data lies below this point, and in the 3rd quartile, 75% of the data lies below this point.
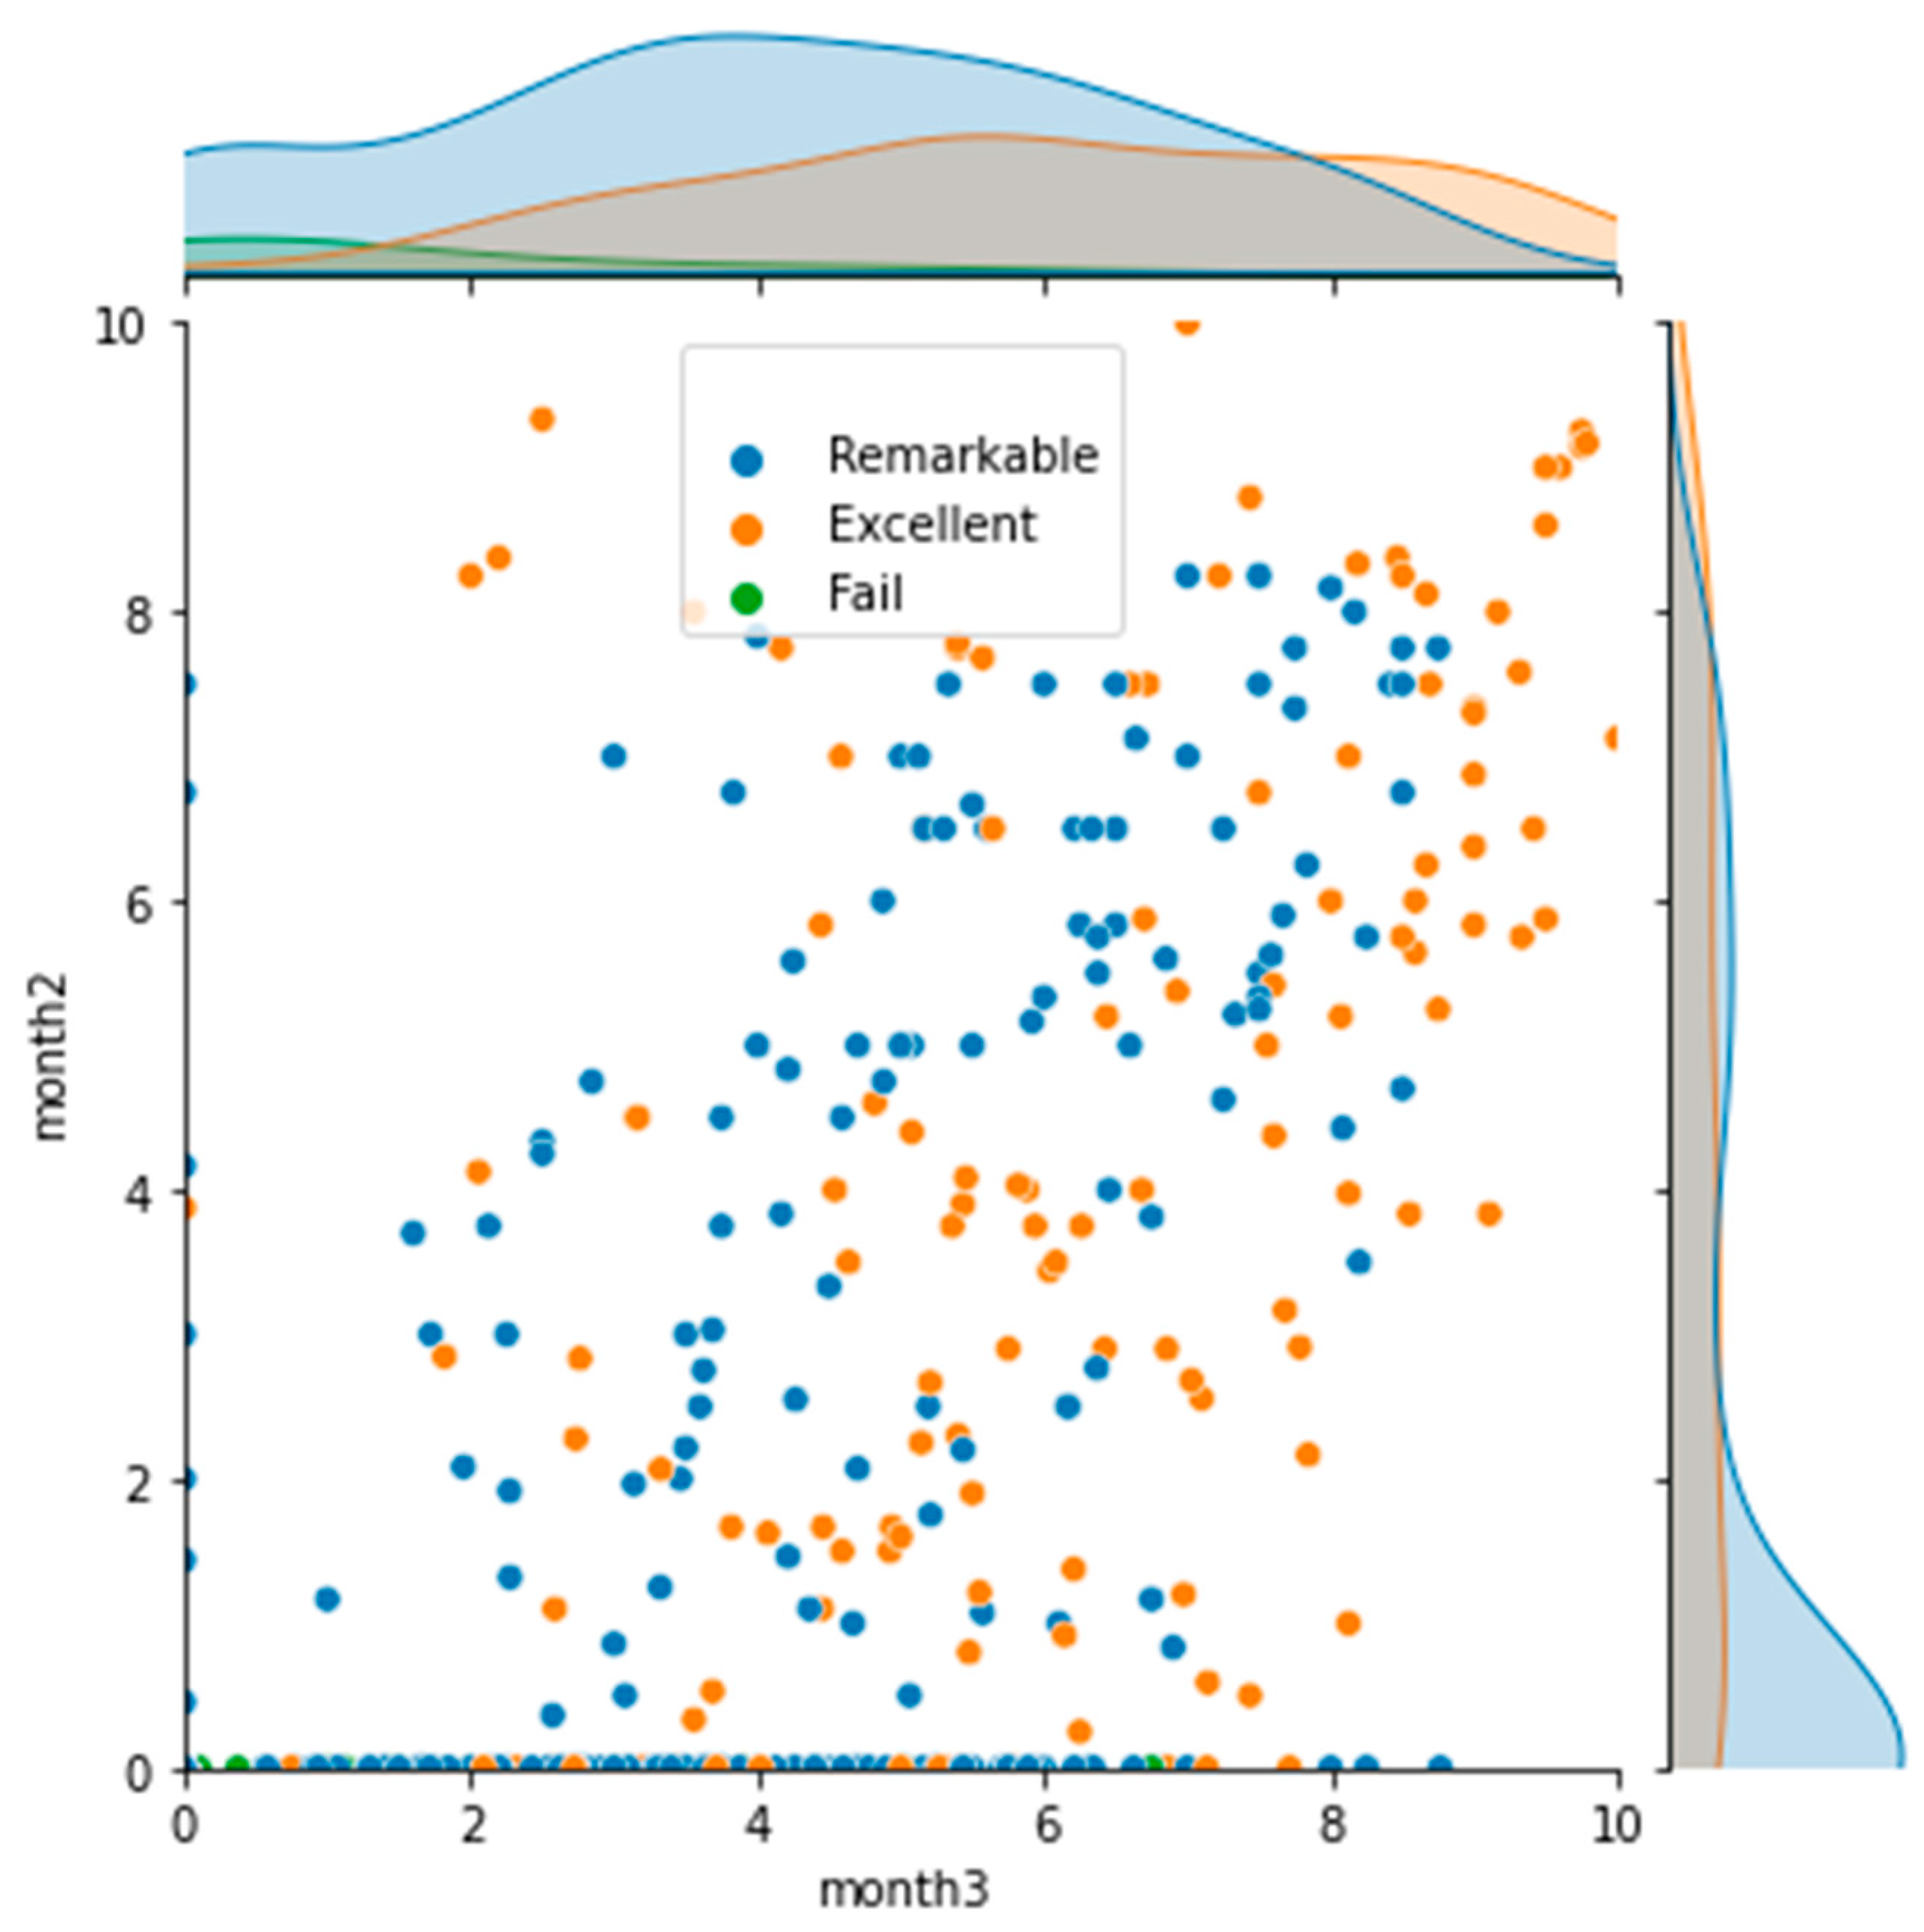
The possibility of using only two classes (Fail and Pass, for example) was also considered. However, by doing so, we could not detect Excellent students (who are sometimes very well-identified, as shown in Figure 3). A correct classification of this group is also interesting, since it can lead to the identification of good habits. For this reason, we have decided to work on three classes in all the simulations.

Figure 3.
Scatter plot of students. The two numeric attributes of month3 and month2 are represented, together with the categorical final score (grade).
For the classification problems, we have used, in general, 30% of the remains for the validating set and 70% for the training set. We have used different strategies in the selection of data, since we want to get information related to the influence of COVID-19 confinement and also study the possibility of detecting students at risk with enough time to help them. First LazyClassifier (https://lazypredict.readthedocs.io/en/latest/usage.html#classification, accessed on 22 October 2021) has been applied, and then a pipeline with a standard scaler and SMOTE (Synthetic Minority Over-sampling Technique in https://imbalanced-learn.org/stable/references/generated/imblearn.over_sampling.SMOTE.html, accessed on 22 October 2021) was applied together with a 10-fold cross-validation. The parameter that was desired to be maximized was accuracy. If the best algorithm in the LazyClassifier was the RandomForest, their parameters in the GridSearch were:
- Random Forest with parameters:
classifier n_estimators (number of trees in the forest): [100,500,700]
classifier max_features (number of features to consider when looking for the best split): [’auto’, ’sqrt’, ’log2′]
classifier class_weight (weights associated with classes; if not given, all classes are supposed to have weight one; the balanced mode uses the values to automatically adjust weights inversely proportional to class frequencies in the input data): [’balanced’,None]
The other unmentioned hyperparameters are considered as the default ones in the scikit-learn library. More information about the algorithms can be found in the literature [30]. These algorithms have been implemented using the Python library scikit-learn.
4. Results
4.1. Previous Analysis
Regarding the six attributes related to the students’ scores and number of attempts in the application, we must be sure that all of them include useful and independent information. For that reason, we have calculated all the correlations between the attributes, as shown in Figure 4. As we can see, there are many attributes with a very low correlation, and only in 2 cases can we find absolute values over 0.5. These correlations correspond to month2 vs. month3 (0.57) and month2 vs. month1 (0.77). Since the maximum value obtained is 0.77, which is not high enough to assume a strong correlation, we have included all the attributes in the simulations.
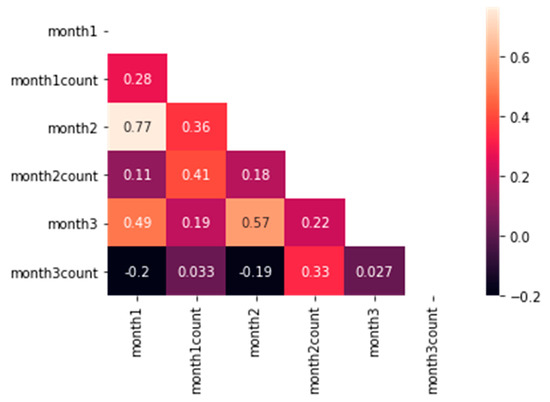
Figure 4.
Correlation heatmap. Correlation of attributes of the study.
To start the classification process, we must define the three classes and understand their significance. As we have shown in Table 1, we have defined Excellent as the students with a final score of [9,10], Remarkable as the students with a final score of (5.5–9) and Fail as the students with a final score equal or below 5.5. We have increased the standard value of failure to 5.5 in order to have a small margin of error in the classification process. Actually, as we will show later, we have increased this value even more in some simulations in order to increase the chances of catching all the students who are having troubles in their learning process.
In Figure 3, we show a scatter plot of the students in these three categories, focusing on month2 and month3 attributes. We can see that all students who failed had a very low score (close to 0) in month2, and they are mainly located in the low values of month3, although in this case the distribution is very diffuse. This fact implies that these students, in general, work harder at the very last moment, having very poor results even a month before the final exam. There are some of them, however, that had apparently good results in the last month and still failed. On the other hand, students who got very good scores in both parameters (top right of the plot) are always excellent. In other words, students who started having good results early on will get very good scores at the end. This fact also implies that these students will be very easy to classify by our algorithms, more so than students who failed. In the middle of the plot there is a huge amount of students that are mixed in the categories of Excellent and Remarkable. For this reason, using non-linear classification algorithms is perfectly justified.
4.2. Classification Using Data from Previous Years
The main objective of this article is to develop a method in distance learning to predict which students are at risk of failure and give teachers the opportunity of applying additional teaching methodologies to improve their chances of success. Obviously, teachers need some time for applying these techniques. For that reason, we have considered two scenarios. The first one includes classification problems with all data and the second one removes all information of the last month in the simulations (i.e., it does not use month3 and month3count).
One the other hand, we must also take into account the fact that COVID-19 confinement changed the teaching methodology and the learning method due to the replacement of face-to-face activities with distance activities. In other words, we must expect some changes in the data set in the years 2020 and 2021 (especially in 2020 where the methodology changed more dramatically).
To evaluate the influence of the COVID-19 pandemic, we have made a first study where we have used data from years 2017 and 2018 for training. Tests have been performed in years 2019 (prior to the pandemic), 2020 (when the COVID-19 pandemic hit) and 2021 (post-COVID-19).
In Figure 5, we show the accuracy of all the classifications. As we can expect, the best results are obtained when classifying 2019 with all the data (0.74). Since it includes less information, all the results that do not include the last month (0.63 in 2019, 0.47 in 2020 and 0.49 in 2021) are worse than those that include the whole dataset (0.74 in 2019, 0.61 in 2020 and 0.68 in 2021). It is worth noting that classification with all data in 2020 is even worse than classification without the last month in 2019. In the following section we will extensively discuss the reasons why these unusual results happen.
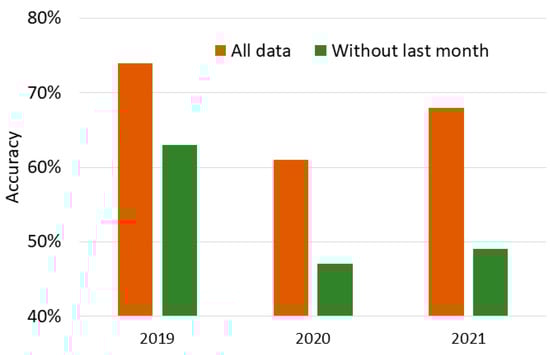
Figure 5.
Accuracy in the classification of students’ performance for years 2019 to 2021 using a dataset that includes information from students in 2017 and 2018.
In general, we can see that the worst result happens in 2020 and the best result occurs in 2019.
4.3. Classification including Data from All Academic Courses
Assuming that something changed in 2020 and 2021, it is reasonable to think that changing the training set by including data from all the courses will increase accuracy for those years. There are, however, some problems when using this strategy. First, we are losing the opportunity of predicting students’ performance with previous data. Another problem is that we may lose accuracy in 2019, since we are changing the whole training set.
Another option would be training the algorithms with data from all three scenarios separately and trying to predict students’ performance only with algorithms trained with data from the same scenario. The problem here is that this strategy treats each scenario separately and avoids the option of generalizing. Moreover, it is not easy to identify in future academic years which model would be better to use. For these reasons, we have avoided this strategy and have focused on the generalization explained in the previous paragraph.
As in the previous section, we performed this classification by using both all the data available and removing data from the last month in order to find a way to give some time to teachers for detecting students at risk of failure.
In the case of using all data, we found that RandomForest is the classifier with higher accuracy with lazy predict. Statistical data obtained from the simulation is shown in Table 2. As we can see, we have obtained results comparable to the prediction of 2019 in Figure 5, with the category with the higher precision being Excellent and the category with worse precision being Fail. This is also in agreement with the information extracted from Figure 2, where we could see a region of Excellent students clearly placed in the region of high scores both in month2 and month3. On the other hand, we could see also that Fail students are completely mixed in month3, which makes their classification a more difficult task.
Table 2.
Statistical data of the simulation, taking into account information from the whole semester.
We have also analyzed the weight of importance of each variable, obtaining the following:
- month1: 0.08483153402588516;
- month1count: 0.12197664175455633;
- month2: 0.14907869843738905;
- month2count: 0.21073154819260959;
- month3: 0.1779015601504041;
- month3count: 0.2554800174391559.
We can see that the information extracted from the last month (month3 and month3count) is more than 40%. We can expect an important decrease in accuracy when removing this information from the simulation.
In the case of predicting without the data of the last month, we have found that BernoulliNB is the classifier with higher accuracy with lazy predict. Statistical parameters can be found in Table 3.
Table 3.
Statistical data of the simulation, excluding data from the last month of the semester.
As we can see, the accuracy decreases to 0.41, with the Fail category being the worst one with regards to precision. Obviously, we need to focus on increasing the accuracy of Fail in order to be able to give teachers the opportunity of detecting with enough time the students who are at risk of failure. For this reason, we have performed different simulations where we have changed the limit of the category Fail, but only in the training phase. In other words, we have kept the same values for validation, but we have changed the limits in training until we have found a limit score that detects all the students who failed in the final exam. This limit is 7.5 (i.e., we need to fit the Fail category to all scores between 0 and 7.5 in training if we want to detect all the students who failed). The problem of using these values is that a great percentage of students were considered at risk of failure without that actually being the case.
In Figure 6, we show the percentage of cases obtained by the classification algorithms when using two different criteria in the training set. First (Fail ≤ 5.5), we have used the same criteria in training and in the test, assuming the Fail category encompassed all students with scores between 0 and 5.5. In the second simulation, Fail ≤ 7.5, we have increased the Fail category in training to include all students with scores between 0 and 7.5. The detected category means students who failed and were correctly detected. The not detected category means students who failed but were not detected by the system. In this simulation, we are still using three categories: Fail, Remarkable and Excellent. However, in the figure, we are focusing on Fail for clarity. False positive means students who were classified as Fail but obtained a good score in their final exam. We have also analyzed different scenarios with intermediate scores, but results did not differ substantially from the Fail ≤ 5.5 criteria. In this case, the classification algorithms are only able to find 50% of students who failed. The positive aspect of this criteria is that we only detected a 6% rate of false positives. Since teachers should work manually with these students, having a low number of students in this category is the objective.
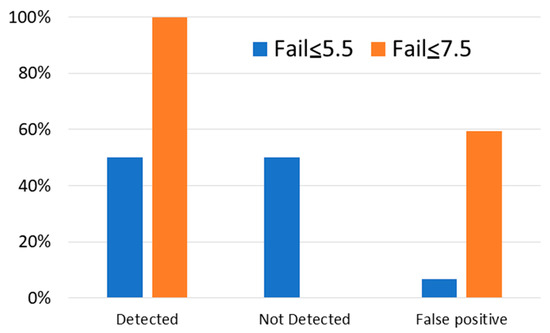
Figure 6.
Classification task focusing on the detection of students at risk of failure, excluding data from the last month.
When we increase the Fail scores to 7.5, we finally detect all the Fail cases. However, we pay the price of assuming almost 60% of students who pass the exam actually fall into this category. Obviously, this number of false positives strongly increases teachers’ efforts and also may be disrupting for students that do not need any additional attention.
In the case of Excellent students, the classification system detects 100% of them in the Fail ≤ 7.5 criteria. This agrees with the results shown in Figure 2, where we could see a region in the Figure where only Excellent students appeared. The confusion here is mainly due to the categories Remarkable and Fail.
5. Discussion
The influence of the COVID-19 pandemic has induced a huge change in students’ habits when studying at home [31]. Due to the pandemic, they have been forced to change from a face-to-face format to a distant learning scenario. This dramatic change happened mainly in the first semester of 2020, which is when the subject under study is mainly performed. For that reason, data related to students who attended that year are very different when comparing to students from previous years. In 2021, the format became more similar to the one applied in previous years. It is reasonable to say that, in this case, data collected from students is expected to be similar to data from the years 2017 to 2019.
As we have seen in previous sections, when using data from 2017 and 2018 for training, predictions of students’ performance in 2019 is better than the prediction of 2020 and 2021. Moreover, the prediction of 2021 is better than 2020. This is in agreement with the differences in students’ learning strategies due to the pandemic, since the most dramatic changes occurred in 2020. This argument is also supported by the fact that we do not find differences in the prediction of 2020 compared to 2019 and 2021 when using a training data set that includes a percentage of instances from all academic years. This is a very important fact, since we have been able to find a methodology that is able to predict students’ performance in very different learning scenarios, such as distant learning or face-to-face lessons. In other words, by including a data set with information from all academic years (before and after pandemic), we have obtained a classification method that improves the prediction of students’ performance during the pandemic without reducing effectiveness in the years before.
On the other hand, we have found that it is not easy to estimate which students are in needed of special assistance with enough time to be effective. Our results indicate that the method is able to catch around 50% of students that failed in the final exam a month before the exam itself. However, we could not find any parameter combination in the classification problem that increases the percentage without assuming a huge number of wrong classifications. A small number of mistakes would imply that the teachers should increase their assistance in a small number of students who do not need it, which is acceptable. However, it is not acceptable if the number of students attended by the teacher strongly increases. On the other side, Excellent students are correctly classified in almost all simulations.
The problem with the predictions conducted a month before is that a huge percentage of data comes from the last month. Students tend to increase their activity as the final exam approaches, and these data are erased from the prediction. Since the success ratio of classification problems strongly increases with the quality and amount of data, the use of additional techniques such as gamification in order to motivate students in the habit of continuous work is critical for improving the methodology proposed in this article. This conclusion is supported both by the decrease in accuracy seen when we remove data from the last month and also by the ability of the classification methods to find Excellent students. In this case, we have seen that these students obtained good scores in their self-regulated learning even two months before the final exam. This supports the well-established assumption that says that a continuous working strategy is a very good strategy in autonomous learning.
6. Conclusions
We have developed a methodology to classify students as a function of their academic success. Our method is supported by a strategy of allowing students to train from the very beginning of the semester in an online platform that is highly motivating due to its nearness with the format of the final exam. This fact motivates students to work often with the platform and allowed us to get more than 3000 activities in 5 academic years. This huge amount of data allowed us to perform classification tasks with the objective of detecting students at risk of failure.
Our results showed that students who failed have very different behaviors, and it is very hard to detect all of them. However, it is much easier to detect students that will have a very good result. From the profile of these students, we could define the most adequate strategies for an effective learning process. In the case of the subject under study, we have found that good scores must be obtained at least one month before the final exam. This result, however, could be very specific to this subject and the analysis must be performed individually for different subjects.
Future work can be proposed to include the application of the present methodology to different subjects in order to find common patterns in students’ behavior in distance learning and describe the best strategies with the support of quantitative data analyses. In the future, it will also be interesting to test these methods in environments where students do not have easy access to schools and compare their results with results which come from students that are able to attend school and, still, use distant learning tools as additional resources.
Author Contributions
Conceptualization, L.S., S.A., S.F. and G.-M.S.; Data curation, L.S. and G.-M.S.; Funding acquisition, S.F. and G.-M.S.; Investigation, L.S., S.A. and G.-M.S.; Methodology, L.S., S.A., and G.-M.S.; Project administration, S.F. and G.-M.S.; Software, L.S.; Supervision, S.F. and G.-M.S.; Writing—original draft, L.S., S.A. and G.-M.S.; Writing—review & editing, L.S., S.A., S.F. and G.-M.S. All authors have read and agreed to the published version of the manuscript.
Funding
This study has been partially funded by ACCIÓ, Spain (Pla d’Actuació de Centres Tecnològics 2021) under the project TutorIA. This study was also funded by the Fondo Supera COVID-19 (Project: Development of tools for the assessment in higher education in the COVID-19 confinement).
Institutional Review Board Statement
Not applicable.
Informed Consent Statement
Informed consent was obtained from all subjects involved in the study.
Data Availability Statement
The data presented in this study are available on request from the corresponding author.
Conflicts of Interest
The authors declare no conflict of interest.
References
- UNITED NATIONS. 17 Goals to Transform Our World. Available online: https://www.un.org/sustainabledevelopment/ (accessed on 22 September 2021).
- UNITED NATIONS. Goal 4: Quality Education. Available online: https://www.un.org/sustainabledevelopment/education/ (accessed on 22 September 2021).
- Mitra, S. Hole-in-the-Wall. Available online: http://www.hole-in-the-wall.com/Beginnings.html (accessed on 22 September 2021).
- Giroux, H.A. Democracia, Educación Superior y el espectro del Autoritarismo. Entramados. Educ. Y Soc. 2015, 2, 15–27. [Google Scholar]
- Morin, E. Los Siete Saberes Necesarios para la Educación del Futuro, 1st ed.; 6th reimp. Original Title: Les Septs Savoir Nécessaires À Léducation du Futur. Publicado por la UNESCO en 1999 ed.; Ediciones Nueva Visión: Buenos Aires, Argentina, 2011; p. 122. [Google Scholar]
- Tonucci, F. Enseñar o Aprender; Editorial Losada S.A.: Buenos Aires, Argentina, 1996. [Google Scholar]
- Semushina, E.Y.; Ziyatdinova, J.N. On-line Testing of Engineering Students as a Form of Assessment when Studying English in Distant Form. In Teaching and Learning in a Digital World; Springer: Berlin/Heidelberg, Germany, 2018; Volume 716, pp. 475–480. [Google Scholar]
- Domínguez, C.; Jaime, A.; Sánchez, A.; Blanco, J.M.; Heras, J. A comparative analysis of the consistency and difference among online self-, peer-, external- and instructor-assessments: The competitive effect. Comput. Hum. Behav. 2016, 60, 112–120. [Google Scholar] [CrossRef]
- Subirats, L.; Fort, S.; de Haro, N.; Sacha, G.M. Data Analysis for the prediction and correction of students’ wrong learning strategies. In Proceedings of the Seventh International Conference on Technological Ecosystems for Enhancing Multiculturality, León, España, 16 October 2019; pp. 260–264. [Google Scholar]
- Haro-García, N.D.; Comas-López, M.; Hincz, K.P.; Mazalu, M.; Sacha, G.M. Soft Skills assessment in Art and Globalization. In Proceedings of the Sixth International Conference on Technological Ecosystems for Enhancing Multiculturality, Salamanca, España, 24 October 2018; pp. 199–204. [Google Scholar]
- Hellas, A.; Ihantola, P.; Petersen, A.; Ajanovski, V.V.; Gutica, M.; Hynninen, T.; Knutas, A.; Leinonen, J.; Messom, C.; Liao, S.N. Predecir El Rendimiento Académico: Una Revisión Sistemática de la Literature; Association for Computing Machinery: New York, NY, USA, 2018; pp. 175–199. [Google Scholar]
- Berka, P.; Marek, L. Bachelor’s degree student dropouts: Who tend to stay and who tend to leave? Stud. Educ. Eval. 2021, 70, 100999. [Google Scholar] [CrossRef]
- Tsiakmaki, M.; Kostopoulos, G.; Koutsonikos, G.; Pierrakeas, C.; Kotsiantis, S.; Ragos, O. Predicting University Students’ Grades Based on Previous Academic Achievements. In Proceedings of the 2018 9th International Conference on Information, Intelligence, Systems and Applications (IISA), Zante, Grecia, 23 July 2018. [Google Scholar]
- Karlos, S.; Kostopoulos, G.; Kotsiantis, S. Predicting and Interpreting Students’ Grades in Distance Higher Education through a Semi-Regression Method. Appl. Sci. 2020, 10, 8413. [Google Scholar] [CrossRef]
- Sravani, B.; Bala, M.M. Prediction of Student Performance Using Linear Regression. In Proceedings of the 2020 International Conference for Emerging Technology (INCET), Belgaum, India, 5 June 2020. [Google Scholar]
- Márquez-Vera, C.; Cano, A.; Romero, C.; Noaman, A.Y.M.; Fardoun, H.M.; Ventura, S. Early dropout prediction using data mining: A case study with high school students. Expert Syst. 2016, 33, 107–124. [Google Scholar] [CrossRef]
- Asif, R.; Hina, S.; Haque, S.I. Predicting Student Academic Performance using Data Mining Methods. Int. J. Comput. Sci. Netw. Secur. 2017, 17, 187–191. [Google Scholar]
- Pérez-Villalobos, C.; Ventura-Ventura, J.; Spormann-Romeri, C.; Melipillán, R.; Jara-Reyes, C.; Paredes-Villarroel, X.; Rojas-Pino, M.; Baquedano-Rodríguez, M.; Castillo-Rabanal, I.; Parra-Ponce, P.; et al. Satisfaction with remote teaching during the first semester of the COVID-19 crisis: Psychometric properties of a scale for health students. PLoS ONE 2021, 16, e0250739. [Google Scholar] [CrossRef] [PubMed]
- Ho, I.M.K.; Cheong, K.Y.; Weldon, A. Predicting student satisfaction of emergency remote learning in higher education during COVID-19 using machine learning techniques. PLoS ONE 2021, 16, e0249423. [Google Scholar] [CrossRef] [PubMed]
- Rutgers, School of Arts and Sciences. Thomas A, Edison Papers. Available online: http://edison.rutgers.edu/connect.htm (accessed on 23 September 2021).
- Christodoulou, D. Teachers vs Tech?: The Case for an Ed Tech Revolution; Oxford University Press: Oxford, UK, 2020. [Google Scholar]
- UNESCO. Convención Internacional de los Derechos del Niño’; Unicef Comité Español: Madrid, Spain, 2006. [Google Scholar]
- de la Serna, M.C.; Accino, J.A.; Rivas, M.R. Formative evaluation tools within European Space of Higher Education (ESHE): E-portfolio and e-rubric. In Proceedings of the Project R+D+i eRubrics on the Evaluation of Practicum Competences 2014–2017, Málaga, Spain, June 2007. [Google Scholar]
- Mitra, A.; Hullett, C. Toward Evaluating Computer Aided Instruction: Attitudes, Demographics, Context; Elsevier: Amsterdam, The Netherlands, 1997; Volume 20, pp. 379–391. [Google Scholar]
- United Nations Educational, Scientific and Cultural Organization (UNESCO). Quick Guide to Education Indicators for SDG 4; UNESCO Institute for Statistics: Montreal, QC, Canada, 2018; p. 14. [Google Scholar]
- Molins-Ruano, P.; González-Sacristán, C.; Díez, F.; Rodríguez, P.; Moñivas, S.G. An adaptive model for computer-assisted assessment in programming skills. Int. J. Eng. Educ. 2015, 31, 764–770. [Google Scholar]
- Molins-Ruano, P.; Jurado, F.; Rodríguez, P.; Cerezo, S.A.; Moñivas, S.G. Influence of the students’ learning strategy on the evaluation scores. In Proceedings of the 3rd International Conference on Technological Ecosystems for Enhancing Multiculturality, Porto, Portugal, 7 October 2015. [Google Scholar]
- Molins-Ruano, P.; Rodríguez, P.; Cerezo, S.A.; Moñivas, S.G. Modelling experts’ behavior with e-valUAM to measure computer science skills. Comput. Hum. Behav. 2016, 61, 378–385. [Google Scholar] [CrossRef]
- Available online: www.evaluam.eu (accessed on 22 October 2021).
- Cady, F. The Data Science Handbook; John Wiley & Sons, Inc.: Hoboken, NJ, USA, 2017. [Google Scholar]
- Gonzalez, T.; De La Rubia, M.A.; Hincz, K.P.; Comas-Lopez, M.; Subirats, L.; Fort, S.; Sacha, G.M. Influence of COVID-19 confinement on students’ performance in higher education. PLoS ONE 2020, 15, e0239490. [Google Scholar] [CrossRef] [PubMed]


Publisher’s Note: MDPI stays neutral with regard to jurisdictional claims in published maps and institutional affiliations. |
© 2021 by the authors. Licensee MDPI, Basel, Switzerland. This article is an open access article distributed under the terms and conditions of the Creative Commons Attribution (CC BY) license (https://creativecommons.org/licenses/by/4.0/).