Abstract
The ultimate strength of composite columns is a significant factor for engineers and, therefore, finding a trustworthy and quick method to predict it with a good accuracy is very important. In the previous studies, the gene expression programming (GEP), as a new methodology, was trained and tested for a number of concrete-filled steel tube (CFST) samples and a GEP-based equation was proposed to estimate the ultimate bearing capacity of the CFST columns. In this study, however, the equation is considered to be validated for its results, and to ensure it is clearly capable of predicting the ultimate bearing capacity of the columns with high-strength concrete. Therefore, 32 samples with high-strength concrete were considered and they were modelled using the finite element method (FEM). The ultimate bearing capacity was obtained by FEM, and was compared with the results achieved from the GEP equation, and both were compared to the respective experimental results. It was evident from the results that the majority of values obtained from GEP were closer to the real experimental data than those obtained from FEM. This demonstrates the accuracy of the predictive equation obtained from GEP for these types of CFST column.
1. Introduction
Analysis of previous experimental tests reveals that there are some key parameters impacting both performance and strength of concrete-filled steel tube (CFST) columns which are length to diameter ratio, wall thickness, and the interaction between steel tube and concrete [1,2,3]. In recent years, applying artificial intelligence (AI) techniques such as artificial neural network (ANN), genetic programming (GP), and gene expression programming (GEP) to predict and optimize engineering problems, has become very popular. Usually, this is because the AI approaches are faster and with less complexity in comparison with the finite element analysis (FEA). The external and local imperfections, boundary conditions, and residual stresses could be perfectly simulated by FEA. It provides load-deflection curves and determines the strain and stress at each stage; however, the accuracy of prediction by FE models is highly impacted by input elements, some of which cannot be modelled thoroughly [4]. Artificial intelligence (AI) techniques and particularly the gene expression programming (GEP) trump the FEA methods in terms of ease and speed of analysis, and better accuracy in predictions and optimizations specifically in obtaining the ultimate bearing capacity of CFST columns [5,6,7].
In CFST columns, concrete provides a radial lateral pressure to the steel tube. Besides, the steel tube supports concrete from spalling by means of confinement. In addition, the concrete core avoids inward buckling of the steel. Therefore, ductility and strength of these columns are usually high. Furthermore, the confinement of concrete in circular columns is more efficient compared to other types of sections which results in a better interaction and less slip between steel tube and concrete. It is consequently can lead to a higher axial strength and a better structural integrity [8,9].
There is a few research which focused on the analysis of the CFST composite columns using artificial intelligence (AI) techniques. In the previous study [10] an extensive data collection was performed and they were analyzed by GEP. A valuable equation was generated to estimate the ultimate strength of the CFST columns and it was optimized afterwards [1]. Most studies in civil engineering are based on experimental work and numerical analysis using the finite element method (FEM). Normally, using an equation-based analysis is less time consuming and less costly than the laboratory tests and computational modelling and analysis. Therefore, this study tried to ensure that the proposed GEP-based equation could be reliable to be used in prediction of the bearing capacity of CFST composite columns. Furthermore, in order to show fidelity of the results from the GEP equation, in addition to comparison of them with the finite element analysis (FEA), the outcomes were also compared with the experimental ones in the literature.
In previous research [1,10], 303 samples of CFST columns were collected from literature and they were trained and tested using GEP. The assessment was performed five times and each time led to an equation. The equations were classified based on the coefficient of determination (R2) and the one with the closest R square to 1 was picked up for the further analysis. Then the GEP prediction equation has been optimized using AI optimization techniques. In this research, however, 32 different samples of those were collected in the previous research are considered with high-strength concrete but still within the range of the previous study. They are numerically modelled and analyzed to obtain their ultimate bearing capacity for the comparison purpose
FEM is a tool for numerical analysis which can model different types of composite columns. It could be a useful method in many of such cases specifically in the prediction of ultimate bearing capacity. However, after applying AI techniques for the composite columns [11,12,13,14], these novel methods were presented more promising results compared with the results of the FEA. Recently, AI techniques such as ANN and GEP are widely being used in the civil engineering to predict and optimize various criteria in this regard [15,16,17,18,19,20,21]. Following this, conventional mechanical calculations and also numerical analysis can be optimized by these intelligent methods following trends observed from recent reports [22,23,24,25,26,27,28,29,30,31,32,33,34,35,36,37]. Nevertheless, there is lack of research in the prediction of load bearing capacity or the compressive strength of composite columns specifically CFST columns with the AI approaches.
2. A Brief Background of Gene Expression Programming (GEP) and Finite Element Analysis (FEA)
Recently, GEP has gained recognition among civil engineers. In fact, it has shown a good capability in prediction of some engineering problems with an acceptable accuracy [38]. Table 1 indicates a list of recent studies using AI approaches together with the numbers of samples and the analyzed parameters. In solving structural engineering problems, AI has become quite popular recently, specifically in prediction of the ultimate bearing capacity of composite columns [39,40,41].

Table 1.
Review studies for application of artificial intelligence (AI) for the composite columns.
GEP benefits from two main chromosomes, and the expression tree (ET) provides solutions for removing the limitations of two older algorithms. The codifications are shown in the form of a string in GEP, which is in fact obtained from Karva programing language and can present a behavior like ETs. One of the interesting functions of GEP is that it can present its own models using mathematical equations. In fact, mathematical equations create relation between independent parameters. The GEP modeling process begins with the random creation of chromosomes for determined numbers, which follows Karva language (Karva is a symbolic language to introduce chromosomes). These symbolic chromosomes should be then defined as trees with different size and shapes (expression trees). These points are investigated by the functions that are responsible for controlling models and their adaptability. These functions have different types that can be defined by different criteria [10,19,38].
On the other hand, a lot of scholars applied numerical methods to model and assess the mechanical behavior of CFST columns since experimental investigations are costly and time-consuming, and also have some limitations such as materials preparation [4,43,44,45]. In some of these studies, comparisons were made between the results of ultimate bearing capacity achieved from the FEA and the outcome reached by the experimental tests. They indicated a good agreement with the results obtained by FEA methods [46,47]. Nevertheless, it is believed that the GEP equation, generated from the previous study [10], is able to predict the maximum strength of CFST columns with a better accuracy compared to the FEA. Therefore, this study presents a valuable comparison between the methods which can be beneficial for the engineers to calculate the ultimate load bearing capacity faster and more accurately.
3. Prediction of Bearing Capacity of Concrete-Filled Steel Tube (CFST) Columns by Finite Element Analysis (FEA)
3.1. Brief Introduction
The accuracy of prediction from FEA is significantly impacted by input parameters, specifically selection of appropriate concrete model [4]. Moreover, there could be slip between two connected materials with different properties although a fully shear connection has to be assumed and simulated. In order to demonstrate the superior accuracy of predictions based on the GEP equation (Equation (1)) [10], 32 CFST columns were collected from recent literature and numerically modelled using FEA. Figure 1 shows a summary of the process of this modelling. As is evident, first of all, the data were collected for modelling and then, in order to achieve trustworthy results, convergence and mesh studies were performed for each column separately and after that the models were analyzed using ABAQUS [48].
where: d(0) = fC(MPa), d(1) = D (mm), d(2) = L (mm), d(3) = t (mm),d(4) = fy (MPa).
Pexp = (√d0 × (2 × d1) + (d4 × (√d1 − (6.219 − d3))) + [(8.078 × d4) + (0.626 × d2)]/tanh(−2.831)
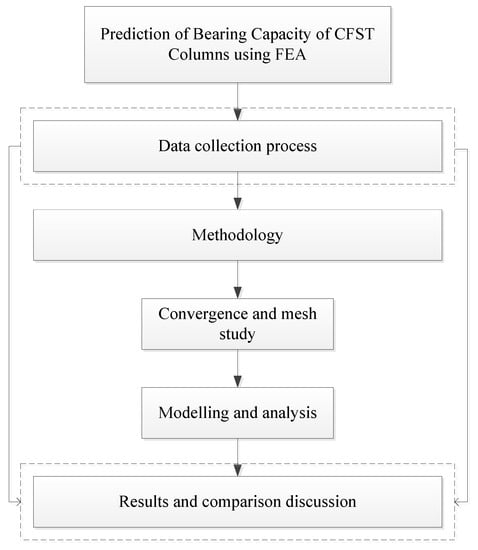
Figure 1.
Diagram of finite element analysis (FEA) of the concrete-filled steel tube (CFST) columns.
Even though tremendous effort was previously made to model concrete-filled steel tubular column using FEA, this methodology may not be helpful in specific cases, particularly while assuming quick development and usage of thin-walled steel tube or the high-strength concrete [4,49,50]. FEA is performed according to the circular CFST (CCFST) specimens from the numbers of studies [51,52,53,54,55,56] which carry different geometries, material properties, boundary and support conditions, and loading functions. However, for the AI investigation, all of them were considered to be in the range of selected parameters. For the ultimate strength of the CFST columns, 1242.2 kN to 9187 kN was considered and, 36.2 MPa to 193.3 MPa was chosen for the concrete compressive strength. For the columns’ length and diameter, 200 mm to 756 mm and 114.3 mm to 219.1 mm were considered respectively. In addition, the range of 2.5 mm to 10 mm was selected for the thickness, and the yield stress of steel tube is considered as 227 MPa to 428 MPa.
3.2. FE Modelling and Analysis
Thirty-two CFST samples from literature [51,52,53,54,55,56,57,58,59,60] were collected and their specifications summarized in Table A1 (Appendix A). As is obvious from Table A1, different parameters such as diameter (D), length (L), thickness (t), length to diameter ratio (L/D), diameter to thickness ratio (D/t), yield stress of the steel tube (fy), and the concrete compressive strength (fc), the modulus of elasticity of concrete (Ec), the modulus of elasticity of the steel tube (Es), and the Poisson’s ratio (υ) were considered. Developing new techniques to analyze, assess, and predict the behaviour of composite columns is usually challenging for the engineers [51,61]. For the modelling purpose in FEA, different types of elements were used; in order to model concrete, a 3D deformable solid element and for the steel tube, the shell element, were applied. Furthermore, for the end plates, a solid element C3D8R was applied. For the plastic behaviour of concrete, concrete damage plasticity model is considered and the specifications are assumed according to the previous similar studies which led to acceptable results in analysis [43,44,45,46,47,56]. For simulation of the boundary conditions of models, the reference point was pinned which means the displacement assumed zero but rotation was free (U1 = U2 = U3 = 0). In addition, for the bottom end plate, it was assumed that there is no movement in x and y direction (U1 = U2 = 0). However, in the z direction the column was free to move upwards or downwards to simulate the loading condition.
In the FE modelling and in order to achieve better simulation of the interaction between the steel tube and the concrete, the gap element was applied to achieve more accurate results. This is an element in ABAQUS software which can be inserted and adjusted for a better simulation of interaction specifically between two different materials. The gap element allows the simulation of slip in the way that it prevents the penetration of one node into the node next to it. The shear stress can be simulated through a friction coefficient assigned to the gap element [58,59]. Therefore, in order to simulate more accurately, the interaction between materials was introduced to the system using the option of “allow separation after contact” and for this purpose, three different contacts were applied; (1) contact between steel tube and concrete with free normal and tangential separation; (2) contact between endplate and concrete, which is considered as normal interaction; and (3) contact between endplate and steel tube, which was applied as the tie connection to act like solid welding. Considering all processing data, boundary conditions, interaction between concrete and steel, and the modelling procedures, the final results were obtained and verified; afterwards they were compared with the artificial intelligence (AI) results generated from Equation (1).
3.3. The Results of FE Simulation
Some of the CFST samples which were modelled by the finite element method (FEM) are indicated in Figure 2a,b. In all of the cases, the column was subjected to axial loading in the center of the column along the Y axis. In this study, different columns with various L/D and D/t were modelled and their ultimate bearing capacity was obtained accordingly. The results were compared to the corresponding experimental results and the outcome is summarized in Table 2. The Pexp shows the experimental load-bearing capacity of the circular CFST columns while the PFE indicates the result of the FE analysis for the ultimate bearing capacity of the column. The last column of Table 2 is a comparison between the experimental results and the finite element results which is reported as an error in percentage. In some cases, such as model Nos. 4, 5, 10–12, 14–18, 20–24, and 32, the bearing capacity predicted by FE was less than the measured experimental value of the bearing capacity. As is evident from Table 2, the ultimate bearing capacity from the experimental tests and those obtained from the numerical analysis are in good agreement and acceptable range with the maximum difference equal to or less than 15%.
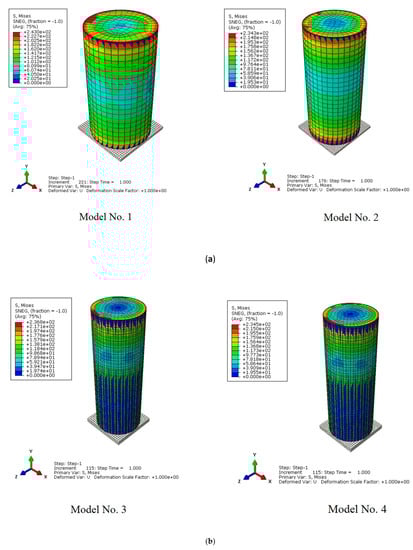
Figure 2.
(a) FE modelling of Model No. 1 with PFE 3171 kN; Model No. 2 with PFE 2640 kN; (b) FE modelling of Model No. 3 with PFE 7919 kN; Model No. 4 with PFE 7928 kN.
Table 2.
Comparison of the experimental results and FE results.
In the model Nos. 3, 9, 19, 26, 27, the error is equal or even less than 5%; nevertheless, in the model Nos. 1, 2, 4–6, 8, 10, 12, 13, 15, 17, 21–24, 28, 30–32, the error is between 10–15% which are still in the acceptable range based on previous studies in the literature. In addition, Figure 3, Figure 4, Figure 5, Figure 6, Figure 7 and Figure 8 show the axial strength of each finite element model versus the time which is 1 h for the model numbers 1–31 as they are normal columns and reacted to loading earlier, and 10 h for the Model No. 32 as it is considered as a huge, tall column which was taken more time to start reactions. As is evident from Figure 3, Figure 4, Figure 5, Figure 6, Figure 7 and Figure 8, the maximum bearing capacity of each model is less than 10,000 kN; however, the running time to reach the ultimate bearing capacity is different for each model. The 32 FE models were divided into different groups based on the range of axial load bearing capacity of the column, the modes of failure, and the running time of the operation of the analysis. For this reason, model numbers 1–9 have been categorized as one group; model numbers 10–12 and 14 have been put as another group; model numbers 15–20, model numbers 21–25, and model numbers 26–28 have been categorized as three separated groups. This is due to a different running time and different range of ultimate axial strength which were resulted from each model. Nevertheless, the results of the above groups were taken into consideration on a 1-hour basis while the model number 13 and model numbers 29–32 have been indicated in a separated group and their performance was analyzed within 10 h of running as shown in Figure 8.
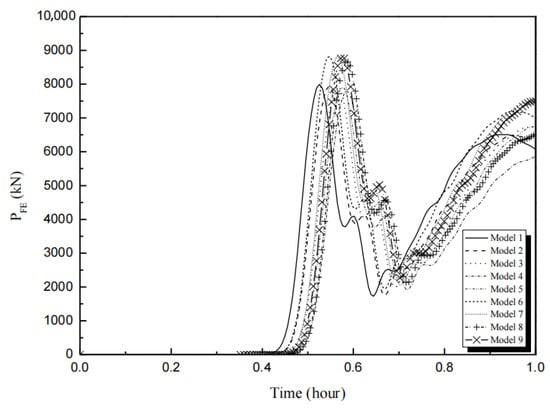
Figure 3.
Axial strength versus time for model numbers 1–9.
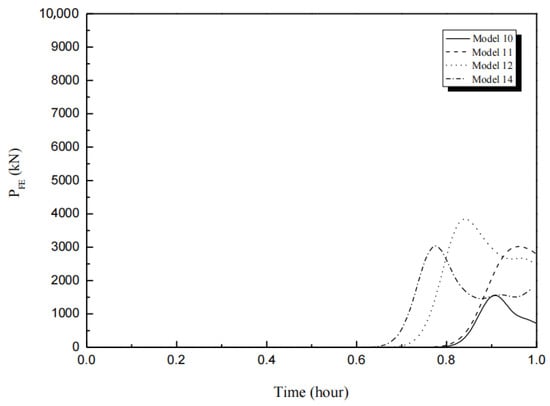
Figure 4.
Axial strength versus time for model numbers 10–12 and 14.
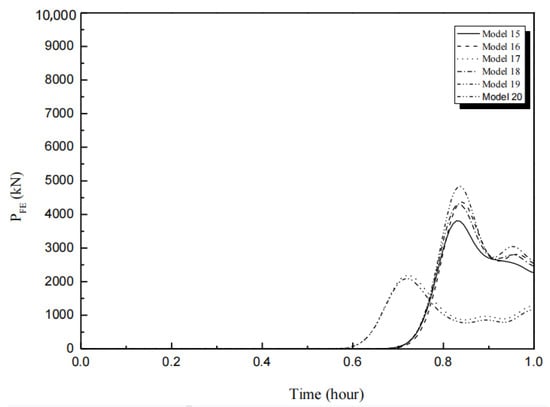
Figure 5.
Axial strength versus time for model numbers 15–20.
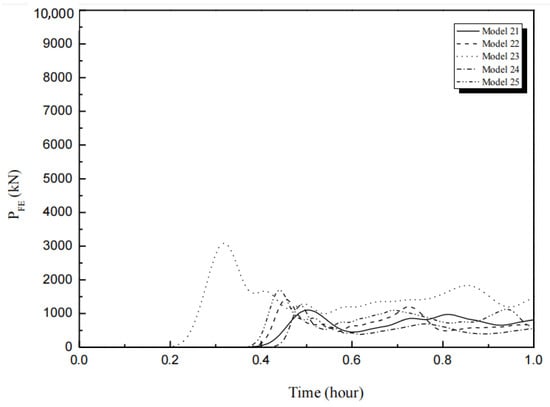
Figure 6.
Axial strength versus time for model numbers 21–25.
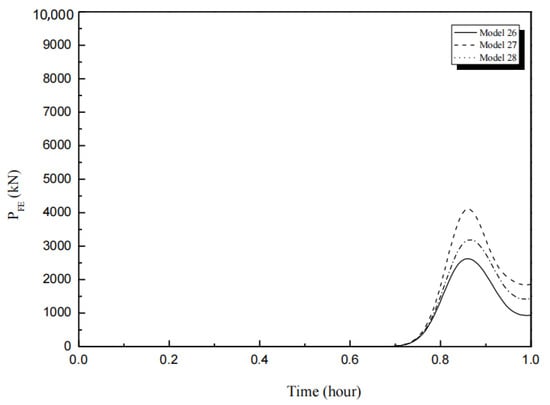
Figure 7.
Axial strength versus time for model numbers 26–28.
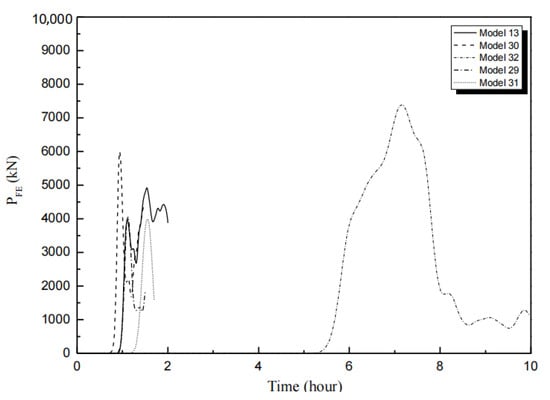
Figure 8.
Axial strength versus time for model numbers 13, 29–32.
4. Results, Comparison, and Discussion of the GEP Equation Outcomes with the FEA Results
In this section, the data of those 32 samples were input into Equation (1) and the results were compared with those obtained from the FEA and the outcome summarized in Table 3. The last two columns in Table 3 present the error between the bearing capacity obtained from the FEA and the GEP equation with the experimental results. As is evident, in most of the cases, the ultimate bearing capacity achieved from the GEP equation is closer to the real data obtained from the experimental test. In five samples (3, 9, 23, 27, 30), FE results were manifest a better prediction of the maximum bearing capacity which could be due to specific conditions of the composite columns such as lower L/D ratio, slenderness rate, and the strength of the materials. Therefore, in these special cases, the prediction from the GEP equation may not be good enough due to wide ranges of input datasets. Nevertheless, more than 85% of the predictions by Equation (1) showed very good agreement with the experimental results. This proves the feasibility of this equation and the GEP approach for estimation of the maximum bearing capacity of such composite columns. If the maximum and minimum strength of the CFST columns resulting from the experimental work and their corresponding values from FEA and GEP are taken into consideration, it can be seen that the column sample No. 5 with the maximum experimental bearing capacity of 9187 kN has the closest predicted value of 8929.05 kN from the GEP equation. On the other hand, the column No. 21 with the minimum experimental bearing capacity of 1242.2 kN also has the most accurate value of 1242.01 kN from its corresponding GEP equation result. Therefore, the GEP-based equation yields very good results compared to those from the FEA.
Table 3.
Comparison of the GEP equation results and the FEA results with the experimental test results.
Furthermore, according to the Table 3, model numbers 3, 9, 23, 27, and 30 presented a closer value of ultimate bearing capacity to the corresponding experimental outcome in the FEA instead of AI analysis using the GEP equation. In fact, this is because these models are short columns, stub columns, or composite column with a low or a very high strength materials, or they are the columns subjected to a kind of impact loading; Therefore, the prediction by the GEP equation led to less accuracy compared to the FEA. Nevertheless, as can be clearly inferred, the GEP equation results for 27 models out of 32 models indicated more accurate prediction and this shows that the generated prediction equation from GEP is sufficiently capable to predict the ultimate bearing capacity of such columns.
5. Concluding Remarks
Prediction of the bearing capacity of CFST columns is always important for the engineers. Due to some limitations in analysis by means of FEA, much efforts have been expended in attempts to find some other feasible and less time-consuming methods for prediction of the maximum capacity that CFST columns can withstand, and among them using AI techniques are widely being considered. This is because AI approaches such as GEP in most of the cases have shown better results in comparison with the FEA. In this study, 32 CFST columns, in the acceptable specification range of the AI-GEP analysis, were modeled and analyzed using the FEM. The results obtained from ABAQUS software were compared with the outcomes achieved from the GEP-based equation (Equation (1)). According to the results:
- A very good agreement is evident between the experimental outcomes and the GEP equation results with a less than 14% difference of the estimated bearing capacity for the majority of the cases;
- More than 85% of the results from Equation (1) were in accordance with the experimental results which proves the suitability and workability of this GEP-based equation for the prediction of the ultimate bearing capacity of the CFST columns;
- Only five models showed considerable differences in predicted values by GEP compared to the experimental data which could be because of the specific conditions of the composite columns such as low L/D ratio, slenderness rate, use of very high or very low strength for materials and the application of heavy loads to the columns.
It is possible to further study the CFST columns with the special conditions as explained above and find a more suitable GEP-based equation for those columns by training and testing more data. For this reason, it is recommended to set limitations on the specifications of the CFST columns to provide an equation with better prediction in comparison with the experimental results.
Author Contributions
This paper represents a result of collaborative teamwork. The conceptualization of the article is proposed by H.J. who is a professional in structural engineering. The methodology was outlined by A.S.M. who is an expert in civil engineering and the software analysis and validation were performed by P.S. and checked and investigated by R.A.K. All authors have read and agreed to the published version of the manuscript.
Funding
This research was funded by National Natural Science Foundation of China, grant number 51978526.
Acknowledgments
The authors’ great gratitude goes to Shanghai Jiao Tong University and Tongji University as we have benefited from the facilities and the library access of these universities during this study. In addition, the financial support from National Natural Science Foundation of China, grant number 51978526, is highly appreciated.
Conflicts of Interest
The authors declare no conflict of interest.
Appendix A
Table A1.
Specification of the samples for the FEA.
Table A1.
Specification of the samples for the FEA.
| No. | Ref. No | D (mm) | L (mm) | t (mm) | L/D | D/t | fy (MPa) | Es (GPa) | f’c (MPa) | Ec (GPa) | υ |
|---|---|---|---|---|---|---|---|---|---|---|---|
| 1 | [25] | 114.3 | 210 | 6.3 | 1.84 | 18.14 | 428 | 209 | 173.5 | 63 | 0.3 |
| 2 | [25] | 114.3 | 250 | 3.6 | 2.19 | 31.75 | 403 | 213 | 184.2 | 63 | 0.3 |
| 3 | [25] | 219.1 | 600 | 5 | 2.74 | 43.82 | 380 | 205 | 185.1 | 66 | 0.3 |
| 4 | [25] | 219.1 | 600 | 10 | 2.74 | 21.91 | 381 | 212 | 185.1 | 66 | 0.3 |
| 5 | [25] | 219.1 | 600 | 10 | 2.74 | 21.91 | 381 | 212 | 193.3 | 67 | 0.3 |
| 6 | [25] | 219.1 | 600 | 6.3 | 2.74 | 34.78 | 300 | 202 | 163 | 62 | 0.3 |
| 7 | [25] | 219.1 | 600 | 6.3 | 2.74 | 34.78 | 300 | 202 | 175.4 | 58 | 0.3 |
| 8 | [25] | 219.1 | 600 | 6.3 | 2.74 | 34.78 | 300 | 202 | 148.8 | 54 | 0.3 |
| 9 | [25] | 219.1 | 600 | 6.3 | 2.74 | 34.78 | 300 | 202 | 174.5 | 56 | 0.3 |
| 10 | [6] | 168.6 | 645 | 3.9 | 3.83 | 43.23 | 363 | 206 | 36.2 | 33 | 0.3 |
| 11 | [6] | 168.6 | 645 | 3.9 | 3.83 | 43.23 | 363 | 206 | 95.8 | 33 | 0.3 |
| 12 | [6] | 164.2 | 652 | 2.5 | 3.97 | 65.68 | 377 | 206 | 158.46 | 33 | 0.3 |
| 13 | [6] | 189 | 756 | 3 | 4.00 | 63.00 | 398 | 206 | 158.46 | 33 | 0.3 |
| 14 | [6] | 168.6 | 648 | 3.9 | 3.84 | 43.23 | 363 | 206 | 165.49 | 33 | 0.3 |
| 15 | [6] | 169 | 645 | 4.8 | 3.82 | 35.21 | 399 | 206 | 167.87 | 33 | 0.3 |
| 16 | [6] | 168.7 | 645 | 5.2 | 3.82 | 32.44 | 405 | 206 | 158.75 | 33 | 0.3 |
| 17 | [6] | 168.8 | 650 | 5.7 | 3.85 | 29.61 | 452 | 206 | 151.91 | 33 | 0.3 |
| 18 | [6] | 168.1 | 645 | 8.1 | 3.84 | 20.75 | 409 | 206 | 158.75 | 33 | 0.3 |
| 19 | [6] | 165 | 500 | 2.81 | 3.03 | 58.72 | 350 | 212 | 67.94 | 67 | 0.3 |
| 20 | [6] | 165 | 500 | 2.76 | 3.03 | 59.78 | 350 | 212 | 67.94 | 67 | 0.3 |
| 21 | [6] | 114.3 | 342.9 | 3.35 | 3.00 | 34.12 | 287.33 | 212 | 86.21 | 67 | 0.3 |
| 22 | [6] | 114.3 | 342.9 | 6 | 3.00 | 19.05 | 342.95 | 212 | 56.99 | 67 | 0.3 |
| 23 | [6] | 114.3 | 342.9 | 6 | 3.00 | 19.05 | 342.95 | 212 | 86.21 | 67 | 0.3 |
| 24 | [6] | 114.3 | 342.9 | 6 | 3.00 | 19.05 | 342.95 | 212 | 102.43 | 67 | 0.3 |
| 25 | [6] | 114.3 | 200 | 6.3 | 1.75 | 18.14 | 428 | 212 | 164.35 | 67 | 0.3 |
| 26 | [7] | 200 | 600 | 1.945 | 3.00 | 102.83 | 227 | 212 | 52.7 | 67 | 0.3 |
| 27 | [7] | 200 | 600 | 1.945 | 3.00 | 102.83 | 227 | 212 | 67.7 | 67 | 0.3 |
| 28 | [7] | 200 | 600 | 1.945 | 3.00 | 102.83 | 227 | 205 | 74.4 | 58 | 0.3 |
| 29 | [7] | 260 | 780 | 1.945 | 3.00 | 133.68 | 227 | 205 | 52.7 | 58 | 0.3 |
| 30 | [7] | 260 | 780 | 1.945 | 3.00 | 133.68 | 227 | 205 | 85.4 | 58 | 0.3 |
| 31 | [14] | 299 | 848 | 1.68 | 2.84 | 177.98 | 267.5 | 205 | 47.2 | 58 | 0.3 |
| 32 | [26] | 273 | 4195 | 10 | 15.37 | 27.30 | 412 | 205 | 180 | 58 | 0.3 |
References
- Sarir, P.; Shen, S.L.; Wang, Z.F.; Chen, J.; Horpibulsuk, S.; Pham, B.T. Optimum model for bearing capacity of concrete-steel columns with AI technology via incorporating the algorithms of IWO and ABC. Eng. Comput. 2021, 37, 797–807. [Google Scholar] [CrossRef]
- Han, L.H.; An, Y.-F. Performance of concrete-encased CFST stub columns under axial compression. J. Constr. Steel Res. 2014, 93, 62–76. [Google Scholar] [CrossRef]
- Han, L.H.; Li, W.; Bjorhovde, R. Developments and advanced applications of concrete-filled steel tubular (CFST) structures: Members. J. Constr. Steel Res. 2014, 100, 211–228. [Google Scholar] [CrossRef]
- Tao, Z.; Wang, Z.B.; Yu, Q. Finite element modelling of concrete-filled steel stub columns under axial compression. J. Constr. Steel Res. 2013, 89, 121–131. [Google Scholar] [CrossRef]
- Keshavarz, A.; Mehramiri, M. New gene expression programming models for normalized shear modulus and damping ratio of sands. Eng. Appl. Artif. Intell. 2015, 45, 464–472. [Google Scholar] [CrossRef]
- Khandelwal, M.; Faradonbeh, R.S.; Monjezi, M.; Armaghani, D.J.; Majid, M.Z.A.; Yagiz, S. Function development for appraising brittleness of intact rocks using genetic programming and non-linear multiple regression models. Eng. Comput. 2017, 33, 13–21. [Google Scholar] [CrossRef]
- Koopialipoor, M.; Armaghani, D.J.; Haghighi, M.; Ghaleini, E.N. A neuro-genetic predictive model to approximate overbreak induced by drilling and blasting operation in tunnels. Bull. Eng. Geol. Environ. 2019, 78, 981–990. [Google Scholar] [CrossRef]
- Uddin, M.N.; Li, L.Z.; Khan, R.K.M.; Shahriar, F.; Sob, L.W.T. Axial capacity prediction of concrete-filled steel tubular short members using multiple linear regression and artificial neural network. Mater. Sci. Forum 2021, 1047, 220–226. [Google Scholar] [CrossRef]
- Chen, W.; Sarir, P.; Bui, X.N.; Nguyen, H.; Tahir, M.M.; Armaghani, D.J. Neuro-genetic, Neuro-imperialism and genetic programing models in predicting ultimate bearing capacity of pile. Eng. Comput. 2020, 36, 1101–1115. [Google Scholar] [CrossRef]
- Sarir, P.; Chen, J.; Asteris, P.G.; Armaghani, D.J.; Tahir, M.M. Developing GEP tree-based, Neuro-swarm, and whale optimization models for evaluation of bearing capacity of concrete-filled steel tube columns. Eng. Comput. 2021, 37, 1–19. [Google Scholar] [CrossRef]
- Javadi, A.; Mehravar, M.; Faramarzi, A.; Ahangar-Asr, A. An artificial intelligence based finite element method. ISAST Trans. Comput. Intell. Syst. 2009, 6, 11–17. [Google Scholar]
- Alani, Y.R.A.; Agarwal, V. Nonlinear finite element study on the circular concrete filled steel tubular columns. Int. J. Innov. Technol. Explor. Eng. 2013, 3, 52–55. [Google Scholar]
- Armaghani, D.J.; Hajihassani, M.; Bejarbaneh, B.Y.; Marto, A.; Mohamad, E.T. Indirect measure of shale shear strength parameters by means of rock index tests through an optimized artificial neural network. Meas. J. 2014, 55, 487–498. [Google Scholar] [CrossRef]
- Armaghani, D.J.; Safari, V.; Fahimifar, A.; Amin, M.F.M.; Monjezi, M.; Mohammadi, M.A. Uniaxial compressive strength prediction through a new technique based on gene expression programming. Neural Comput. Appl. 2018, 30, 3523–3532. [Google Scholar] [CrossRef]
- Elshekh, E.; Shafiq, N.; Nuruddin, I.; Fathi, A. High strength concrete. J. Appl. Sci. 2014, 14, 1073–1077. [Google Scholar] [CrossRef]
- Evirgen, B.; Tuncan, A.; Taskin, K. Structural behavior of concrete filled steel tubular sections (CFT/CFSt) under axial compression. Thin-Walled Struct. 2014, 80, 46–56. [Google Scholar] [CrossRef]
- Faradonbeh, R.S.; Armaghani, D.J.; Monjezi, M. Development of a new model for predicting flyrock distance in quarry blasting: A genetic programming technique. Bull. Eng. Geol. Environ. 2016, 75, 993–1006. [Google Scholar] [CrossRef]
- Faradonbeh, R.S.; Armaghani, D.J.; Monjezi, M.; Mohamad, E.T. Genetic programming and gene expression programming for flyrock assessment due to mine blasting. Int. J. Rock Mech. Min. Sci. 2016, 88, 254–264. [Google Scholar] [CrossRef]
- Faradonbeh, R.S.; Hasanipanah, M.; Amnieh, H.B.; Armaghani, D.J.; Monjezi, M. Development of GP and GEP models to estimate an environmental issue induced by blasting operation. Environ. Monit. Assess. 2018, 190, 351–363. [Google Scholar] [CrossRef] [PubMed]
- Gordan, B.; Armaghani, D.J.; Hajihassani, M.; Monjezi, M. Prediction of seismic slope stability through combination of particle swarm optimization and neural network. Eng. Comput. 2016, 32, 85–97. [Google Scholar] [CrossRef]
- Gordan, B.; Koopialipoor, M.; Clementking, A.; Tootoonchi, H.; Mohamad, E.T. Estimating and optimizing safety factors of retaining wall through neural network and bee colony techniques. Eng. Comput. 2019, 35, 945–954. [Google Scholar] [CrossRef]
- Güneyisi, E.M.; Gültekin, A.; Mermerdaş, K. Ultimate capacity prediction of axially loaded CFST short columns. International J. Steel Struct. 2016, 16, 99–114. [Google Scholar] [CrossRef]
- Hoang, A.L.; Fehling, E.; Thai, D.; Van Nguyen, C. Evaluation of axial strength in circular STCC columns using UHPC and UHPFRC. J. Constr. Steel Res. 2019, 153, 533–549. [Google Scholar] [CrossRef]
- Khandelwal, M.; Armaghani, D.J.; Faradonbeh, R.S.; Ranjith, P.G.; Ghoraba, S. A new model based on gene expression programming to estimate air flow in a single rock joint. Environ. Earth Sci. 2016, 75, 739–745. [Google Scholar] [CrossRef]
- Koopialipoor, M.; Armaghani, D.J.; Hedayat, A.; Marto, A.; Gordan, B. Applying various hybrid intelligent systems to evaluate and predict slope stability under static and dynamic conditions. Soft Comput. 2018, 23, 5913–5929. [Google Scholar] [CrossRef]
- Koopialipoor, M.; Noorbakhsh, A.; Ghaleini, E.N. A new approach for estimation of rock brittleness based on non-destructive tests. Nondestruct. Test. Eval. 2019, 16, 214–223. [Google Scholar] [CrossRef]
- Koopialipoor, M.; Fallah, A.; Armaghani, D.J.; Azizi, A.; Mohamad, E.T. Three hybrid intelligent models in estimating flyrock distance resulting from blasting. Eng. Comput. 2019, 35, 243–256. [Google Scholar] [CrossRef]
- Koopialipoor, M.; Ghaleini, E.N.; Haghighi, M.; Kanagarajan, S.; Maarefvand, P.; Mohamad, E.T. Overbreak prediction and optimization in tunnel using neural network and bee colony techniques. Eng. Comput. 2018, 5, 4–12. [Google Scholar] [CrossRef]
- Koopialipoor, M.; Ghaleini, E.N.; Tootoonchi, H.; Armaghani, D.J.; Haghighi, M.; Hedayat, A. Developing a new intelligent technique to predict overbreak in tunnels using an artificial bee colony-based ANN. Environ. Earth Sci. 2019, 78, 165–178. [Google Scholar] [CrossRef]
- Kvočák, V.; Varga, G.; Vargová, R. Composite steel concrete filled tubes. Procedia Eng. 2012, 40, 469–474. [Google Scholar] [CrossRef][Green Version]
- Rabbat, B.G.; Russell, H.G. Friction coefficient of steel on concrete or grout. J. Struct. Eng. 1985, 111, 505–515. [Google Scholar] [CrossRef]
- Shen, S.L.; Wang, Z.F.; Sun, W.J.; Wang, L.B.; Horpibulsuk, S. A field trial of horizontal jet grouting using the composite-pipe method in the soft deposits of Shanghai. Tunn. Undergr. Space Technol. 2013, 35, 142–151. [Google Scholar] [CrossRef]
- Ahmadi, M.; Naderpour, H.; Kheyroddin, A. Utilization of artificial neural networks to prediction of the capacity of CCFT short columns subject to short term axial load. Arch. Civ. Mech. Eng. 2014, 14, 510–517. [Google Scholar] [CrossRef]
- Ren, Q.; Li, M.; Zhang, M.; Shen, Y.; Si, W. Prediction of ultimate axial capacity of square concrete-filled steel tubular short columns using a hybrid intelligent algorithm. J. Appl. Sci. 2019, 28, 2802. [Google Scholar] [CrossRef]
- Le, L.M.; Ly, H.B.; Pham, B.T.; Le, V.M.; Pham, T.A.; Nguyen, D.H.; Tran, X.T.; Le, T.T. Hybrid artificial intelligence approaches for prediction buckling damage of steel columns under axial compression. J. Mater. 2019, 16, 12–30. [Google Scholar]
- Cascardi, A.; Mircelli, F.; Aiello, M.A. An artificial neural networks model for the prediction of the compressive strength of FRP-confined concrete circular columns. J. Eng. Struct. 2017, 140, 199–208. [Google Scholar] [CrossRef]
- Lim, J.C.; Karakus, M.; Ozbakkaloglu, T. Evaluation of ultimate conditions of FRP-confined concrete columns using genetic programming. J. Comput. Struct. 2016, 162, 28–37. [Google Scholar] [CrossRef]
- Ahmadi, M.; Naderpour, H.; Kheyroddin, A. ANN model for predicting the compressive strength of circular steel-confined concrete. Int. J. Civ. Eng. 2017, 15, 213–221. [Google Scholar] [CrossRef]
- Güneyisi, E.M.; Abdikarim, I.N. Axial compression capacity of circular CFST columns transversely strengthened by FRP. Eng. Struct. 2019, 191, 417–431. [Google Scholar] [CrossRef]
- Jayalekshmi, S.; Jegadesh, J.S.S.; Goel, A. Empirical approach for determining axial strength of circular concrete filled steel tubular columns. J. Inst. Eng. 2018, 99, 257–268. [Google Scholar] [CrossRef]
- Ansari, Y.; Hashemi, A.H. Neural Network Approach in Assessment of Fiber Concrete Impact Strength. J. Civ. Eng. Mater. Appl. 2017, 1, 88–97. [Google Scholar] [CrossRef]
- Yagoubi, M.H. Prediction of ultimate strength for concrete-filled steel tube columns using artificial neural network. Ph.D. Thesis, University of Zabol, Zabol, Iran, 2018. [Google Scholar]
- Wang, Z.B.; Liu, L.Y. Finite element modelling of concrete-filled steel tube reinforced concrete stub columns under axial compression. Appl. Mech. Mater. 2013, 142, 351–359. [Google Scholar] [CrossRef]
- Xiao, J.; Huang, Y.; Yang, J.; Zhang, C. Mechanical properties of confined recycled aggregate concrete under axial compression. Constr. Build. Mater. 2012, 26, 591–603. [Google Scholar] [CrossRef]
- Kanishchev, R.; Kvocak, V. Stability and carrying capacity of the steel tubes. Procedia Eng. 2017, 190, 447–451. [Google Scholar] [CrossRef]
- Singh, H.; Gupta, P. Numerical modeling of rectangular concrete-filled steel tubular short columns. Contrib. Pap. 2013, 167–179. [Google Scholar]
- Davoudi, S.A.M.; Naghipour, M. Studying the Buckling Behavior of Composite Columns (CFST) by Cyclic Loading. J. Civ. Eng. Mater. Appl. 2019, 3, 203–213. [Google Scholar] [CrossRef]
- David, H. ABAQUS Standard User’s Manual, version 6.12.1, USA, 2012.
- Sarir, P.; Shen, S.-L.; Arulrajah, A.; Horpibulsuk, S. Concrete wedge and coarse sand coating shear connection system in GFRP concrete composite deck. Constr. Build. Mater. 2016, 114, 650–655. [Google Scholar] [CrossRef]
- Ding, H.T.; Francis, A.; Kaczmarek, O.; Karsch, F.; Laermann, E.; Soeldner, W. Thermal dilepton rate and electrical conductivity: An analysis of vector current correlation functions in quenched lattice QCD. Phys. Rev. D 2011, 83, 34–50. [Google Scholar] [CrossRef]
- Liang, Q.Q.; Fragomeni, S. Nonlinear analysis of circular concrete-filled steel tubular short columns under axial loading. J. Constr. Steel Res. 2009, 65, 2186–2196. [Google Scholar] [CrossRef]
- Hoang, A.L.; Fehling, E. Numerical study of circular steel tube confined concrete (STCC) stub columns. J. Constr. Steel Res. 2017, 136, 238–255. [Google Scholar] [CrossRef]
- Liu, J.; Teng, Y.; Zhang, Y.; Wang, X.; Chen, Y.F. Axial stress—Strain behavior of high-strength concrete confined by circular thin-walled steel tubes. Constr. Build. Mater. 2018, 177, 366–377. [Google Scholar] [CrossRef]
- Xiong, M.; Xiong, D.; Liew, J.Y.R. Axial performance of short concrete filled steel tubes with high- and ultra-high- strength materials. Eng. Struct. 2017, 136, 494–510. [Google Scholar] [CrossRef]
- Xiong, M.; Xiong, D.; Liew, J.Y.R. Behaviour of steel tubular members infilled with ultra-high strength concrete. J. Constr. Steel Res. 2017, 138, 168–183. [Google Scholar] [CrossRef]
- Wang, Y.; Yang, L.; Yang, H.; Liu, C. Behaviour of concrete- filled corrugated steel tubes under axial compression. Eng. Struct. 2019, 183, 475–495. [Google Scholar] [CrossRef]
- Stoffel, M.; Bamer, F.; Markert, B. Artificial neural networks and intelligent finite elements in non-linear structural mechanics. Thin-Walled Struct. 2018, 131, 102–106. [Google Scholar] [CrossRef]
- Dai, X.H.; Lam, D.; Jamaluddin, N.; Ye, J. Numerical analysis of slender elliptical concrete filled columns under axial compression. Thin-Walled Struct. 2014, 77, 26–35. [Google Scholar] [CrossRef]
- Roure, F.; Pastor, M.M.; Casafont, M.; Somalo, M.R. Stub column tests for racking design: Experimental testing, FE analysis and EC3. Thin-Walled Struct. 2011, 49, 167–184. [Google Scholar] [CrossRef]
- Code, P. Eurocode 4: Design of Structures for Earthquake Resistance-Part 1: General Rules, Seismic Actions and Rules for Buildings; European Committee for Standardization: Brussels, Belgium, 2005. [Google Scholar]
- Giakoumelis, G.; Lam, D. Axial capacity of circular concrete-filled tube columns. J. Constr. Steel Res. 2004, 60, 1049–1068. [Google Scholar] [CrossRef]


Publisher’s Note: MDPI stays neutral with regard to jurisdictional claims in published maps and institutional affiliations. |
© 2021 by the authors. Licensee MDPI, Basel, Switzerland. This article is an open access article distributed under the terms and conditions of the Creative Commons Attribution (CC BY) license (https://creativecommons.org/licenses/by/4.0/).