Author Contributions
Conceptualization, investigation, and methodology, A.M.L., V.V.F., V.P., O.L., M.C., A.D.N., F.A., F.P.; writing—original draft preparation, A.M.L., V.V.F.; writing—review and editing, A.M.L., V.V.F., V.P., F.P.; supervision, A.D.N., F.A., F.P.; All authors have read and agreed to the published version of the manuscript.
Figure 1.
Characterization set-up with VNA Keysight N9927A FieldFox and DAK 3.5 probe.
Figure 1.
Characterization set-up with VNA Keysight N9927A FieldFox and DAK 3.5 probe.
Figure 2.
Measured real part of the dielectric constant as a function of the frequency for different water concentrations in diesel.
Figure 2.
Measured real part of the dielectric constant as a function of the frequency for different water concentrations in diesel.
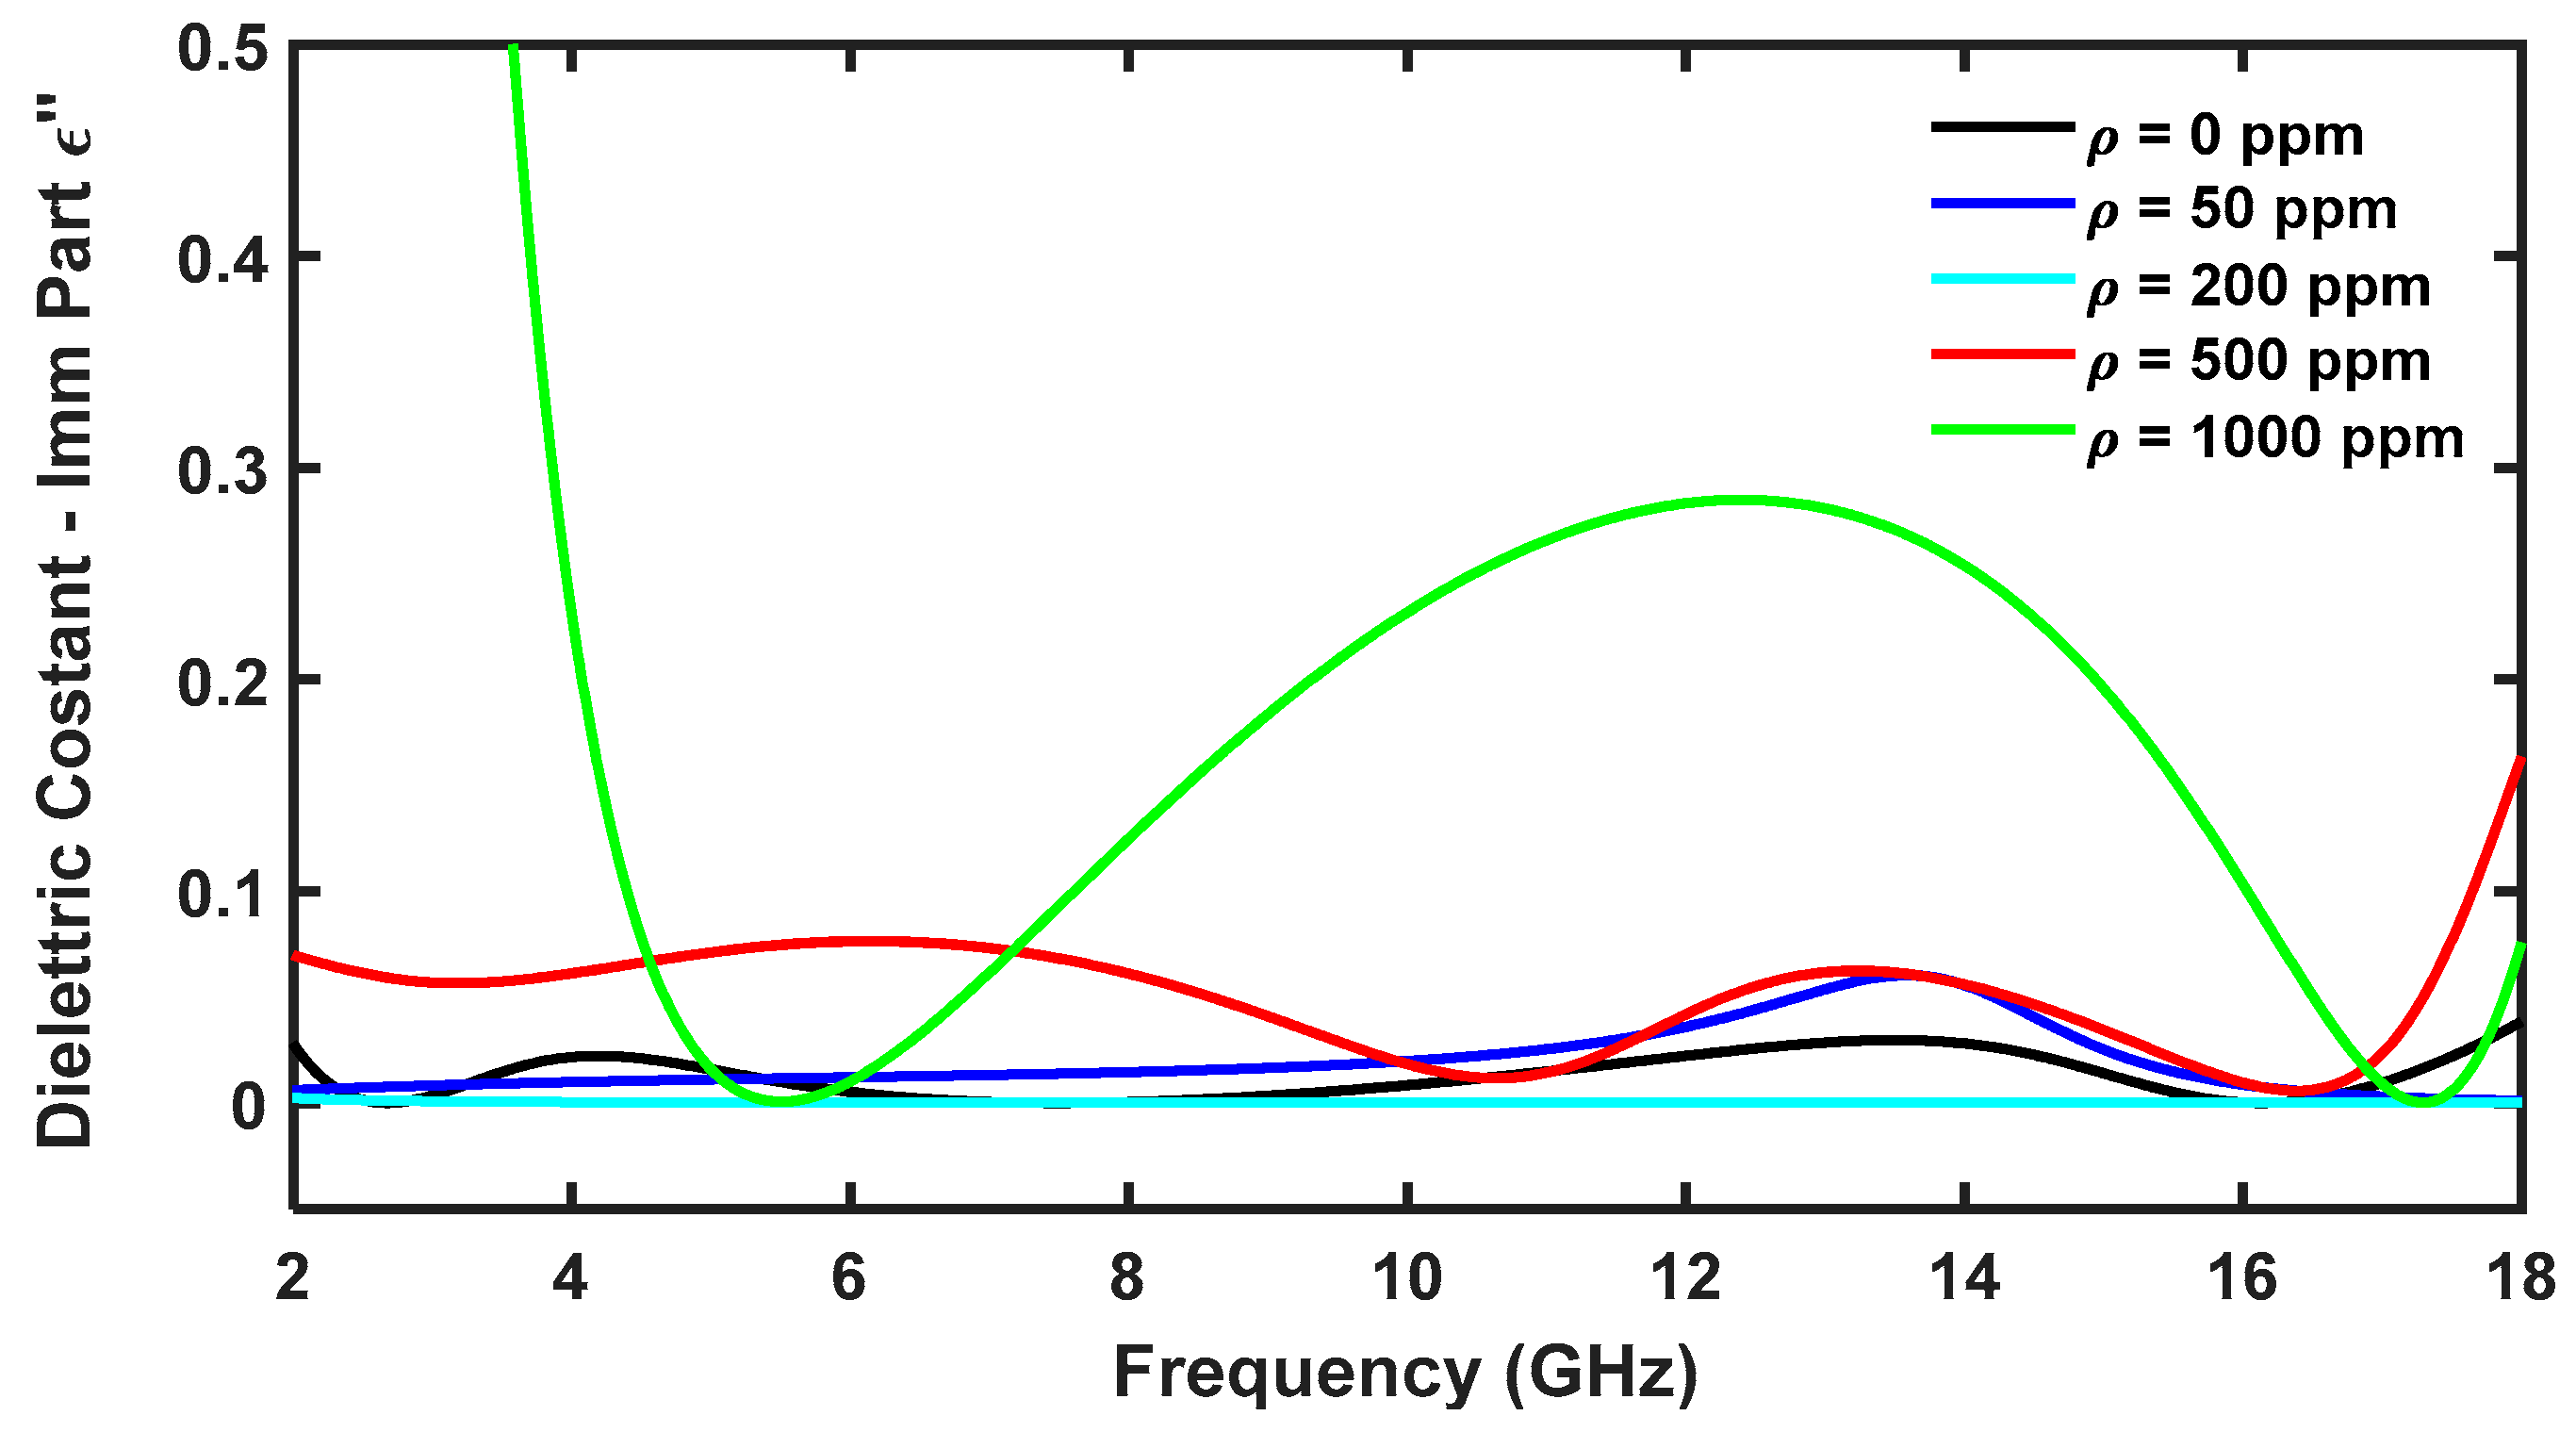
Figure 3.
Measured imaginary part of the dielectric constant as a function of the frequency for different water concentrations in diesel.
Figure 3.
Measured imaginary part of the dielectric constant as a function of the frequency for different water concentrations in diesel.
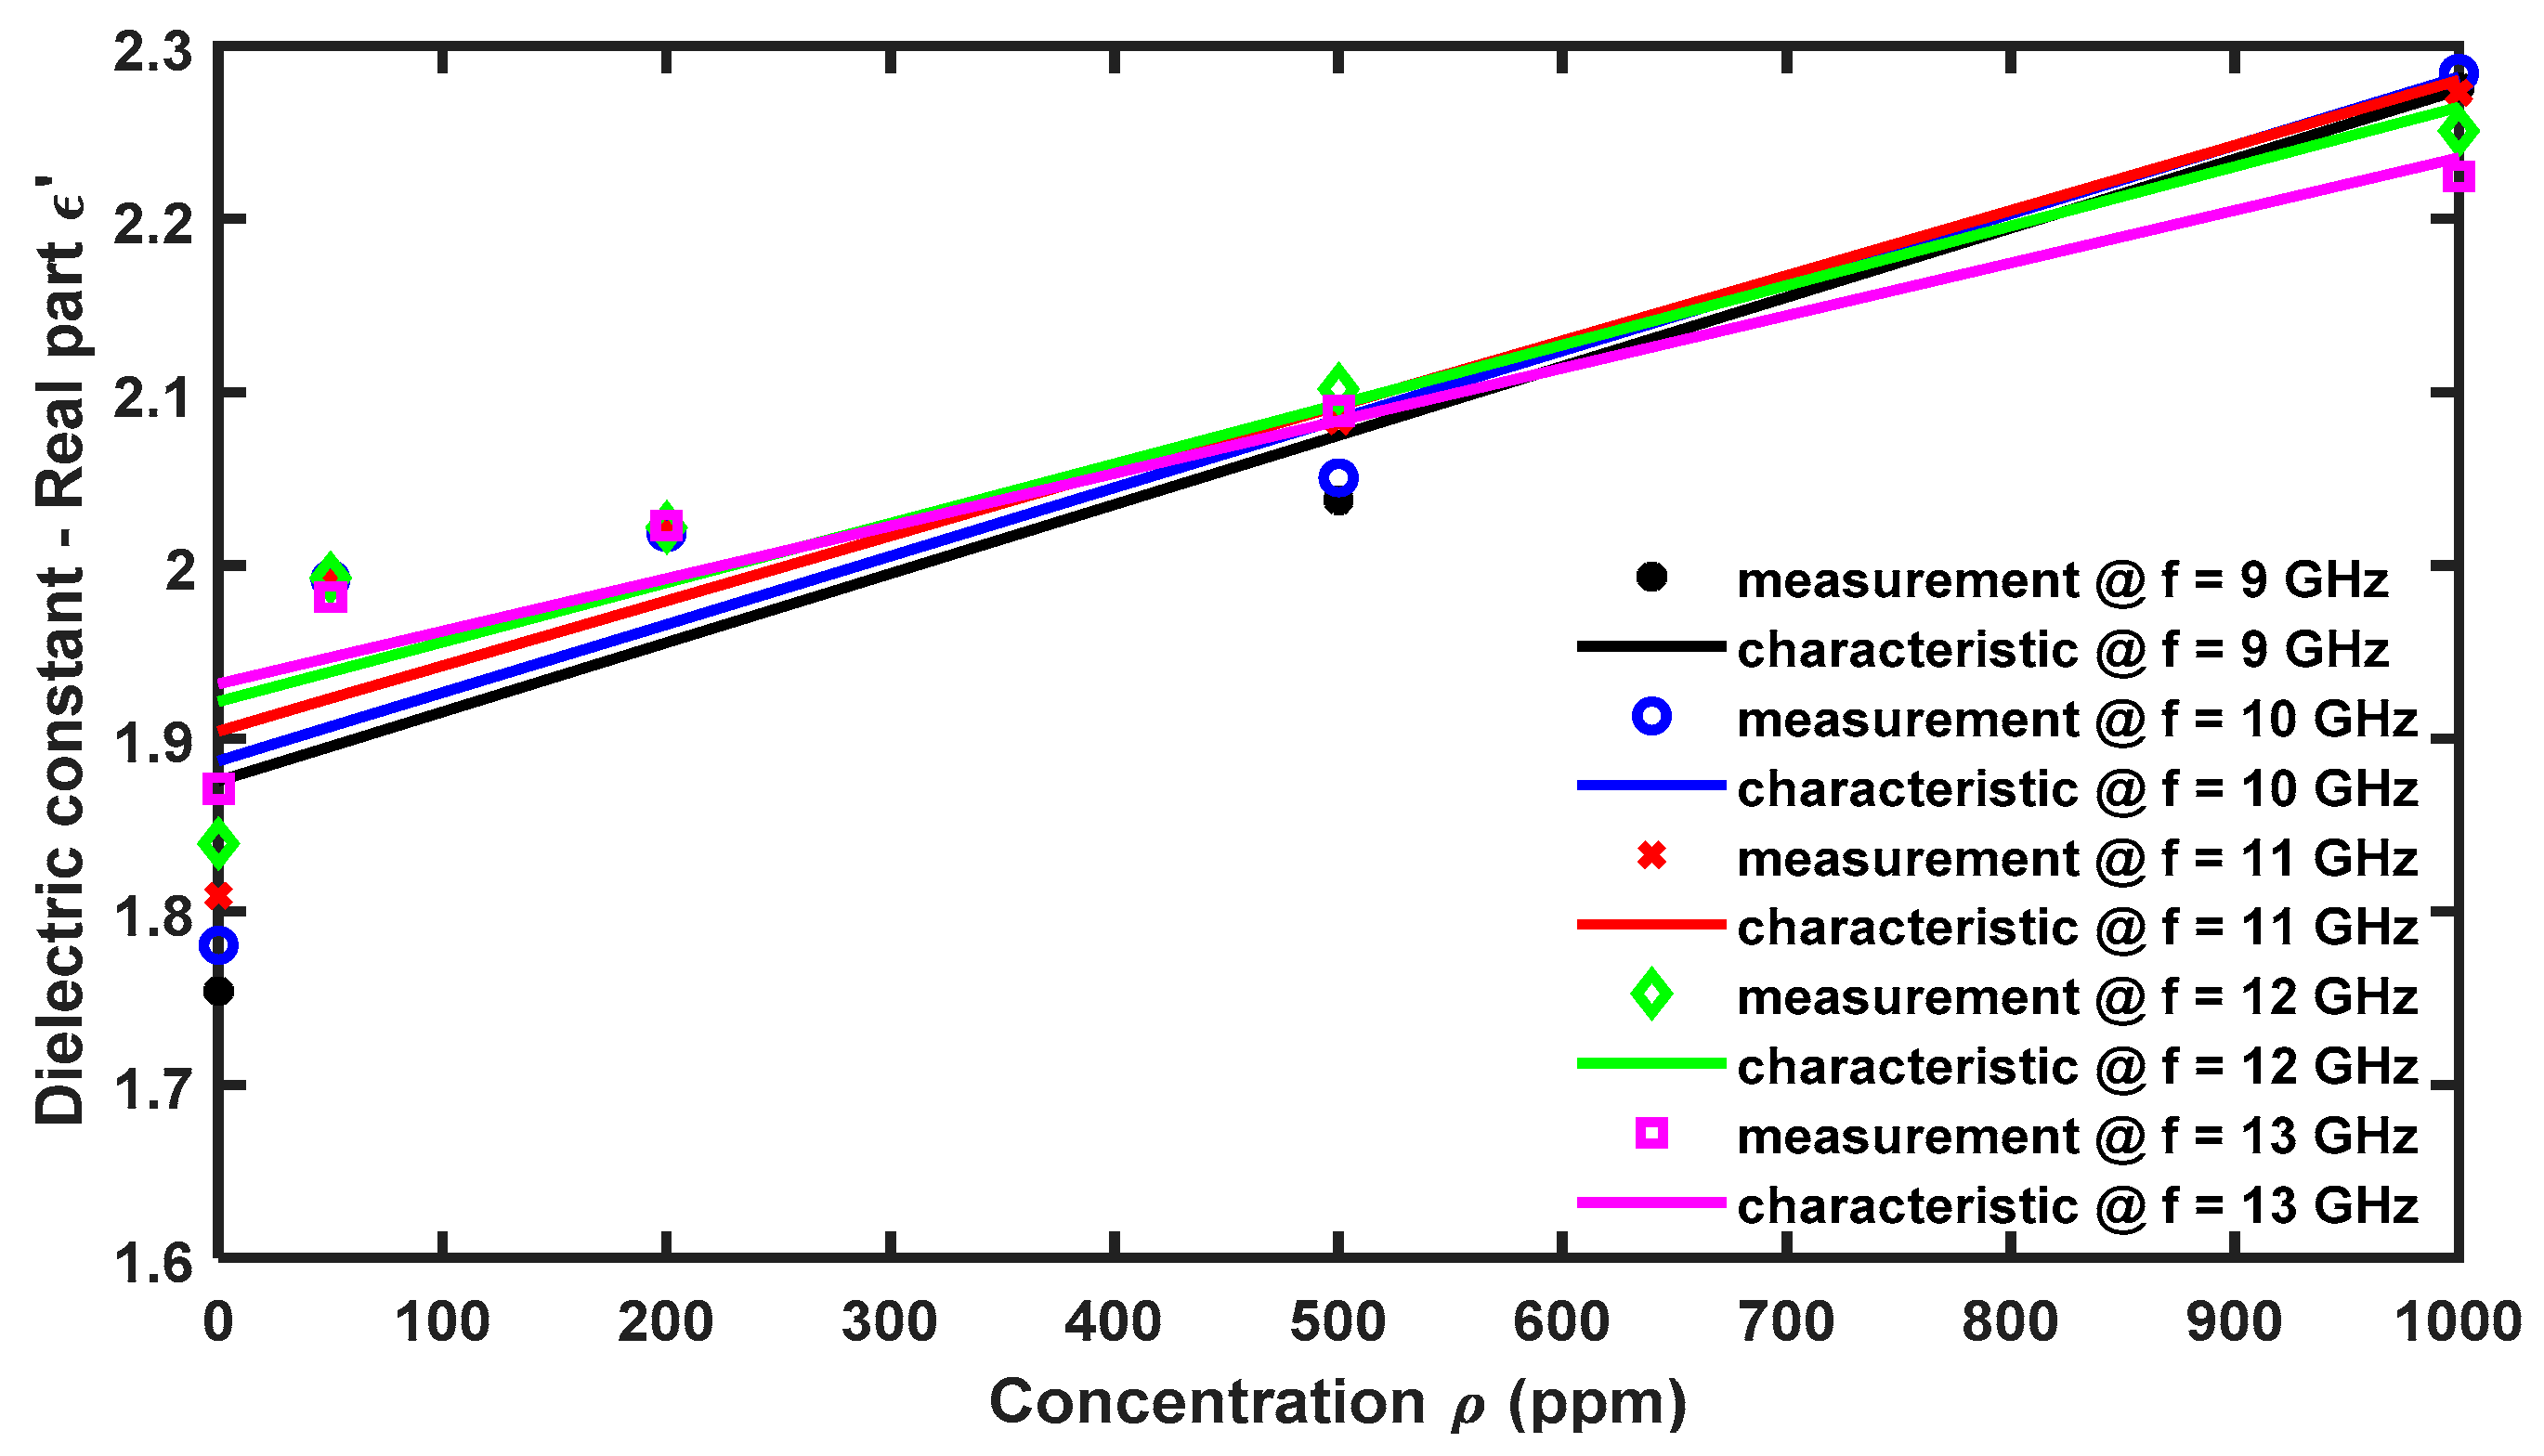
Figure 4.
Real part of the dielectric constant, measured with SPEAG DAK 3.5 probe-N9927A VNA, as a function of the water concentration in diesel, for different frequencies.
Figure 4.
Real part of the dielectric constant, measured with SPEAG DAK 3.5 probe-N9927A VNA, as a function of the water concentration in diesel, for different frequencies.
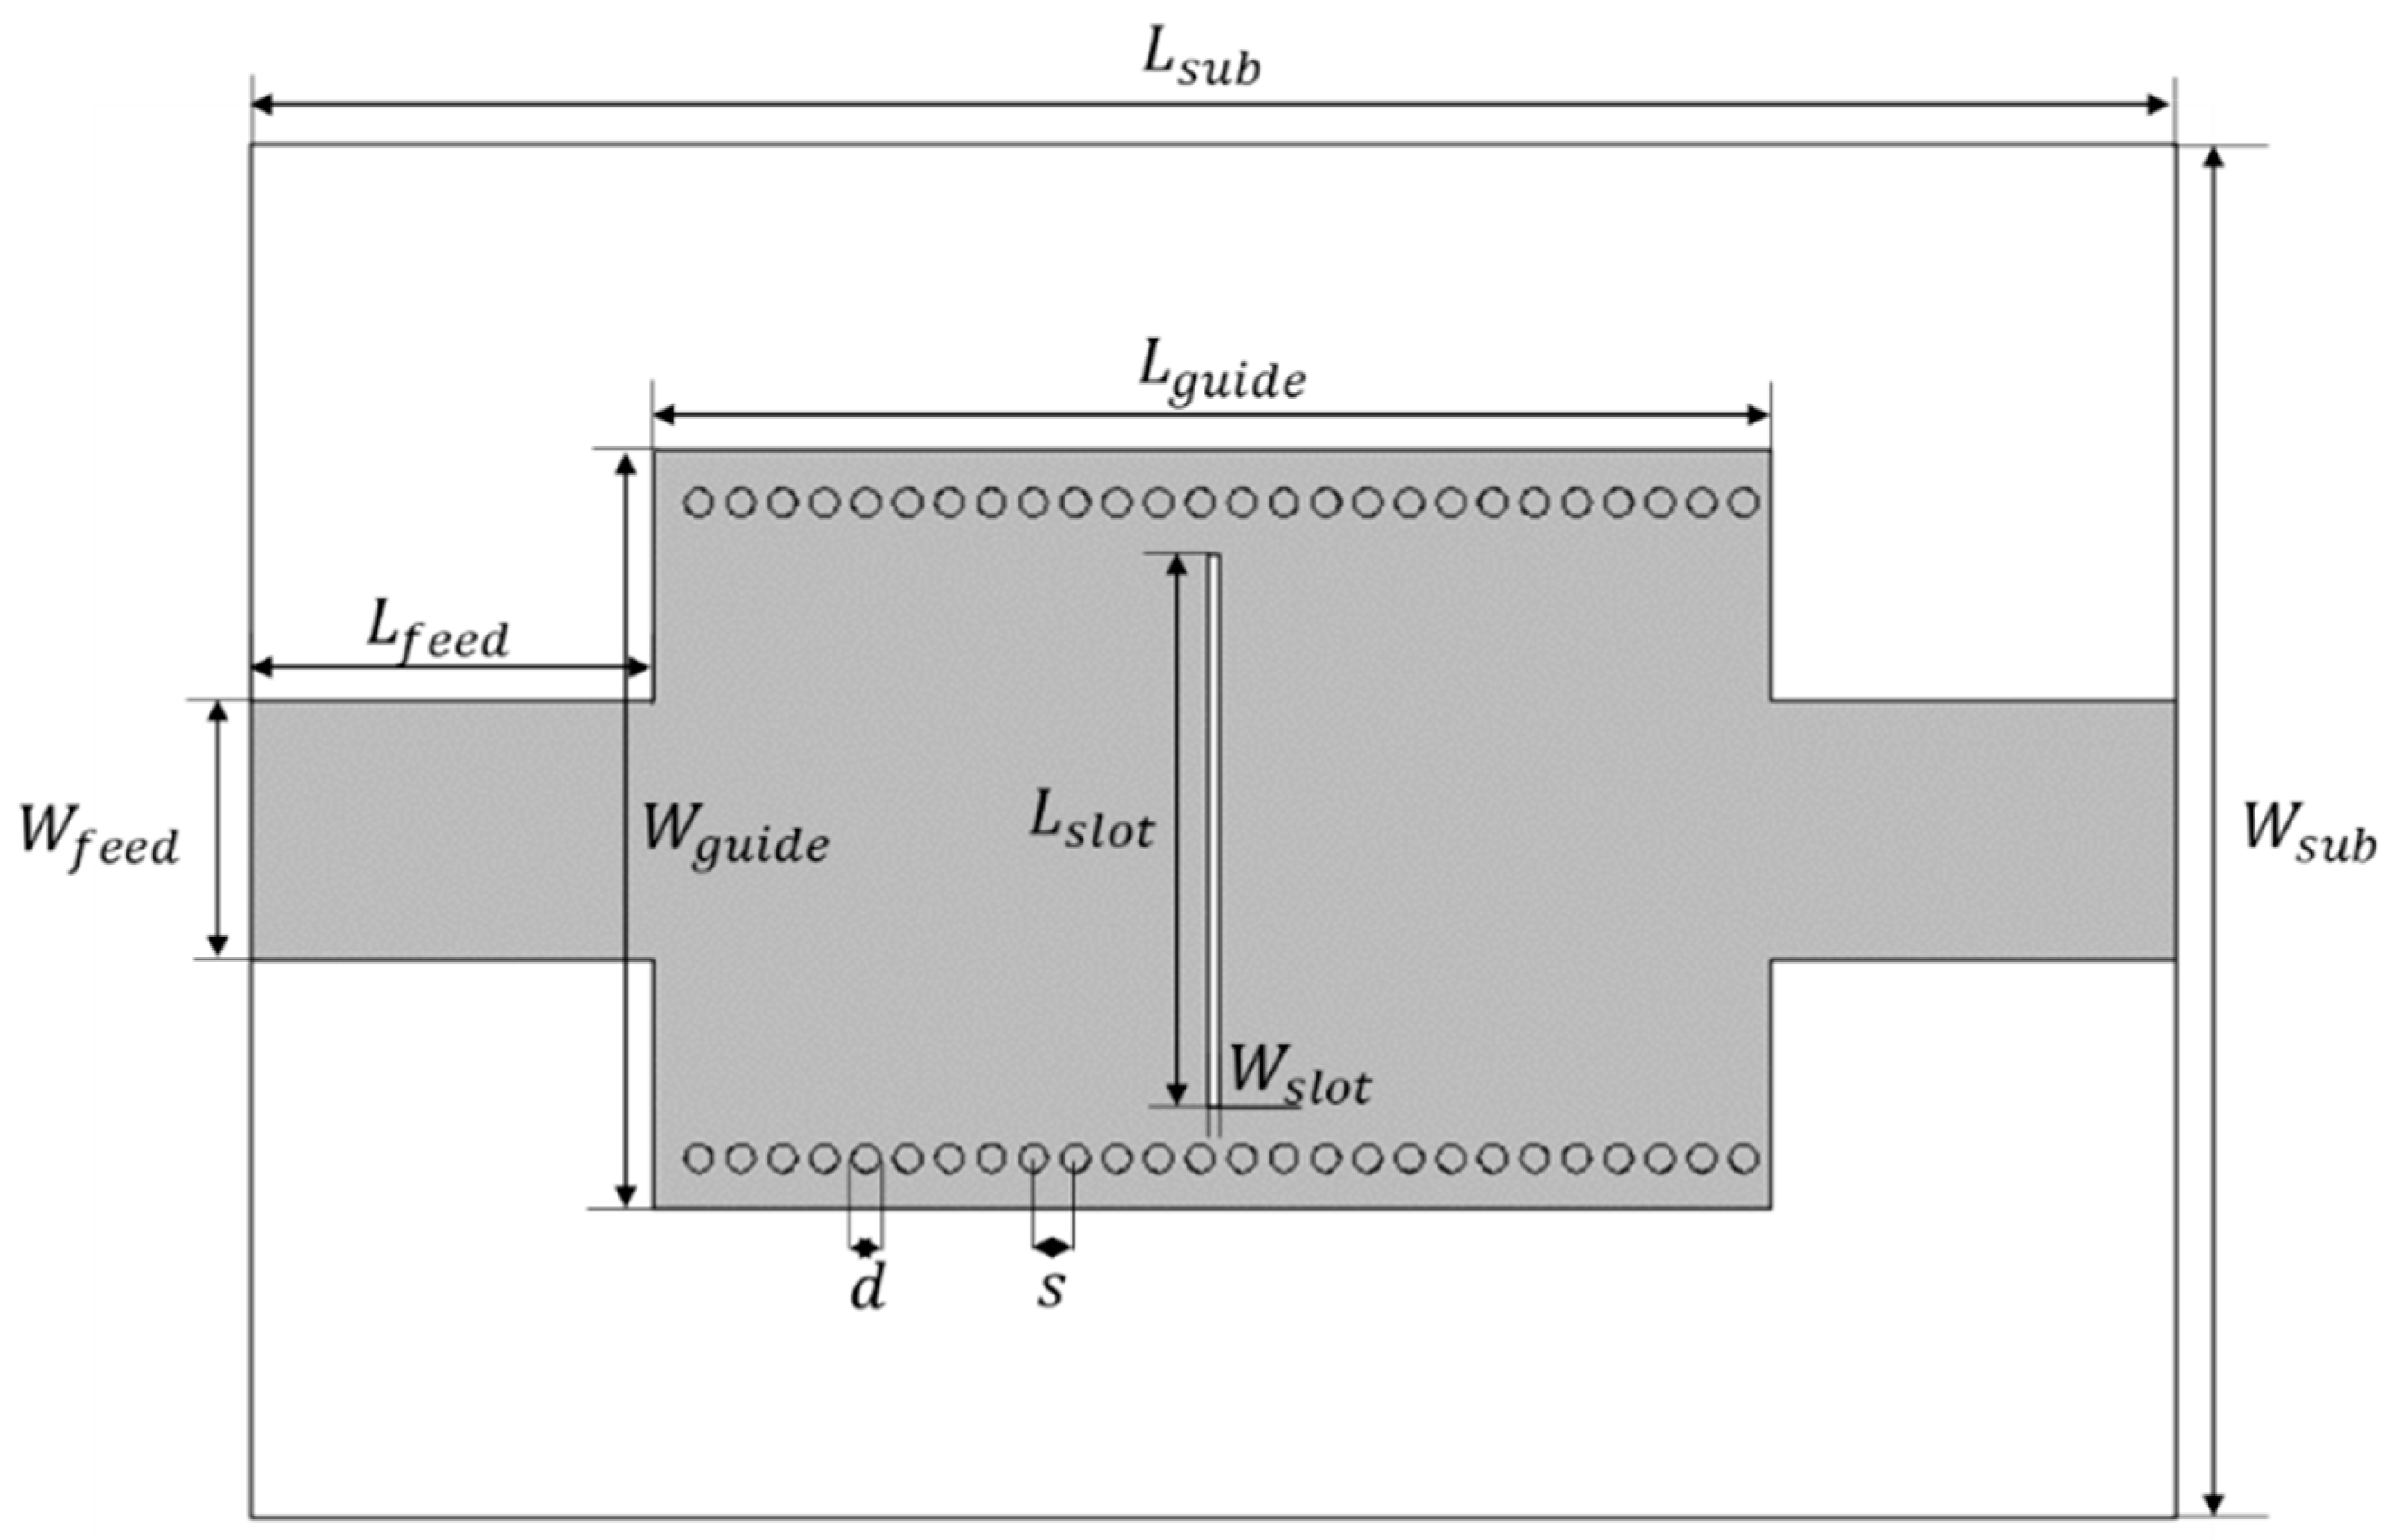
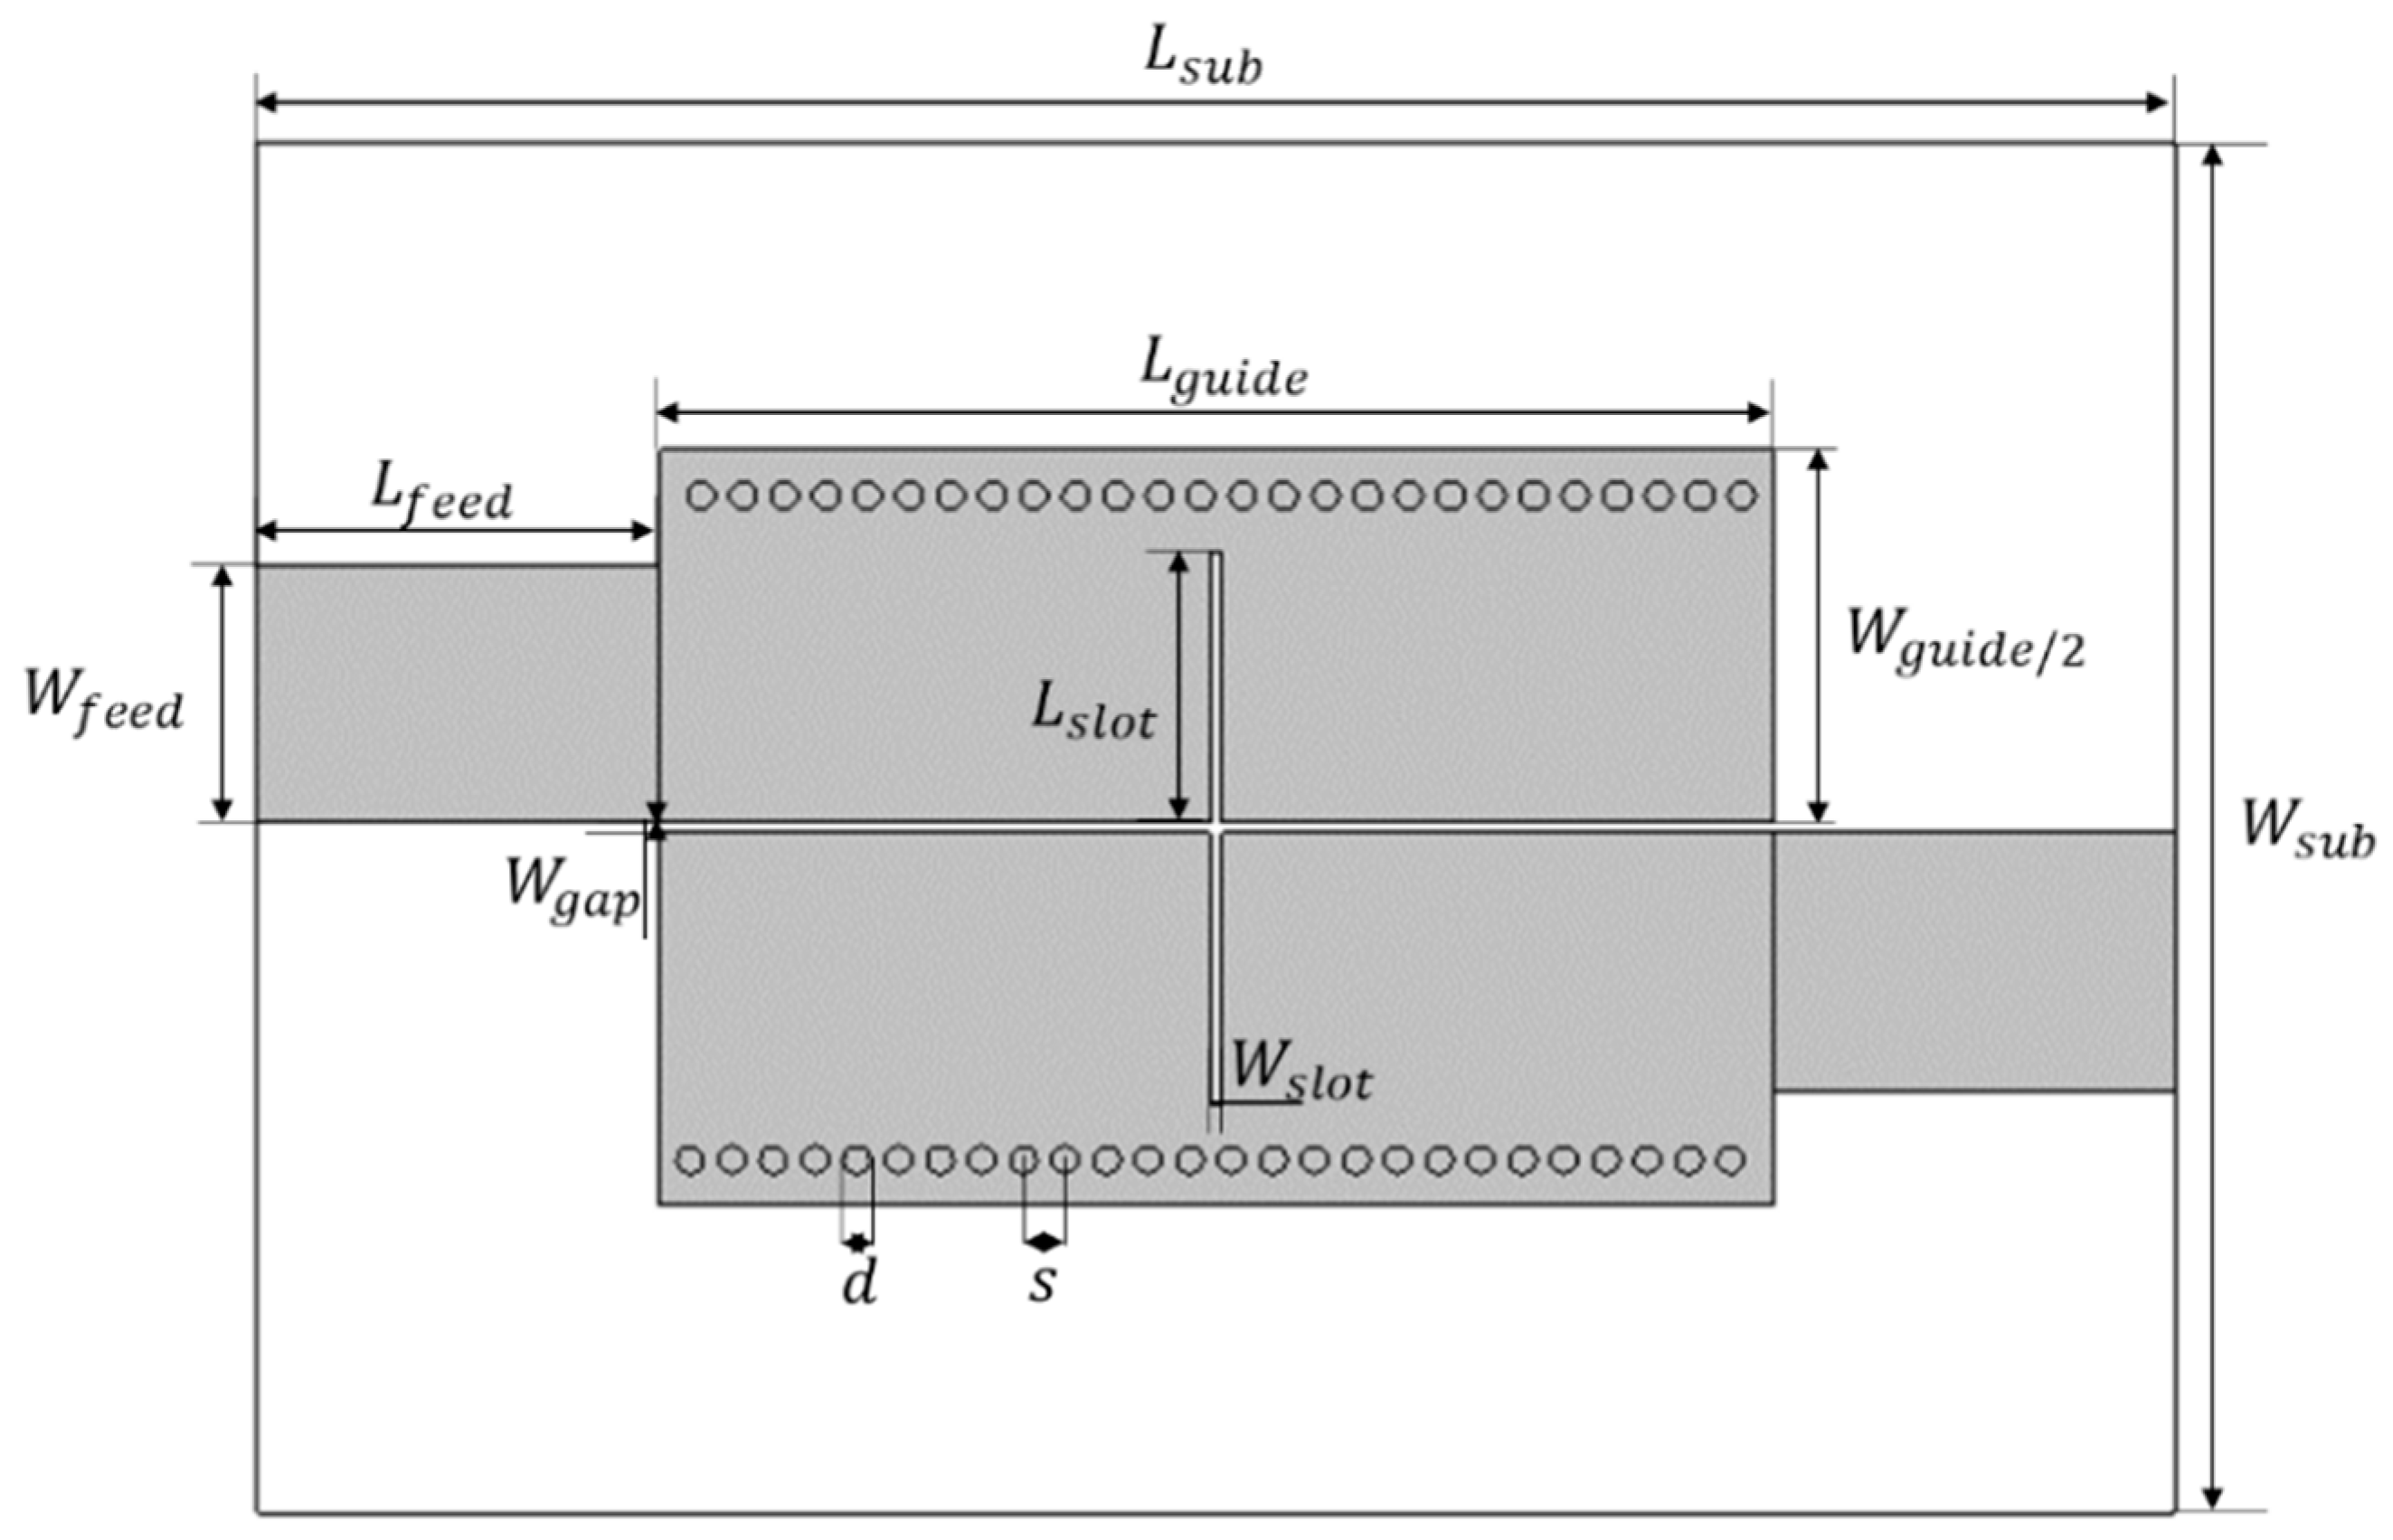
Figure 5.
Scheme of the designed single-slot SIW applicator in air.
Figure 5.
Scheme of the designed single-slot SIW applicator in air.
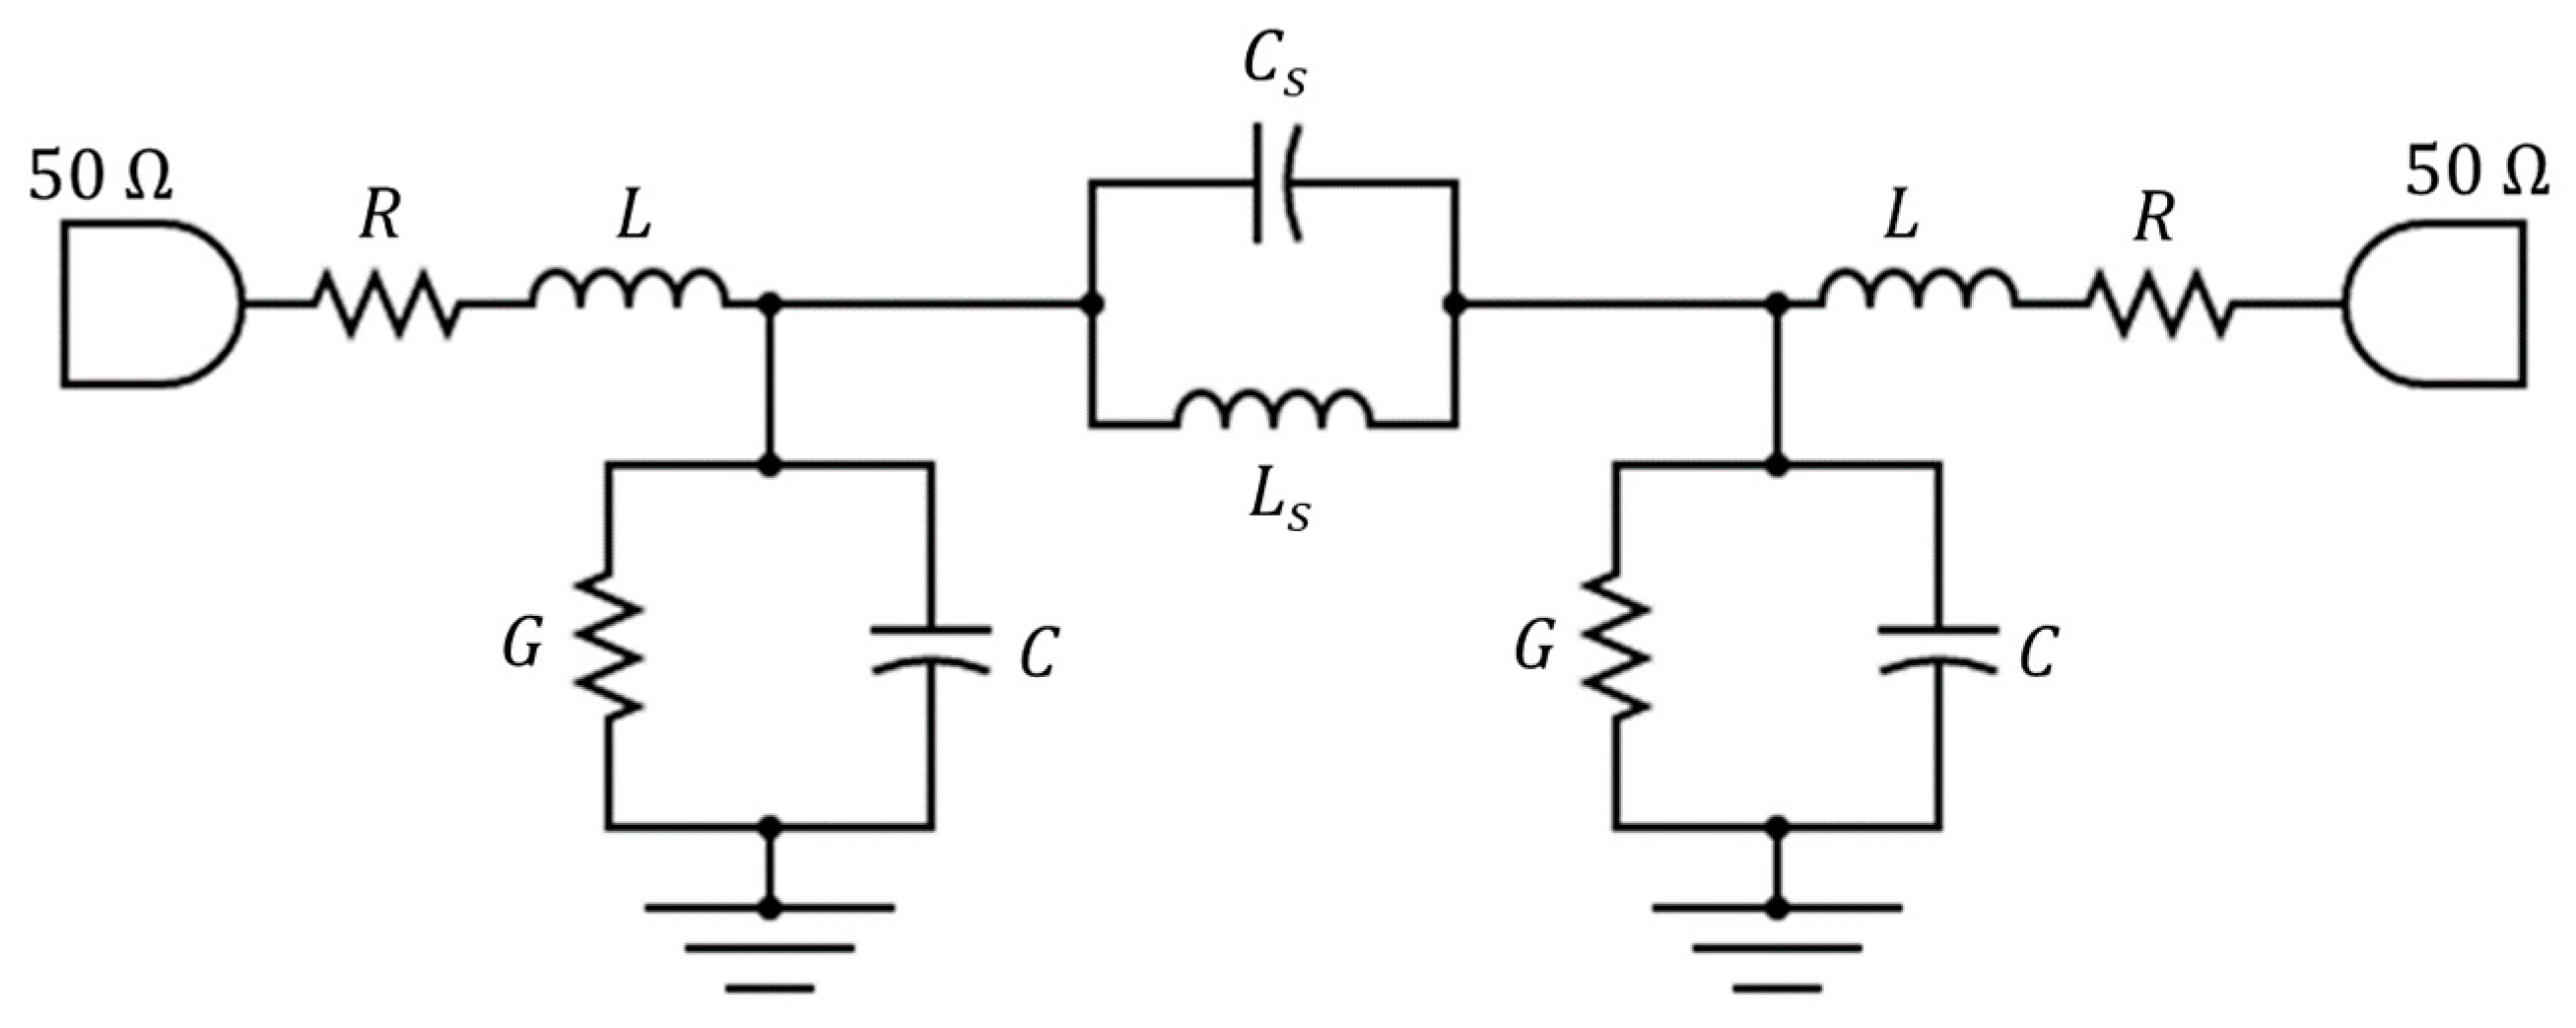
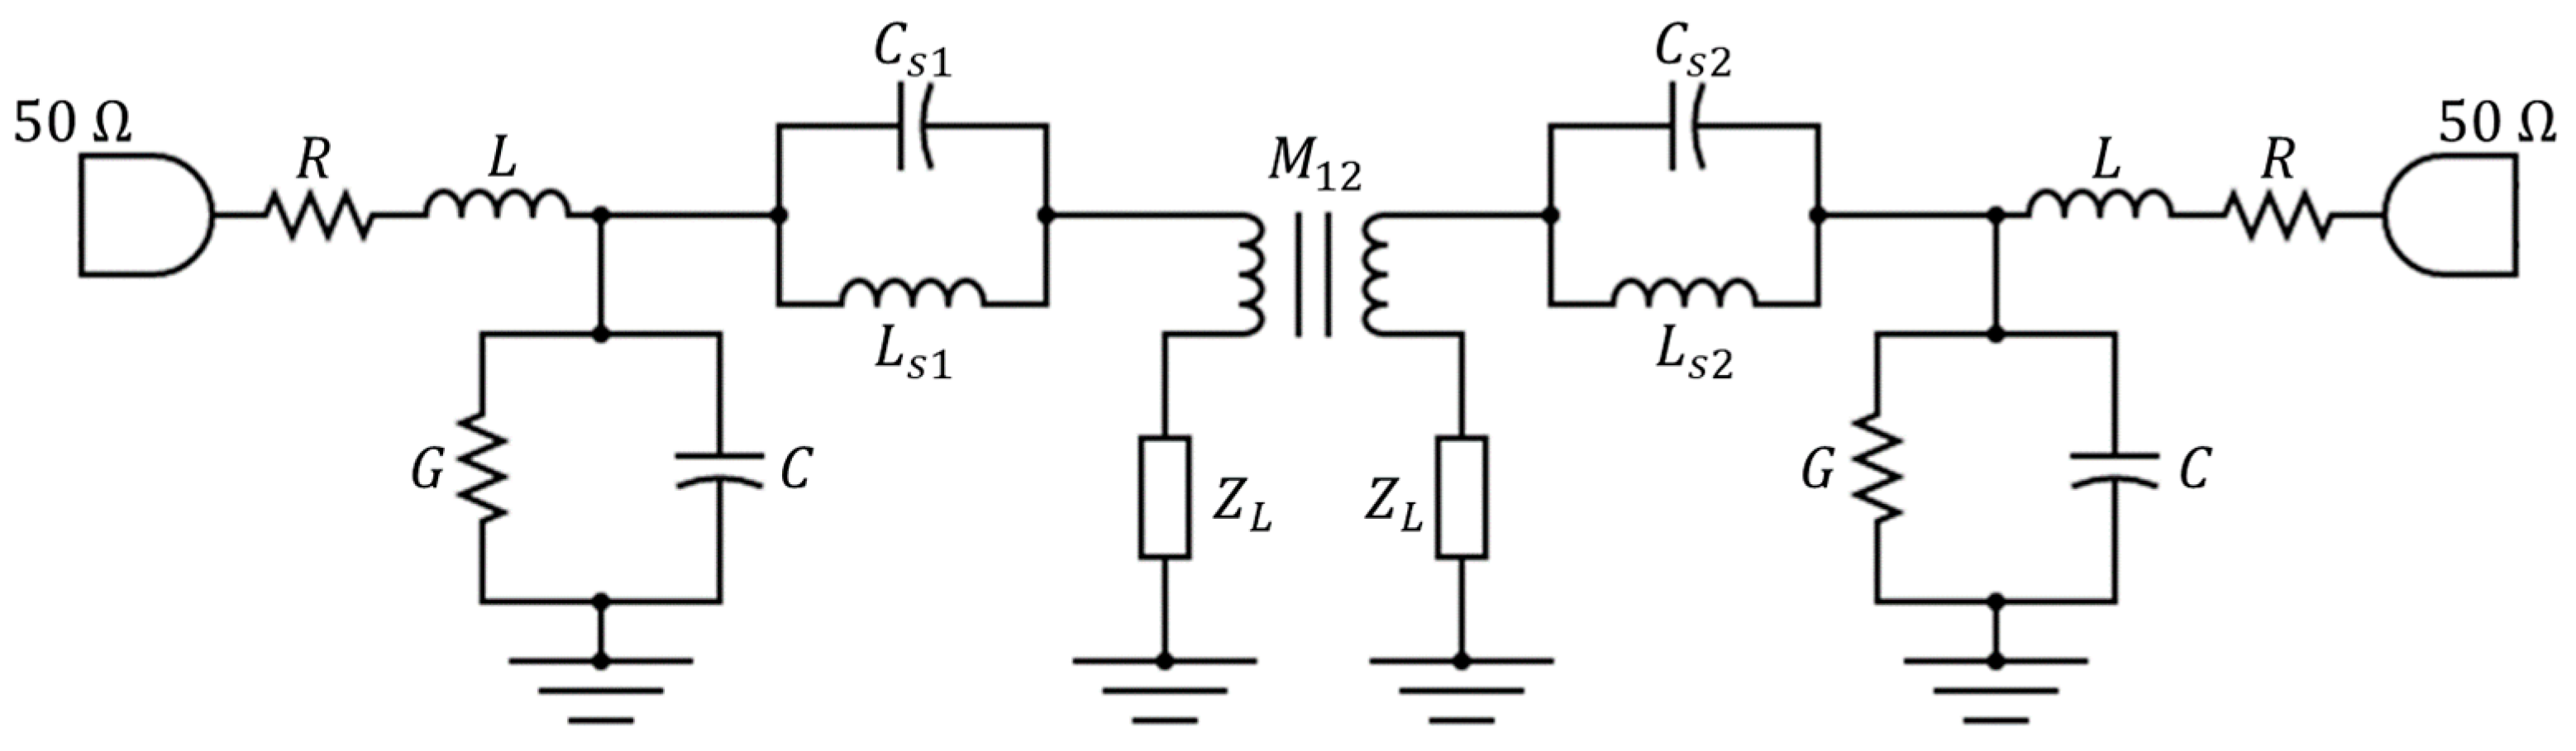
Figure 6.
Equivalent circuit of the single-slot SIW applicator.
Figure 6.
Equivalent circuit of the single-slot SIW applicator.
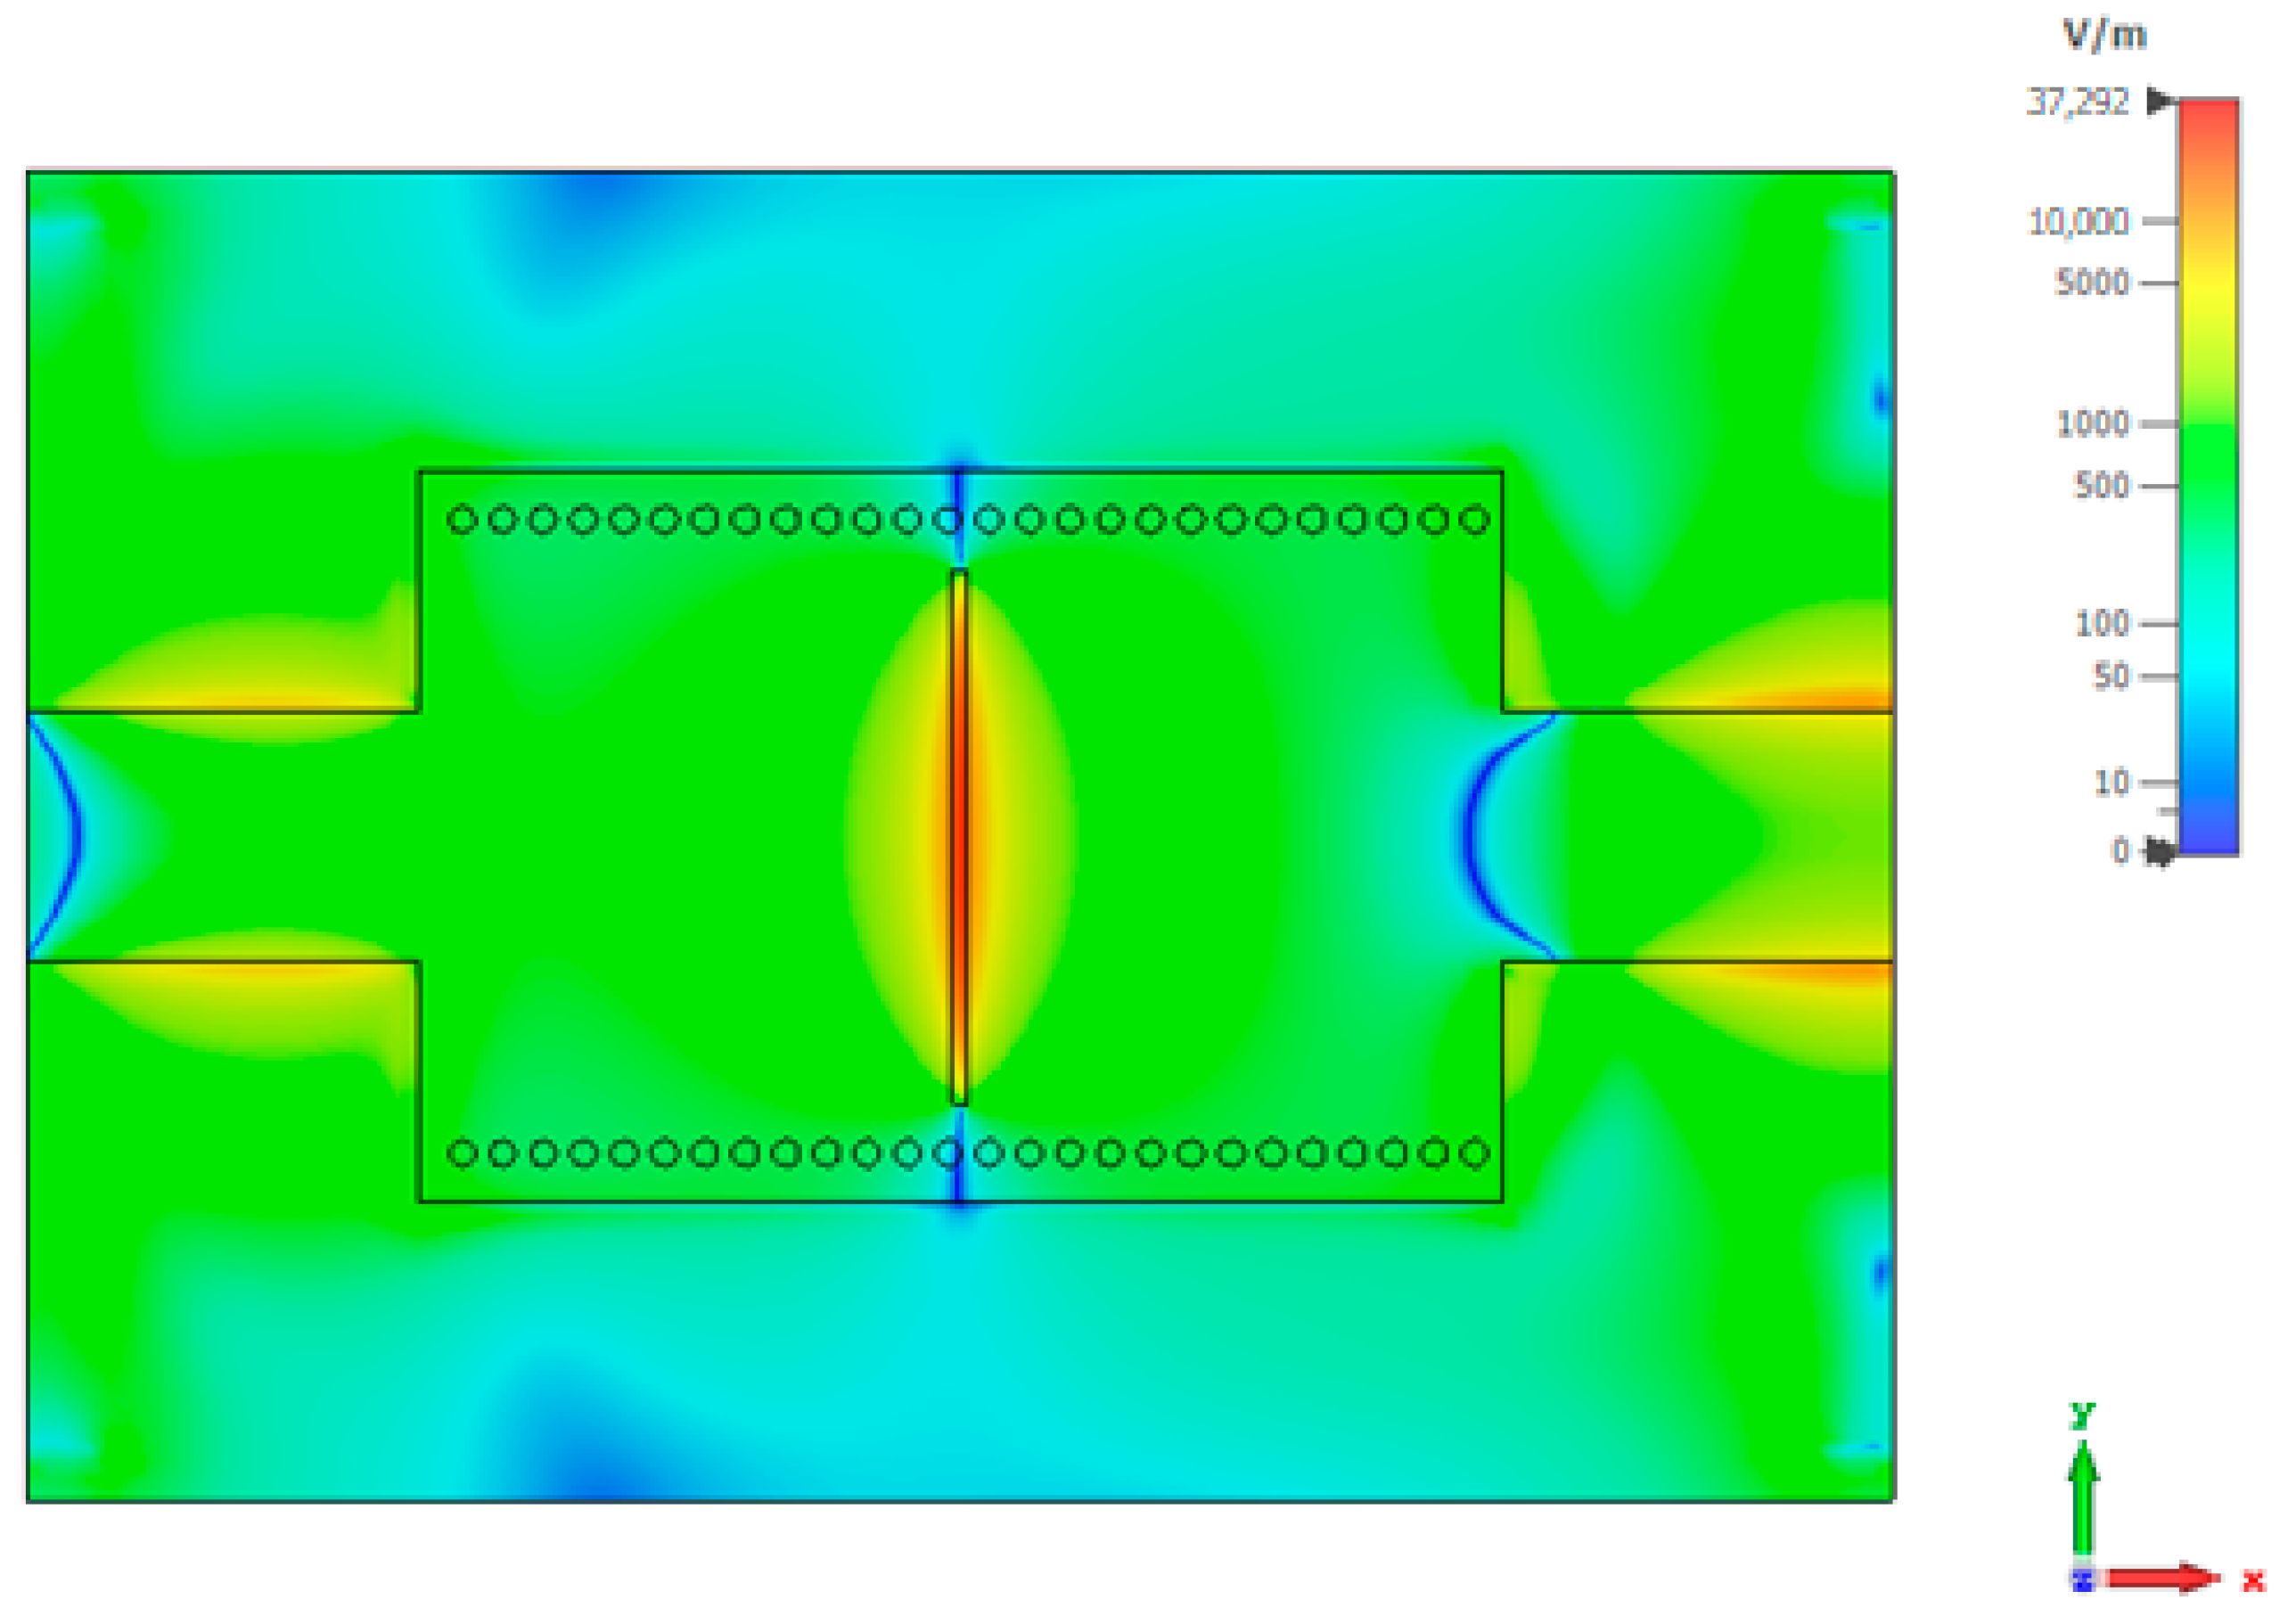
Figure 7.
Modulus of the electric field irradiated by the slot in the plane, single-slot SIW applicator in air.
Figure 7.
Modulus of the electric field irradiated by the slot in the plane, single-slot SIW applicator in air.
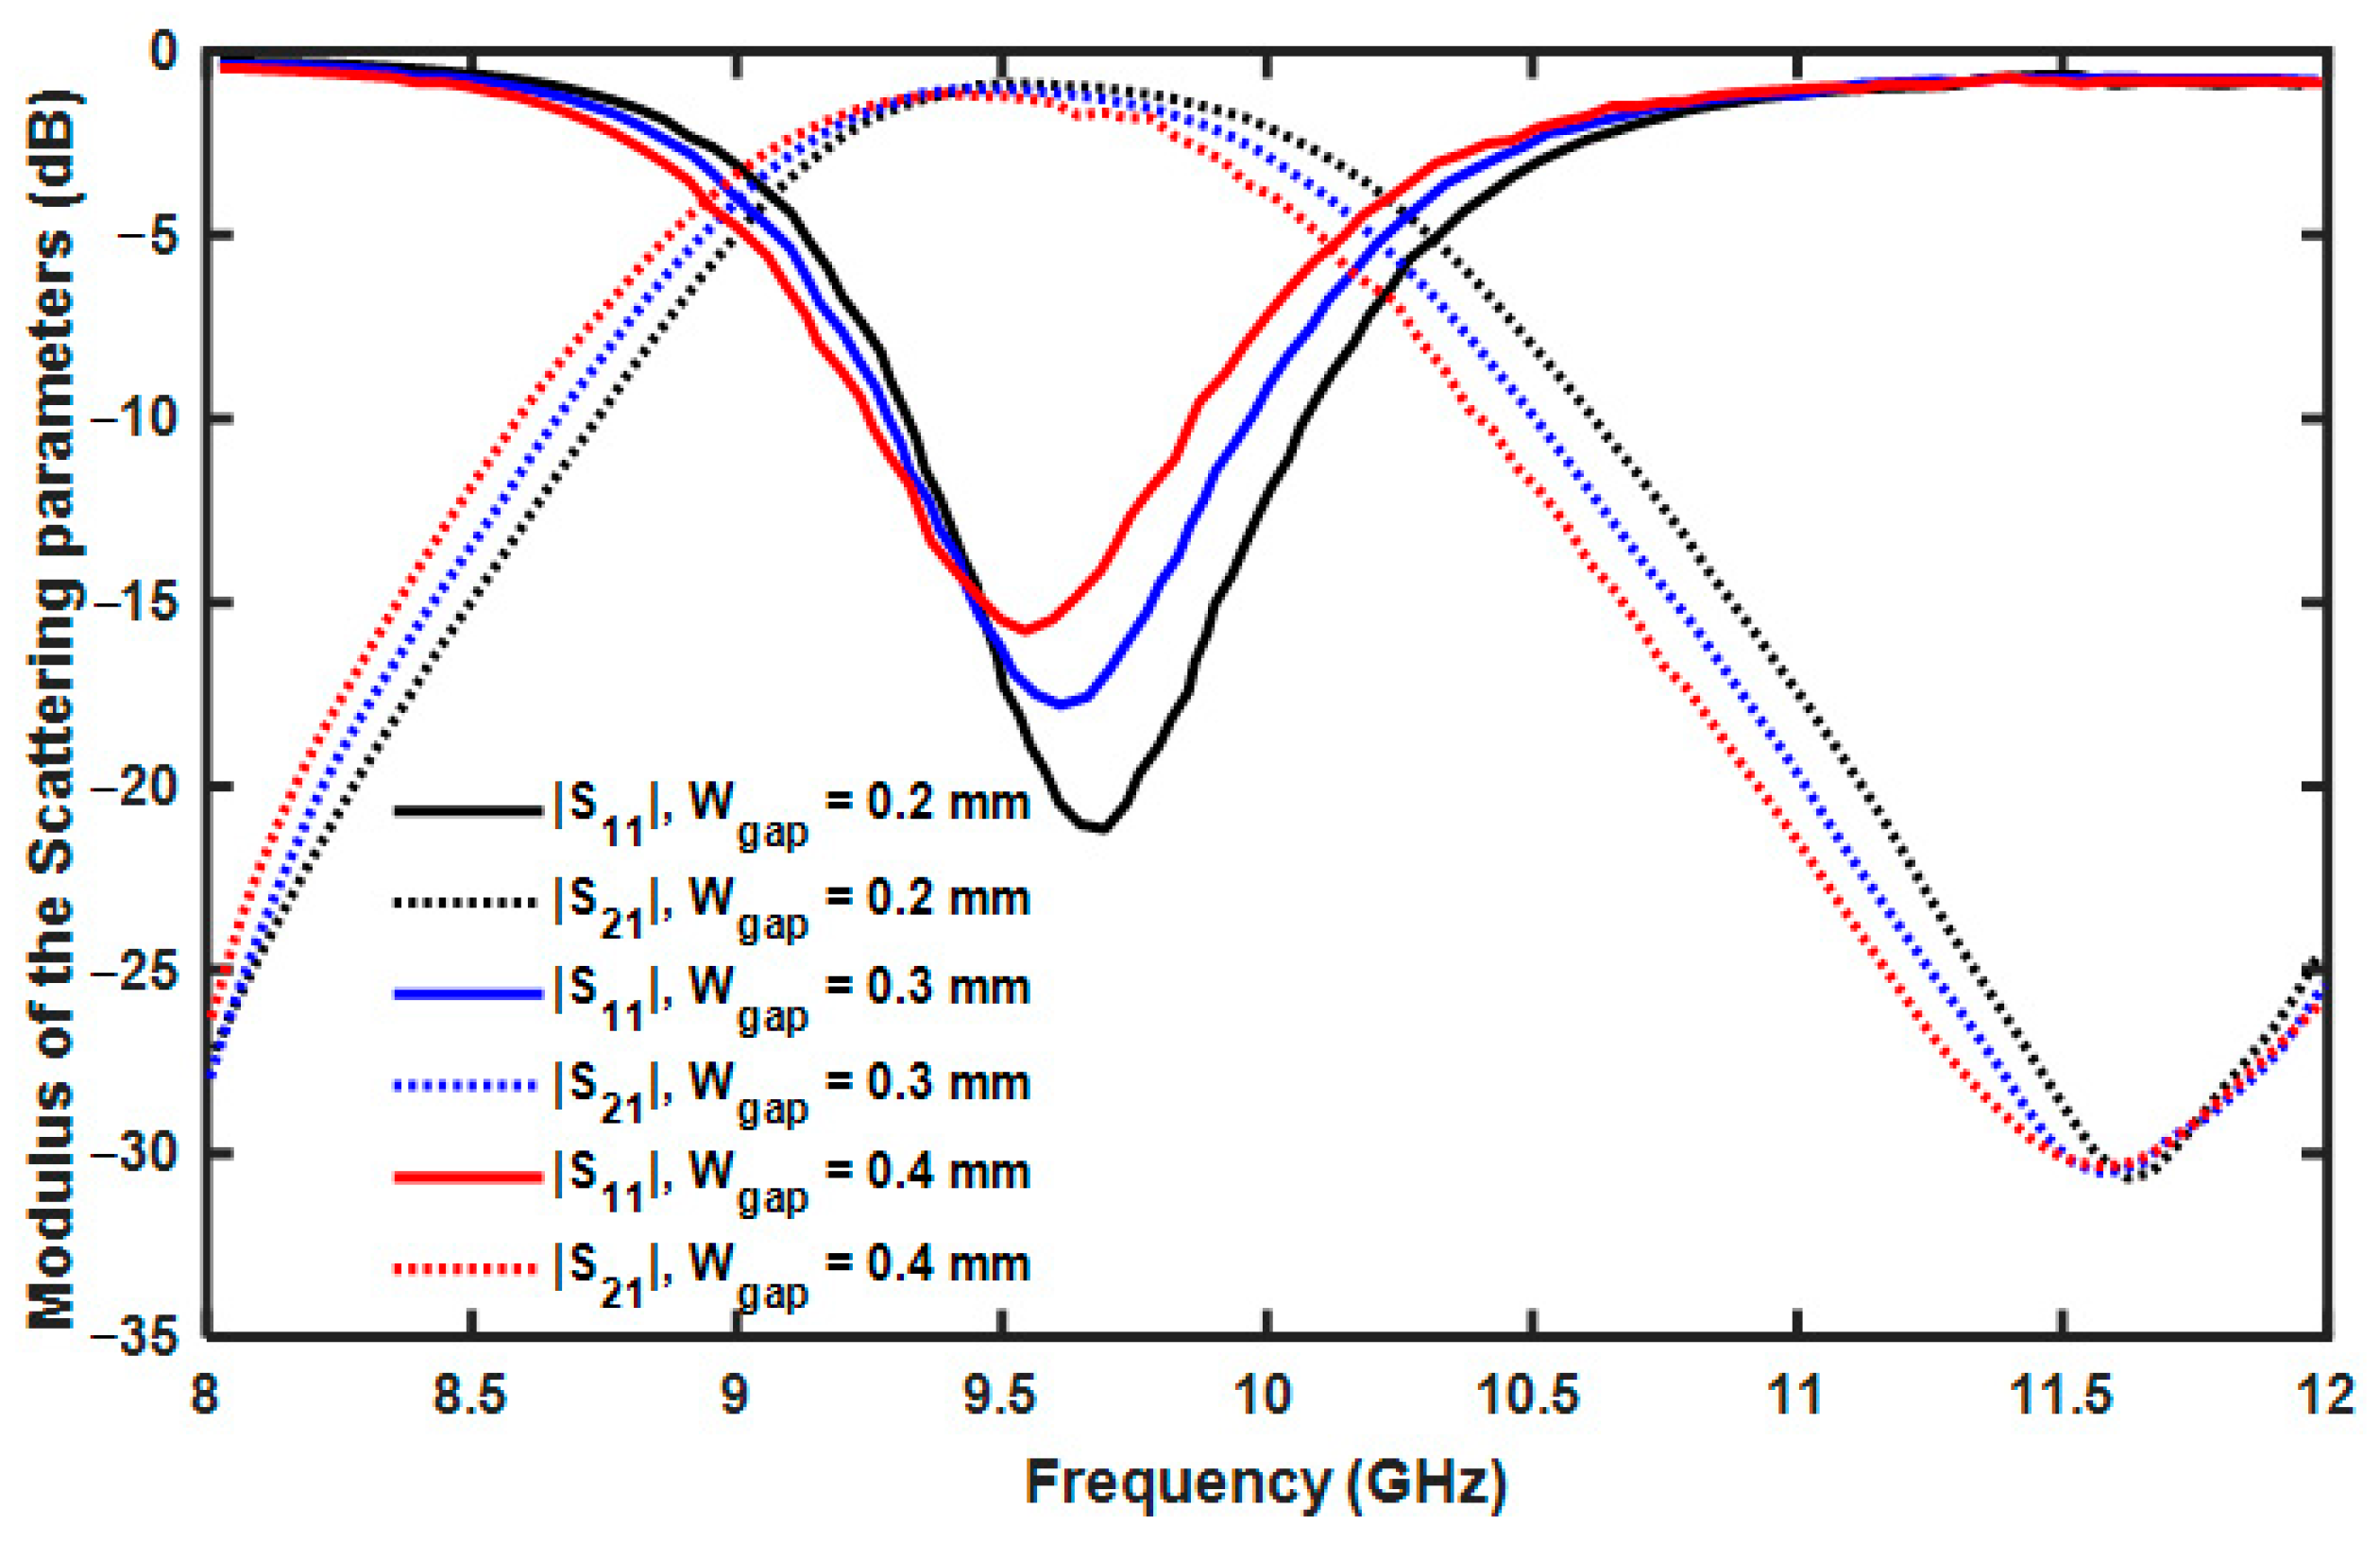
Figure 8.
Modulus of the scattering parameters (solid curves) and (dotted curves) as a function of frequency for different values of the slot width .
Figure 8.
Modulus of the scattering parameters (solid curves) and (dotted curves) as a function of frequency for different values of the slot width .
Figure 9.
Scheme of the designed cross-slot SIW applicator.
Figure 9.
Scheme of the designed cross-slot SIW applicator.
Figure 10.
Equivalent circuit of the cross slot SIW applicator.
Figure 10.
Equivalent circuit of the cross slot SIW applicator.
Figure 11.
Modulus of the simulated scattering parameters (solid curves) and (dotted curves) as a function of the frequency for different values of .
Figure 11.
Modulus of the simulated scattering parameters (solid curves) and (dotted curves) as a function of the frequency for different values of .
Figure 12.
Cross-slot SIW applicator. Modulus of the simulated scattering parameters (solid curves) and (dotted curves) as a function of the frequency for air (black curves) and pure diesel (blue curves) backgrounds.
Figure 12.
Cross-slot SIW applicator. Modulus of the simulated scattering parameters (solid curves) and (dotted curves) as a function of the frequency for air (black curves) and pure diesel (blue curves) backgrounds.
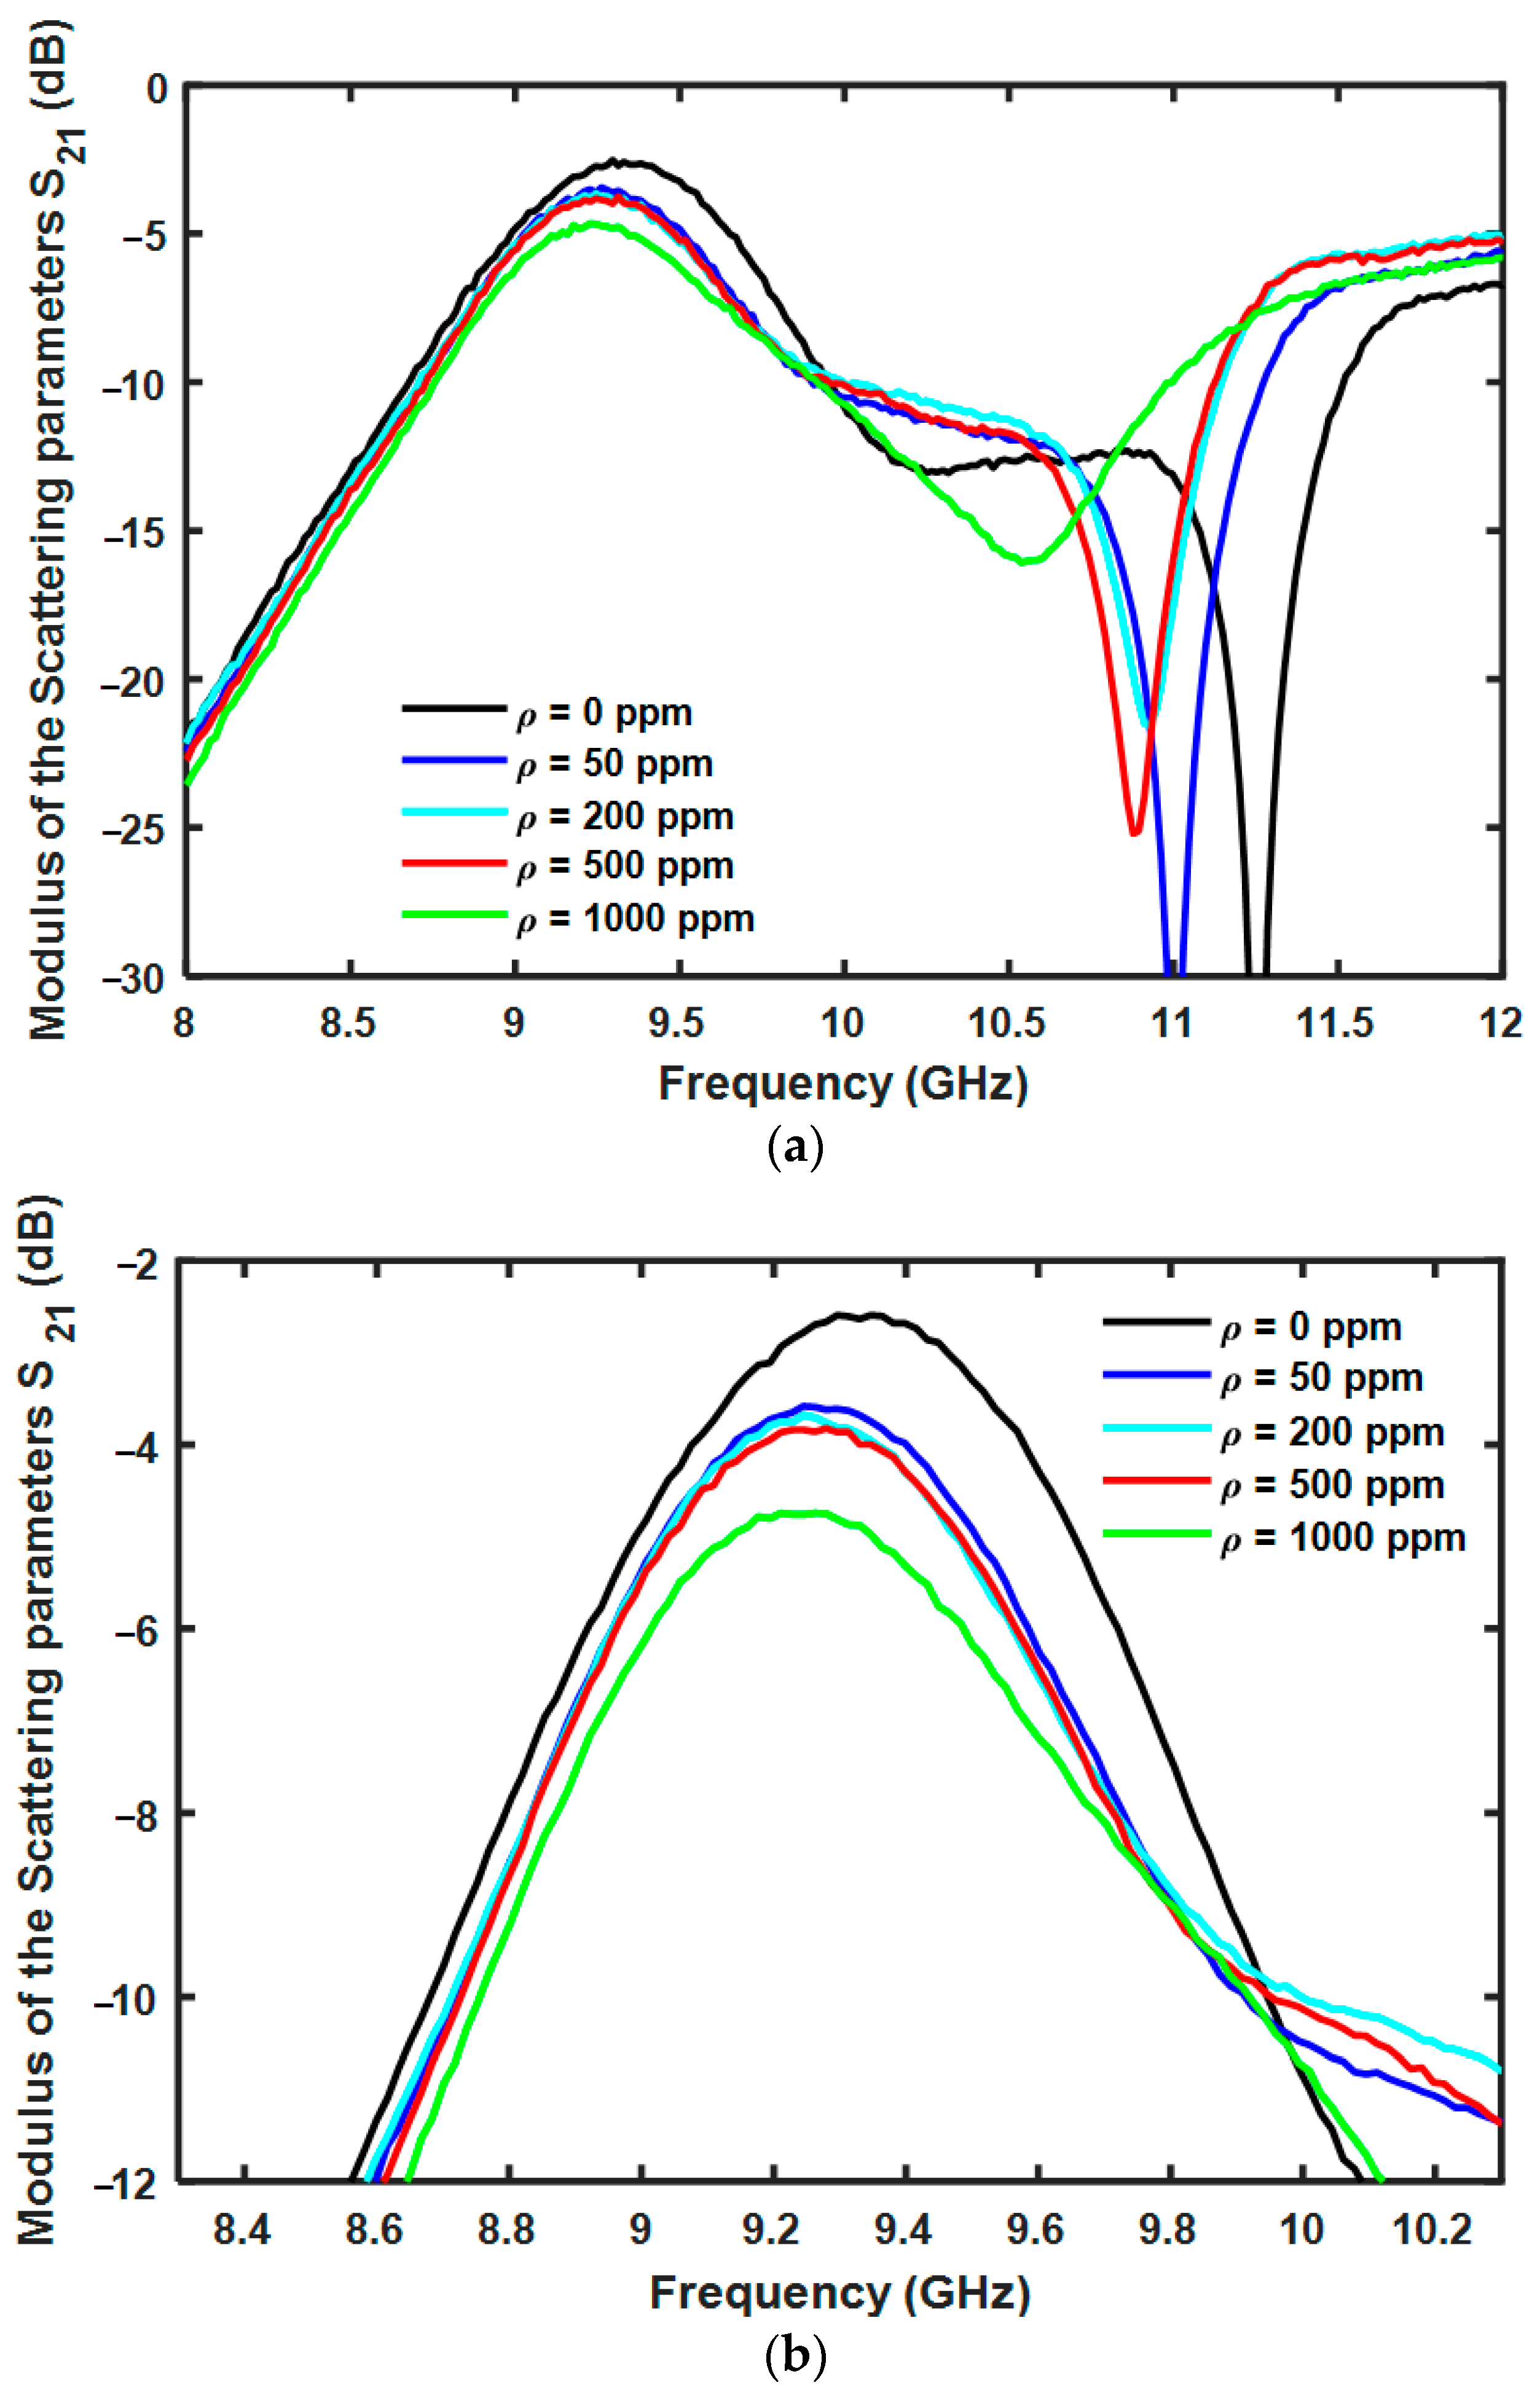
Figure 13.
Cross-slot SIW applicator. (a) Modulus of the simulated scattering parameters as a function of the frequency for different water concentrations. (b) Zoom around .
Figure 13.
Cross-slot SIW applicator. (a) Modulus of the simulated scattering parameters as a function of the frequency for different water concentrations. (b) Zoom around .
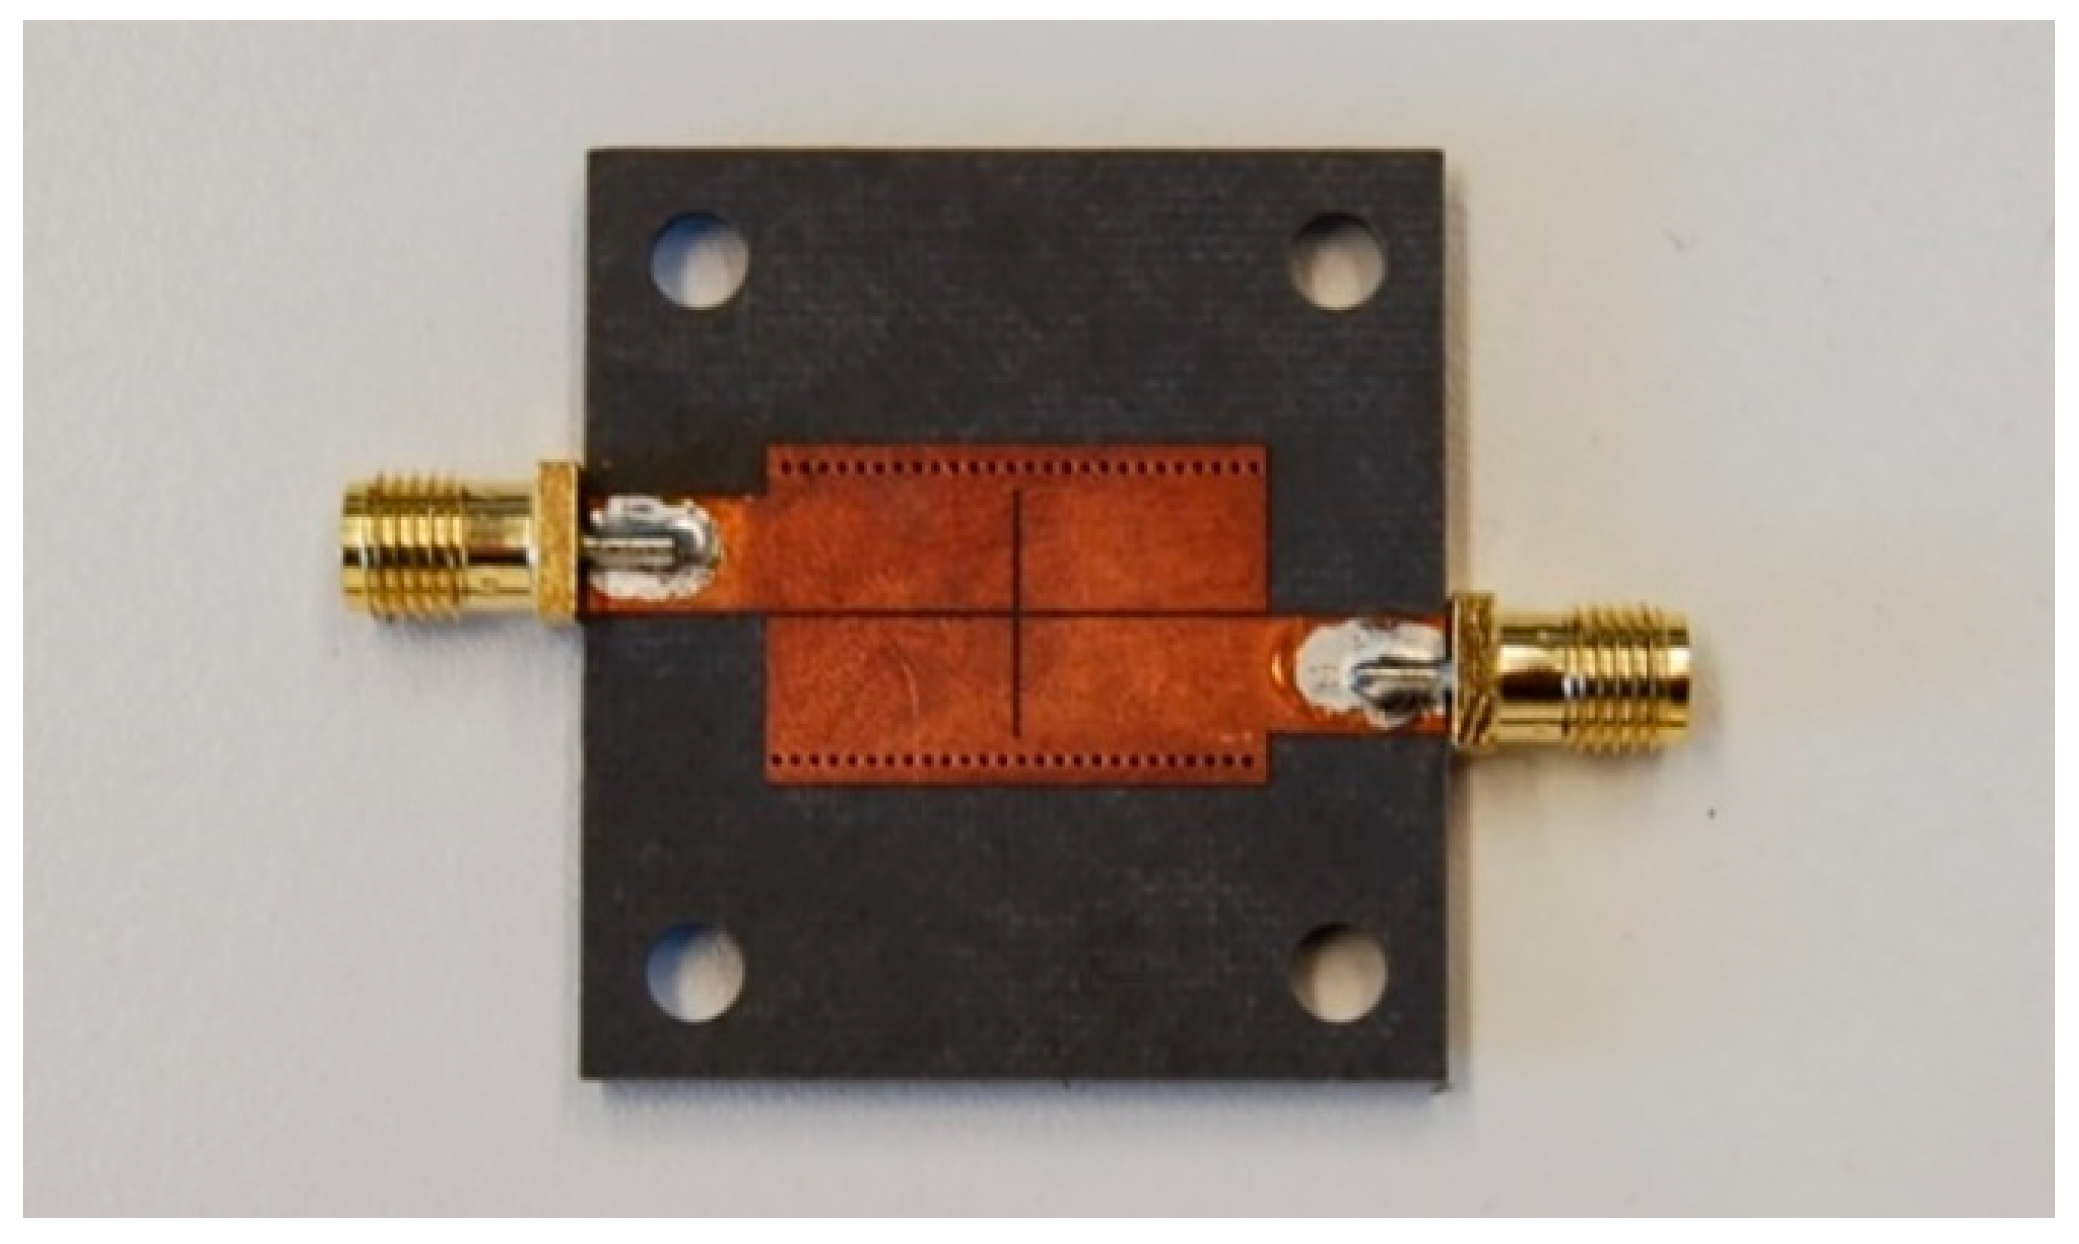
Figure 14.
Constructed cross-slot SIW applicator.
Figure 14.
Constructed cross-slot SIW applicator.
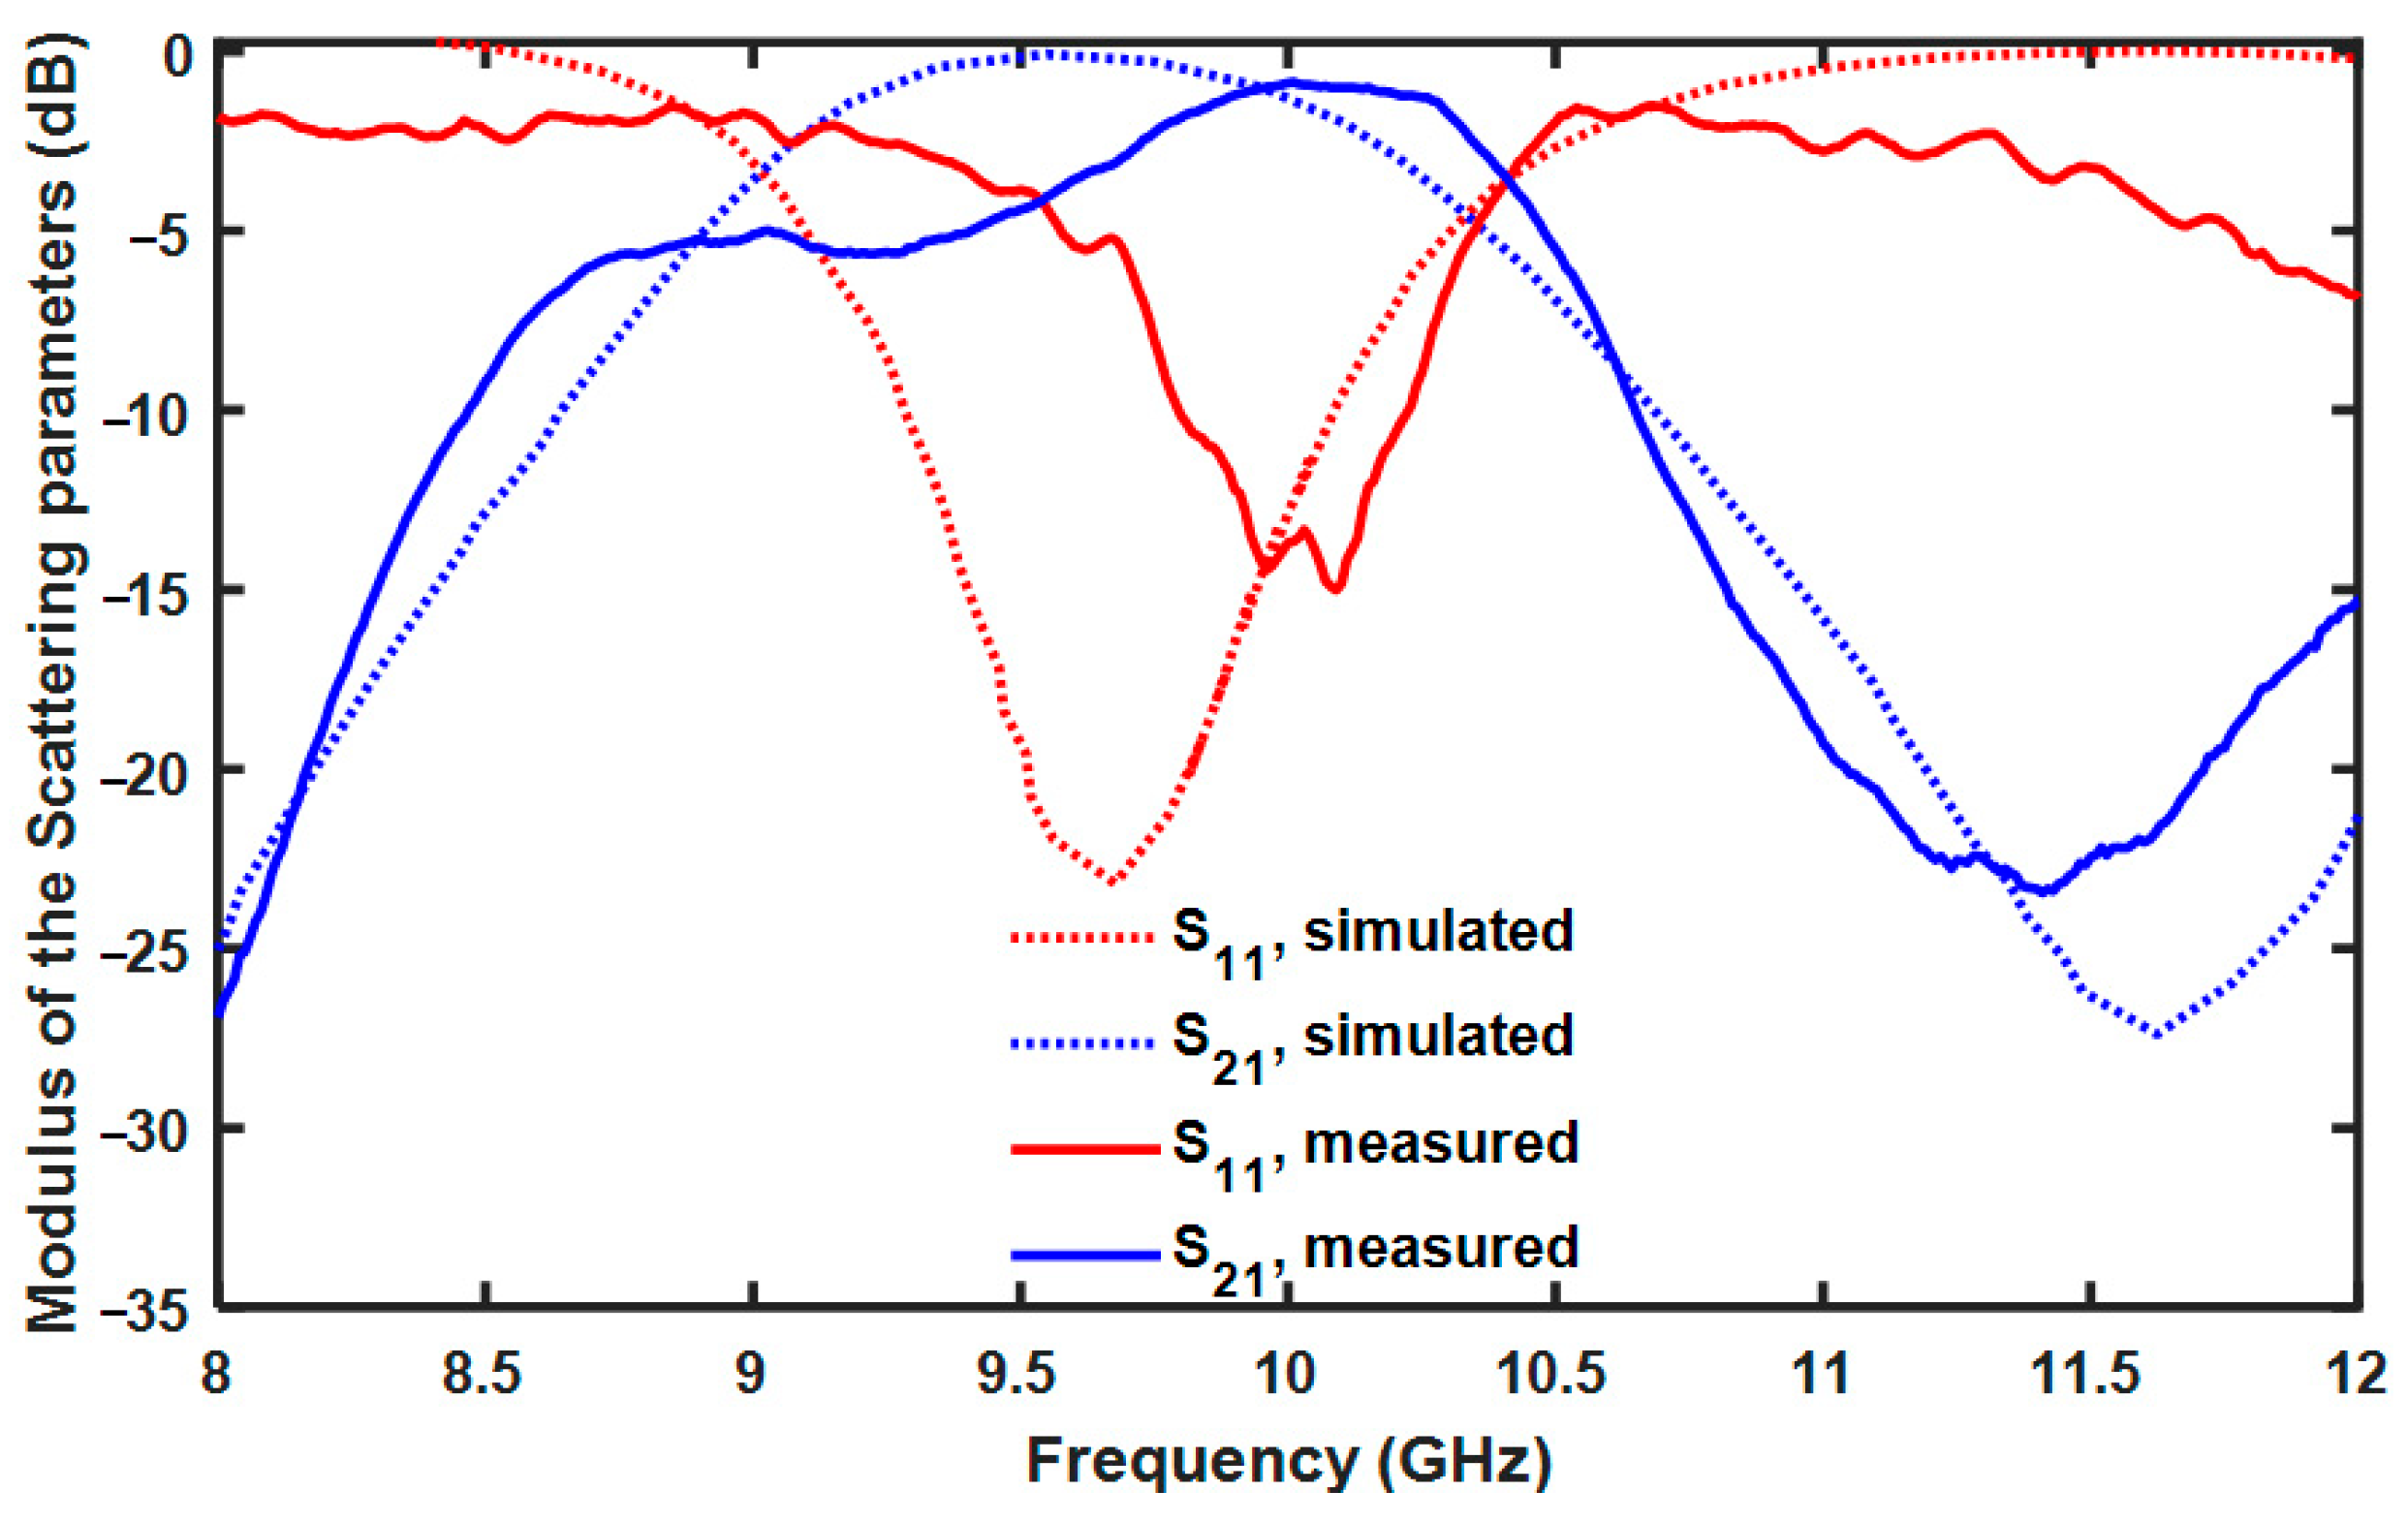
Figure 15.
Cross-slot SIW. Modulus of the scattering parameters and as a function of the frequency for measured (solid curves) and simulated (dotted curves).
Figure 15.
Cross-slot SIW. Modulus of the scattering parameters and as a function of the frequency for measured (solid curves) and simulated (dotted curves).
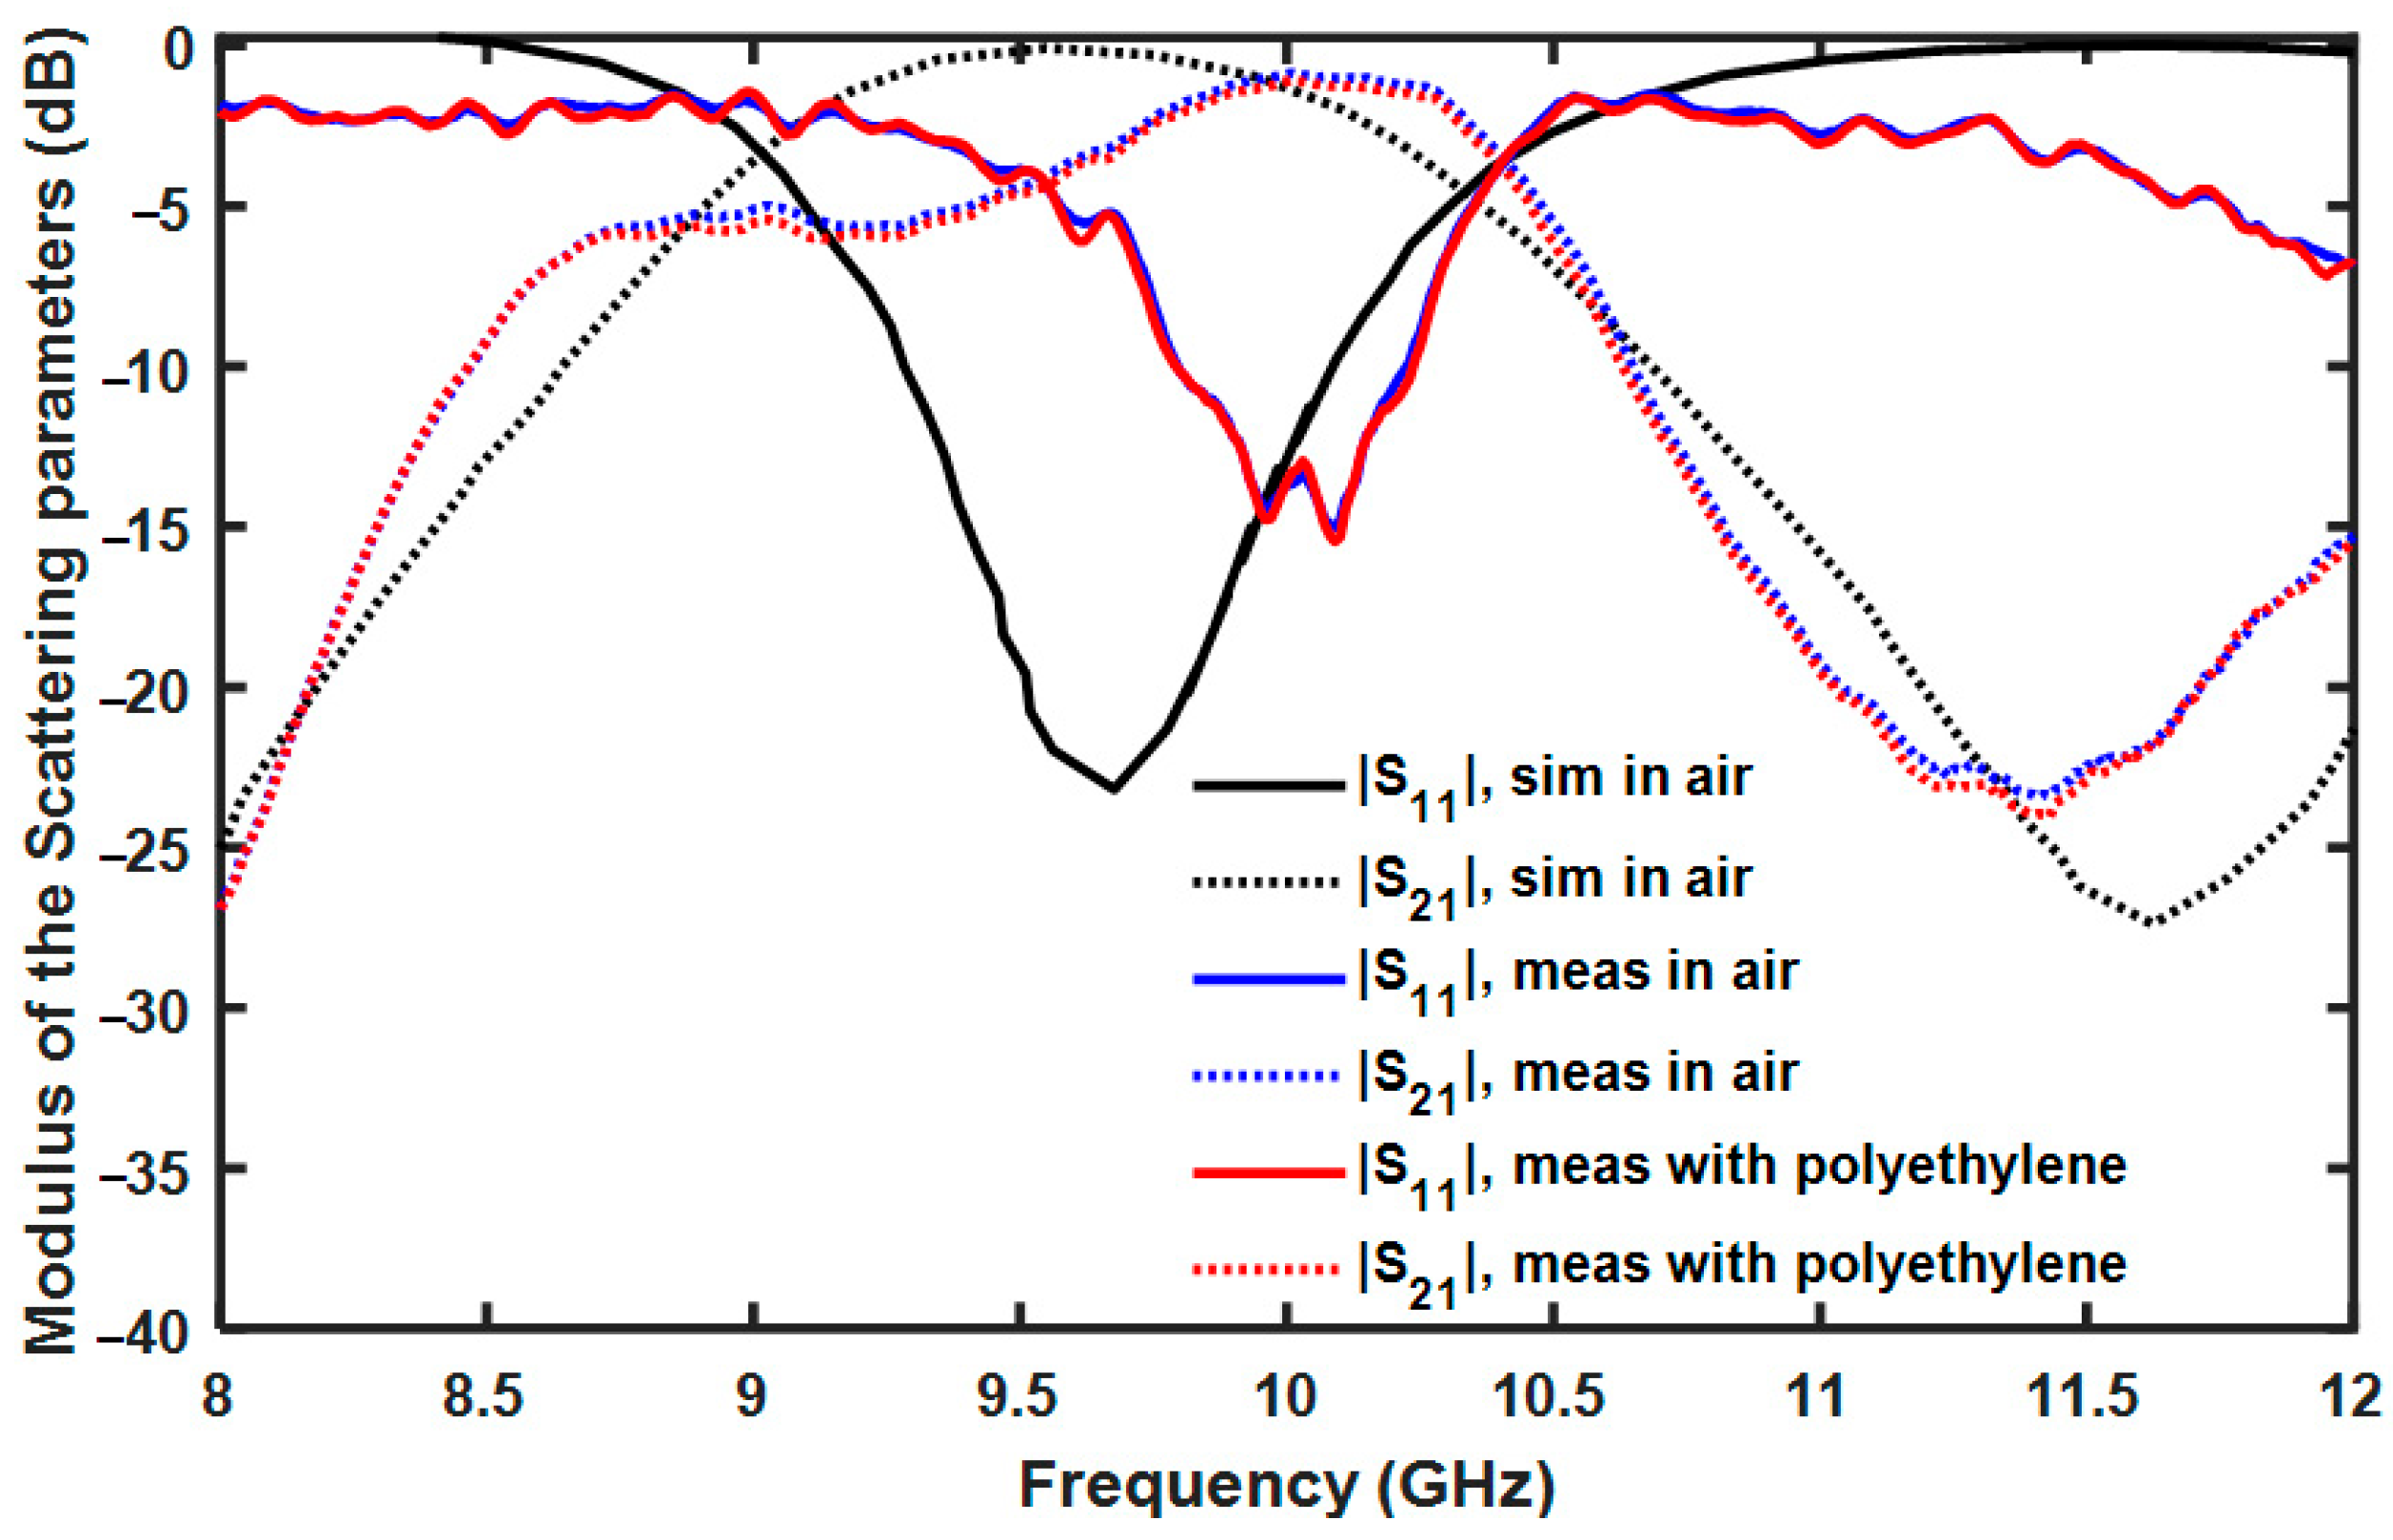
Figure 16.
Cross-slot SIW. Modulus of the scattering parameters (solid curves) and (dotted curves) as a function of the frequency measured in air (blue curves), measured with polyethylene (red curve), and simulated (black curves).
Figure 16.
Cross-slot SIW. Modulus of the scattering parameters (solid curves) and (dotted curves) as a function of the frequency measured in air (blue curves), measured with polyethylene (red curve), and simulated (black curves).
Figure 17.
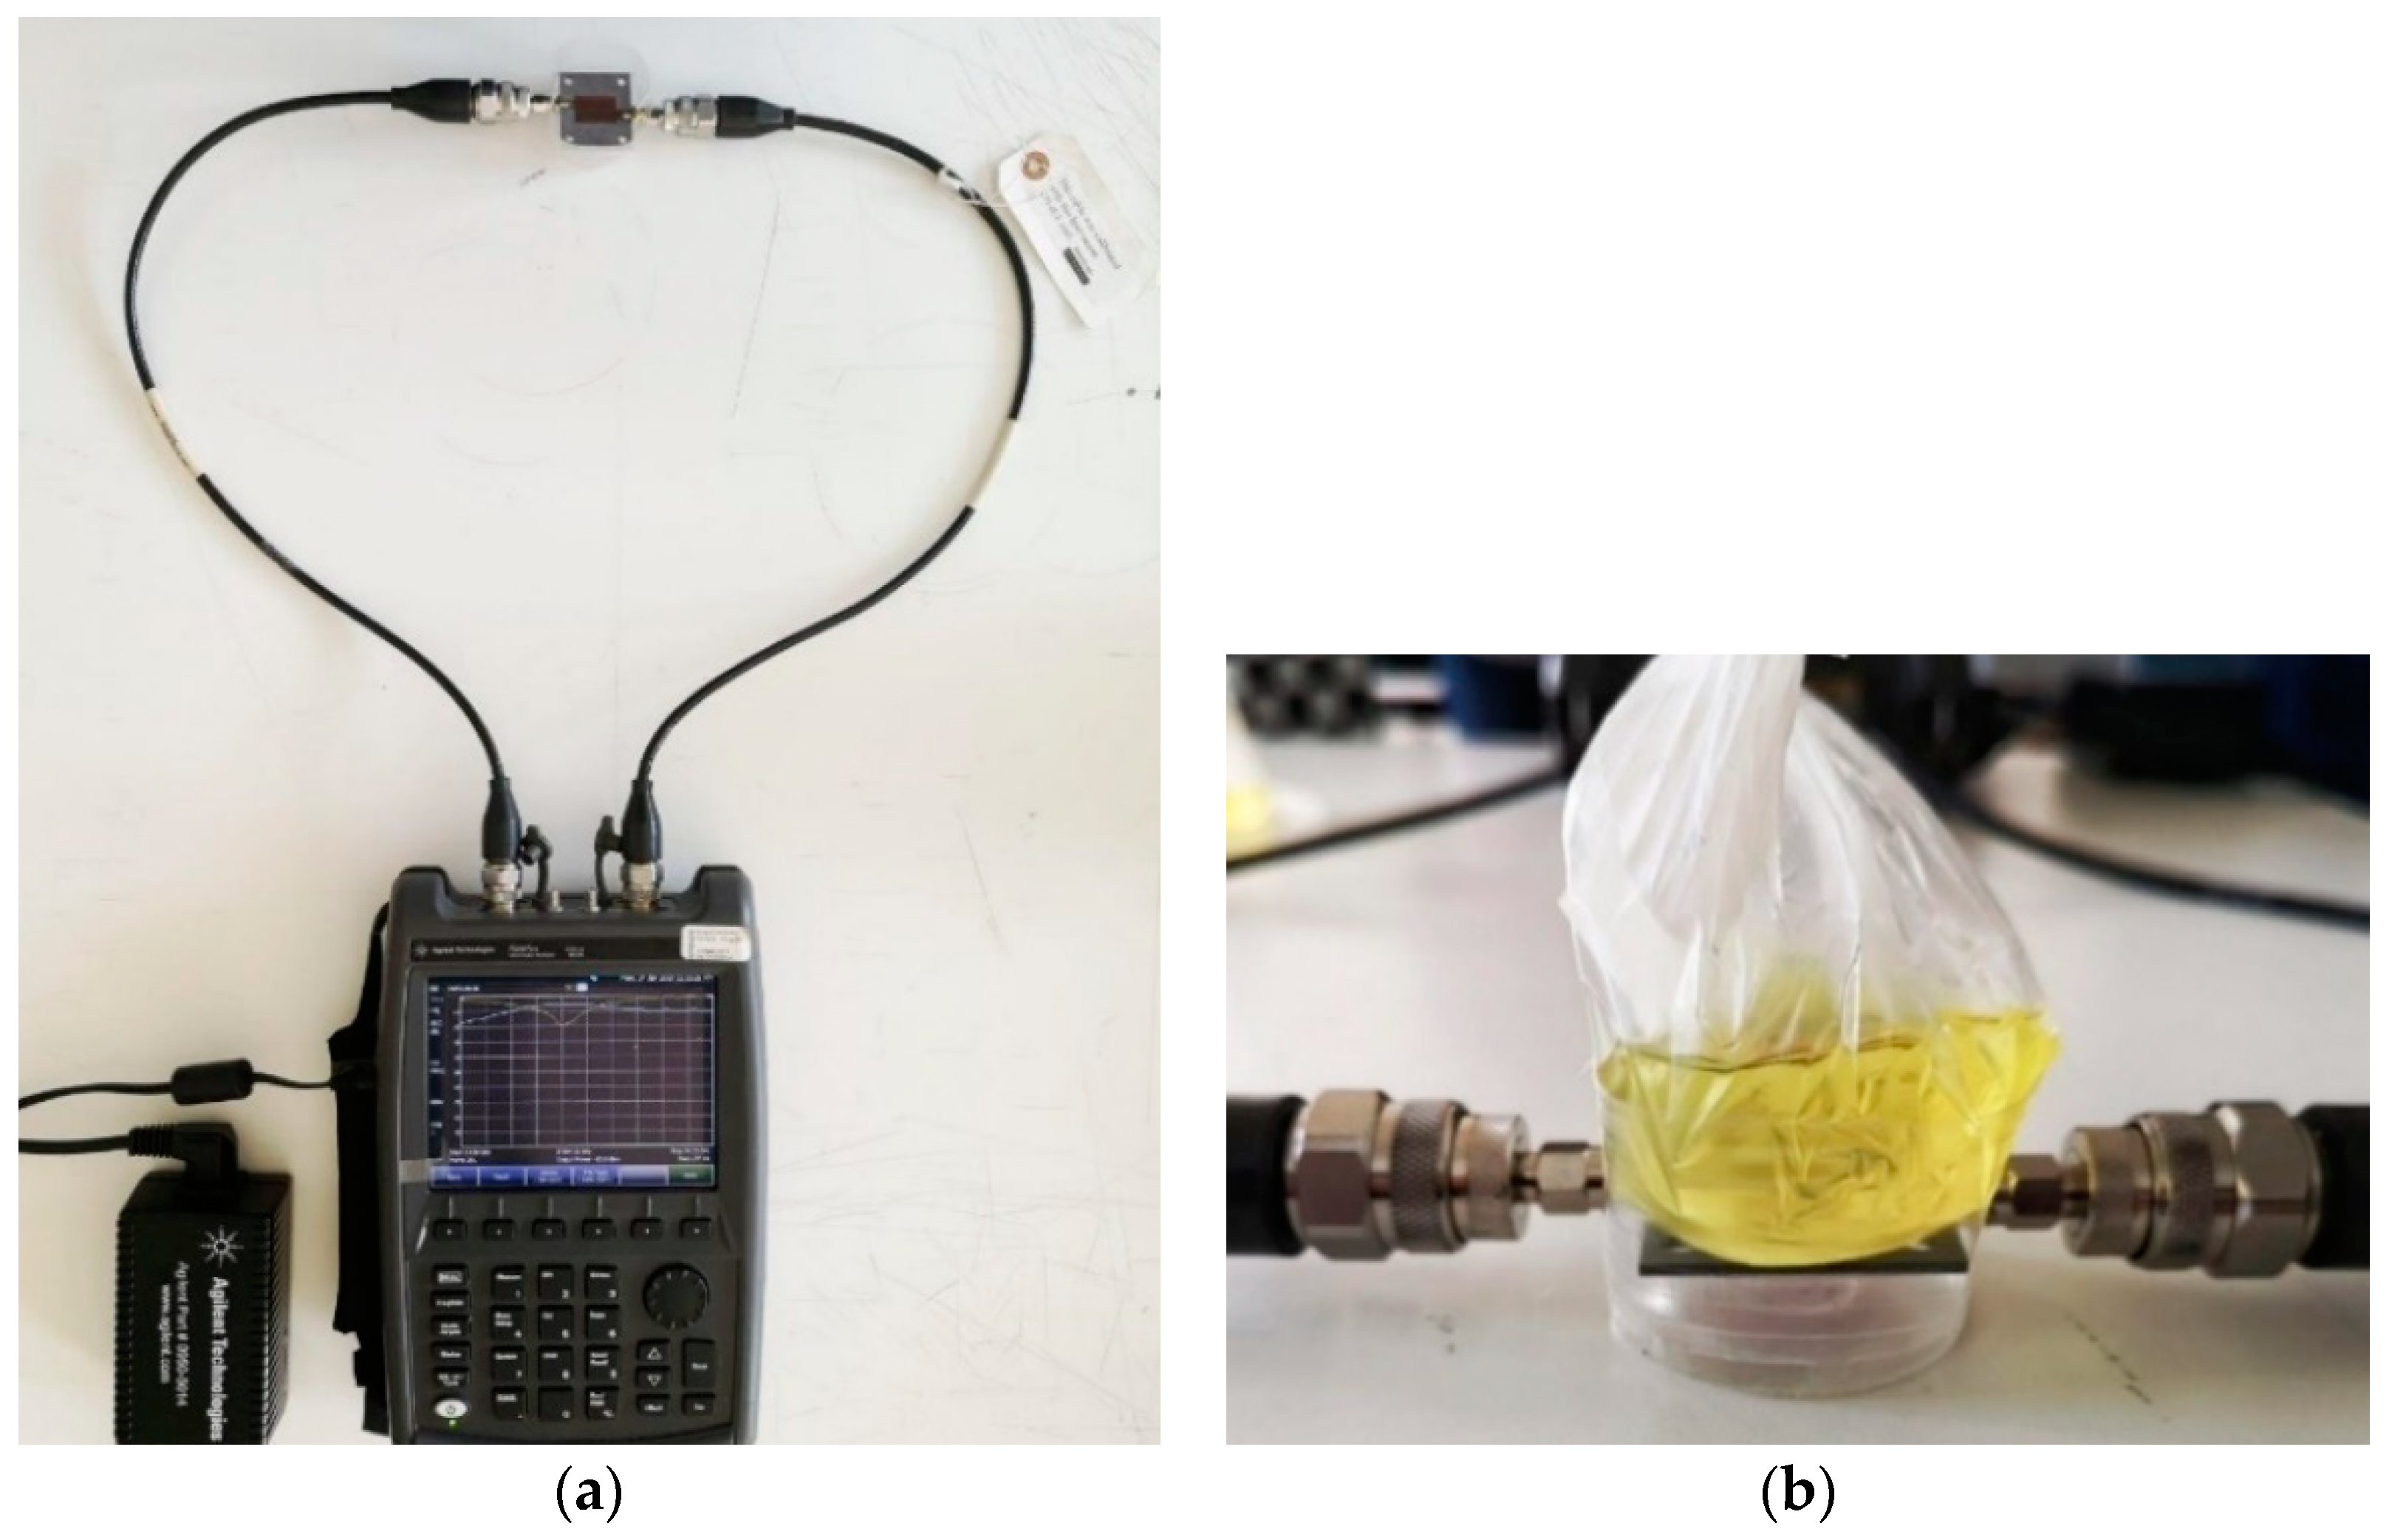
(a) Measurement set-up using the Keysight VNA N9927A FieldFox and the constructed cross-slot SIW applicator as a water-in-fuel sensor; (b) magnified view of one of the measured fuel samples.
Figure 17.
(a) Measurement set-up using the Keysight VNA N9927A FieldFox and the constructed cross-slot SIW applicator as a water-in-fuel sensor; (b) magnified view of one of the measured fuel samples.
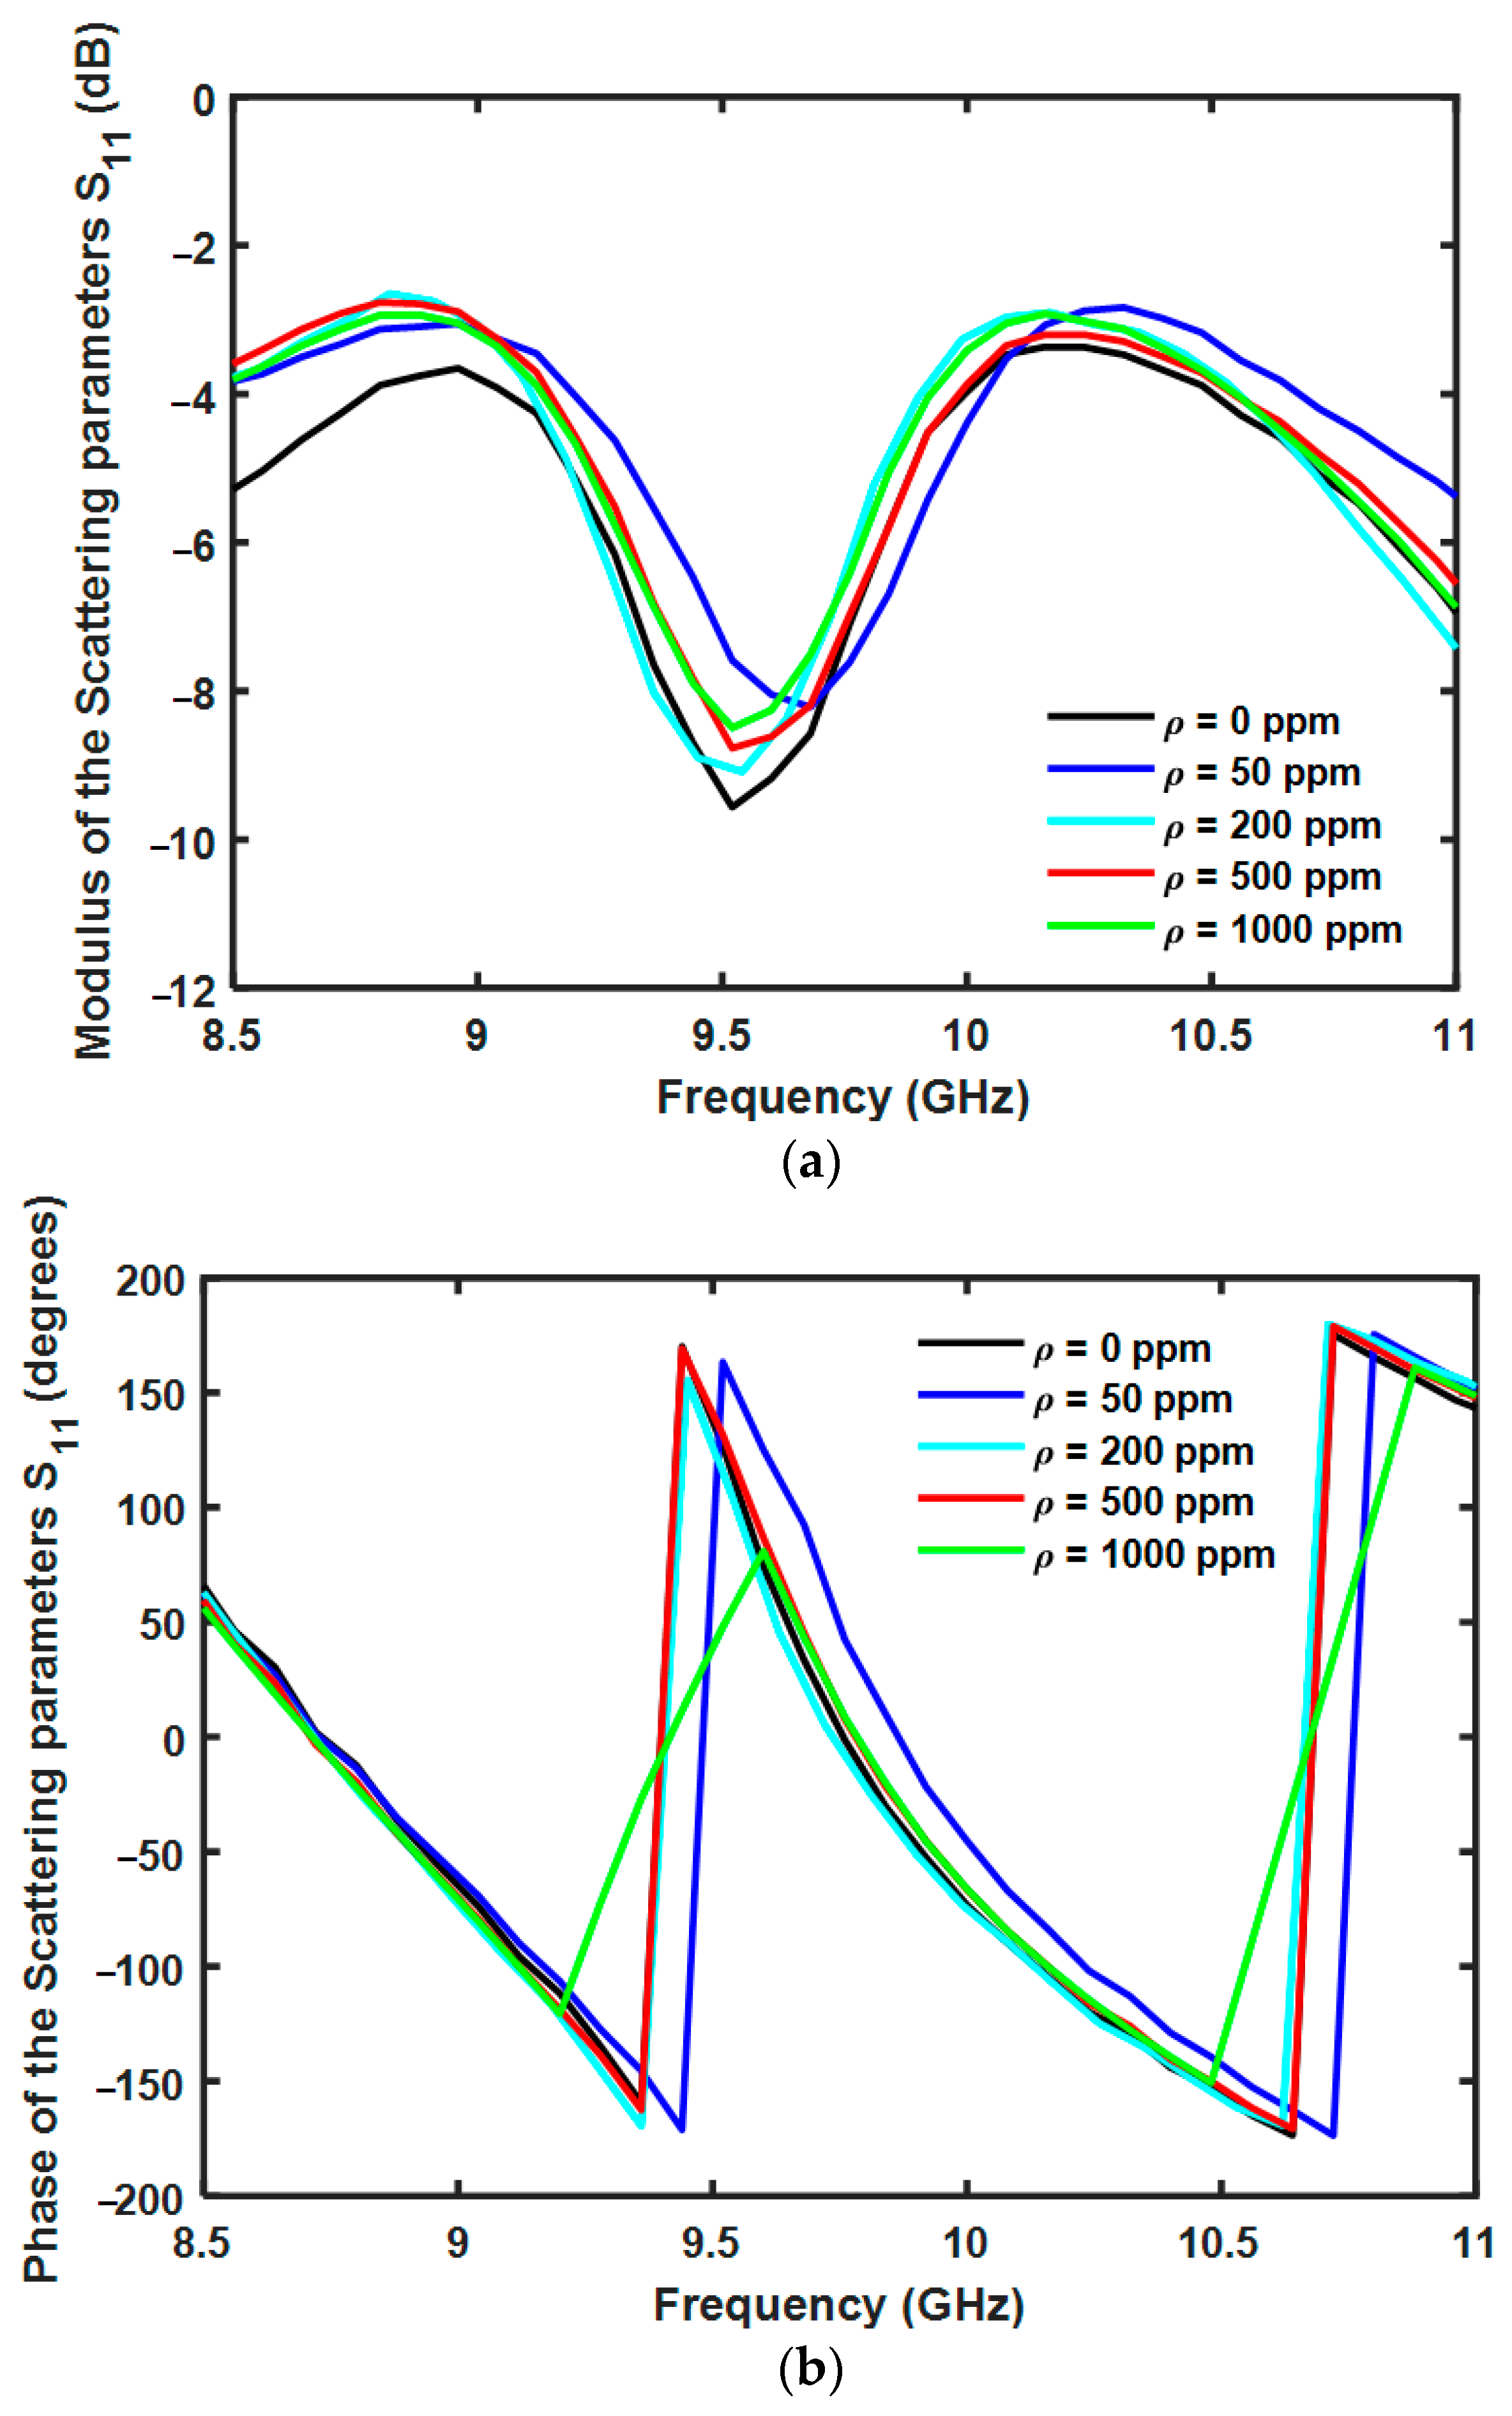
Figure 18.
(a) Measured modulus of the scattering parameter as a function of the frequency and (b) measured phase of the scattering parameter as a function of the frequency for the five different water concentrations .
Figure 18.
(a) Measured modulus of the scattering parameter as a function of the frequency and (b) measured phase of the scattering parameter as a function of the frequency for the five different water concentrations .
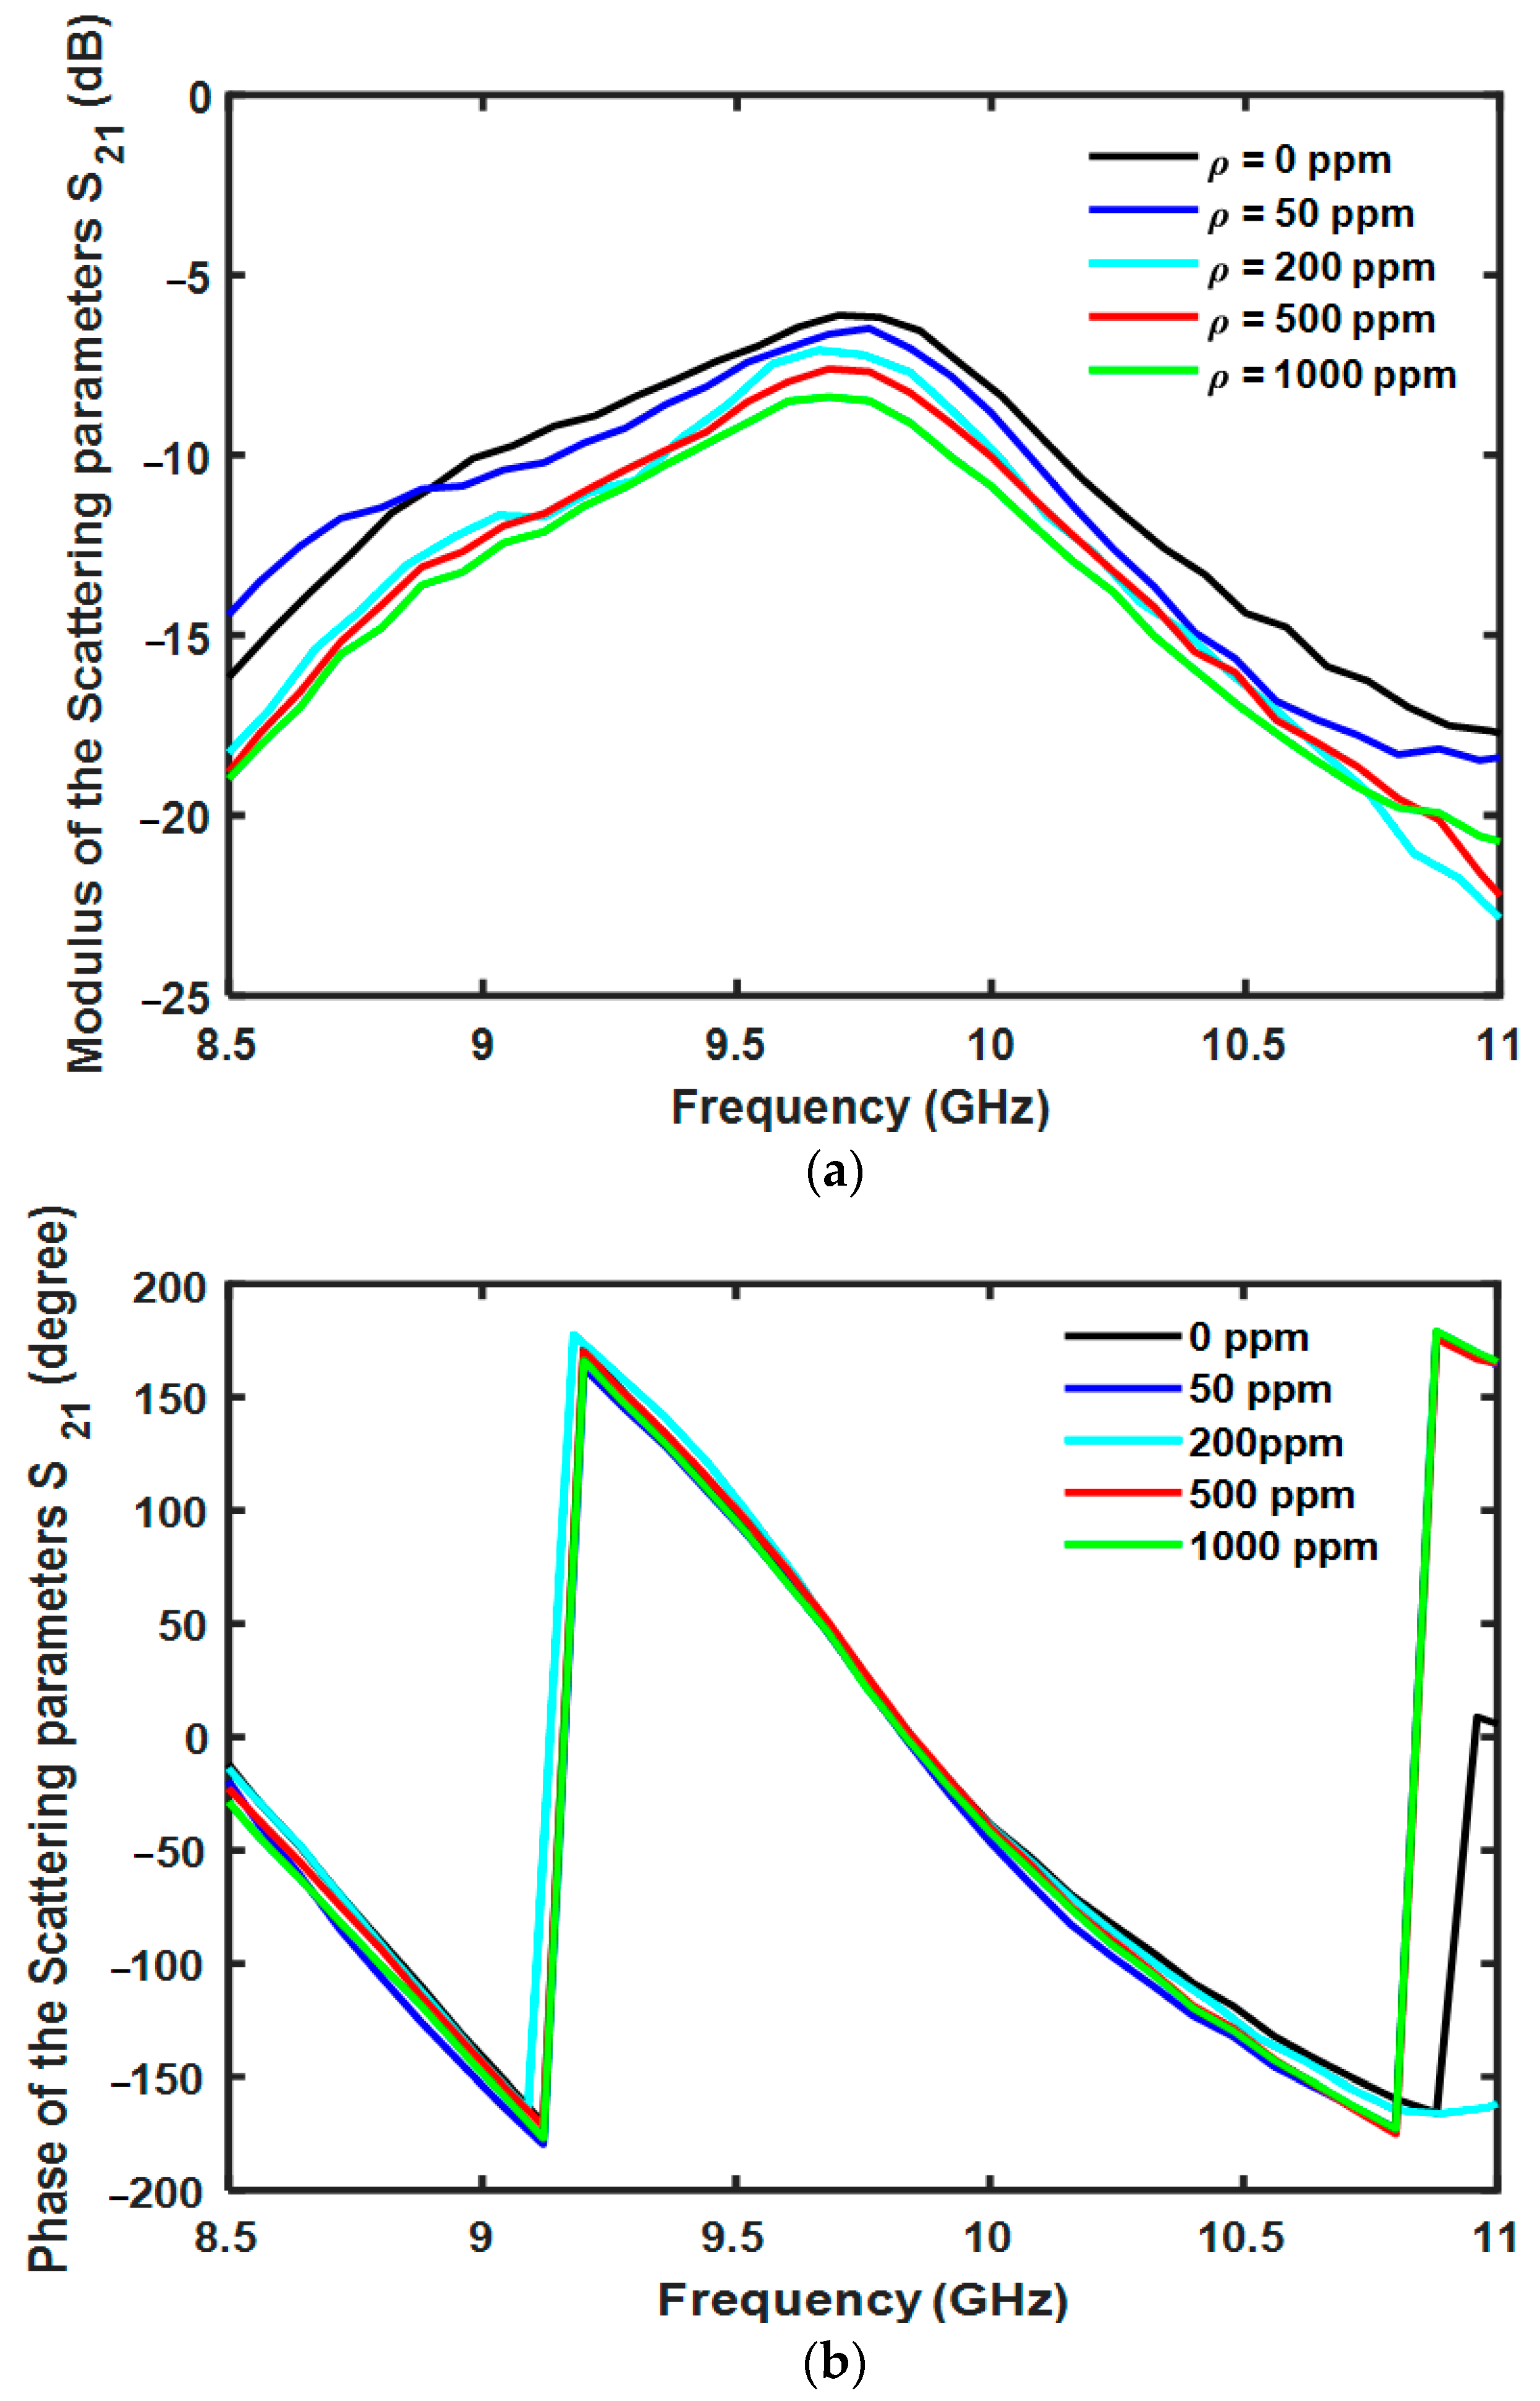
Figure 19.
(a) Measured modulus of the scattering parameter as a function of the frequency and (b) measured phase of the scattering parameter as a function of the frequency for the five different water concentrations .
Figure 19.
(a) Measured modulus of the scattering parameter as a function of the frequency and (b) measured phase of the scattering parameter as a function of the frequency for the five different water concentrations .
Figure 20.
Measured modulus of the scattering parameters as a function of water concentration at frequency .
Figure 20.
Measured modulus of the scattering parameters as a function of water concentration at frequency .
Table 1.
Order and coefficient of determination of the polynomial fitting the measured dielectric constant curves.
Table 1.
Order and coefficient of determination of the polynomial fitting the measured dielectric constant curves.
| Sample | Fitting Order | of the Polynomial Fitting |
|---|
| 8 | 0.95 |
| 3 | 0.93 |
| 3 | 0.97 |
| 9 | 0.91 |
| 8 | 0.90 |
Table 2.
Sensitivities of the SPEAG DAK 3.5 probe-N9927A VNA as a water-in-fuel sensor for different frequencies.
Table 2.
Sensitivities of the SPEAG DAK 3.5 probe-N9927A VNA as a water-in-fuel sensor for different frequencies.
| Frequency (GHz) | Sensitivity (×10−3/ppm) | |
|---|
| 9 | 0.399 | 0.79 |
| 10 | 0.395 | 0.82 |
| 11 | 0.376 | 0.86 |
| 12 | 0.344 | 0.88 |
| 13 | 0.304 | 0.91 |
Table 3.
Main geometric parameters of the designed single-slot SIW applicator in air.
Table 3.
Main geometric parameters of the designed single-slot SIW applicator in air.
| Parameter | Value | Description |
|---|
| 35 mm | Substrate length |
| 25 mm | Substrate width |
| 14.3 mm | SIW length |
| 13.8 mm | SIW width |
| 4.7 mm | Microstrip line width |
| 10.35 mm | Microstrip line length |
| 0.3 mm | Slot width |
| 10.05 mm | Slot length |
| 0.75 mm | Center–center distance of vias |
| 0.5 mm | Vias diameter |
Table 4.
Main geometric parameters of the designed cross-slot SIW applicator.
Table 4.
Main geometric parameters of the designed cross-slot SIW applicator.
| Parameter | Value | Description |
|---|
| 35 mm | Substrate length |
| 25 mm | Substrate width |
| 20.3 mm | SIW length |
| 6.9 mm | SIW width |
| 4.7 mm | Microstrip line width |
| 7.5 mm | Microstrip line length |
| 0.3 mm | Slot width |
| 4 mm | Slot length |
| 0.3 mm | Gap width |
| 0.75 mm | Center–center distance of vias |
| 0.5 mm | Vias diameter |
Table 5.
Optimized geometric parameters of the designed cross-slot SIW applicator.
Table 5.
Optimized geometric parameters of the designed cross-slot SIW applicator.
| Parameter | Value | Description |
|---|
| 35 mm | Substrate length |
| 25 mm | Substrate width |
| 20 mm | SIW length |
| 6.9 mm | Half SIW width |
| 4.7 mm | Microstrip line width |
| 7.5 mm | Microstrip line length |
| 0.2 mm | Slot width |
| 4.9 mm | Slot length |
| 0.2 mm | Gap distance |
| 0.75 mm | Center–center distance of vias |
| 0.5 mm | Vias diameter |
Table 6.
Cross-slot SIW. Modulus of the simulated scattering parameter for the five water concentrations at frequency .
Table 6.
Cross-slot SIW. Modulus of the simulated scattering parameter for the five water concentrations at frequency .
| Water Concentration (ppm) | (dB) |
|---|
| 0 | −3.033 |
| 50 | −3.718 |
| 200 | −3.827 |
| 500 | −3.930 |
| 1000 | −4.778 |
Table 7.
Measured modulus of the scattering parameter for the five water concentrations at a frequency of .
Table 7.
Measured modulus of the scattering parameter for the five water concentrations at a frequency of .
| Water Concentration (ppm) | (dB) |
|---|
| 0 | −6.17 |
| 50 | −6.48 |
| 200 | −7.21 |
| 500 | −7.68 |
| 1000 | −8.49 |
Table 8.
Comparison between this work’s results and literature results.
Table 8.
Comparison between this work’s results and literature results.
| References | Sensitivity (mdB/ppm) |
|---|
| [14] | 0.4 |
| [15] | 0.6 |
| [22] | 0.0872 |
| This work | 1.42 |


 ,
, 


