
Driving Behavior Classification and Sharing System Using CNN-LSTM Approaches and V2X Communication


Abstract
:1. Introduction
2. Related Works
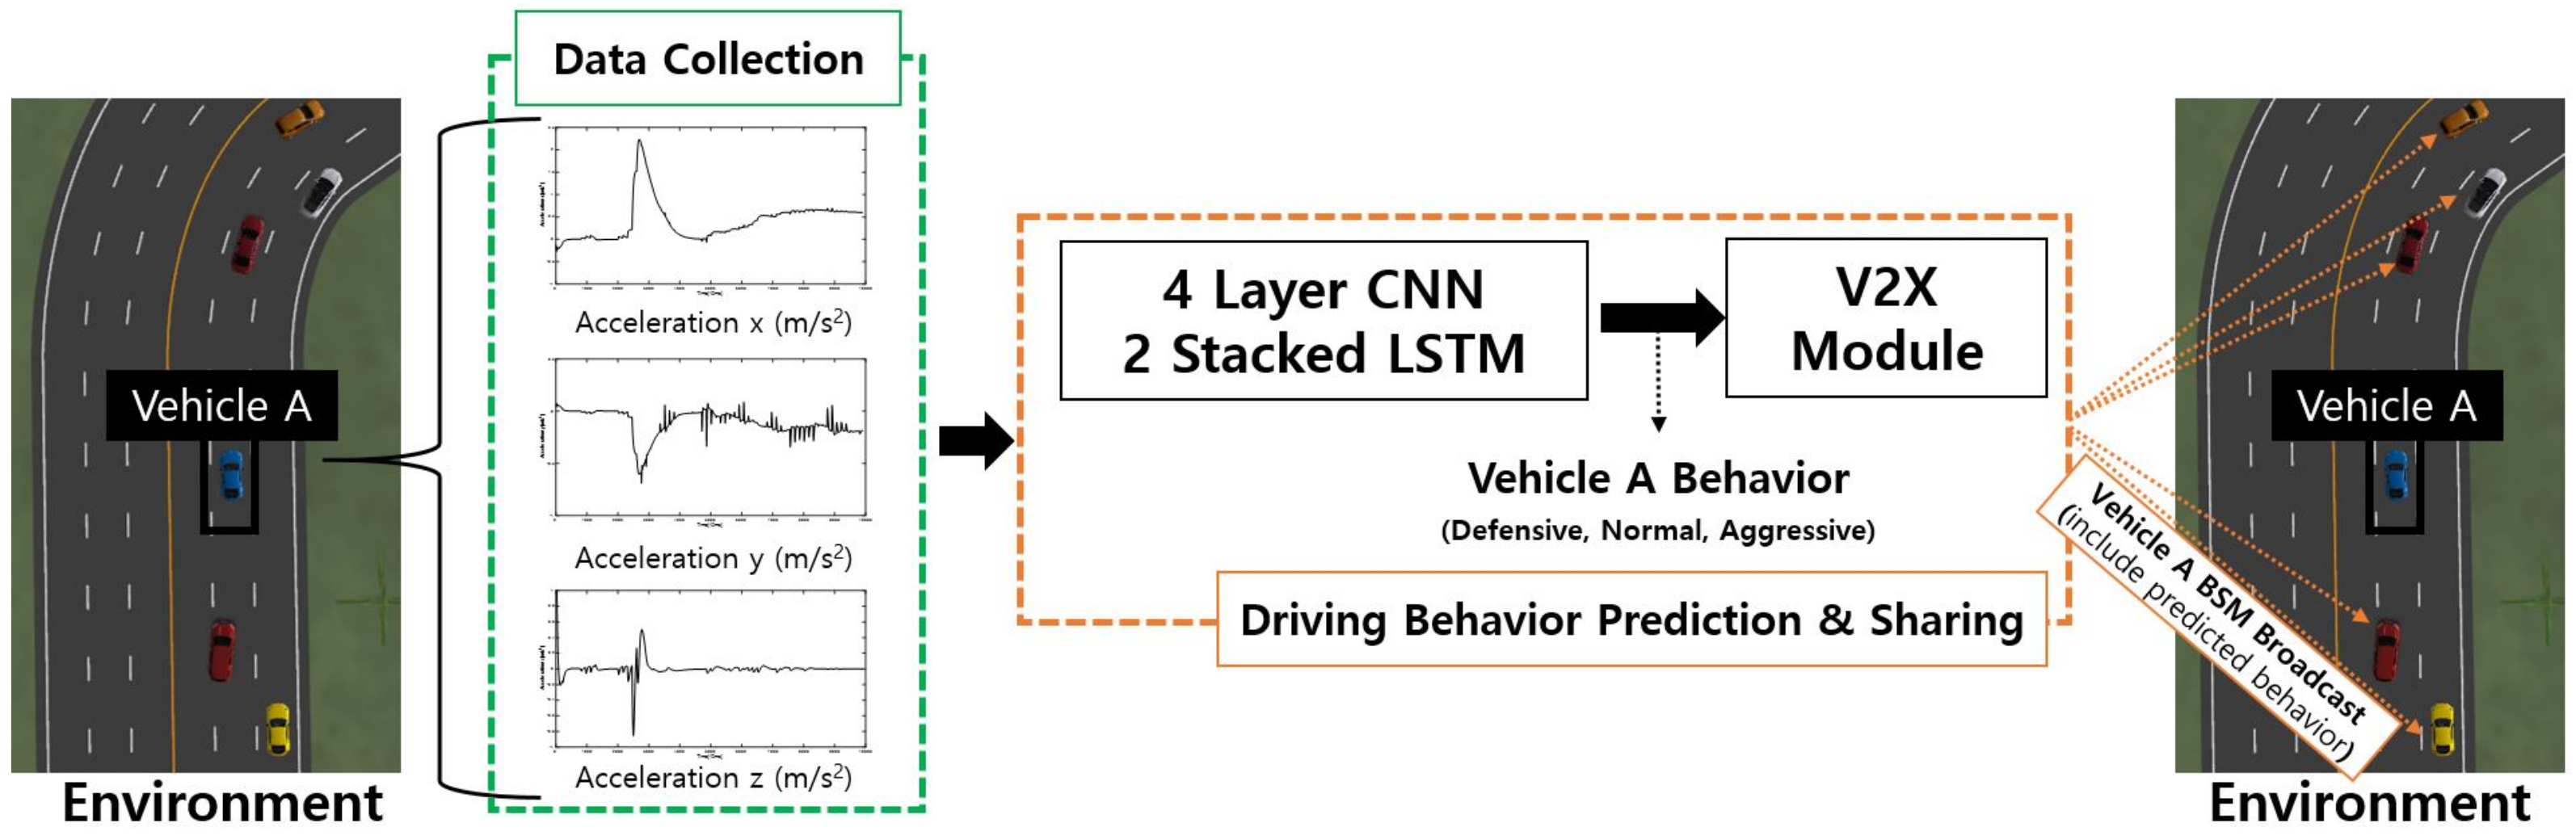
3. Driving Behavior Classification and Sharing System
3.1. LSTM Cell Structure
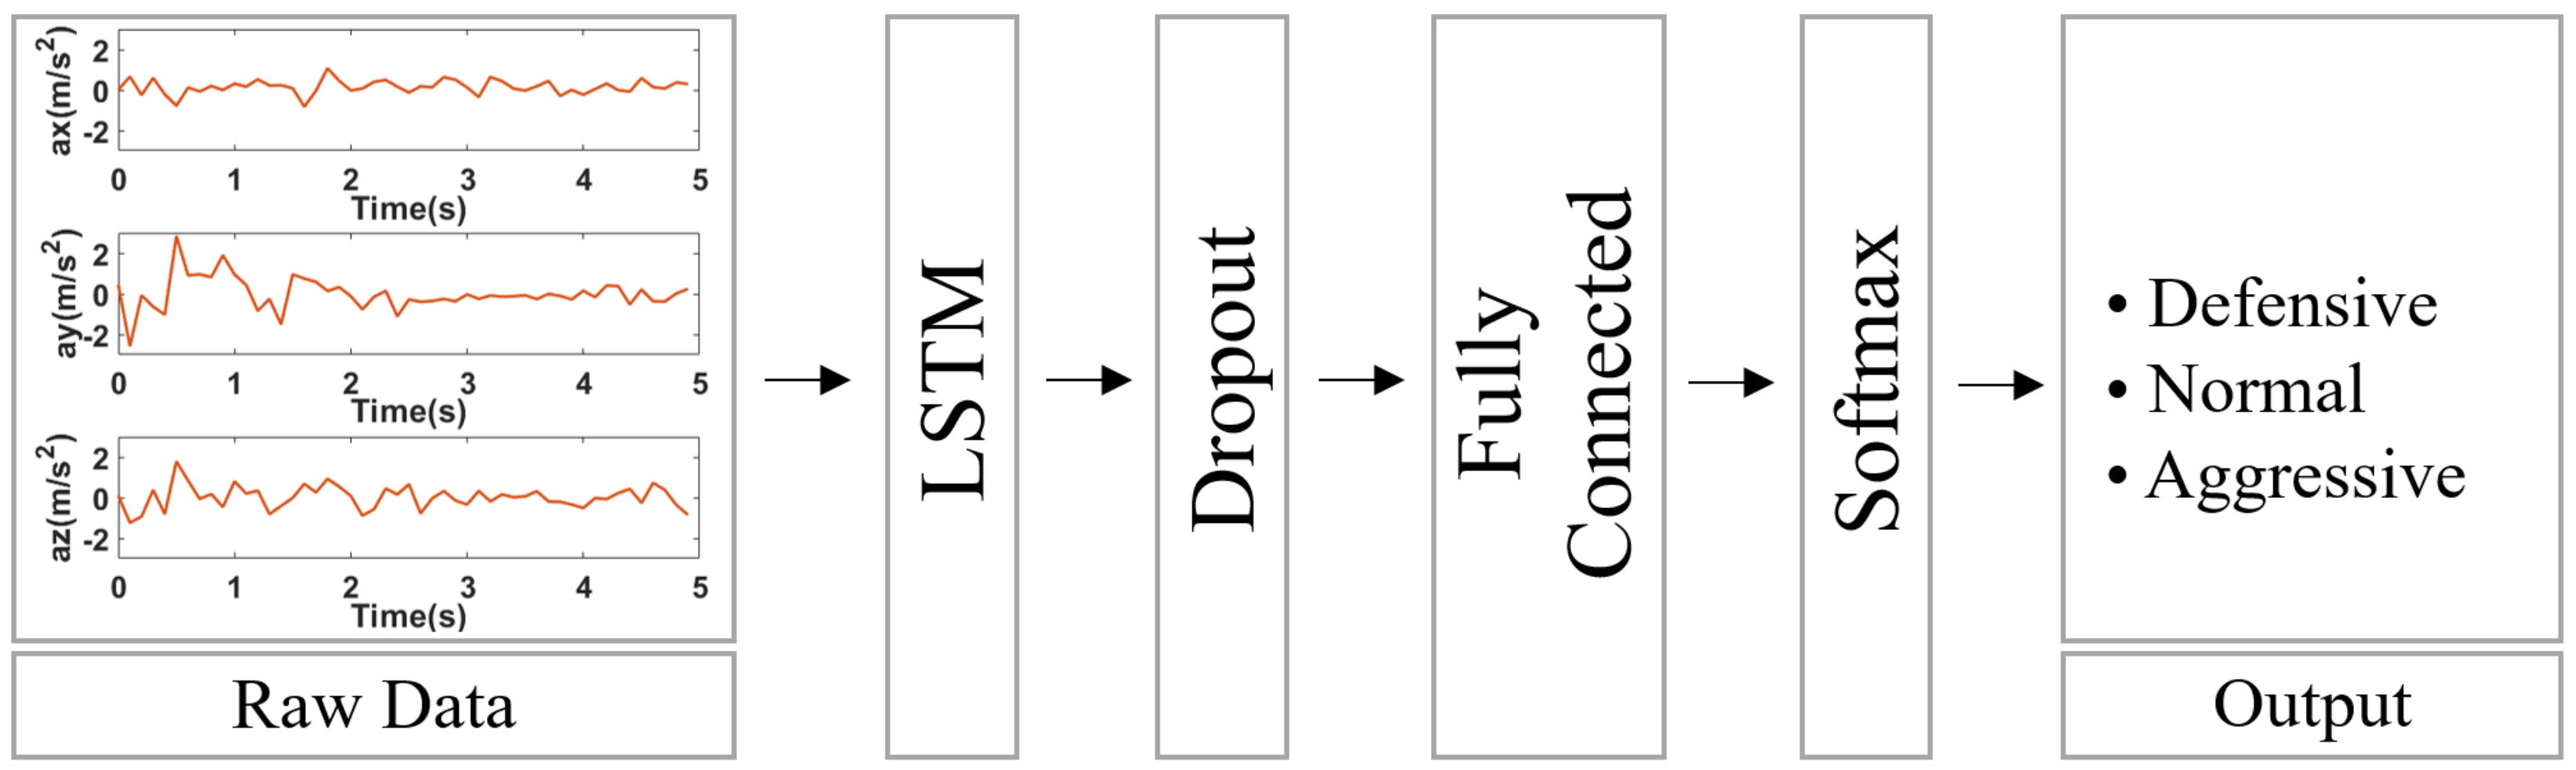
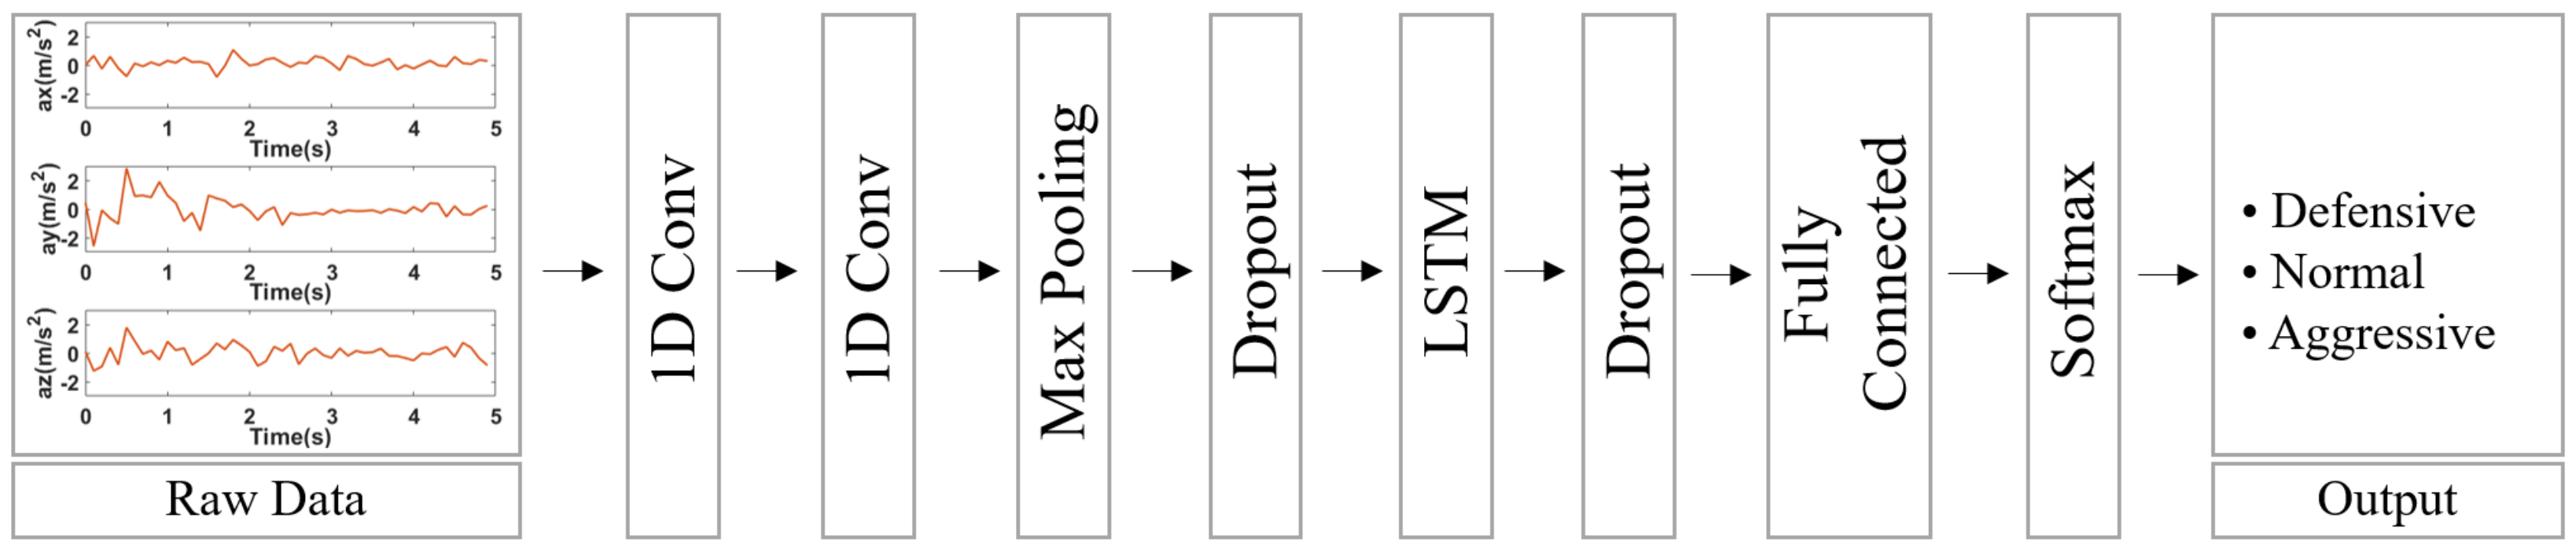
3.2. Base Network for Driving Behavior Classification
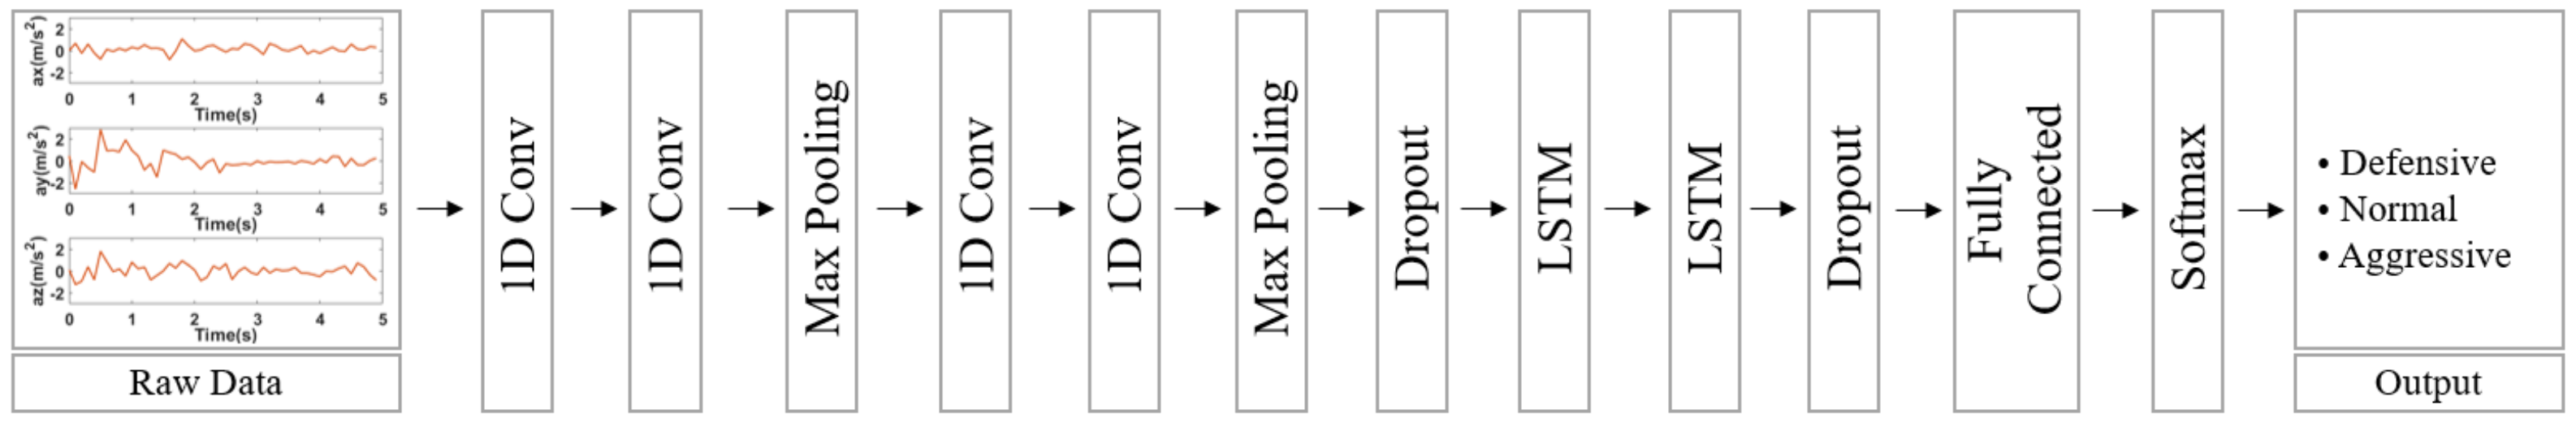
3.3. Four-Layer CNN-2 Stacked LSTM for Driving Behavior Classification
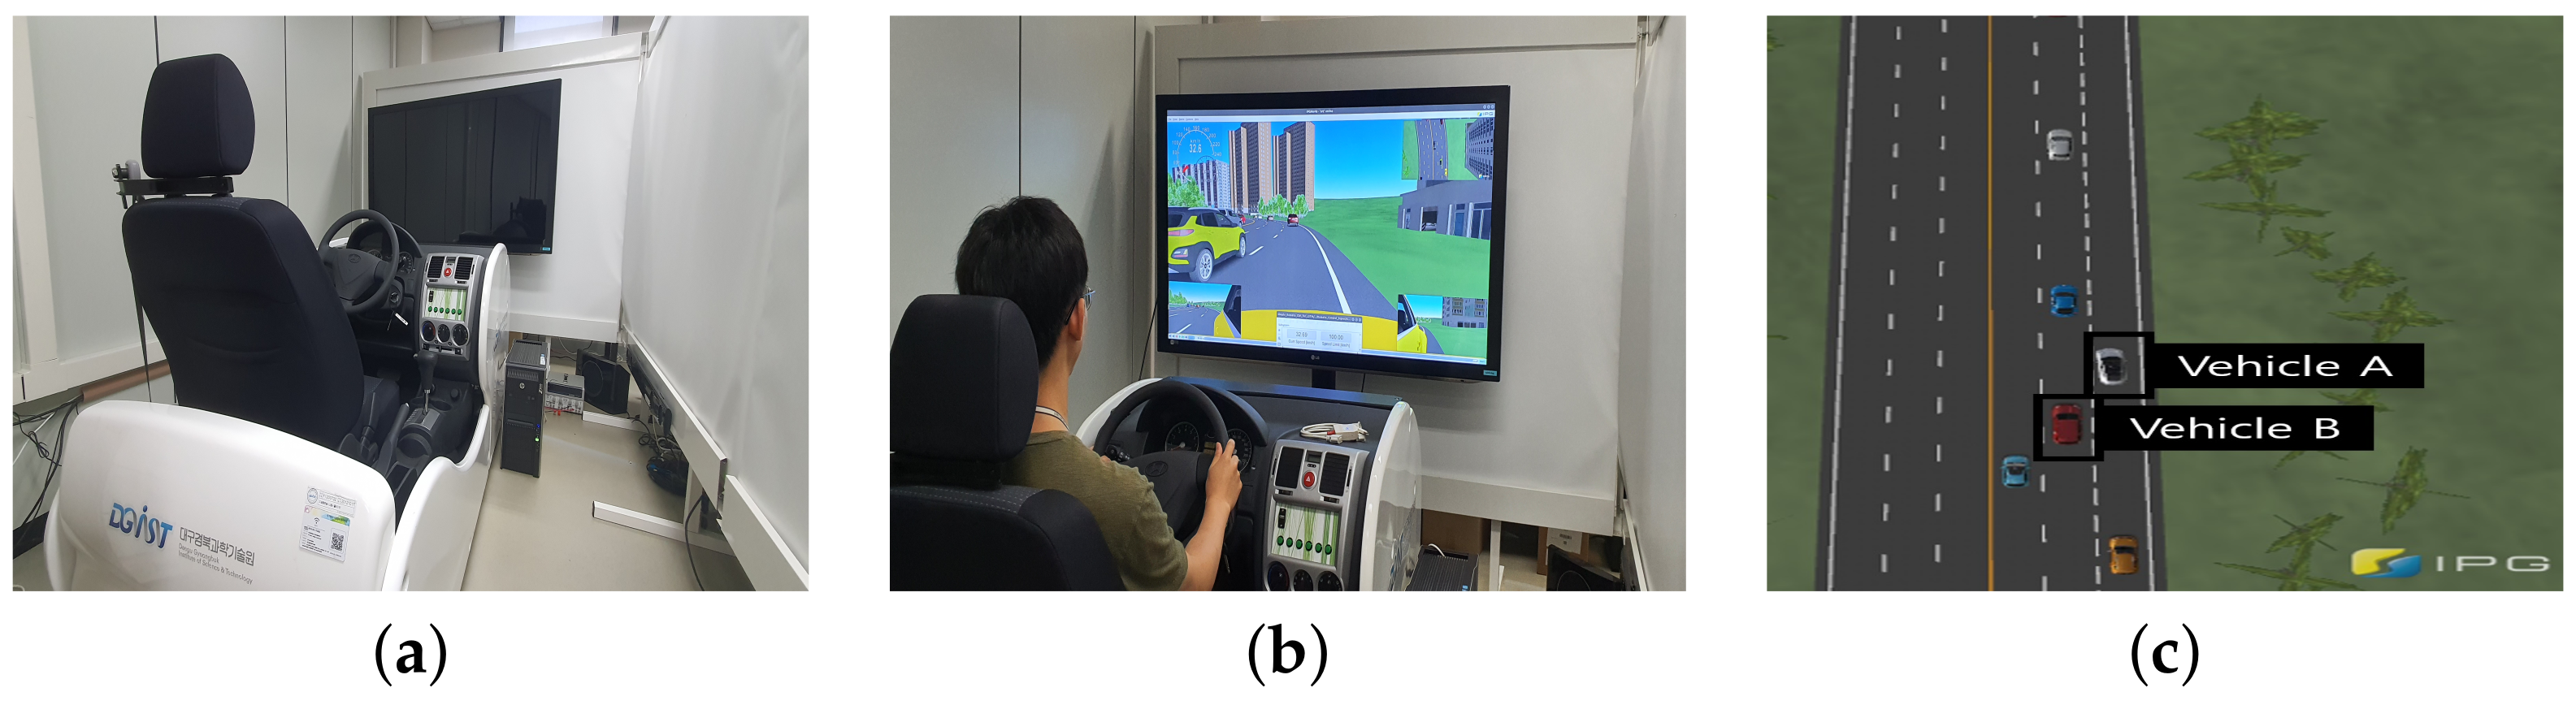
3.4. Dataset Generation
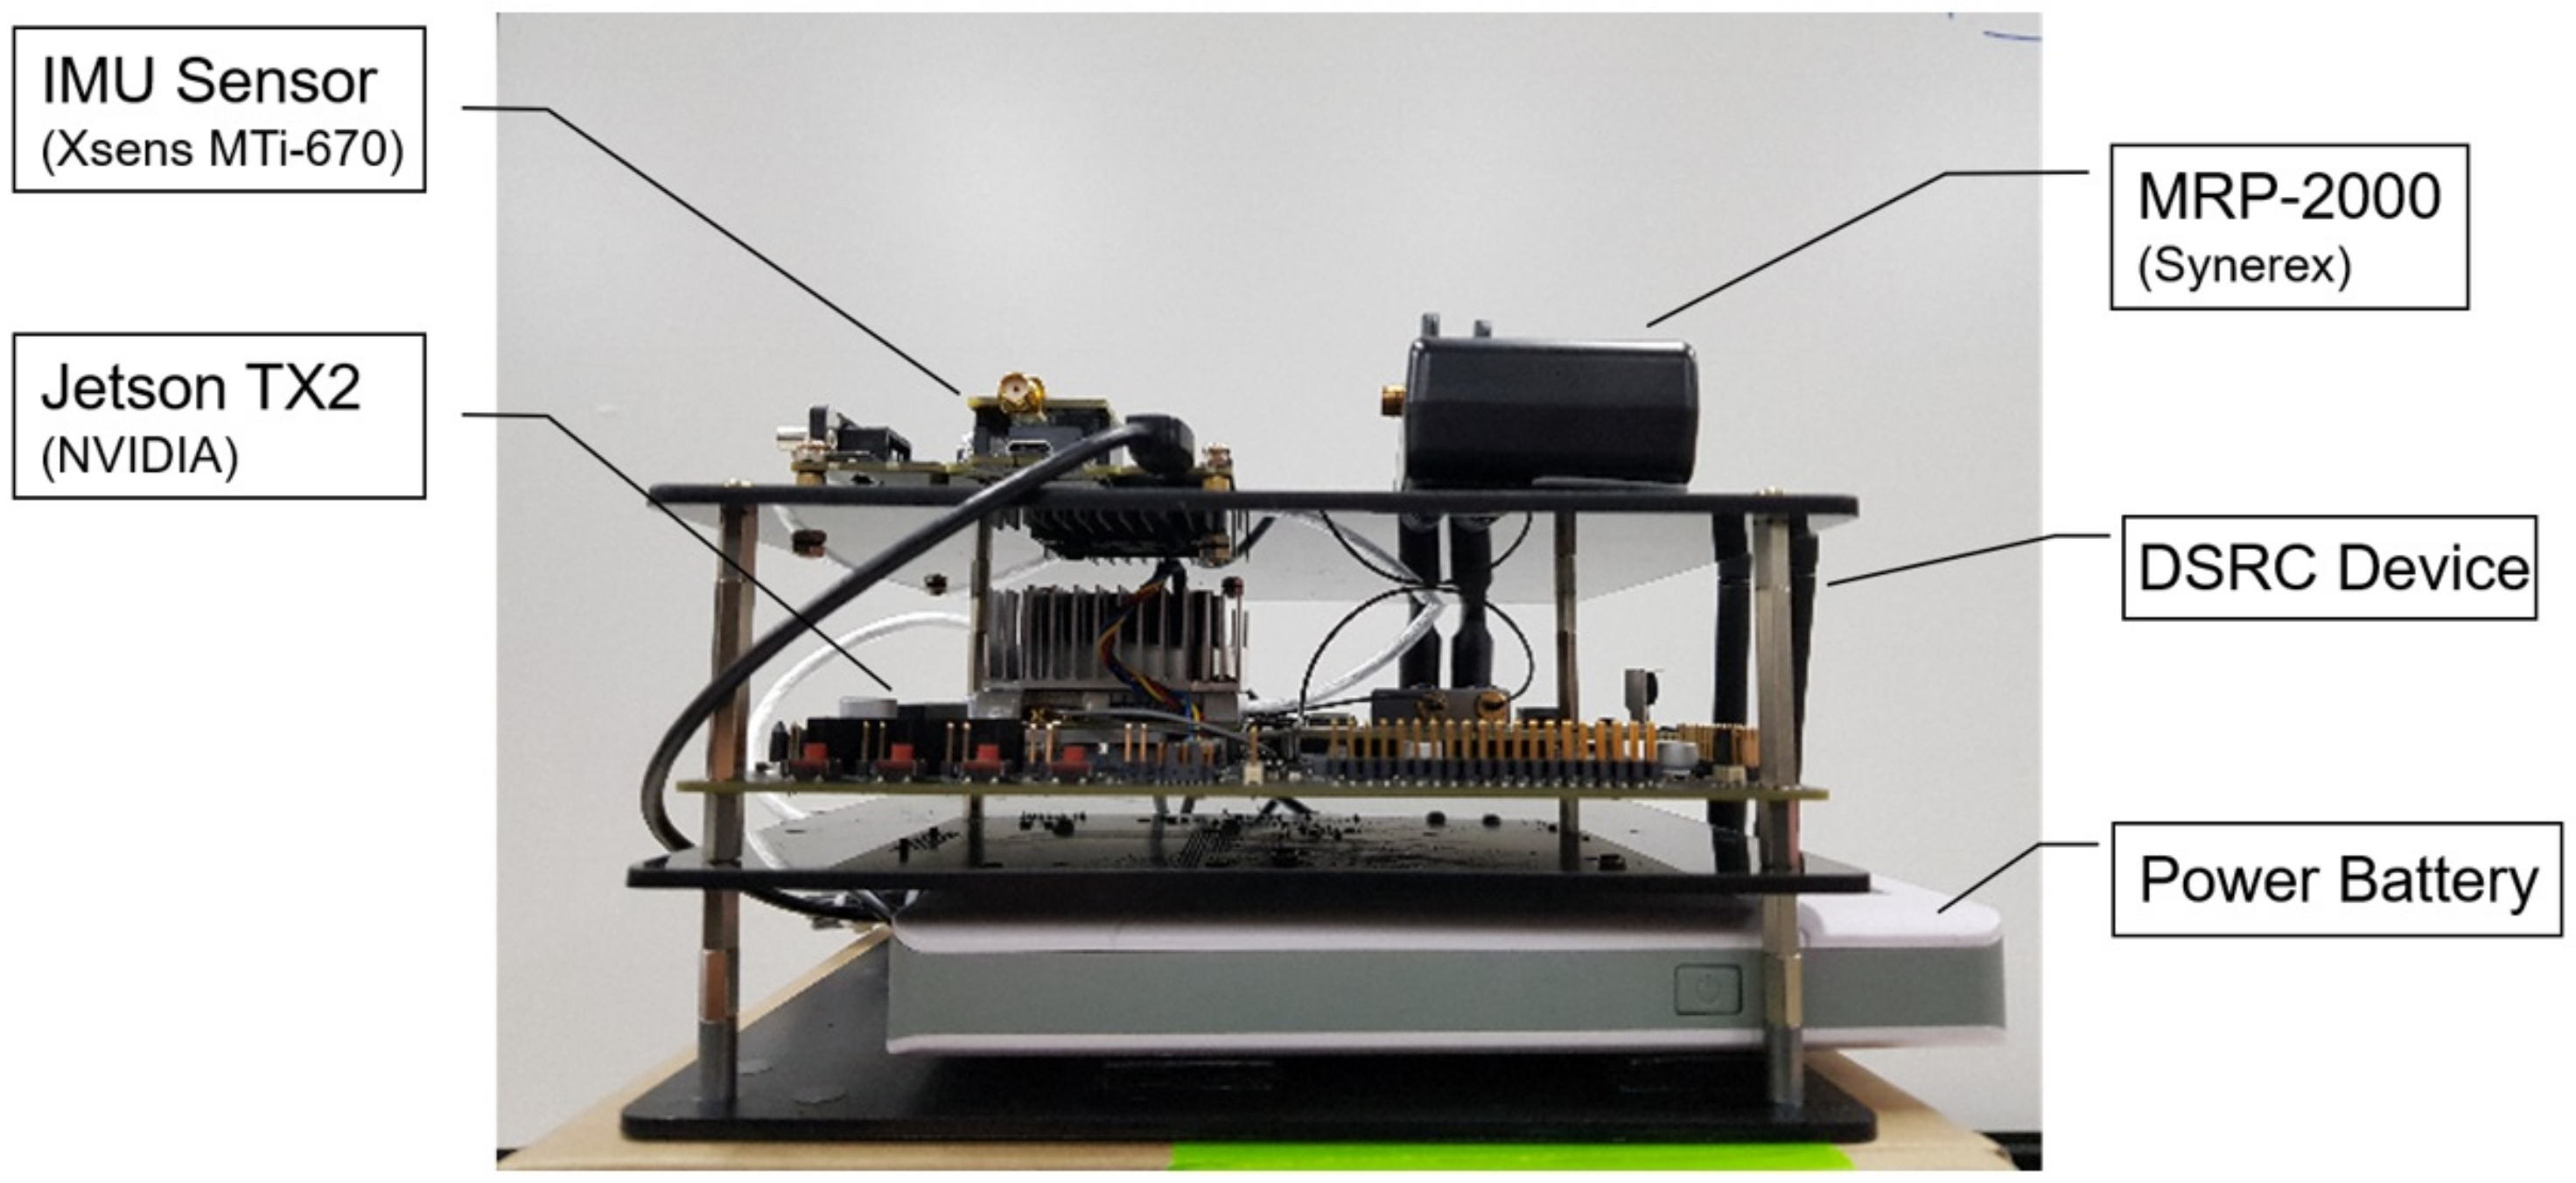
3.5. Prediction Result Sharing via V2X
4. Performance Evaluation
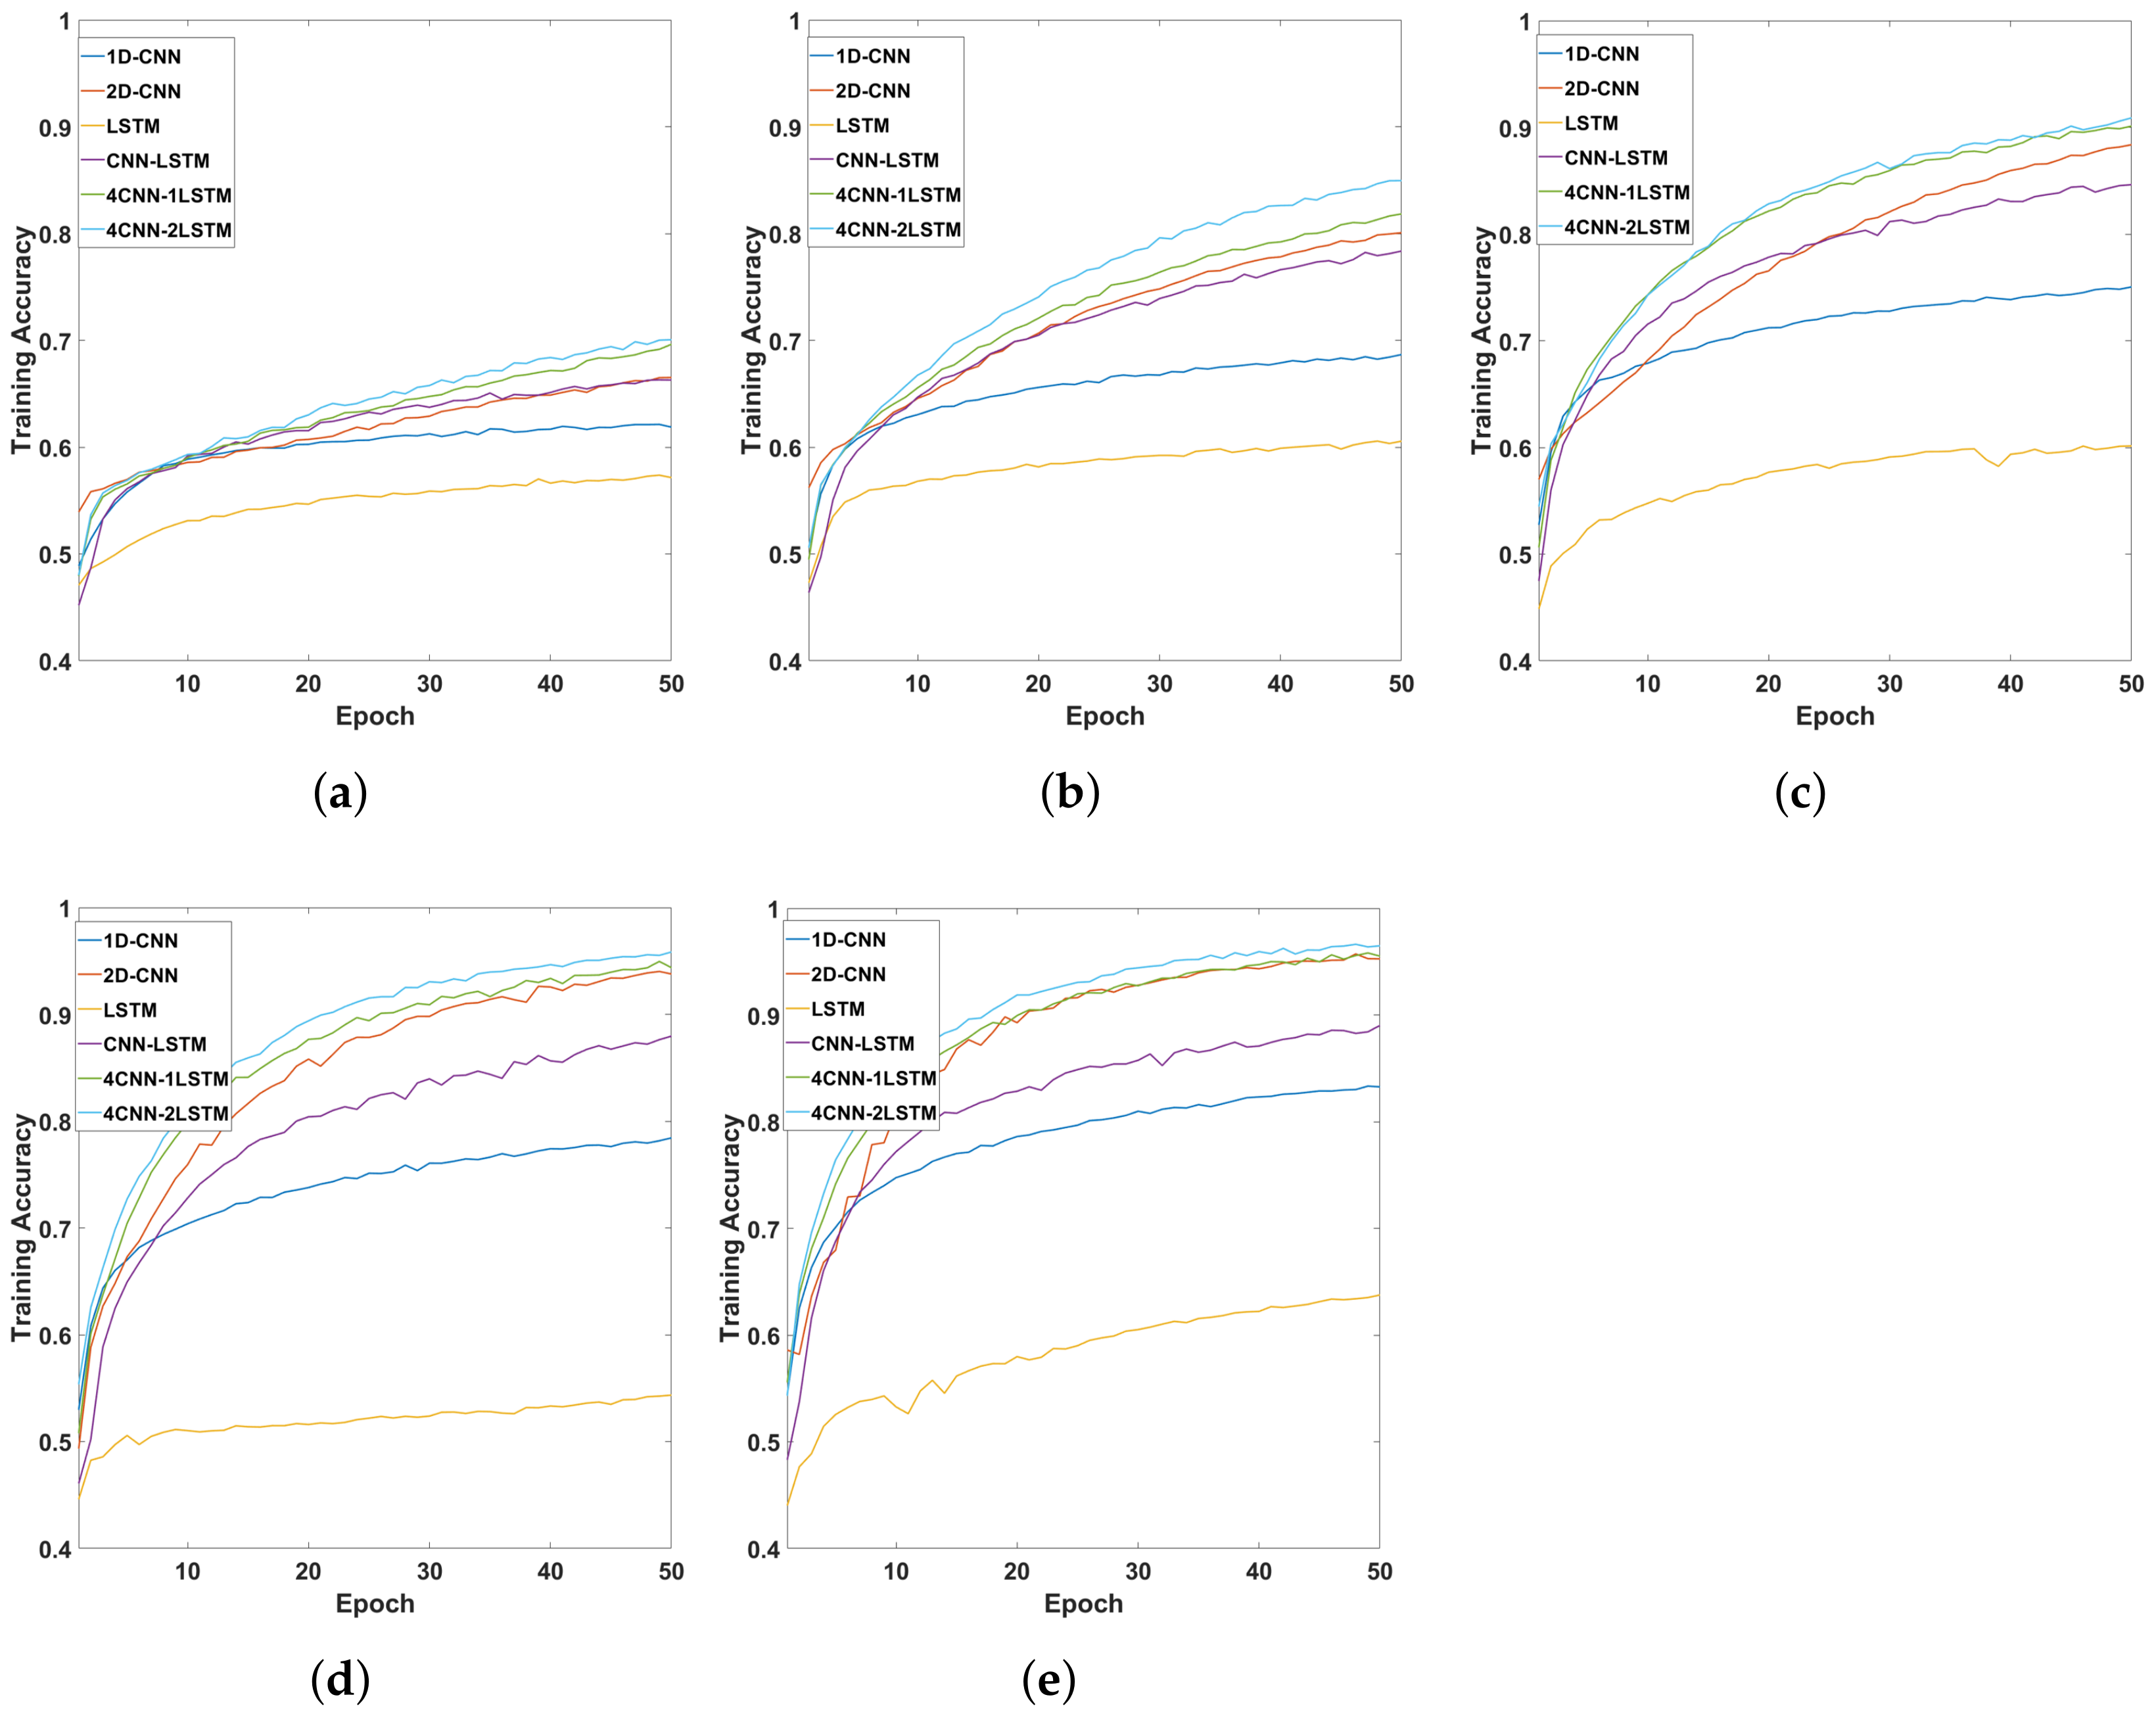
4.1. Network Training and Comparison
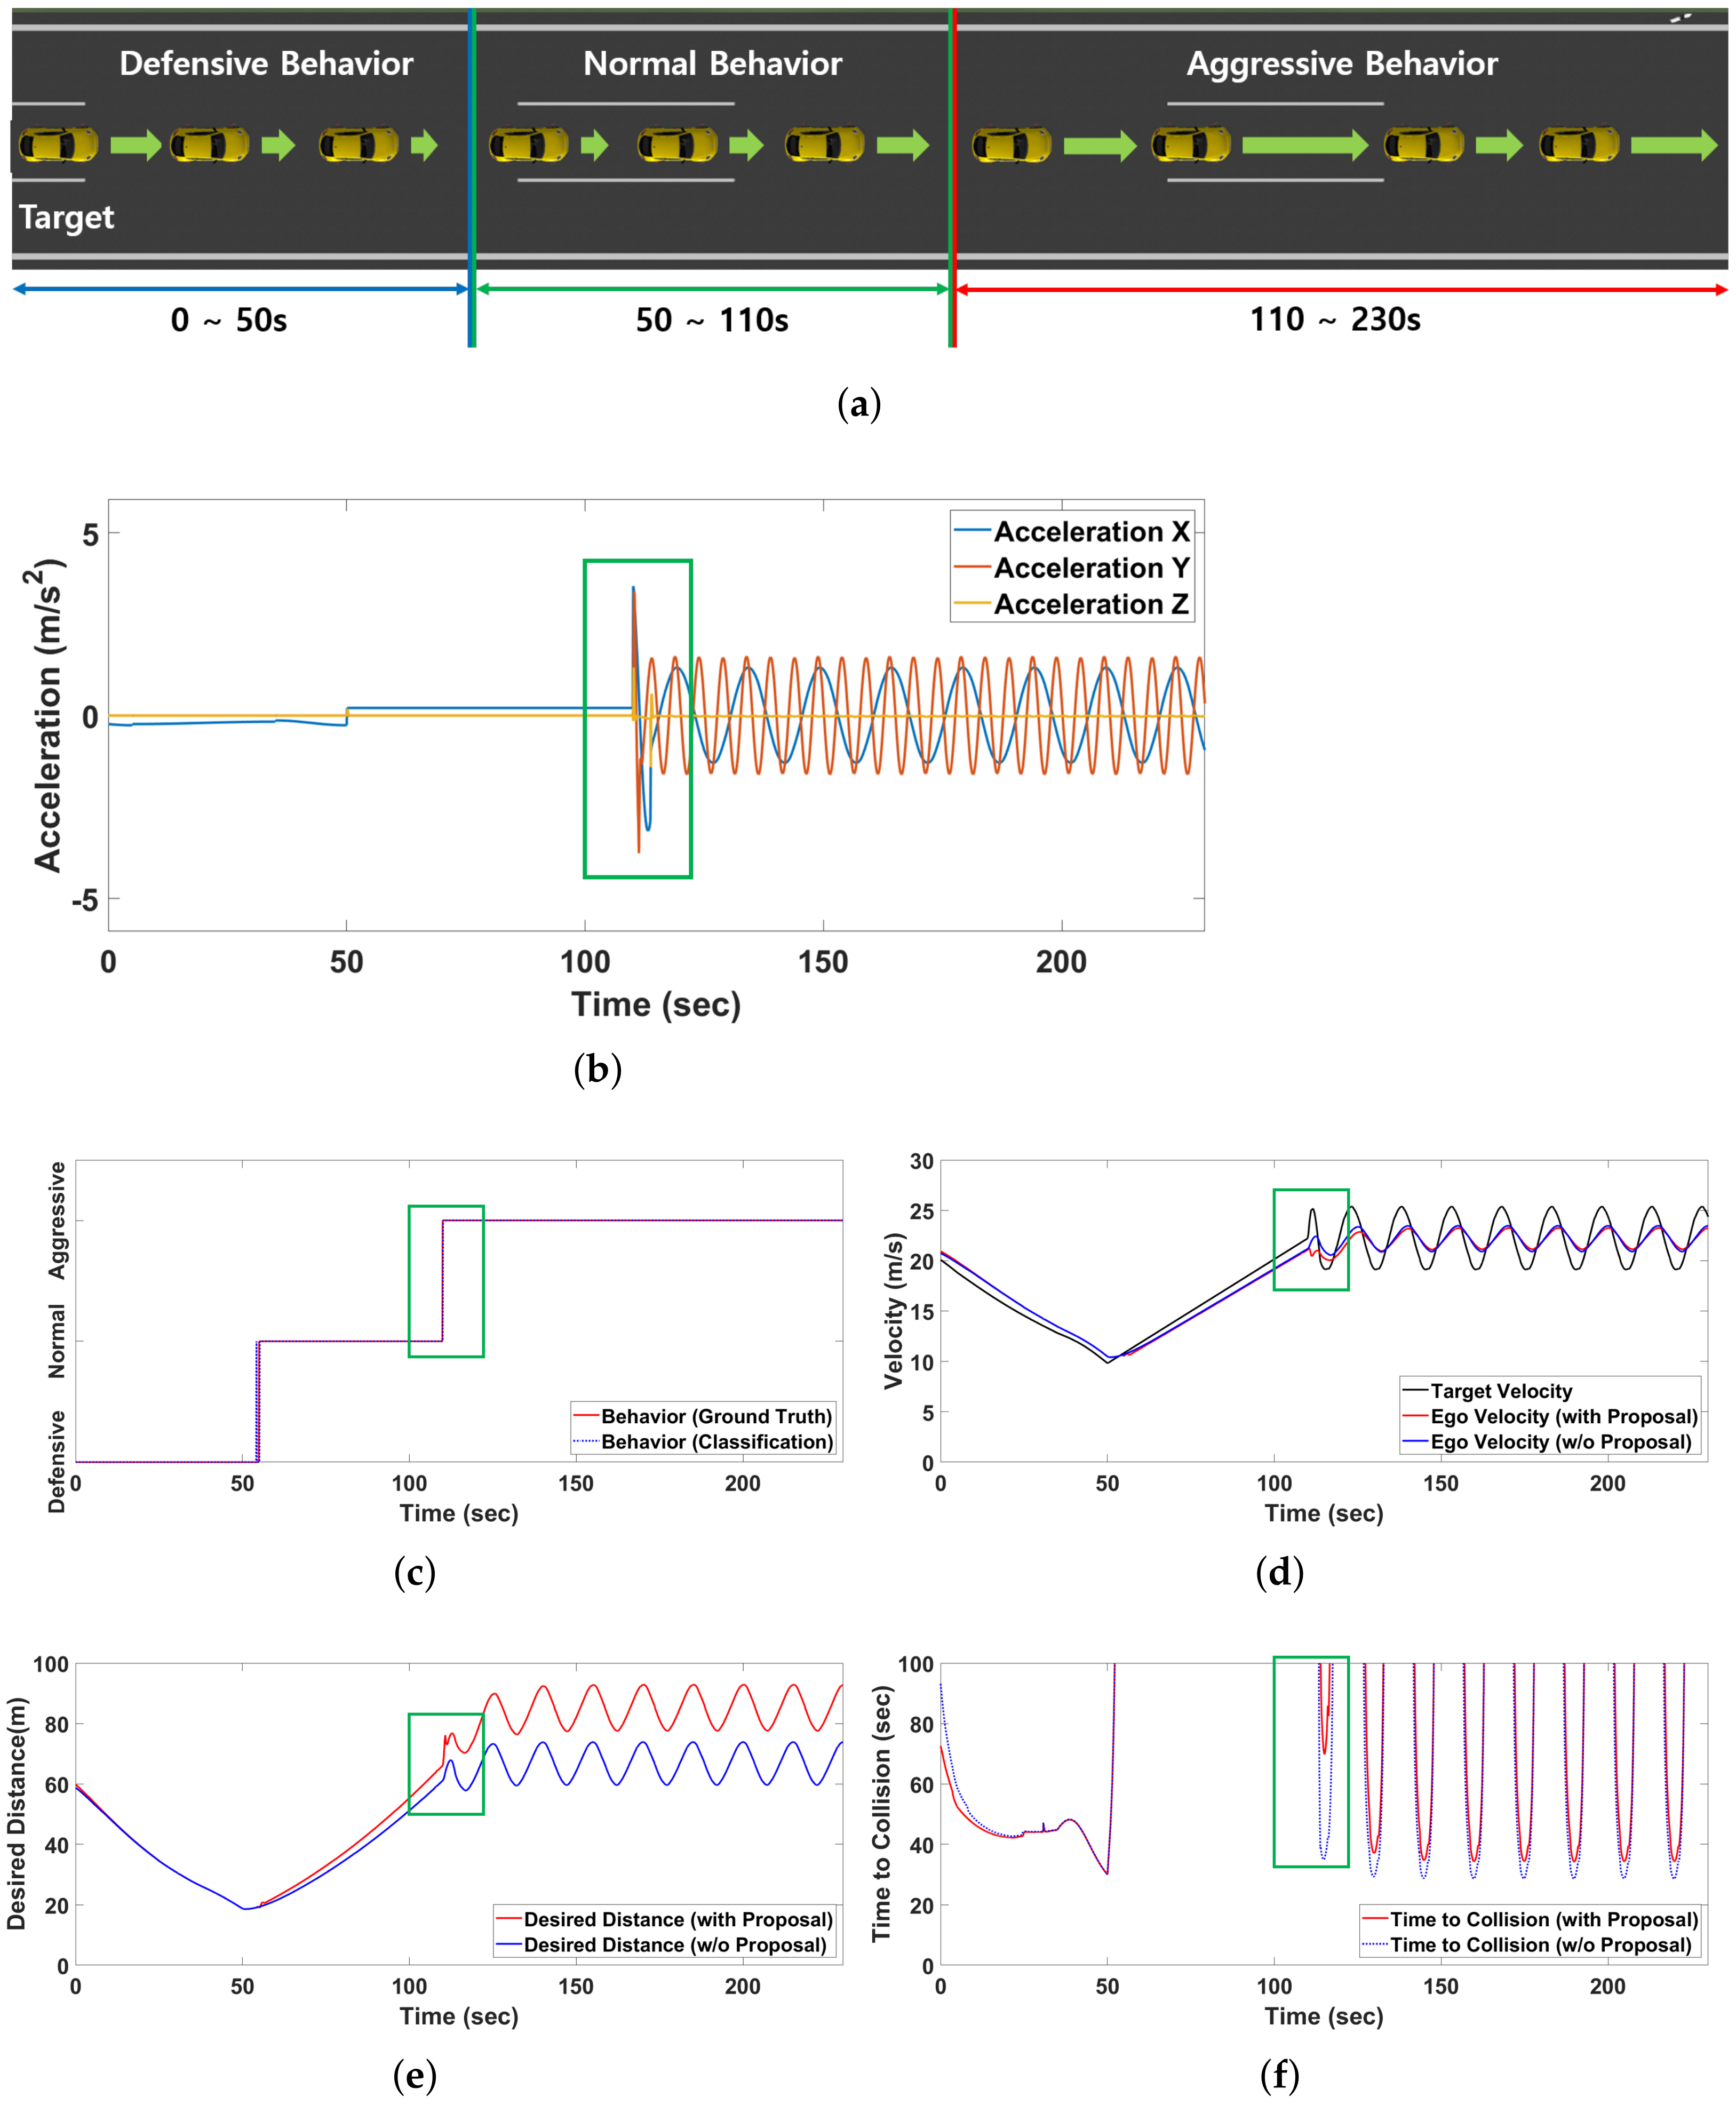
4.2. Simulation Result of Driving Behavior Prediction
4.3. Effectiveness of Prediction Result Sharing
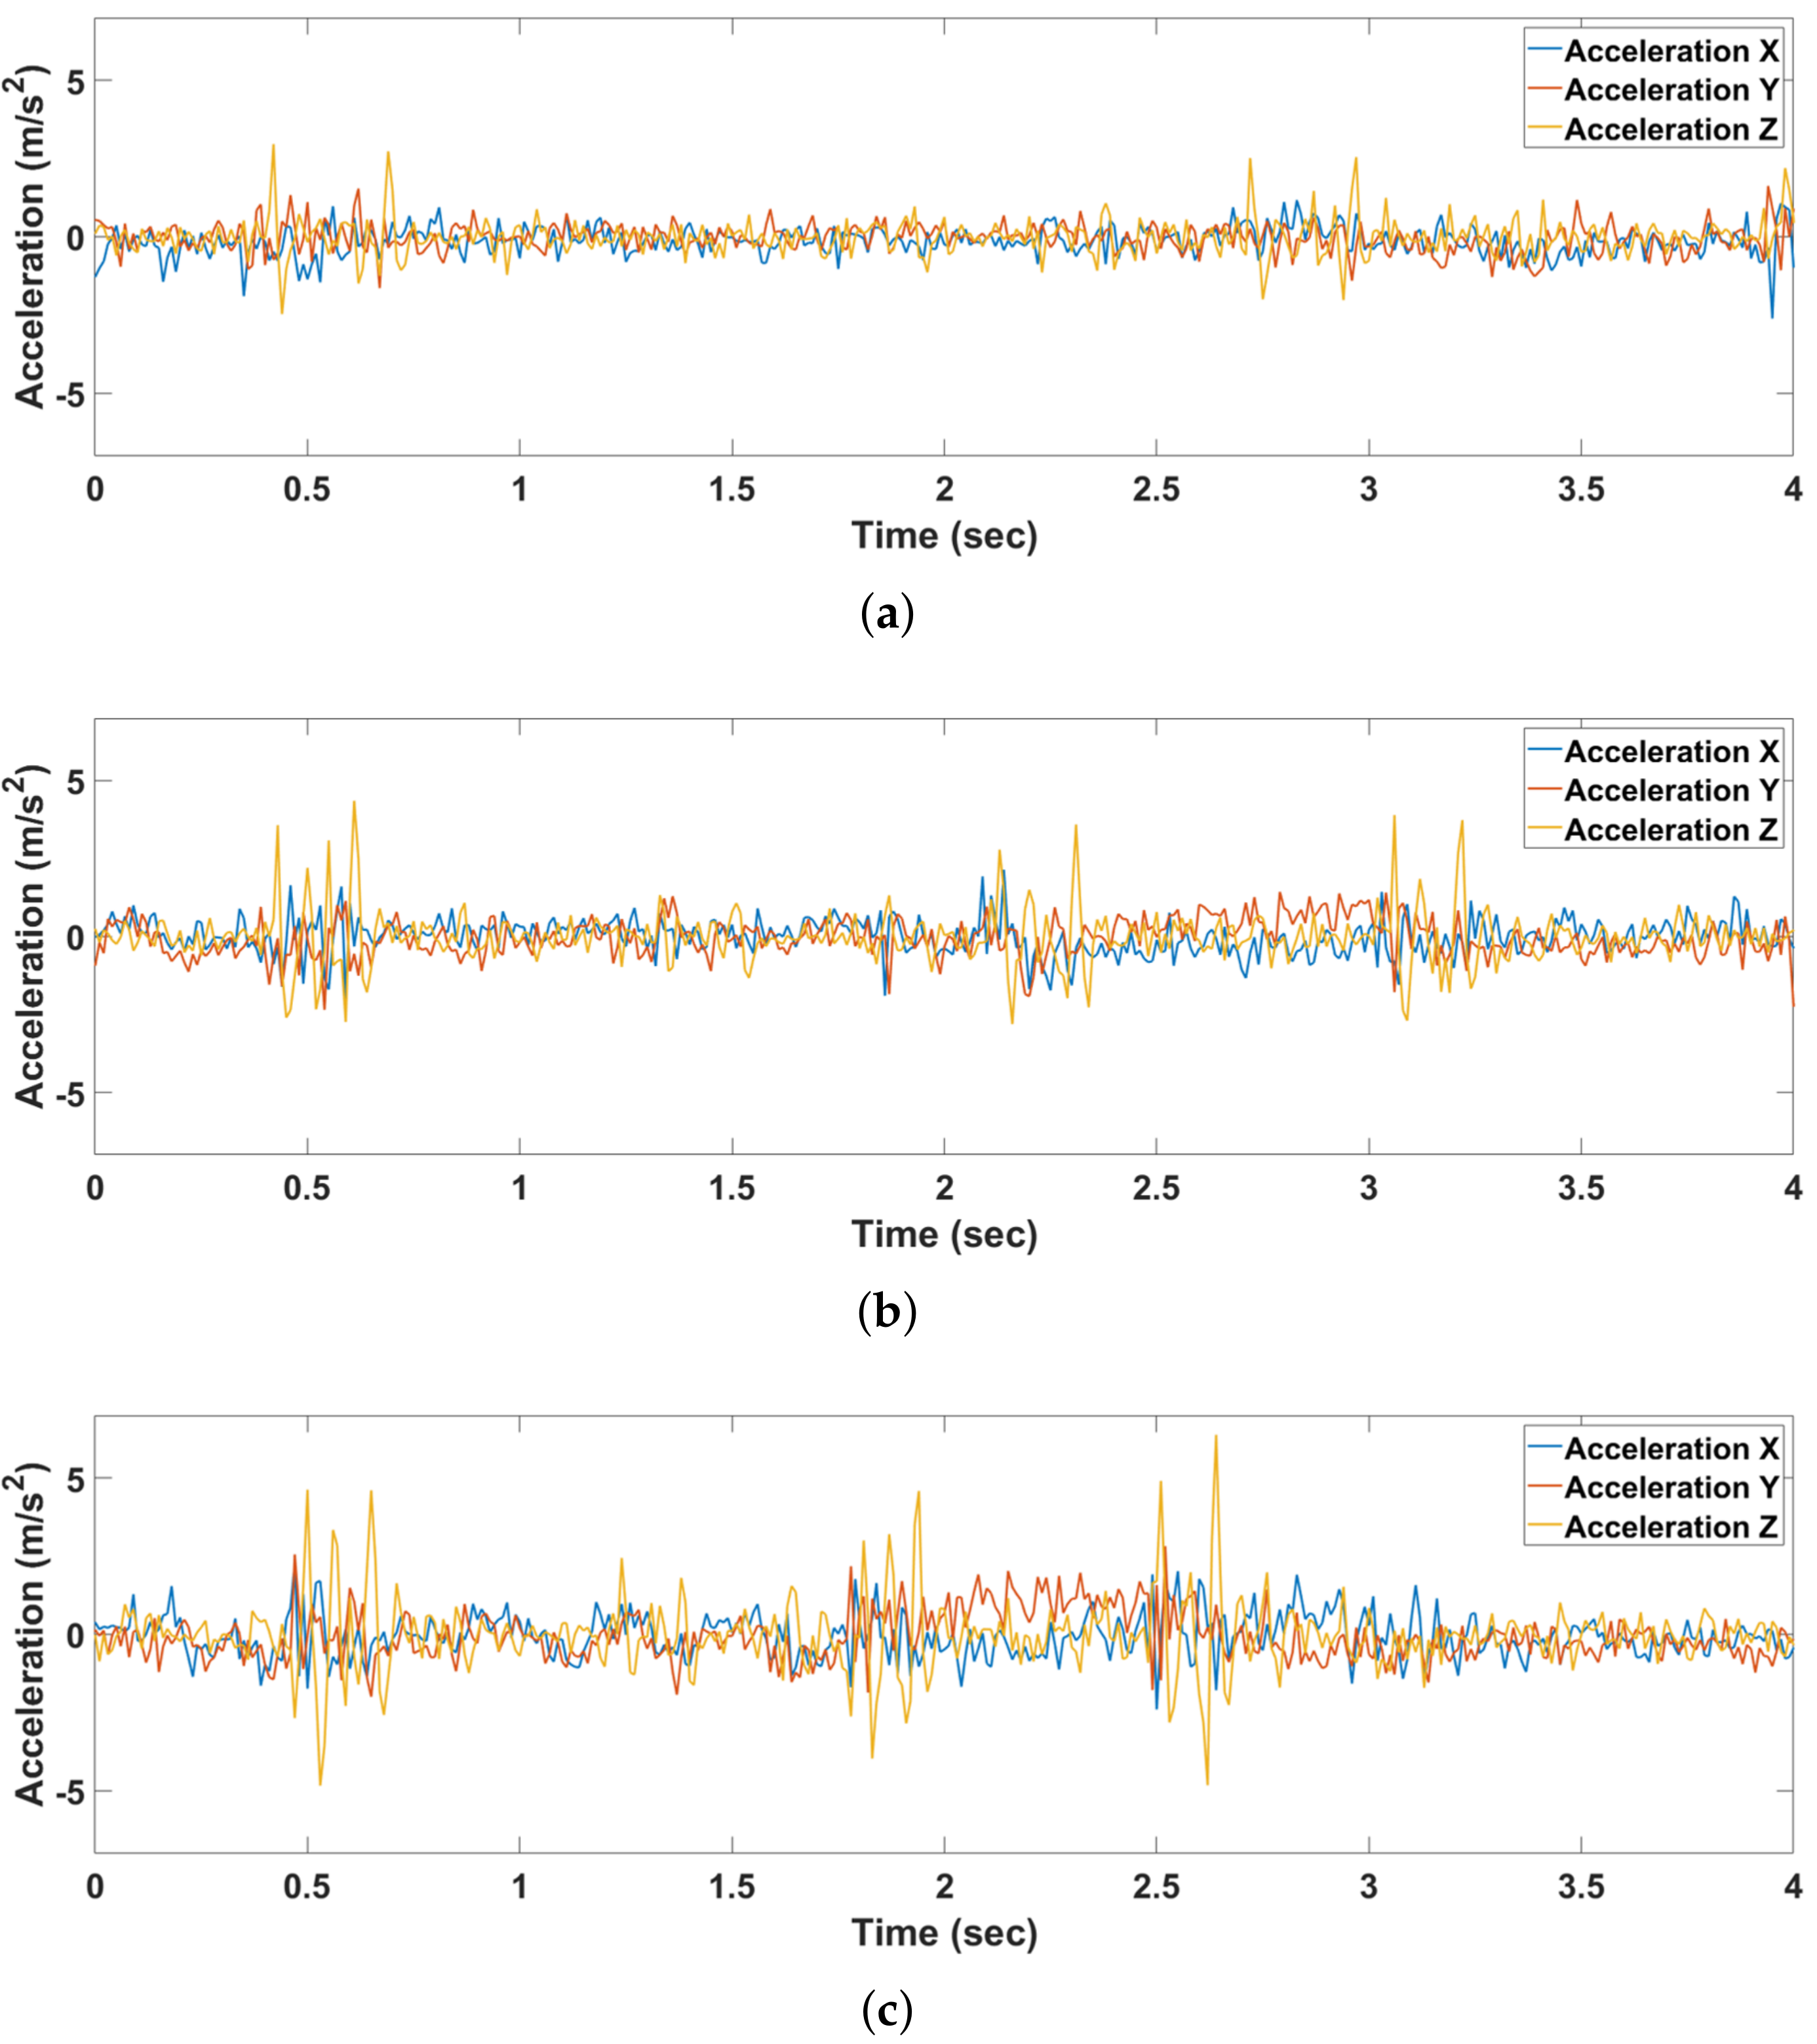
4.4. Real-World Test Results of Driving Behavior Prediction
4.5. Prediction Result Sharing via V2X
5. Conclusions
Author Contributions
Funding
Institutional Review Board Statement
Informed Consent Statement
Data Availability Statement
Conflicts of Interest
References
- Prakash, C.D.; Akhbari, F.; Karam, L.J. Robust Obstacle Detection for Advanced Driver Assistance Systems Using Distortions of Inverse Perspective Mapping of a Monocular Camera. Rob. Auton. Syst. 2018, 114, 172–186. [Google Scholar] [CrossRef]
- Feng, D.; Haase-Schutz, C.; Rosenbaum, L.; Hertlein, H.; Glaser, C.; Timm, F.; Wiesbeck, W.; Dietmayer, K. Deep Multi-Modal Object Detection and Semantic Segmentation for Autonomous Driving: Datasets, Methods, and Challenges. IEEE Trans. Intell. Transp. Syst. 2021, 22, 1341–1360. [Google Scholar] [CrossRef] [Green Version]
- Rajaram, R.N.; Ohn-Bar, E.; Trivedi, M.M. RefineNet: Refining Object Detectors for Autonomous Driving. IEEE Trans. Intell. Veh. 2016, 1, 358–368. [Google Scholar] [CrossRef]
- Santini, S.; Albarella, N.; Arricale, V.M.; Brancati, R.; Sakhnevych, A. On-Board Road Friction Estimation Technique for Autonomous Driving Vehicle-Following Maneuvers. Appl. Sci. 2021, 11, 2197. [Google Scholar]
- Brunetti, A.; Buongiorno, D.; Trotta, G.F.; Bevilacqua, V. Computer Vision and Deep Learning Techniques for Pedestrian Detection and Tracking: A Survey. Neurocomputing 2018, 300, 17–33. [Google Scholar]
- Wu, Z.; Qiu, K.; Gao, H. Driving Policies of V2X Autonomous Vehicles Based on Reinforcement Learning Methods. IET Intell. Transp. Syst. 2020, 14, 331–337. [Google Scholar]
- Jung, C.; Lee, D.; Lee, S.; Shim, D.H. V2X-Communication-Aided Autonomous Driving: System Design and Experimental Validation. Sensors 2020, 20, 2903. [Google Scholar] [CrossRef]
- Waschl, H.; Schmied, R.; Reischl, D.; Stolz, M. A Virtual Development and Evaluation Framework for ADAS—Case Study of a P-ACC in a Connected Environment. In Control Strategies for Advanced Driver Assistance Systems and Autonomous Driving Functions; Springer International Publishing: Cham, Switzerland, 2019; pp. 107–131. [Google Scholar]
- Malik, S.; Khan, M.A.; El-Sayed, H. Collaborative Autonomous Driving-A Survey of Solution Approaches and Future Challenges. Sensors 2021, 21, 3783. [Google Scholar] [CrossRef] [PubMed]
- Jahangiri, A.; Berardi, V.J.; Ghanipoor Machiani, S. Application of Real Field Connected Vehicle Data for Aggressive Driving Identification on Horizontal Curves. IEEE Trans. Intell. Transp. Syst. 2018, 19, 2316–2324. [Google Scholar] [CrossRef] [Green Version]
- Hennessy, D.A.; Wiesenthal, D.L. Traffic Congestion, Driver Stress, and Driver Aggression. Aggress. Behav. 1999, 25, 409–423. [Google Scholar] [CrossRef]
- Chung, W.-Y.; Chong, T.-W.; Lee, B.-G. Methods to Detect and Reduce Driver Stress: A Review. Int. J. Automot. Technol. 2019, 20, 1051–1063. [Google Scholar]
- Yang, Q.; Chen, H.; Chen, Z.; Su, J. Introspective False Negative Prediction for Black-Box Object Detectors in Autonomous Driving. Sensors 2021, 21, 2819. [Google Scholar] [CrossRef]
- Zhu, M.; Wang, Y.; Pu, Z.; Hu, J.; Wang, X.; Ke, R. Safe, Efficient, and Comfortable Velocity Control Based on Reinforcement Learning for Autonomous Driving. Transp. Res. Part C Emerg. Technol. 2020, 117, 102662. [Google Scholar] [CrossRef]
- Road Traffic Injuries. Available online: https://www.who.int/news-room/fact-sheets/detail/road-traffic-injuries (accessed on 9 September 2021).
- Aydelotte, J.D.; Brown, L.H.; Luftman, K.M.; Mardock, A.L.; Teixeira, P.G.R.; Coopwood, B.; Brown, C.V.R. Crash Fatality Rates after Recreational Marijuana Legalization in Washington and Colorado. Am. J. Public Health 2017, 107, 1329–1331. [Google Scholar] [CrossRef]
- American Automobile Association: Aggressive Driving: Research Update. Available online: https://www.aaafoundation.org/sites/default/files/AggressiveDrivingResearchUpdate2009.pdf (accessed on 9 September 2021).
- Muhammad, K.; Ullah, A.; Lloret, J.; Ser, J.D.; de Albuquerque, V.H.C. Deep Learning for Safe Autonomous Driving: Current Challenges and Future Directions. IEEE Trans. Intell. Transp. Syst. 2021, 22, 4316–4336. [Google Scholar]
- Islam, M.; Mannering, F. A Temporal Analysis of Driver-Injury Severities in Crashes Involving Aggressive and Non-Aggressive Driving. Anal. Methods Accid. Res. 2020, 27, 100128. [Google Scholar]
- Tong, W.; Hussain, A.; Bo, W.X.; Maharjan, S. Artificial Intelligence for Vehicle-to-Everything: A Survey. IEEE Access 2019, 7, 1. [Google Scholar] [CrossRef]
- IPG Automotive GmbH. CarMaker. Available online: https://ipg-automotive.com/products-services/simulation-software/carmaker/ (accessed on 9 September 2021).
- Mihelj, J.; Kos, A.; Sedlar, U. Implicit Aggressive Driving Detection in Social VANET. Procedia Comput. Sci. 2018, 129, 348–352. [Google Scholar]
- Ma, Y.; Zhang, Z.; Chen, S.; Yu, Y.; Tang, K. A Comparative Study of Aggressive Driving Behavior Recognition Algorithms Based on Vehicle Motion Data. IEEE Access 2019, 7, 8028–8038. [Google Scholar] [CrossRef]
- Rongben, W.; Lie, G.; Bingliang, T.; Lisheng, J. Monitoring Mouth Movement for Driver Fatigue or Distraction with One Camera. In Proceedings of the 7th International IEEE Conference on Intelligent Transportation Systems (IEEE Cat. No.04TH8749), Washington, WA, USA, 3–6 October 2004; IEEE: New York, NY, USA, 2005. [Google Scholar]
- Devi, M.S.; Bajaj, P.R. Driver Fatigue Detection Based on Eye Tracking. In Proceedings of the 2008 First International Conference on Emerging Trends in Engineering and Technology, Nagpur, India, 16–18 July 2008; IEEE: New York, NY, USA, 2008. [Google Scholar]
- Dai, J.; Teng, J.; Bai, X.; Shen, Z.; Xuan, D. Mobile Phone Based Drunk Driving Detection. In Proceedings of the 4th International ICST Conference on Pervasive Computing Technologies for Healthcare, Munich, Germany, 22–25 March 2010; IEEE: New York, NY, USA, 2010. [Google Scholar]
- Johnson, D.A.; Trivedi, M.M. Driving Style Recognition Using a Smartphone as a Sensor Platform. In Proceedings of the 2011 14th International IEEE Conference on Intelligent Transportation Systems (ITSC), Washington, DC, USA, 5–7 October 2011; IEEE: New York, NY, USA, 2011. [Google Scholar]
- Singh, P.; Juneja, N.; Kapoor, S. Using Mobile Phone Sensors to Detect Driving Behavior. In Proceedings of the 3rd ACM Symposium on Computing for Development—ACM DEV’13, Bangalore, India, 11–12 January 2013; ACM Press: New York, NY, USA, 2013. [Google Scholar]
- Yurtsever, E.; Lambert, J.; Carballo, A.; Takeda, K. A Survey of Autonomous Driving: Common Practices and Emerging Technologies. IEEE Access 2020, 8, 58443–58469. [Google Scholar] [CrossRef]
- Chhabra, R.; Verma, S.; Krishna, C.R. A Survey on Driver Behavior Detection Techniques for Intelligent Transportation Systems. In Proceedings of the 2017 7th International Conference on Cloud Computing, Data Science & Engineering—Confluence, Noida, India, 12–13 January 2017; IEEE: New York, NY, USA, 2017. [Google Scholar]
- Alkinani, M.H.; Khan, W.Z.; Arshad, Q. Detecting Human Driver Inattentive and Aggressive Driving Behavior Using Deep Learning: Recent Advances, Requirements and Open Challenges. IEEE Access 2020, 8, 105008–105030. [Google Scholar] [CrossRef]
- Alluhaibi, S.K.; Al-Din, M.S.N.; Moyaid, A. Driver Behavior Detection Techniques: A Survey. Int. J. Appl. Eng. Res. 2018, 13, 8856–8861. [Google Scholar]
- Carvalho, E.; Ferreira, B.V.; Ferreira, J.; de Souza, C.; Carvalho, H.V.; Suhara, Y.; Pentland, A.S.; Pessin, G. Exploiting the Use of Recurrent Neural Networks for Driver Behavior Profiling. In Proceedings of the 2017 International Joint Conference on Neural Networks (IJCNN), Anchorage, AK, USA, 14–19 May 2017; IEEE: New York, NY, USA, 2017. [Google Scholar]
- Shahverdy, M.; Fathy, M.; Berangi, R.; Sabokrou, M. Driver Behavior Detection and Classification Using Deep Convolutional Neural Networks. Expert Syst. Appl. 2020, 149, 113240. [Google Scholar]
- Mekruksavanich, S.; Jitpattanakul, A. LSTM Networks Using Smartphone Data for Sensor-Based Human Activity Recognition in Smart Homes. Sensors 2021, 21, 1636. [Google Scholar] [CrossRef]
- Zebin, T.; Sperrin, M.; Peek, N.; Casson, A.J. Human Activity Recognition from Inertial Sensor Time-Series Using Batch Normalized Deep LSTM Recurrent Networks. Annu. Int. Conf. IEEE Eng. Med. Biol. Soc. 2018, 2018, 1–4. [Google Scholar] [PubMed] [Green Version]
- Mumcuoglu, M.E.; Alcan, G.; Unel, M.; Cicek, O.; Mutluergil, M.; Yilmaz, M.; Koprubasi, K. Driving Behavior Classification Using Long Short Term Memory Networks. In Proceedings of the 2019 AEIT International Conference of Electrical and Electronic Technologies for Automotive (AEIT AUTOMOTIVE), Turin, Italy, 2–4 July 2019; IEEE: New York, NY, USA, 2019. [Google Scholar]
- Hochreiter, S.; Schmidhuber, J. Long Short-Term Memory. Neural. Comput. 1997, 9, 1735–1780. [Google Scholar] [CrossRef]
- Li, F.; Liu, M.; Zhao, Y.; Kong, L.; Dong, L.; Liu, X.; Hui, M. Feature Extraction and Classification of Heart Sound Using 1D Convolutional Neural Networks. EURASIP J. Adv. Signal Process. 2019, 2019, 59. [Google Scholar] [CrossRef] [Green Version]
- Kiranyaz, S.; Ince, T.; Gabbouj, M. Real-Time Patient-Specific ECG Classification by 1-D Convolutional Neural Networks. IEEE Trans. Biomed. Eng. 2016, 63, 664–675. [Google Scholar] [CrossRef]
- Uddin, M.Z.; Hassan, M.M. Activity Recognition for Cognitive Assistance Using Body Sensors Data and Deep Convolutional Neural Network. IEEE Sens. J. 2019, 19, 8413–8419. [Google Scholar] [CrossRef]
- Yu, Y.; Si, X.; Hu, C.; Zhang, J. A Review of Recurrent Neural Networks: LSTM Cells and Network Architectures. Neural. Comput. 2019, 31, 1235–1270. [Google Scholar] [CrossRef]
- Gupta, R.; Gupta, A.; Aswal, R. Time-CNN and Stacked LSTM for Posture Classification. In Proceedings of the 2021 International Conference on Computer Communication and Informatics (ICCCI), Coimbatore, India, 27–29 January 2021; IEEE: New York, NY, USA, 2021. [Google Scholar]
- AAA Exchange Advocacy. Communicatio. Education. Available online: https://exchange.aaa.com/safety/driving-advice/aggressive-driving/ (accessed on 28 October 2021).
- Department of Motor Vehicles; New York State. Available online: https://dmv.ny.gov/about-dmv/chapter-8-defensive-driving (accessed on 28 October 2021).
- Magdici, S.; Althoff, M. Adaptive Cruise Control with Safety Guarantees for Autonomous Vehicles. IFAC-PapersOnLine 2017, 50, 5774–5781. [Google Scholar] [CrossRef]


| Environment Variable | ||||
|---|---|---|---|---|
| Types | Total Road Length | Road Section | Limit Speed | # of Lanes |
| DGIST Campus | 2256.3 m | 0∼2256.3 m | 30.0 km/h | 1 |
| Highway | 5509.0 m | 0∼2790 m 2790∼3020 m 3020∼5509 m | 100.0 km/h | 3 2 3 |
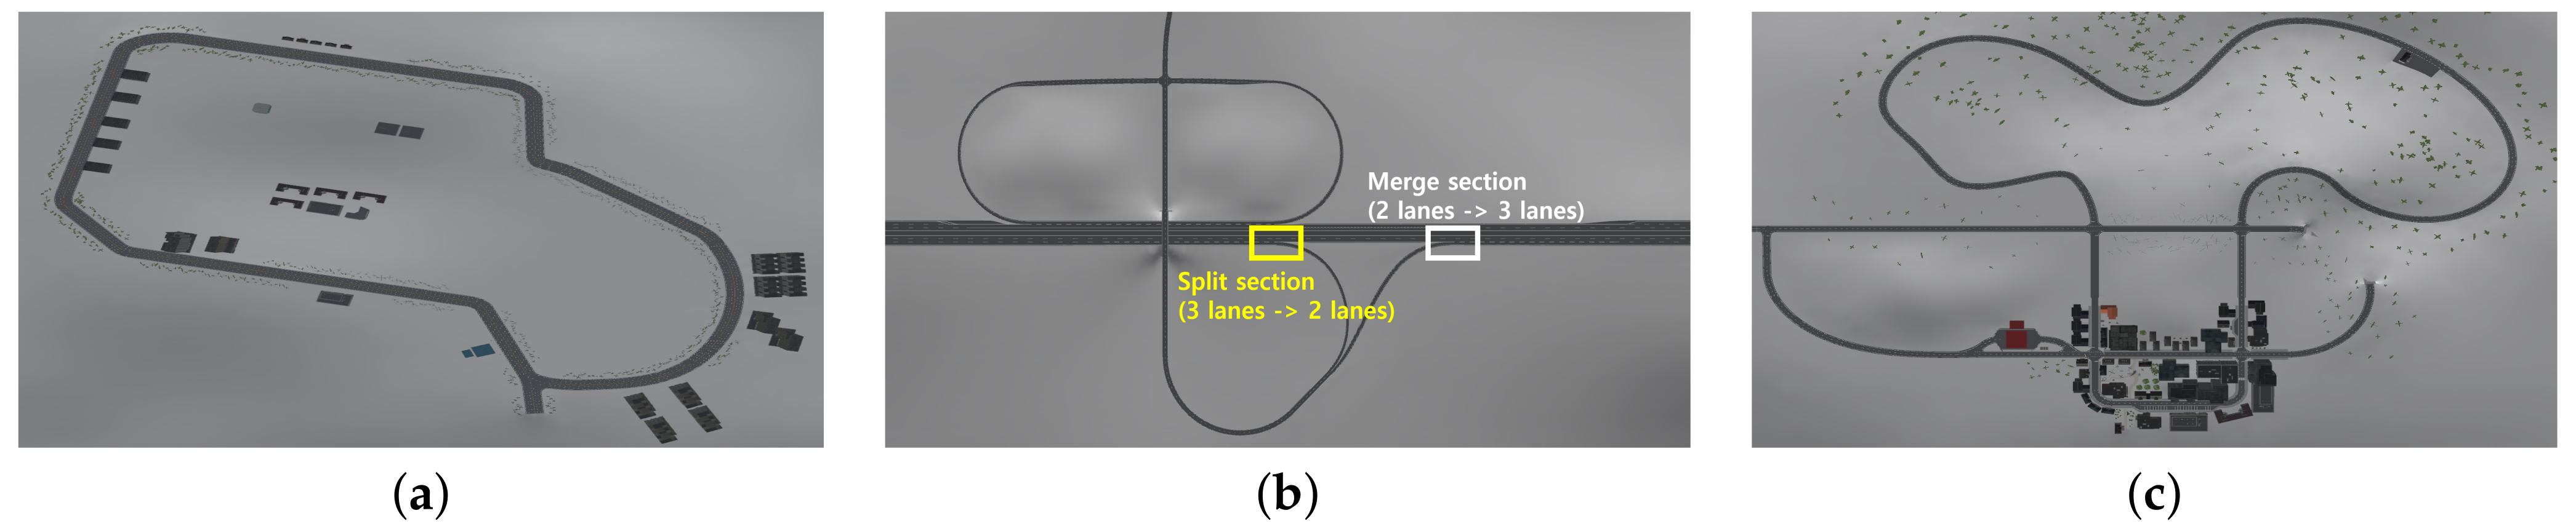
| Urban | 4154.5m | 0∼280 m 280∼315 m 315∼1470 m 1470∼1530 m 1530∼1855 m 1855∼1930 m 1930∼2175 m 2175∼4154.5 m | 30.0 km/h 50.0 km/h 70.0 km/h 50.0 km/h 80.0 km/h 70.0 km/h 50.0 km/h 70.0 km/h | 1 |
| Defensive Behavior (m/s) | |||
|---|---|---|---|
| Acceleration X | Acceleration Y | Acceleration Z | |
| Median | 0.0209606 | 0.0041105 | −0.0003024 |
| Standard Deviation | 0.439897633 | 0.517115998 | 0.263576081 |
| Normal Behavior (m/s) | |||
| Acceleration X | Acceleration Y | Acceleration Z | |
| Median | 0.0176545 | 0.0027567 | −0.0005219 |
| Standard Deviation | 0.519467419 | 0.876498761 | 0.373084299 |
| Aggressive Behavior (m/s) | |||
| Acceleration X | Acceleration Y | Acceleration Z | |
| Median | 0.07252035 | 0.02170125 | −0.00392755 |
| Standard Deviation | 0.915436498 | 1.462502723 | 0.491320123 |
| Environments | Behavior (Ground Truth) | ||||
|---|---|---|---|---|---|
| Defensive | Normal | Aggressive | Total Data | ||
| Simulation | DGIST | 4440 | 3412 | 3292 | 11144 |
| Urban | 3777 | 3002 | 1666 | 8445 | |
| Highway | 4257 | 3271 | 3124 | 10652 | |
| Real world | DGIST | 2812 | 2248 | 1886 | 6946 |
| Networks | 1D-CNN | 2D-CNN | LSTM |
| Training Time (s) | 17.82742023 | 476.4470894 | 163.4962823 |
| Networks | CNN-LSTM | 4CNN-LSTM | 4CNN-2LSTM |
| Training Time (s) | 37.72614694 | 92.75716472 | 75.77209926 |
| Validation | Output Label | |||
|---|---|---|---|---|
| Input: 5 s | Networks | Defensive | Normal | Aggressive |
| Defensive | 1D-CNN | 92.87% | 6.49% | 0.63% |
| 2D-CNN | 95.04% | 0.29% | 4.66% | |
| LSTM | 93.02% | 4.13% | 2.86% | |
| CNN-LSTM | 94.24% | 5.76% | 0.00% | |
| 4CNN-LSTM | 97.02% | 2.91% | 0.07% | |
| 4CNN-2LSTM | 99.52% | 0.41% | 0.07% | |
| Normal | 1D-CNN | 29.4% | 67.23% | 3.37% |
| 2D-CNN | 0.32% | 91.56% | 8.11% | |
| LSTM | 62.23% | 18.53% | 19.24% | |
| CNN-LSTM | 19.92% | 79.92% | 0.16% | |
| 4CNN-LSTM | 1.78% | 97.92% | 0.29% | |
| 4CNN-2LSTM | 3.29% | 96.39% | 0.32% | |
| Aggressive | 1D-CNN | 3.39% | 6.89% | 89.72% |
| 2D-CNN | 0.21% | 0.07% | 99.73% | |
| LSTM | 15.83% | 9.22% | 74.95% | |
| CNN-LSTM | 0.65% | 4.08% | 95.27% | |
| 4CNN-LSTM | 0.14% | 0.41% | 99.45% | |
| 4CNN-2LSTM | 0.16% | 0.19% | 99.65% | |
| Test: DGIST Campus | Output Label | |||
|---|---|---|---|---|
| Input: 5 s | Networks | Defensive | Normal | Aggressive |
| Defensive | 1D-CNN | 95.11% | 3.68% | 0.21% |
| 2D-CNN | 91.91% | 7.71% | 0.39% | |
| LSTM | 58.91% | 2.02% | 39.07% | |
| CNN-LSTM | 94.84% | 5.13% | 0.04% | |
| 4CNN-LSTM | 97.45% | 2.4% | 0.14% | |
| 4CNN-2LSTM | 97.74% | 2.12% | 0.14% | |
| Normal | 1D-CNN | 5.58% | 90.83% | 3.59% |
| 2D-CNN | 4.32% | 94.79% | 0.89% | |
| LSTM | 40.05% | 2.35% | 57.60% | |
| CNN-LSTM | 1.95% | 94.64% | 3.41% | |
| 4CNN-LSTM | 2.53% | 97.03% | 0.44% | |
| 4CNN-2LSTM | 0.97% | 97.83% | 1.2% | |
| Aggressive | 1D-CNN | 1.11% | 5.91% | 92.99% |
| 2D-CNN | 1.5% | 3.56% | 94.95% | |
| LSTM | 9.55% | 2.53% | 87.92% | |
| CNN-LSTM | 0.42% | 2.8% | 96.78% | |
| 4CNN-LSTM | 0.79% | 4.17% | 95.04% | |
| 4CNN-2LSTM | 0.0% | 2.22% | 97.78% | |
| Test: Urban road | Output Label | |||
|---|---|---|---|---|
| Input: 5 s | Networks | Defensive | Normal | Aggressive |
| Defensive | 1D-CNN | 89.72% | 9.8% | 0.48% |
| 2D-CNN | 92.64% | 6.67% | 0.69% | |
| LSTM | 91.58% | 1.72% | 6.69% | |
| CNN-LSTM | 81.7% | 18.19% | 1.17% | |
| 4CNN-LSTM | 94.62% | 5.38% | 0.0% | |
| 4CNN-2LSTM | 94.14% | 5.82% | 0.05% | |
| Normal | 1D-CNN | 36.52% | 60.04% | 3.44% |
| 2D-CNN | 3.44% | 93.86% | 2.69% | |
| LSTM | 71.54% | 6.29% | 22.18% | |
| CNN-LSTM | 10.87% | 87.97% | 1.17% | |
| 4CNN-LSTM | 2.63% | 97.1% | 0.27% | |
| 4CNN-2LSTM | 1.5% | 97.82% | 0.69% | |
| Aggressive | 1D-CNN | 5.11% | 9.88% | 85.01% |
| 2D-CNN | 1.71% | 16.27% | 82.01% | |
| LSTM | 38.56% | 2.84% | 58.60% | |
| CNN-LSTM | 0.31% | 6.67% | 93.02% | |
| 4CNN-LSTM | 0.31% | 1.5% | 98.19% | |
| 4CNN-2LSTM | 0.03% | 1.12% | 98.85% | |
| Test: Highway | Output Label | |||
|---|---|---|---|---|
| Input: 5 s | Networks | Defensive | Normal | Aggressive |
| Defensive | 1D-CNN | 92.46% | 7.02% | 0.52% |
| 2D-CNN | 97.3% | 2.68% | 0.02% | |
| LSTM | 92.58% | 4.56% | 2.87% | |
| CNN-LSTM | 93.59% | 6.41% | 0.0% | |
| 4CNN-LSTM | 95.02% | 4.91% | 0.07% | |
| 4CNN-2LSTM | 99.48% | 0.45% | 0.07% | |
| Normal | 1D-CNN | 30.91% | 65.45% | 3.64% |
| 2D-CNN | 2.45% | 97.28% | 0.28% | |
| LSTM | 62.86% | 19.35% | 17.79% | |
| CNN-LSTM | 21.28% | 78.51% | 0.21% | |
| 4CNN-LSTM | 4.4% | 95.17% | 0.43% | |
| 4CNN-2LSTM | 0.73% | 99.21% | 0.06% | |
| Aggressive | 1D-CNN | 3.04% | 6.95% | 90.01% |
| 2D-CNN | 0.42% | 0.22% | 99.36% | |
| LSTM | 14.6% | 8.8% | 76.60% | |
| CNN-LSTM | 0.51% | 2.88% | 96.61% | |
| 4CNN-LSTM | 0.13% | 0.38% | 99.49% | |
| 4CNN-2LSTM | 0.0% | 0.06% | 99.94% | |
| Test: Real World DGIST Campus | Output Label | |||
|---|---|---|---|---|
| Input: 5 s | Networks | Defensive | Normal | Aggressive |
| Defensive | 1D-CNN | 97.51% | 2.13% | 0.36% |
| 2D-CNN | 99.15% | 0.64% | 0.21% | |
| LSTM | 90.58% | 6.51% | 2.92% | |
| CNN-LSTM | 95.8% | 4.2% | 0.0% | |
| 4CNN-LSTM | 98.08% | 1.53% | 0.39% | |
| 4CNN-2LSTM | 98.65% | 0.428% | 0.002% | |
| Normal | 1D-CNN | 2.49% | 96.93% | 0.58% |
| 2D-CNN | 2.7% | 96.41% | 0.89% | |
| LSTM | 54.67% | 21.44% | 23.89% | |
| CNN-LSTM | 2.31% | 97.24% | 0.44% | |
| 4CNN-LSTM | 0.62% | 98.49% | 0.89% | |
| 4CNN-2LSTM | 0.013% | 99.82% | 0.04% | |
| Aggressive | 1D-CNN | 0.64% | 1.86% | 97.51% |
| 2D-CNN | 1.37% | 2.37% | 96.26% | |
| LSTM | 13.47% | 14.85% | 71.69% | |
| CNN-LSTM | 0.37% | 8.54% | 91.09% | |
| 4CNN-LSTM | 0.21% | 1.11% | 98.67% | |
| 4CNN-2LSTM | 0.0% | 0.16% | 99.84% | |
Publisher’s Note: MDPI stays neutral with regard to jurisdictional claims in published maps and institutional affiliations. |
© 2021 by the authors. Licensee MDPI, Basel, Switzerland. This article is an open access article distributed under the terms and conditions of the Creative Commons Attribution (CC BY) license (https://creativecommons.org/licenses/by/4.0/).
Share and Cite
Kwon, S.K.; Seo, J.H.; Yun, J.Y.; Kim, K.-D. Driving Behavior Classification and Sharing System Using CNN-LSTM Approaches and V2X Communication. Appl. Sci. 2021, 11, 10420. https://doi.org/10.3390/app112110420
Kwon SK, Seo JH, Yun JY, Kim K-D. Driving Behavior Classification and Sharing System Using CNN-LSTM Approaches and V2X Communication. Applied Sciences. 2021; 11(21):10420. https://doi.org/10.3390/app112110420
Chicago/Turabian StyleKwon, Seong Kyung, Ji Hwan Seo, Jun Young Yun, and Kyoung-Dae Kim. 2021. "Driving Behavior Classification and Sharing System Using CNN-LSTM Approaches and V2X Communication" Applied Sciences 11, no. 21: 10420. https://doi.org/10.3390/app112110420
APA StyleKwon, S. K., Seo, J. H., Yun, J. Y., & Kim, K.-D. (2021). Driving Behavior Classification and Sharing System Using CNN-LSTM Approaches and V2X Communication. Applied Sciences, 11(21), 10420. https://doi.org/10.3390/app112110420