Abstract
In this study, qualitative tests were carried out to compare the behaviour of selected slabs exposed to short- and long-term loading. Full-scale models of the half-slab and hollow-core slab with dimensions of 6.30 m × 6.30 m, built of four different precast panels, were tested. The first two were semi-precast lattice girder slabs, the third semi-precast prestressed ribbed panels, and the last was composed of hollow-core panels. A common feature was the lack of joint reinforcement and the same modular width of 600 mm. The short-term load was applied sequentially in the first stage, and displacement was measured using an electronic method. In the second stage of long-term testing, the load was mainly applied to one part of the slab. Testing under short-term and long-term load allows determining the change in the performance of panel slabs over time. The panels maintained the ability of load redistribution based on their interaction despite the work of the longitudinal joints being only through the concrete cross-section. The behaviour of slabs with concrete topping shows more significant lateral interactions than elements connected only by shear key. Comparative calculations were made based on four computational models. Comparative analysis showed that the current design procedures lead to a safe but conservative estimation of the slab behaviour.
1. Introduction
Composite slabs with precast panels are being increasingly used in the construction sector as an alternative to monolithic slabs or beam and block systems [1]. Half-slabs consist of (flat or ribbed) reinforced concrete or prestressed slab serving as stay-in-place formwork and monolithic concrete topping. Compared to beam and block floor systems or monolithic slabs, use of this type of structure is characterised by allowing a rapid erection time requiring lower work input in addition to having elements of relatively low cost [2,3,4]. Prestressed slabs are more crack-resistant and lighter at the same length, allowing considerably greater spans. Being able to reduce the number of erection supports to a minimum is a crucial advantage of panel slabs, as they usually tend to be self-supporting. Due to the extrusion method used during their production, the cross-section of panels can be easily shaped. Different types of filling inserts can reduce the weight of panels and improve their insulation properties [5,6,7]. Many tests have been performed in recent years, and new types of composite slabs have been designed. They include but are not limited to a slab bonded to vertical tongues serving as shear keys that join two layers of the slab [8], multi-span slabs of slimfloor type with prestressed steel beams bonded to hollow-core (HC) slabs [9], and one- or two-way slabs on thin prestressed boards (narrow slabs) [10]. Basalt rebars are pretensioned using various methods [11], and steel reinforcements have been used as trusses to increase the load capacity of the joint system at the interface between ribbed precast units and concrete topping, also referred to as a joint advanced slab system (JAS) [12]. In an optimised-section precast slab (OPS), precast units with the cross-section shape at the support and the span varying over the length are also used [13].
The main area of tests carried out on composite slabs principally includes the concrete–concrete interface and the distribution of shear stresses under short- and long-term loading. A series of slant-shear and direct-shear tests were conducted [14,15,16] on test specimens. Digital image correlation (DIC) and ultrasonic techniques were used to evaluate the behaviour of the interface area [17,18,19,20]. The relationships between surface roughness and interface resistance [21,22] were also defined in the fibre-reinforced concrete used in the concrete topping slab [23]. The following issues were the subject of a separate examination: the strength of concrete components, the age of individual erected layers, and strength development of the composite structure over time [24]. It was demonstrated that a difference in concrete strength did not have a proportional effect on the composite structure strength increase. However, it affected the strength interface between the precast unit and the concrete topping. The tests also confirmed that the curing method of the concrete topping slab substantially increased the joint strength.
Stresses at the beam supports and slab were studied in full-scale models [25,26,27,28,29,30]. The behaviour of prestressed hollow-core (HC) slabs and beam and block systems have been thoroughly investigated. These studies have demonstrated the full shear connection between the concrete topping and the precast unit with a rough interface [31,32,33,34,35,36]. The tests and theoretical and numerical analyses described in the papers [37,38,39] revealed that the ultimate limit state of cracking could not be separated from the ultimate limit state of shearing for slabs with reinforcement serving as the main shear connector. An interesting observation also found in the paper [40] demonstrates that the proper connection between layers or effective anchorage of tension reinforcement at the support can lead to the full load capacity of composite members. Single tests refer to cyclic or dynamic loading in predicting and measuring the displacement amplitude at delamination [41].
Previous tests on full-size slabs with more than one precast unit have occasionally been performed [40,41,42,43]. They are mainly concerned with shaping and reinforcing the longitudinal joint in the bidirectional behaviour. The effect of reinforcement passing through inverted multi-rib panels [42] and prestressing [43] on cracking resistance and load capacity of the models of single-span strips also appear to be an intriguing aspect. The analyses concerning the effect of a rib head on the static behaviour of the unit, including delamination [44], show no impact of the inclination angle of rib planes on the load capacity of the members. Some tests focused on the connections of panels without in situ reinforcement, but only with the specifically shaped interface and reinforcement passing through sidewalls of the members [45]. They show that, inter alia, cracking resistance and load capacity at an increasing deflection of the slab made from panels with structural joints and two-way bent rebars is reduced when referring to the solid slab.
Other tests examined the effect of half-slabs’ longitudinal joint without rebar reinforcement or other connection methods only under short-term loading. The tests were usually performed on hollow-core slabs used in bridge structures [46,47]. Transmission of shearing forces is safe even for relatively small longitudinal joints (concerning dimensions of the members). Numerical analyses and shape engineering of the slab interface are presented in the papers [48,49]. The paper [50] describes tests on the model slabs consisting of a few panels supported on walls. The authors demonstrated that longitudinal reinforcement does not increase resistance to joint shearing but only increases the potential of plastic strain. The same situation is observed for transverse reinforcement at the interface. The transverse joint resulting in interlock between slabs impacts the distribution of loads, the knowledge of which is used in the design procedures. Based on tests [51], the observed transverse load distribution (Figure 1) in slabs connected only by unreinforced longitudinal joints were found to correspond to hinged connections between slabs that are recommended in, inter alia, the standard EN 1168:2011 [52] for prestressed HC slabs. Slabs with panels connected with solid sections of longitudinal joints have a decreasing distribution coefficient, whereas the directly loaded slab takes the majority of loading.

Figure 1.
Structural mechanism for lateral load spreading of precast slabs (based on [51]): vi—shear reaction in shear key; yi—displacement at shear key.
Despite the fact that precast panels have been used for many years and designed in a manner that only considers one-way behaviour, no tests have been conducted under long-term loading for the common support condition that enforces the two-way behaviour. This gap is also evident in the standards for precast slabs [53,54]. The standard [52] on hollow-core slabs contains limited information on this subject. It only specifies the equation for shear strength at the shear key and introduces the computational model for load distribution among separate panels.
In the research analyses to date, the longitudinal and transverse interaction properties have been clearly revealed, and the behaviour at the concrete–concrete interface under short-term loading has been thoroughly examined. By contrast, long-term loading, which is crucial considering the ultimate limit state (USL) and serviceability limit state (SLS), is insufficiently studied. The scope of previous long-term research [55,56,57] has been focused on beam elements. The majority of long-term effects (mainly displacements) were observed within the first 100 days of loading. After the first year of loading, deflection reached 95% of the final displacements observed after seven years.
For the purpose of filling the cognitive gap, tests were carried out on precast slabs. They mainly focused on the long-term effect on cracking morphology, transverse behaviour of the precast units, and changes in displacements. Four full-scale slabs were examined by exerting uniformly distributed load and non-uniform long-term loads. The load applied to each slab during long-term tests was maintained for a period exceeding 12 months. The tests were performed on three types of half-slab panels commonly used in Europe (in single- and multi-family housing, commercial construction) and on one slab with HC panels. The research aimed to present simplified calculation methods regardless of the type of the slab, based on two assumptions, the lack of transverse reinforcement that could transfer the bending moment and two-way work based on the shape of the joint or the presence of concrete topping.
2. Research Programme and Applied Materials
The tests were conducted on four full-scale models made with lattice girder panels with secondary rebars (LGR), lattice girder panels with fibre reinforcement (LGF), prestressed ribbed panels (RP), and prestressed hollow-core panels (HC). These precast units are produced and used for urban housing. The length of the precast unit was equal to 600 mm, and no transverse reinforcement providing the two-way behaviour of the slabs was present for all examined models. The testing aimed to evaluate the behaviour of slabs (qualitative tests).
The slabs were selected based on design criteria for typical housing construction, considering all standard requirements (Eurocode). The slabs fulfil SLS and ULS conditions when designing for unidirectional elements. The designed slabs allow the transfer of a load of 4.7 kN/m2 with its even distribution. The non-uniform load with the local exceeding the permissible loads (assuming the lack of cooperation and unidirectional operation with all safety factors) was adopted to verify the spatial work. The details of the reinforcement (support and distribution rebars) were based on the standards EN 1168, EN 13747 and EN 15037.
In addition to the presented research, bending and shear capacity tests were carried out on strip (beam) models. Delamination was not achieved in any of the tested panel types. The obtained forces for bending and shear are greater than the load applied to the presented models. The analysis of the limit stresses for one- and two-way work models is not the purpose of this article.
Symbols for models, shapes, and dimensions of precast units are presented in Table 1. The LGR, LGF, and RP models had concrete topping over the whole slab surface, whose minimum thickness was 40 mm. The HC models composed of hollow-core panels did not have concrete topping; only shear-key structures were filled. Lateral forces were transferred between the panels only through concrete topping or in HC through the shear key. The LGR, LGF, and RP models required erection support, whereas HC slabs did not require temporary support. Material parameters of concrete and steel are presented in Table 2 and Table 3.

Table 1.
Basic parameters of the models.

Table 2.
Properties of concrete in the models made as specified in the standards [58,59,60,61].

Table 3.
Properties of reinforcement steel and prestressing steel used in the test model and determined in accordance with the standards [63,64,65].
2.1. Structure of Models
All the models were prepared as slabs with the dimensions of 6.30 m × 6.30 m supported on four masonry walls. The walls of the LGR and RP (Figure 2) models were made of concrete masonry units with a thickness of 240 mm and a height of 2.20 m. The walls of the LGF and HC models were made of autoclaved aerated concrete (700 density type) with a thickness of 240 mm and a height of 2.24 m (Figure 3 and Figure 4). The models were placed on a 300 mm thick reinforced concrete foundation slab that was previously used as a warehouse for heavy precast elements. Each model contained ten panels supported on precast bond beam blocks. The minimum support length was 80 mm. In addition, two door openings of 1.5 m and 1.8 m in width were created to provide access to the bottom part of the slab. The openings were covered with precast lintel beams, over which bond beam blocks were directly placed. The main erection stages and support zones before placing concrete topping are illustrated in Figure 2.
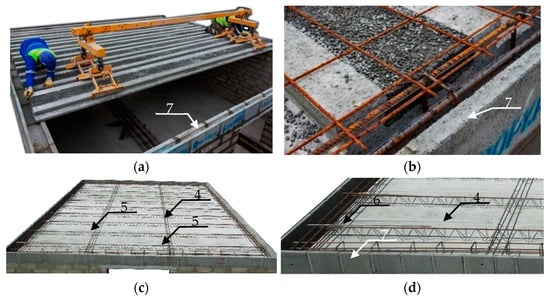
Figure 2.
Research model: (a) ribbed panel laying; (b) ribbed panel support reinforcement; (c) lattice girder panel laying; (d) lattice girder panel support reinforcement. (1—wall, 2—lintel 2 × Scheme 7. 2/12/210, 3—lintel 2 × SBN 12/12/180, 4—lattice girder panel, 5—distribution ribs, 6—support reinforcement, and 7—precast bond beam form).
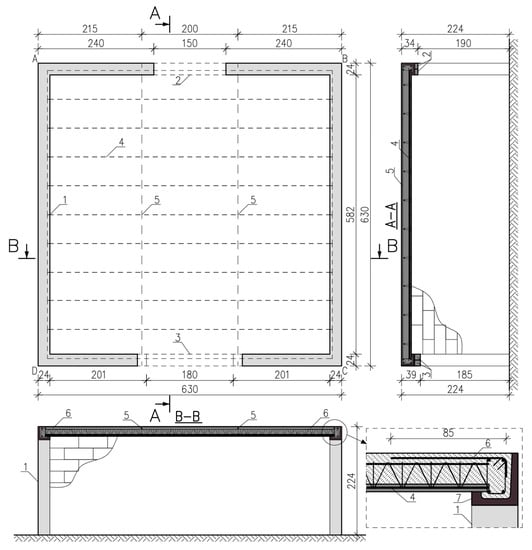
Figure 3.
Geometric dimensions: top view, A–A cross-section, B–B cross-section (1—wall, 2—lintel 2 × SBN 7, 2/12/210, 3—lintel 2 × SBN 12/12/180, 4—lattice girder panel, 5—distribution ribs, 6—support reinforcement, and 7—precast bond beam form).
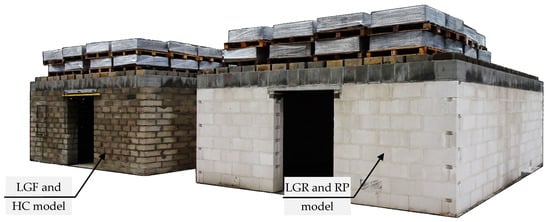
Figure 4.
General view of the models: left LGR and RP model, right LGF and HC model.
2.1.1. LGR Model—Lattice Girder with Rebar Panel
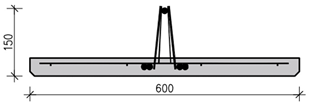
The first (LGR) model was made of precast concrete panels with a thickness of 40 mm and a width of 600 mm, with one truss and rebar reinforcement in the precast unit. The bottom rebars of the lattice girder embedded in concrete served as the primary reinforcement composed of four rebars of 12 mm in diameter and an overall area of 4.81 cm2 (Figure 5). The secondary shrinkage reinforcement was made of the reinforcement mesh with rebars of 3 mm in diameter and a spacing of 170 mm.
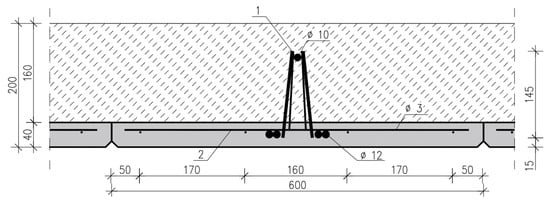
Figure 5.
Cross-section of the slab with LGR panels: 1—lattice girder and 2—secondary reinforcement.
No additional transverse reinforcement on precast panel joints was used other than two transverse beams (Figure 3) in the concrete topping on the slab. These beams contained one top rebar and one bottom rebar, each 10 mm in diameter (Figure 2c). The bottom rebar was directly placed on the precast units. The thickness of the in situ concrete topping was 160 mm, and the overall thickness of the slab was equal to 200 mm. One ϕ10 mm rebar (Figure 2d) was anchored over each truss in the bond beam with the L-shaped bar at the supports. The deadweight of the slab was 4.80 kN/m2. Strength parameters of the applied materials are presented in Table 1 and Table 2.
2.1.2. LGF Model—Lattice Girder with Fibre Reinforcement Panel
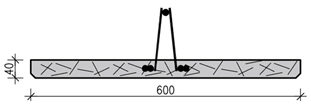
The second (LGF) model was also made of precast concrete panels with a thickness of 40 mm and a width of 600 mm, with a single truss (Figure 6). The difference lay in the secondary reinforcement replaced with the polymer fibre reinforcement in the quantity of 2 kg/m3. The used fibres belonged to class II [66], with a diameter of 0.45 mm and a length of 38 mm. A part of the longitudinal reinforcement in the precast unit was replaced with fibres, which reduced the reinforcement area to 4.52 cm2. The other reinforcement and the thickness of concrete topping were the same as the LGR model. The deadweight of the slab was 4.80 kN/m2. The strength parameters of the applied materials are presented in Table 1 and Table 2.
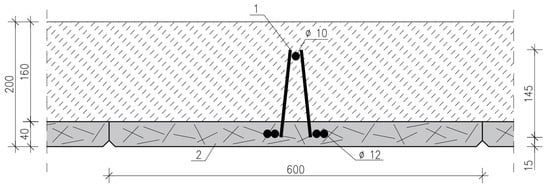
Figure 6.
Cross-section of the slab with LGF panels: 1—lattice girder and 2—bottom plate with fibre reinforcement.
2.1.3. RP Model—Prestressed Ribbed Panel
The third (RP) model was made of precast prestressed panels composed of the lower concrete slab with a thickness of 40 mm and a width of 600 mm, and two upward longitudinal ribs with a height of 120 mm at the centre-to-centre spacing of 350 mm (Figure 7). The prestressed reinforcement of ribs consisted of seven-strand tendons of ϕ6.85 mm (1 × ϕ2.24 mm + 6 × ϕ2.40 mm) from steel Y2060S7. Voids between ribs in each precast unit were filled with lightweight concrete of 80 mm in thickness. Then, the concrete topping of 40 mm thickness was laid after erecting of the members. The overall thickness of the slab structure was 160 mm. The top reinforcement (with the range of 100 cm) in the form of welded rebars a diameter ϕ4 mm, and spacing of 200 mm was erected at supports (Figure 2b). Two pairs of transverse rebars of ϕ10 mm were laid in the concrete topping on the rib (Figure 3). The deadweight of the slab was 3.15 kN/m2. Strength parameters of the applied materials are presented in Table 1 and Table 2.
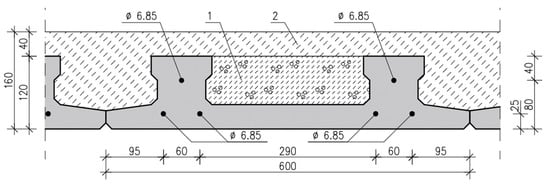
Figure 7.
Cross-section of the slab with RP panels: 1—lightweight concrete and 2—concrete topping.
2.1.4. Model 4—Hollow-Core Panel
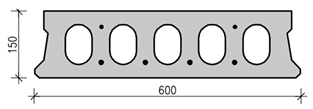
The fourth and last (HC) model was prepared from hollow-core slabs with a width of 600 mm and a thickness of 150 mm (Figure 8). Each slab was prestressed from the bottom with four tendons: ϕ9.3 mm (1 × ϕ3.17 mm; 6 × ϕ3.08 mm) and two tendons ϕ6.85 mm (1 × ϕ2.40 mm; 6 × ϕ2.24 mm) in the top part of the section. The thickness of the concrete cover of the top and bottom strands was equal to 35 mm. The concrete topping of the precast units was not intentionally used, and only the slab joints were in situ filled with concrete. At the supports, a rebar of 8 mm in diameter was laid in the joint. Each rebar was placed in the upper part of the shear key. The deadweight of the slab was 2.65 kN/m2. Strength parameters of the applied materials are presented in Table 1 and Table 2.
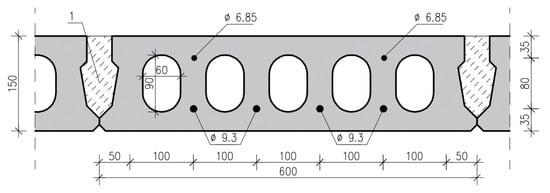
Figure 8.
Cross-section of the slab with HC panel: 1—shear key.
2.2. Measuring Equipment
Short-term displacements were recorded with linear variable displacement transducers (LVDT) of PJX-10 and PJX-20 type (Peltron) with a reading accuracy of ±0.002 mm. The transducers were fixed to a steel frame supported on the floor slab made of reinforced concrete. Figure 9 illustrates the arrangement of the transducers along the axis of door openings and the joint of central slabs (slabs No. 5 and No. 6). The transducers were about 25 mm from the joint between the panels, and the distance between adjacent transducers was about 50 mm. Additional geodetic sensors were placed on the bottom surface, close to the LVDTs (Figure 10). Geodetic measurements were used to read displacements caused by long-term loading exerted by a self-levelling precision automatic level (Sokkia C41) using a geodetic marker with a millimetre scale. The measurement accuracy of long-term load displacements was equal to ±0.5 mm. Due to the long-term nature of the research and their lack of susceptibility to equipment failure (calibration of electrical sensors), geodetic measurements were chosen. This method avoids problems with supporting the measuring frame over time.
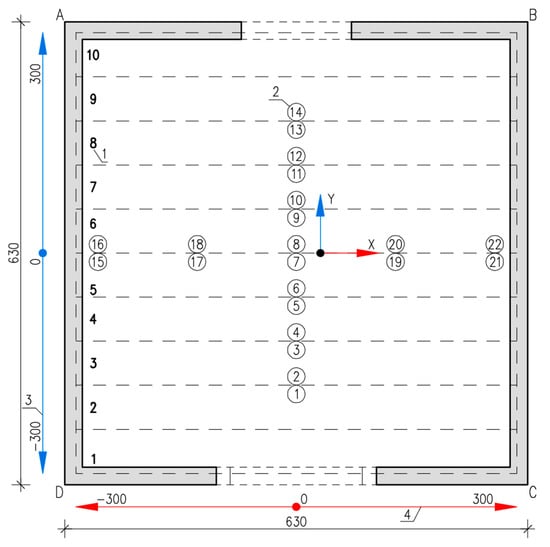
Figure 9.
Arrangement of the transducer and geodetic sensors for measuring vertical displacements on the lower surfaces of the tested slabs: 1—panel number, 2—sensor number, 3—measurement direction transverse to the main direction of the panels (Y-axis), and 4—measurement direction along the length of the central panels joint (X-axis).
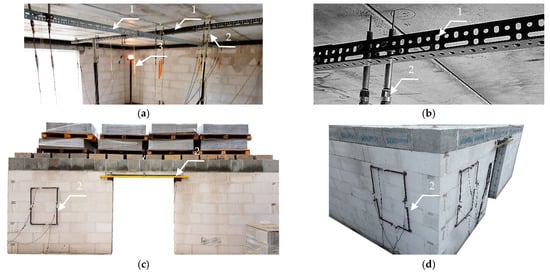
Figure 10.
Overall view of sensors arrangement: (a) inside; (b) panel joint; (c) front view with lintel and wall measurement; (d) wall measurement. 1—steel frame, 2—LVDT sensor, and 3—geodetic marker.
2.3. Application Method and Load Schedule
The load was applied to the test models following the loading schedule. The load was exerted by single concrete blocks (350 mm × 250 mm × 120 mm) and blocks placed on palettes. The total load exceeding the deadweight of the slab equal to 4.7 kN/m2 was divided into two parts equal to 1.7 kN/m2 (concrete blocks placed on the top of the slab) and 3.0 kN/m2 (the palettes with concrete blocks on previously laid concrete blocks) shown at Figure 11. In the last two schemes, the load was unevenly distributed, where half the panels had a load of 7.7 kN/m2, and the other half had a load of 1.7 kN/m2. The loading sequences are shown in Figure 12. The displacements were automatically read after positioning the load. After the sequence of E-5 and K-11 loads, an inspection was conducted for cracks. For this reason, an additional reading was taken under the same load configuration, E-6 and L-12, to show the changes in deflections during the inspection (about 1 h).
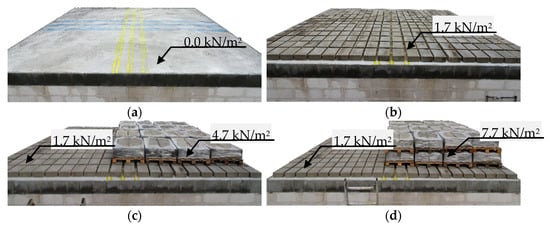
Figure 11.
View of selected loading sequences of models (a) A-1; (b) E-5, F-6; (c) H-8; (d) K-11, L-12.
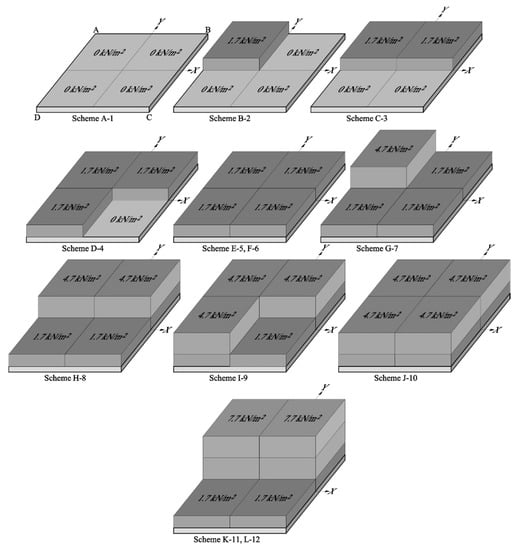
Figure 12.
Loading sequences of models.
The load corresponding to the sequence L illustrated in Figure 11 was used as long-term loading. Uneven loads were chosen to verify the spatial work of the slabs and, in particular, the deflection curve and its shift towards the maximum load zone (panels number 6 to 10). The long-term tests of the deflections and panels faulting were scheduled for 12 months with a 30-day frequency for surveying the measurements.
3. Results
All models were tested within two years, from June 2018 to July 2020. The loading period for each model was circa 365 days. The geodetic sensors placed in points shown in Figure 9, along X- and Y-axes, were used for measurements.
3.1. Morphology of Cracks
Cracks on the top and bottom surfaces of the slabs were surveyed prior to the tests. The amount of primary cracking was small in the LGR (Figure 13a), and there were no cracks in RP and HC models. A significant difference was found in the LGF model with the precast units with fibre reinforcement (LGF). There were considerably more cracks (Figure 13b) with a width smaller than 0.1 mm, due to the effect of shrinkage of precast. The cracks were elongated during loading. However, their width did not exceed 0.2 mm in the LGR model and 0.3 mm in the LGF model. The highest concentration of cracks was in the zone of maximum loading. The final survey was taken after completing the long-term tests and demonstrated greater widths of previously observed cracks in the LGR (Figure 13c) and LGF models (Figure 13d). In the model with fibre reinforcement in the precast units, many new cracks with a width up to 0.1 mm occurred. Major cracks lateral to the main reinforcement had a width of 0.4 mm and were observed on the bottom surface of the LGR and LGF models. No cracks were found in the RP and HC models with prestressed precast units prior to short-term loading and after long-term loading.
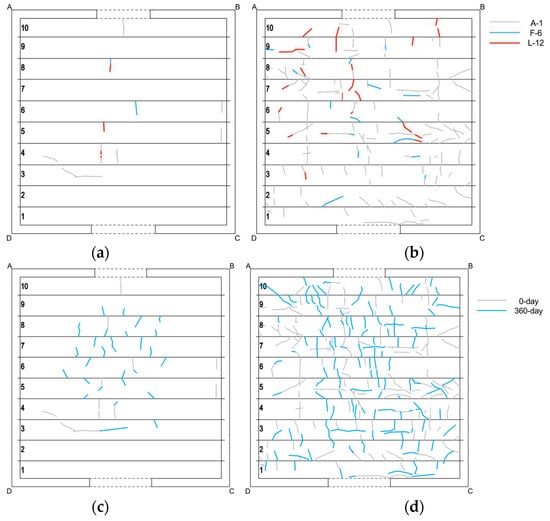
Figure 13.
Crack patterns on bottom surface: (a) LGR 0-day; (b) LGF 0-day; (c) LGR 360-day (scheme L-12); (d) LGF 360-day (scheme L-12).
The long-term loading caused cracks at the interface between the bond beam and the masonry unit and between the lintel and the masonry unit (Figure 14) present in each corner of the slab. The crack coverage was circa 0.6 m (A and B corners), constituting less than 10% of the length of the model side. The cumulative width of the cracks measured in each corner did not exceed 10 mm. Cracks in the lintels showing that the bond beam was separating from the walls confirmed the two-directional behaviour of the tested slabs.

Figure 14.
Cracks on the LGR model exposed to long-term loading: (a) in the interface between the bond beam and the masonry unit (corner B) and (b) between the lintel and the masonry unit.
3.2. Effect of Short-Term Loading
At each sequence of short-term loading, the LGF model exhibited significantly greater displacements than the LGR model. The recorded final deflection at the midspan (panel no. 6) of the LGF model was 1.93 mm, and the deflection of the LGR model was greater by 38% and equal to 2.67 mm. The deflection of 3.90 mm was observed for the RP model under the maximum loading at panel no. 7 (aligned values on a length of 1.2 m from the centre of the slab). No decrease in displacement was observed for the first two models when half the loading was relocated (the loading sequence was changed from J-10 to L-12). The displacement of the RP model was slightly reduced near the support (panels no. 2–3) by 0.14 mm. The maximum displacement of the LGF, LGR and RP models was found at a distance of 0.60–1.2 m from the slab centre. The fourth model made of HC slabs had a different behaviour. The load relocation reduced the displacements in one half of the model (panels no. 2–5), and their maximum value reached 0.44 mm. As opposed to the RP model, the greatest rotation was observed not close to the support but at a distance of 1.2 m from the centre of the slab. Unlike in other models, no significant drop in deflection at panel no. 8 was observed for the HC slab under the loading sequences J-10 and L-12. For the LGR, LGF, and RP models, the difference between the readings at the edge of panel no. 8 was 30% of the maximum displacement. For the same panel of the HC model, the difference in the reading was 10%. No longitudinal cracks were found in the RP and HC models. The RP model was characterised by greater stiffness related to the slab thickness; however, the observed deflections were greater by 9% than the HC model under the loading sequence L-12. Even more significant discrepancies were shown for the sequence E-5, for which the difference amounted to 50%. A similar situation was found for the LGF and LGR models, where a difference in the sequence E-5 was equal to 84%. Notably, the step-by-step verification of the bottom surface did not reveal any new cracks. They were observed only during the loading sequence J-10. Results from the short-term tests performed on individual models at the selected loading sequences are shown in Figure 15.
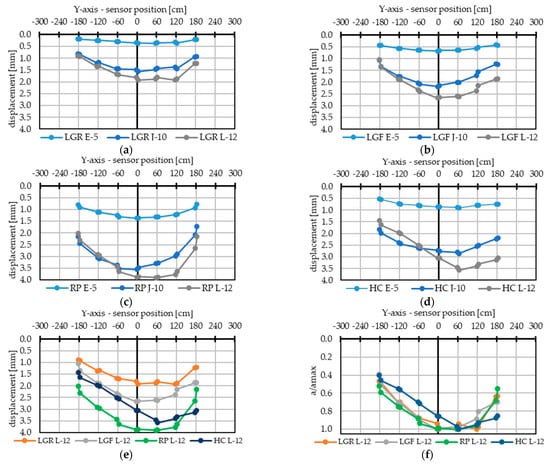
Figure 15.
Displacements in the Y-axis for the sequences E-5, J-10, and L-12: (a) LGR; (b) LGF; (c) RP; (d) HC; (e) Comparison of panels and (f) performance of the panels in the Y-axis.
Graphs in Figure 16a,b show the comparison of displacements of the measured points on X- and Y-axes (longitudinal and lateral directions) for the sequence J-10. The displacements in the LGF model were 39% greater than those in the LGR model and 26% greater in the RP model compared to the HC model. The displacements in the LGR and LGF models demonstrated high similarity along the two axes. Similar behaviour was observed for the RP model. However, a different flatter displacement curve was observed for the HC model. The observed deflections near the supports were relatively higher than in the case of the other three models. Moreover, only the HC model did not have the maximum deflection at the midspan but at a distance of 0.625 m from the midpoint. The HC model, the only one made without concrete topping, showed behaviour closer to the model of the hinge joint between panels, consistent with that presented in Figure 1 and adopted in the standard [52]. Such a model justifies greater displacement closer to the support, resulting from greater rotations in the shear keys between the panels closer to the support. The maximum displacements of individual models are compared in Table 4.
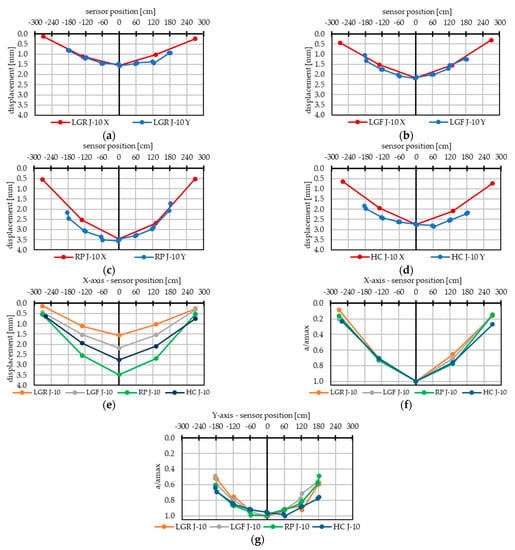
Figure 16.
Displacements in the X- and Y-axes for sequence J-10: (a) LGR; (b) LGF; (c) RP; (d) HC. (e) Comparison of panels, (f) performance of panels in the X-axis, and (g) performance of panels in the Y-axis.

Table 4.
Maximum displacements of individual models under successive loading sequences.
3.3. Effect of Long-Term Loading
The long-term tests were performed under permanent loading (the sequence L-12), and the surveying measurements were taken at time intervals of one month. During the tests, temperature and humidity were measured (Figure 17). The results in the form of a graph presented in Figure 18 were based on the readings taken on days 100, 200, and 300 and after a year of loading. A regular increase in the displacements was found for the LGR and LGF models during the testing period. When compared to short-term loading, the displacements in the LGR model increased by 263% (day 100) and 315% (day 200), and those of the LGF model by 461% (day 100) and 536% (day 200). Contrary to the tests under short-term loading, the displacements in the RP and HC models were substantially smaller than in LGR and LGF after completing the long-term tests. Differences in readings between days 100 and 370 varied from 1 to 2 mm. The indirect measurement for the RP model on day 189 showed nearly the same deflection as on day 301. The first reading on day 113 and the second on day 197 were convergent for the HC model, except for one measuring point. The HC model exposed to long-term loading also differed in the displacement behaviour with reference to other models. The deflection line was shifted the most towards the maximum loading.
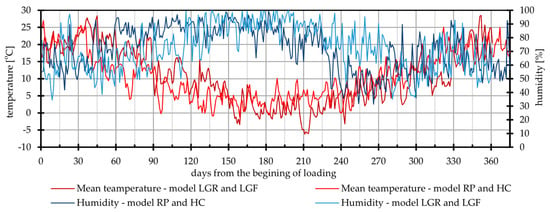
Figure 17.
Ambient temperature and humidity during the load period.
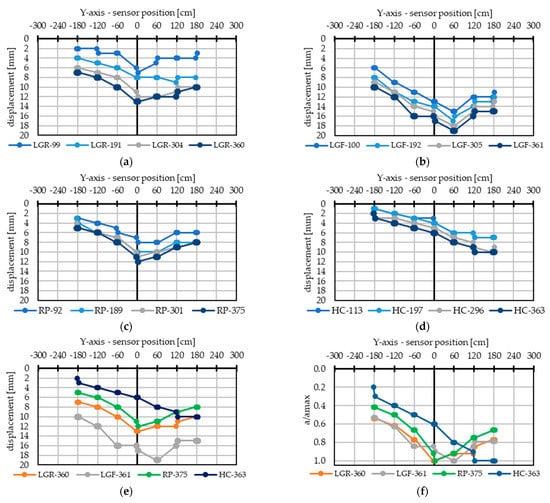
Figure 18.
Displacement in the Y-axis during the load period for slabs made of (a) lattice girder panels with rebars; (b) lattice girder panels with fibre reinforcement; (c) prestressed ribbed panels; (d) hollow-core panels. (e) Comparison of panels and (f) performance of panels in the Y-axis.
Figure 17 illustrates daily temperature and humidity readings separately for the LGR, LGF, RP, and HC models. The last two models were tested after a month interval from the ending of LGR and LGF research. The average humidity throughout the tests on the LGR and LGF models was 72.0%, and the temperature was equal to 10.9 °C. For the LGR and LGF models, the average humidity and temperature did not significantly differ and were equal to 71.8% and 10.7 °C, respectively. During the period of increased humidity (>90%), a minor increase in displacements was recorded (days 150–240) compared to in other periods. There was no effect of temperature on the increase in displacements and crack patterns. The mean value of humidity during the test was used in the calculation of long-term displacements. Figure 19 presents the maximum displacements for each model during all measurements. According to [55,57], most displacements are observed during the first 100 days, and the largest increase is found during the first 30 days after the load is exerted.
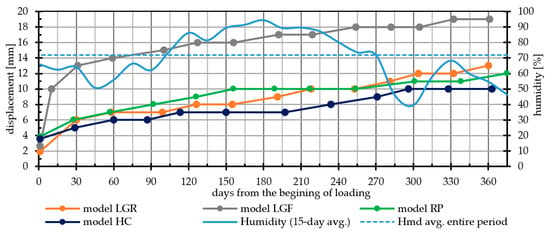
Figure 19.
Maximum displacement of models during the load period.
Percentage increase in the maximum displacements referred to short-term displacements of the individual models was as follows: 574%—LGR, 610%—LGF, 208%—RP, and 180%—HC. Varied deflections of reinforced concrete and prestressed slabs were observed. Moreover, no cracking in the bottom area of panels was found in the RP and HC models. The comparison of displacement behaviour of the slabs after the final measurement that was taken on the day of loading and around day 365 after the loading (Figure 20) indicates a greater rotation in the LGR, LGF, and RP models at the joint of panel 5–6 (LGR and RP) or 6–7 (LGF), corresponding to an increase in loading from 1.7 to 7.7 kN/m2. The displacement behaviour of these slabs became similar to the deflection curve for the HC model prior to long-term testing. The curve for the HC model has shifted to the centre of the area of maximum load. Compared with other models, this curve was the closest to the wall edge. Data for long-term displacements are compared in Table 5.
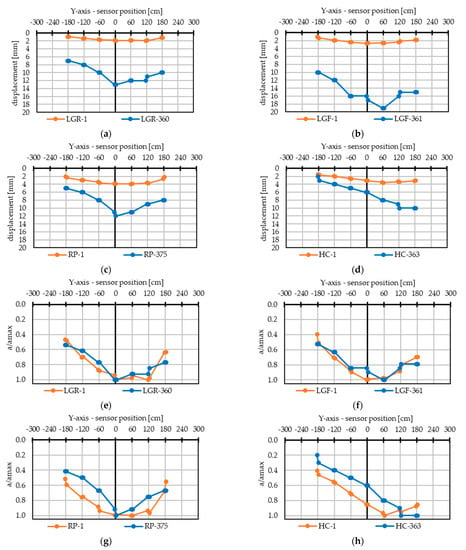
Figure 20.
Comparison of deflection characteristics on the Y-axis during the load period for slab made of (a) lattice girder panels with rebars; (b) lattice girder panels with fibre reinforcement; (c) prestressed ribbed panels; (d) hollow-core panels. (e–h) First and last day performance comparisons for each model.

Table 5.
Maximum displacements of individual models on consecutive days of loading.
4. Computational Analysis
4.1. Simplified Analytical Method
Engineering calculations for the deflection of slabs were made in accordance with the standards [52,53,54] and compared with the test results to highlight differences in the behaviour of individual slabs. Two models were analysed: the beam and the slab model under non-uniformly distributed short- and long-term loading sequences K-11 and L-12, presented in Figure 12. In the first case, the analysis included a single span simply supported beam (Figure 21a) on which the uniformly distributed short- and long-term load was exerted. The calculated results, presented in Table 6, differ from the measured values. The most convergent values equal 36% of the deflections noticed during the tests for the RP model. A convergence of only 5% was determined for the LGR model and was 25% in the case of the prestressed HC slab. Similar results were obtained for the calculations of long-term loading, and they are presented in Table 7. The convergence level was similar for the RP and HC models, and it was higher by 24% for the LGR model.
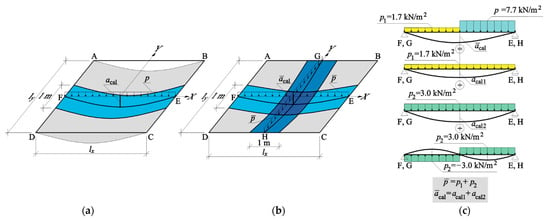
Figure 21.
Slab models used in calculations: (a) the beam model; (b) the slab model; (c) the principle of establishing the equivalent loading of the slab under non-symmetric loads.

Table 6.
Comparison of results from tests and calculations for short-term loading.

Table 7.
Comparison of results from tests and calculations for long-term loading.
The analysis of the slab model covered the rectangular slab under four-edge-supported conditions (Figure 21b), which was non-uniformly loaded on the surface under the loading sequences K-11 and L-12 (cf. Figure 12). The deflection, a function of the maximum bending moment at the midspan of the slab, was calculated using the (Marcus) simplified method of elastic meshes. Considering assumptions of this method, the actual non-uniform loading of the slab was replaced with the uniform loading . For that purpose, the load exerted on the slabs was distributed into the symmetric and non-symmetric load (applying the rule shown in Figure 21c). The resulting uniform loading of the slab was equal to . Under the loading , the deflection of the slab midpoint can be determined from the relationships , which depend on the value of the maximum bending moment. Symbols and denote the displacement from the load of and . The maximum moment for the rectangular slab under the uniform loading was (where mean calculation span), and for the simply supported beam, it was equal to , and the coefficient for determining the slab moment proportionally to deflections of the beam was equal to 0.172/0.963 = 0.178. The calculations showed that the deflections caused by short-term loading were underestimated by 96% for the LGR model and by 99% and 43% for the RP and HC models. For long-term loading, the deflections were underestimated each time compared with the experimental results. The deflections of the LGR and HC models were underestimated by 34% and 45%, respectively. The largest difference was obtained for the RP model, for which the deflections were smaller by 75% compared to the tests.
The standard procedures were used to determine the deflections with significant overestimations for the simply supported beam model under short- and long-term loading. The deflections were reduced in the slab model supported on four edges, as expected, and led to a slight underestimation. However, the obtained results were ambiguous. The calculations neglected the mutual interactions of the individual precast units caused by concrete topping and filling in the shear keys between the slabs.
4.2. FEM Calculations
As shown in Section 4.1, deflections of the slab section calculated according to the standard procedure led to overestimating both short- and long-term deflections of reinforced concrete and prestressed slabs. Significant underestimations of the deflections were obtained for the slab model supported on four edges. Given the interaction between individual precast units was ignored, the results cannot be considered reliable. Therefore, FEM numerical models were prepared for the individual slab models.
Numerical calculations were performed in the AxisVMX5 program based on the finite element method (FEM). The numerical representation of the analysed structures was carried out on shell models with various panel thicknesses. The thicknesses of the slabs were 200 mm (LGR), 160 mm (RP), and 160 and 120 mm for the shear keys between the panels. The HC model was 150 mm thick. The finite elements between the panels in the LGR and RP models had both a length and width of 50 mm, and the thickness was reduced by the thickness of the precast element to represent the presence of shear keys (flexibility). Hinged connections between the elements were applied in the HC model. The decision as to the joint for HC panels was made based on a literature review, the recommendations of EN 1168. In particular, such a work model is indicated by a different shape of the presented (Section 3.2 and Section 3.3) displacement curves. The slabs were supported linearly on four edges. The parameters of the stiffness of the supports corresponded to the stiffness of the walls supporting the structure. The basic size of the FEM element was 10 cm with twice the local compaction joint panels (5 mm FEM division). Finite four-node shell elements were used with six degrees of freedom for each node. An isotropic material model of concrete was used in the calculations.
One of the objectives of the work was to assess the reliability of engineering calculations in estimating the actual vertical displacements (deflections) of panel slabs. Therefore, no complex material models, e.g., elastic–plastic or elastic–brittle, were used. The connection between the wall and the slabs was reduced to support stiffness, disregarding the interface parameters. The calculations were performed in the linear–elastic and nonlinear stages. Geometric linearity meant that the displacements remained in the small displacement theory. Material linearity was based on the assumption of linear–elastic parameters of the material model. The displacement convergence criterion was used in the nonlinear analysis. This means that successive increments were defined as components of the displacement of a specific node. The calculations take into account the actual cross-sectional areas of the structural reinforcement of the panels and the decrease in the stiffness of the structure resulting from cracks.
The models were only under the non-uniformly distributed load corresponding to the loading sequences K-11 and L-12 (Figure 11); the deflection caused by the dead weight and initial prestressing was neglected. The numerical models are shown in Figure 22. The models were based on the assumptions that slab corners did not demonstrate any separation and loading of the slabs corresponded to the loading sequence K-11. The summary of test results and FEM calculations are shown in Table 8 and Figure 22.
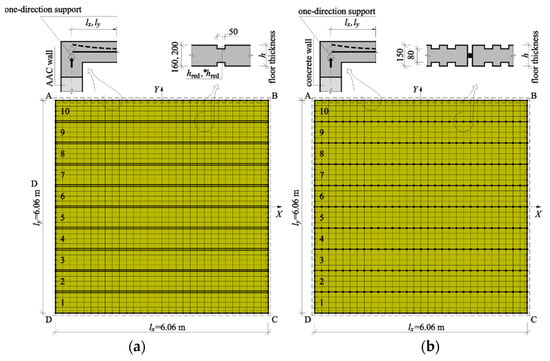
Figure 22.
Numerical FEM models: (a) model LGR and RP; (b) model HC.

Table 8.
Comparison of results from tests and FEM calculations under short-term loading.
Based on the calculations, the obtained values of displacements were smaller than those in experimental data for the LGR and RP models and higher in the HC model. The most significant difference between the calculated and determined displacements was observed for the HC model at the level of 42%. The maximum deflections of the LGR and RP models were smaller by 27% and 42%, respectively. Because the deflections in the LGR and RP models had been underestimated, calibration calculations were performed, in which the joint thickness between the precast units was reduced. This thickness was then 80 mm in the LGR and 40 mm in the RP model. The comparison of results is shown in Figure 23.
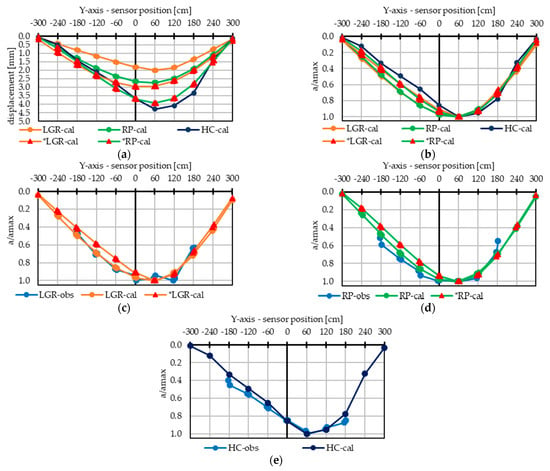
Figure 23.
Comparisons of the displacement in the Y-axis between FEM calculation and short-term measurements: (a) calculated displacement; (b) calculated performance of panels at Y-axis; (c) LGR performance; (d) RP performance; (e) HC panels performance. obs—observed deflection, cal—deflection with a thickness hred caused by short-term loading, *cal—deflection with a thickness *hred caused by short-term loading.
In the models that reflected long-term loading, initial-value boundary conditions were modified following the observations. Due to the detection of rotation and cracks, the stiff connection between the slab and walls was replaced with a hinged connection. Additionally, compression-only supports were used to represent the noticed separation of corners. These models also included a reduced modulus of elasticity of concrete due to creeping at 72% humidity (Figure 19), and the modulus of elasticity was reduced to Ec,lt (Table 2). The long-term effects of prestressing were represented by membrane forces with an orientation consistent with the arrangement of tendons. As there are no explicit guidelines for considering the prestress for composite cross-sections and slabs composed of single prestress units, it was assumed, in accordance with Eurocode [54], that 1/5 of the whole long-term prestressing forces (after the losses) acted on the composite cross-section (for the stored elements up to three weeks before their placement). Compared to the experimental results, the displacements calculated in the LGR and RP models under the above assumptions were underestimated. The maximum calculated value of displacements in the LGR model was 8.78 mm and lower than the measured value by more than 48%. The calculated value of displacements in the RP model was equal to 9.15 mm and lower than the measured value by 31%. A similar scale difference between the calculated and determined results was found for the HC model. In that case, the overestimated values of displacements exceeded 60%. The observed differences can indicate the impact of the shear-key stiffness on the interaction between the precast units. Therefore, the calibration calculations, including different thickness values of the joint between the precast units, were made for the LGR and RP models to obtain the result corresponding to the test results. Then, this thickness was 65 mm for the LGR model and 55 mm for the RP model. The summary of test results and FEM calculations are shown in Table 9 and Figure 24.

Table 9.
Compared results from tests and FEM calculations for long-term loading.
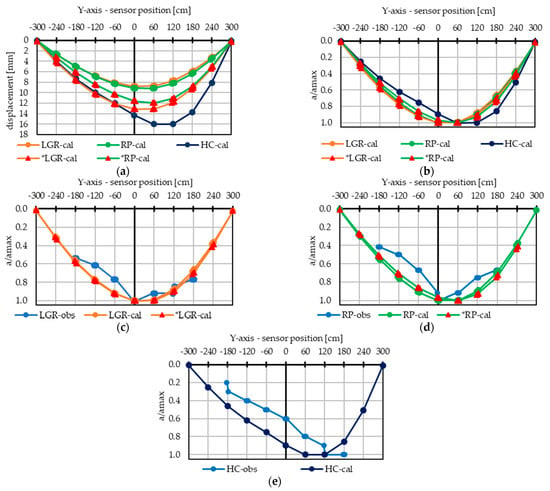
Figure 24.
Comparisons of the displacement on the Y-axis between FEM calculation and long-term measurements: (a) calculated displacement; (b) calculated performance of panels at Y-axis; (c) LGR performance; (d) RP performance; (e) HC panels performance.
5. Discussion
At the stage of short-term loading, displacements in the LGF model were greater (by 35% on average) than those of the LGR model having the same structure, but the fibre reinforcement was replaced with a mesh of rebars in the precast concrete slab. This can be attributed to a ratio of the primary reinforcement being lower by 6% and the considerably higher intensity of cracks of narrow width (<0.1 mm) caused by a change in the type of shrinkage reinforcement. In the prestressed (RP and HC) models with no detected cracks on the bottom surface, a smaller deflection (20% on average) was observed for the HC slab without the concrete topping slab than for the RP model. This situation was observed at the beginning of loading (the sequence E-5, uniform loading on the whole surface equal to 1.7 kN/m2). Therefore, it may be presumed that cracks were formed between the slabs after concrete curing and under the relatively low loading conditions, reducing the stiffness and resulting in the deterioration of interactions between the single precast units. Differences in displacements between the sequences J-10 and L-12 show that the shape of a shear key used in the HC model had less impact on the load transfer than the concrete topping laid on the whole surface of the slab. Only the HC model under short-term loading did not have the significant drop in deflection at panel no. 8 under the loading sequences J-10 and L-12. For the models with concrete overtopping, the difference between the readings at the edge of panel no. 8 was 30% of the maximum displacement. For the same panel of the HC model, the difference in the reading was 10%. That behaviour suggests a joint model (only one made without concrete topping) closer to the model of the hinge joint between panels, consistent with that presented in the introduction.
Moreover, the shear-key structure could significantly affect the development of cracks and thus the interactions between single panels. The results obtained from the FEM calculations also indirectly suggest cracks in the joints between the precast units. For short-term loading, the calculated and test results converged when the necking thickness was reduced to *hred = 80 mm for the LGR model and to *hred = 40 mm for the RP model. Under long-term loading, the necking thickness was *hred = 65 mm for the LGR model and *hred = 55 mm for the RP model.
Under long-term loading for the sequence L-12, the point of maximum displacement in the models was changed. The observed increase in displacements of the LGR and LGF models was greater than the values calculated based only on concrete creeping. The reason for this is the appearance of cracks with a significant width, particularly cracks in the joints between the panels. As a result of long-term loading exerted for a year, the total displacements of the LGR and LGF were greater than for the RP and HC models. The final reading showed that the final displacements of the LGR, RP, and HC models were within the range of 10 to 12 mm. Deflections exceeding 55% were found in the LGF model. As a result of long-term loading acting on the bottom surface of the slab, a significant increase in the number of cracks and their width (the maximum width was equal to ~0.4 mm) was observed. The tests confirmed the positive impact of shrinkage reinforcement in the precast units, whose presence in the LGR model reduced the crack intensity and width. A greater rotation at the joint of the precast units (no. 5–6) in the same line as a change in the loading was an essential issue in the LGR, LGF and RP models. The shape of the deflection curve was similar to the curve of the HC model under short-term loading. Such behaviour indicates that cracks in the joint changed their operating scheme from bending joint to shear key. Thus, the computational model representing the behaviour became more similar to the hinge model.
The tests performed under the long- and short-term loading conditions and with varied load exerted to a slab show the lateral interaction of panels. Under long-term loading, the increase in the displacements of the RP and HC models was of a similar magnitude. Significantly greater displacements were demonstrated for the LGR and especially the LGF model with the fibre-reinforced precast units. This difference is due to the positive effect of prestressing of the RP and HC panels and the lack of cracks development in the panels. Long-term loading changed the impact and the range of the load distribution due to greater rotation at the joints between the members. No cracks on the top surfaces of the test models were observed after completing the tests and the survey. The differences in the readings between the edges of adjacent panels did not indicate the possibility of a faulting effect.
Analytical calculations and numerical computations for the slab models were prepared considering short- and long-term loading. Based on the model of a simply supported beam and the standard procedure, the deflections were considerably overestimated, more than threefold, at the short- and long-term loading stage. The slab model of two-way behaviour and the Marcus method also produced significant discrepancies. In this case, the slab deflections of the LGR, RP, and HC models were underestimated, where the underestimation of the short-term loading amounted to 96% for the LGR model, 43% for the HC model, and 99% for the RP model. Under long-term loading conditions, the results were underestimated for all models. In the FEM models with the narrowed joints between the precast units (LGR, RP) or with the hinge connection (HC), the deflections under short-term loading were the most overestimated, by 17% for the HC model, and underestimated by 42% for the RP model prior to calibration. Considering long-term loading, the deflections in the HC model were overestimated by circa 37%. The highest overestimations ranged from 31% to 48% for the models with shear keys in the form of necking. The obtained discrepancies resulted from different stiffness caused by cracking in the joints between the precast units. Adequate calibration based on the change in necking thickness to the value *hred produced an adequate agreement between the models and the computations.
6. Conclusions
The crucial element of qualitative tests was comparing the deflection performance of the selected slabs exposed to short- and long-term loading. A common feature was the lack of joint reinforcement. The presented conclusions are limited to the range of serviceable loads of the selected precast or semi-precast slabs. The slab panels maintained the possibility of load redistribution based on their interaction, despite the work of the longitudinal joints occurring only through the concrete cross-section. A more significant reduction in the stiffness in the lateral direction indicated by shift of the displacement curves towards the centre of the maximum load zone can be attributed to the lack of joint reinforcement. The precast panels connected with topping showed better parameters of the lateral interactions than the elements connected only in shear key (HC). The lack of traversal reinforcement on the LGR and LGF model significantly affected the cracking morphology and the maximum deflections under the long-term loading conditions.
The simply supported beam model included in the calculations seems to be an overly conservative approach that does not allow accurate evaluation of the effects. A deflection overestimation of almost threefold cannot be considered a proper estimate. This approach does not take into account the plate behaviour of the model. The Marcus method produced significantly underestimated results, up to 99%. The simplified FEM approach to computations of spatial arrangement was also proposed. In that case, the level of underestimated deflections under the short-term loading did not exceed 42%. Similar results were obtained for the long-term loading. The opposite situation was observed for the model with hinge connections used for the HC slab. Calculated deflections each time were greater than the measured ones. Such results are at the acceptable level due to being the safe estimation. The hinge connection approach generates significantly less error than the current commonly used simply supported beam methods. The deflection of the FEM models can be precisely calculated by reducing the thickness of the joints. However, this approach requires a calibration procedure. Establishing the relationship with joint thickness reduction requires further research. Considering the research presented in the introduction, the analysis of displacement charts and numerical calculations, it could be formulated that the hinge model of the joint could be the answer for a design model of the presented slabs.
Based on the short- and long-term studies, it can be concluded that the simplified calculation methods provide an unsatisfactory level of accuracy. Therefore, there is room for developing guidelines and unifying codes to design and calculate half-slabs without transverse reinforcement. Currently, we are conducting a laboratory test of half-slab models to fulfil a cognitive gap with respect to the calculation approach. The major aspect of research is the concrete–concrete interface and crack pattern at the ultimate load of slabs without transverse reinforcement. The conducted study will allow for more precise numerical representations of slab performance and the development of comprehensive guidelines.
Author Contributions
Conceptualisation Ł.D. and A.K.; methodology J.Z., Ł.D., R.J. and M.W.; software R.J. and W.M.; formal analysis J.Z. and M.W.; investigation J.Z., Ł.D., R.J., M.W., W.M. and K.G.; resources A.K.; data curation J.Z. and R.J.; writing—original draft preparation J.Z.; writing—review and editing Ł.D., R.J. and K.G.; visualisation J.Z.; supervision Ł.D. and A.K.; project administration Ł.D. and A.K. All authors have read and agreed to the published version of the manuscript.
Funding
This research received no external funding.
Institutional Review Board Statement
Not applicable.
Informed Consent Statement
Not applicable.
Data Availability Statement
Not applicable.
Acknowledgments
We thank Krzysztof Jonderko for his invaluable help in preparing research, particularly in the field of technical support. We want to thank the KONBET company for providing materials and space for research.
Conflicts of Interest
The authors declare no conflict of interest.
References
- Kisiołek, A. The market of flooring systems in Poland. Innov. Mark. 2018, 14, 13–22. [Google Scholar] [CrossRef][Green Version]
- Elliott, K.S.; Jolly, C.K. Multi-Storey Precast Concrete Framed Structures, 2nd ed.; Elliott, K.S., Jolly, C.K., Eds.; John Wiley & Sons, Ltd.: Oxford, UK, 2014; ISBN 9781118587379. [Google Scholar]
- Cho, K.; Shin, Y.-S.; Kim, T. Effects of half-precast concrete slab system on construction productivity. Sustainability 2017, 9, 1268. [Google Scholar] [CrossRef]
- Steinle, A.; Bachmann, H.; Tillmann, M.; Thrift, P. Precast Concrete Structures, 2nd ed.; John Wiley & Sons, Ltd.: Hoboken, NJ, USA, 2019; ISBN 978-3-433-03273-2. [Google Scholar]
- Kim, S.H.; Lee, K.K.; Lee, H.S.; Lee, K.J.; Kang, I.S. Bending and shear strength of I-slab with polystyrene forms. Key Eng. Mater. 2008, 385–387, 353–356. [Google Scholar] [CrossRef]
- Drobiec, Ł.; Wyczółkowski, R.; Kisiołek, A. Numerical modelling of thermal insulation of reinforced concrete ceilings with complex cross-sections. Appl. Sci. 2020, 10, 2642. [Google Scholar] [CrossRef]
- Huang, W.; Ma, X.; Luo, B.; Li, Z.; Sun, Y. Experimental study on flexural behaviour of lightweight multi-ribbed composite slabs. Adv. Civ. Eng. 2019, 2019, 1093074. [Google Scholar] [CrossRef]
- Li, M.; Wang, C.; Tao, W.; Wang, B.; Sun, Z. Analysis of the shear force distribution of laminated slab with shear keys simply supported on four sides. In Advances in Engineering Research, Proceedings of the 2015 International Conference on Mechatronics, Electronic, Industrial and Control Engineering, Shenyang, China, 1–3 April 2015; Atlantis Press: Dordrecht, The Netherlands, 2015; Volume 1, pp. 476–479. [Google Scholar] [CrossRef][Green Version]
- Derkowski, W.; Skalski, P. New concept of slimfloor with prestressed composite beams. Procedia Eng. 2017, 193, 176–183. [Google Scholar] [CrossRef]
- Szydlowski, R.; Szreniawa, M. New Concept of Semi-precast Concrete Slab on Pre-tensioned Boards. In IOP Conference Series: Materials Science and Engineering, Proceedings of the World Multidisciplinary Civil Engineering-Architecture-Urban Planning Symposium—WMCAUS, Prague, Czech Republic, 12–16 June 2017; IOP Publishing Ltd.: Bristol, UK, 2017; Volume 245, No. 022090. [Google Scholar]
- Dal Lago, B.; Taylor, S.E.; Deegan, P.; Ferrara, L.; Sonebi, M.; Crosset, P.; Pattarini, A. Full-scale testing and numerical analysis of a precast fibre reinforced self-compacting concrete slab prestressed with basalt fibre reinforced polymer bars. Compos. Part B Eng. 2017, 128, 120–133. [Google Scholar] [CrossRef]
- Han, S.J.; Jeong, J.H.; Joo, H.E.; Choi, S.H.; Choi, S.; Kim, K.S. Flexural and shear performance of prestressed composite slabs with inverted multi-ribs. Appl. Sci. 2019, 9, 4946. [Google Scholar] [CrossRef]
- Ju, H.; Han, S.-J.; Joo, H.-E.; Cho, H.-C.; Kim, K.; Oh, Y.-H. Shear performance of optimized-section precast slab with tapered cross section. Sustainability 2018, 11, 163. [Google Scholar] [CrossRef]
- Espeche, A.D.; León, J. Estimation of bond strength envelopes for old-to-new concrete interfaces based on a cylinder splitting test. Constr. Build. Mater. 2011, 25, 1222–1235. [Google Scholar] [CrossRef]
- Yang, K.H.; Sim, J.; Kang, J.H.; Ashour, A.F. Shear capacity of monolithic concrete joints without transverse reinforcement. Mag. Concr. Res. 2012, 64, 767–779. [Google Scholar] [CrossRef]
- Mohamad, M.E.; Ibrahim, I.S. Interface shear strength of concrete-to concrete bond with and without projecting steel reinforcement. J. Teknol. 2015, 75, 169–172. [Google Scholar] [CrossRef]
- Santos, P.M.D.; Júlio, E.N.B.S. Comparison of methods for texture assessment of concrete surfaces. ACI Mater. J. 2010, 107, 433–440. [Google Scholar] [CrossRef]
- Sadowski, L. Multi-scale evaluation of the interphase zone between the overlay and concrete substrate: Methods and descriptors. Appl. Sci. 2017, 7, 893. [Google Scholar] [CrossRef]
- Qian, P.; Xu, Q. Experimental investigation on properties of interface between concrete layers. Constr. Build. Mater. 2018, 174, 120–129. [Google Scholar] [CrossRef]
- Shan, W.; Liu, J.; Li, J.; Hu, H.; Chen, Y.F. Characterization of damage on precast prestressed concrete composite slabs under static loading based on acoustic emission parameters. Struct. Health Monit. 2020, 19, 2091–2106. [Google Scholar] [CrossRef]
- Santos, P.M.D.; Júlio, E.N.B.S.; Silva, V.D. Correlation between concrete-to-concrete bond strength and the roughness of the substrate surface. Constr. Build. Mater. 2007, 21, 1688–1695. [Google Scholar] [CrossRef]
- Santos, P.M.D.; Júlio, E.N.B.S. Interface shear transfer on composite concrete members. ACI Struct. J. 2014, 111, 113–121. [Google Scholar] [CrossRef]
- Far, B.K.; Zanotti, C. Concrete-concrete bond in Mode-I: A study on the synergistic effect of surface roughness and fiber reinforcement. Appl. Sci. 2019, 9, 2556. [Google Scholar] [CrossRef]
- Franczak-Balmas, D. Analiza wpływu wytrzymałości betonów składowych jako czynnika kształtującego nośność niezbrojonego styku zespolonych elementów betonowych. Budownictwo i Architektura 2016, 15, 053–061. [Google Scholar] [CrossRef]
- Loov, R.E.; Patnaik, A.K. Horizontal shear strength of composite concrete beams with a rough interface. PCI J. 1994, 39, 48–69. [Google Scholar] [CrossRef]
- Halicka, A. Influence new-to-old concrete interface qualities on the behaviour of support zones of composite concrete beams. Constr. Build. Mater. 2011, 25, 4072–4078. [Google Scholar] [CrossRef]
- Lantsoght, E.O.L.; Van Der Veen, C.; De Boer, A.; Walraven, J.C. One-way slabs subjected to combination of loads failing in shear. ACI Struct. J. 2015, 112, 419–428. [Google Scholar] [CrossRef]
- Fernandes, H.; Lúcio, V.; Ramos, A. Strengthening of RC slabs with reinforced concrete overlay on the tensile face. Eng. Struct. 2017, 132, 540–550. [Google Scholar] [CrossRef]
- Cavaco, E.; Camara, J. Experimental research on the behaviour of concrete-to-concrete interfaces subjected to a combination of shear and bending moment. Eng. Struct. 2017, 132, 278–287. [Google Scholar] [CrossRef]
- Mohamed, M.S.; Thamboo, J.A.; Jeyakaran, T. Experimental and numerical assessment of the flexural behaviour of semi-precast-reinforced concrete slabs. Adv. Struct. Eng. 2020, 23, 1865–1879. [Google Scholar] [CrossRef]
- Ajdukiewicz, A.; Węglorz, M.; Kliszczewicz, A. Experimental study on effectiveness of interaction between pre-tensioned hollow-core slabs and concrete topping. Archit. Civ. Eng. Environ. 2008, 1, 57–66. [Google Scholar]
- Mones, R.M.; Breña, S.F. Hollow-core slabs with cast-in-place concrete toppings: A study of interfacial shear strength. PCI J. 2013, 58, 124–141. [Google Scholar] [CrossRef]
- Adawi, A.; Youssef, M.A.; Meshaly, M.E. Experimental investigation of the composite action between hollowcore slabs with machine-cast finish and concrete topping. Eng. Struct. 2015, 91, 1–15. [Google Scholar] [CrossRef]
- Derkowski, W.; Surma, M. Composite action of precast hollow core slabs with structural topping. Tech. Trans. 2015, 3-B, 15–29. [Google Scholar] [CrossRef]
- Derkowski, W.; Surma, M. Pretensioned beam-and-block floor systems—Real scale tests. Tech. Trans. Civ. Eng. 2012, 3-B, 35–49. [Google Scholar]
- Ribas, C.; Cladera, A. Experimental study on shear strength of beam-and-block floors. Eng. Struct. 2013, 57, 428–442. [Google Scholar] [CrossRef]
- Halicka, A. Analysis of support zones in composite concrete beams using MCFT. Arch. Civ. Mech. Eng. 2006, 6, 49–66. [Google Scholar] [CrossRef]
- Halicka, A.; Jabłoński, Ł. Shear failure mechanism of composite concrete T-shaped beams. Proc. Inst. Civ. Eng. Struct. Build. 2016, 169, 67–75. [Google Scholar] [CrossRef]
- Jabłoński, Ł.; Halicka, A. Influence of surface based cohesive parameters on static performance of concrete composite T-shaped beams. MATEC Web Conf. 2019, 262, 08003. [Google Scholar] [CrossRef]
- Gromysz, K. Distribution of forces in composite concrete slabs between the joint and the reinforcement anchored on the support. Procedia Eng. 2013, 65, 206–211. [Google Scholar] [CrossRef][Green Version]
- Gromysz, K. Verification of the damping model vibrations of reinforced concrete composite slabs. Procedia Eng. 2013, 57, 372–381. [Google Scholar] [CrossRef][Green Version]
- Zhang, J.; Liu, B.; Han, B.; Ni, Y.; Li, Z. Analysis of out-of-plane performance of composite slab with precast concrete ribbed panels under a hanging load. PCI J. 2019, 64, 43–57. [Google Scholar] [CrossRef]
- Zheng, W.; Lu, X.; Wang, Y. Flexural behaviour of precast, prestressed ribbed rpc bottom panels. Open Civ. Eng. J. 2015, 9, 535–543. [Google Scholar] [CrossRef][Green Version]
- Liu, J.; Hu, H.; Li, J.; Chen, Y.F.; Zhang, L. Flexural behavior of prestressed concrete composite slab with precast inverted T-shaped ribbed panels. Eng. Struct. 2020, 215, 110687. [Google Scholar] [CrossRef]
- Irawan, D.; Iranata, D.; Suprobo, P. Experimental study of two way half slab precast using triangular rigid connection of precast concrete component. Int. J. Appl. Eng. Res. 2017, 12, 744–754. [Google Scholar]
- Wang, Q.; Wu, Q.X.; Chen, B.C. Experimental study on failure mode of hinged joint in assembly voided slab bridge. Eng. Mech. (Gongcheng Lixue) 2014, 31, 115–120. [Google Scholar] [CrossRef]
- Menkulasi, F.; Mercer, M.; Roberts Wollmann, C.L.; Cousins, T. Investigation of the effects of transverse bending in a composite inverted T-slab bridge system. J. Bridg. Eng. 2017, 22, 04016101. [Google Scholar] [CrossRef]
- Ibrahim, I.S.; Padil, K.H.; Mansoor, H.; Bady, A.; Saim, A.A.; Sarbini, N.N.; Bady, H.; Saim, A.A.; Sarbini, N.N. Ultimate shear capacity and failure of shear key connection in precast concrete construction. Malays. J. Civ. Eng. 2014, 26, 414–430. [Google Scholar] [CrossRef]
- Shamass, R.; Zhou, X.; Wu, Z. Numerical analysis of shear-off failure of keyed epoxied joints in precast concrete segmental bridges. J. Bridg. Eng. 2017, 22, 04016108. [Google Scholar] [CrossRef]
- Soeprapto, G.; Sunarso, M.; Sumarsono; Murdono, F.; Agustin, W.; Siahaan, R. Effect of longitudinal joint on the shear-key of hollow core slab which function as an rigid diaphragm. MATEC Web Conf. 2017, 101, 01017. [Google Scholar] [CrossRef]
- Song, J.-Y.; Kim, S.E.; Lee, H.; Kwak, H.-G. Load distribution factors for hollow core slabs with in-situ reinforced concrete joints. Int. J. Concr. Struct. Mater. 2009, 3, 63–69. [Google Scholar] [CrossRef]
- Comité Européen de Normalisation EN 1168: Precast Concrete Products—Hollow Core Slabs; CEN: Brussels, Belgium, 2011.
- Comité Européen de Normalisation EN 13747: Precast Concrete Products—Floor Plates for Floor Systems; CEN: Brussels, Belgium, 2005; Volume 3.
- Comité Européen de Normalisation EN 15037-1: Precast Concrete Products—Beam-and-Block Floor Systems—Part 1: Beams; CEN: Brussels, Belgium, 2004.
- Castel, A.; Gilbert, R.I.; Ranzi, G. Overall stiffness reduction of cracked reinforced concrete beams due to long term effects. In Mechanics and Physics of Creep, Shrinkage, and Durability of Concrete: A Tribute to Zdeněk P. Bažant, Proceedings of the Ninth International Conference on Creep, Shrinkage, and Durability Mechanics (CONCREEP-9), Cambridge, MA, USA, 22–25 September 2013; American Society of Civil Engineers: Reston, VA, USA, 2013; pp. 443–450. [Google Scholar] [CrossRef]
- Micelli, F.; Candido, L.; Vasanelli, E.; Aiello, M.A.; Plizzari, G. Effects of short fibers on the long-term behavior of RC/FRC beams aged under service loading. Appl. Sci. 2019, 9, 2540. [Google Scholar] [CrossRef]
- Cao, W.; Liu, Y.; Qiao, Q.; Feng, Y.; Peng, S. Time-dependent behavior of full-scale recycled aggregate concrete beams under long-term loading. Materials 2020, 13, 4862. [Google Scholar] [CrossRef]
- British Standard Testing Hardened Concrete—Part 1: Shape, Dimensions and Other Requirements for Specimens and Moulds; CEN: Brussels, Belgium, 2000; Volume 3, pp. 1–14.
- Comité Européen de Normalisation EN 12390-2:2019, Testing Hardened Concrete—Part 2: Making and Curing Specimens for Strength Test; CEN: Brussels, Belgium, 2019.
- Comité Européen de Normalisation EN 12390-3 Testing Hardened Concrete. Compressive Strength of Test Specimens; CEN: Brussels, Belgium, 2009; p. 22.
- Comité Européen de Normalisation EN 12390-13:2013 Testing Hardened Concrete Part 13: Determination of Secant Modulus of Elasticity in Comprssion; CEN: Brussels, Belgium, 2013.
- Comité Européen de Normalisation EN 1992-1-1:2004 Design of Concrete Structures. General Rules and Rules for Buildings; CEN: Brussels, Belgium, 2008.
- Comité Européen de Normalisation EN 10080:2007, Steel for the Reinforcement of Concrete—Weldable Reinforcing Steel-General; CEN: Brussels, Belgium, 2007.
- Comité Européen de Normalisation EN ISO 15630-1:2004, Steel for the Reinforcement and Prestressing of Concrete—Test Methods—Part 1: Reinforcing Bars, Wire Rod and Wire; CEN: Geneva, Switzerland, 2004.
- Comité Européen de Normalisation EN 6892-1 Metallic Materials—Tensile Testing—Part 1: Method of Test at Room Temperature; CEN: Geneva, Switzerland, 2016; p. 79.
- Comité Européen de Normalisation EN 14889-2:2006, Fibres for Concrete—Part 2: Polymer Fibres—Definitions, Specifications and Conformity; CEN: Brussels, Belgium, 2006.
Publisher’s Note: MDPI stays neutral with regard to jurisdictional claims in published maps and institutional affiliations. |
© 2021 by the authors. Licensee MDPI, Basel, Switzerland. This article is an open access article distributed under the terms and conditions of the Creative Commons Attribution (CC BY) license (https://creativecommons.org/licenses/by/4.0/).
