
Reliability Assessment of Space Station Based on Multi-Layer and Multi-Type Risks

Abstract
:1. Introduction
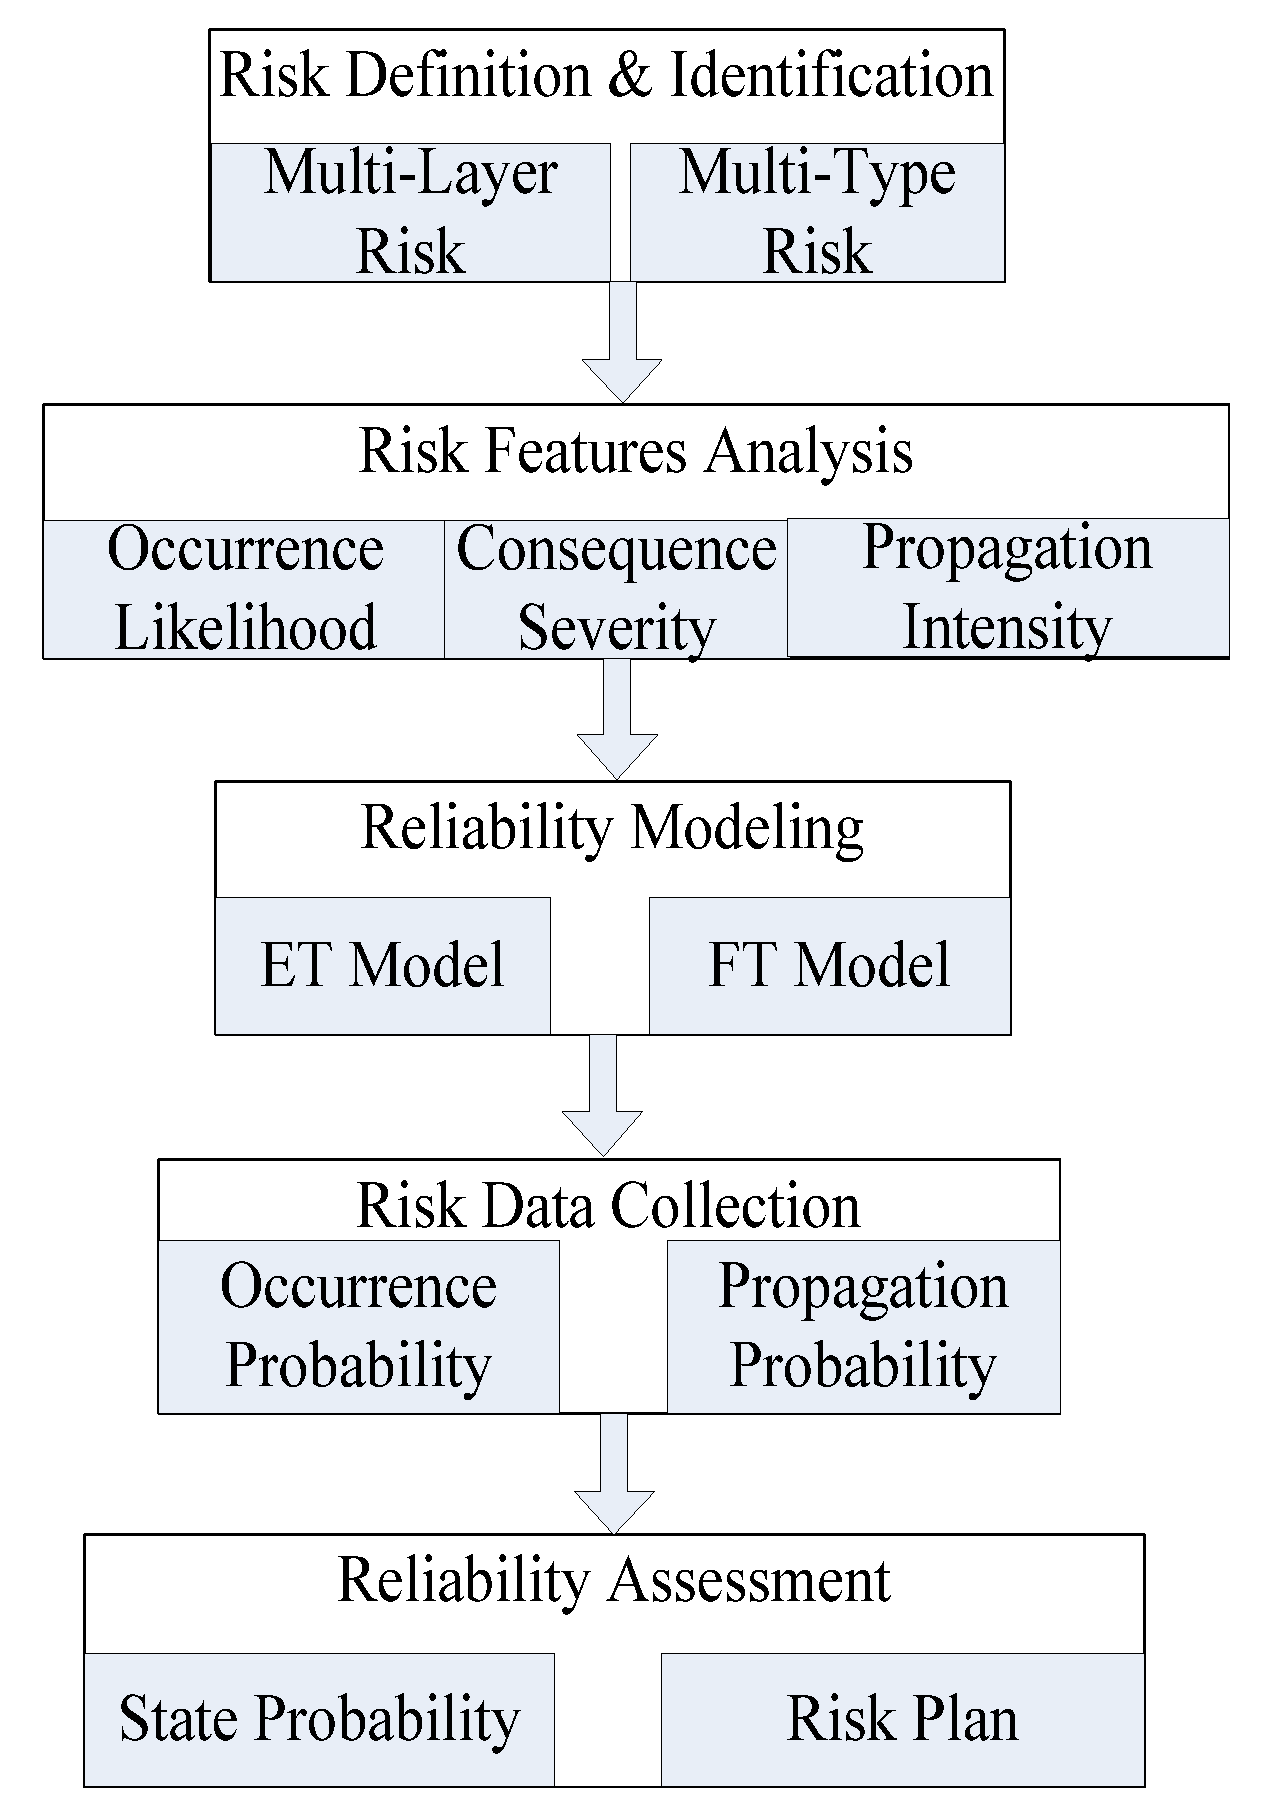
2. Framework of Space Station Configuration Reliability Assessment
3. Risk Definition and Identification of Space Station
3.1. Risk Definition
3.2. Risk Identification
4. Risk Features Analysis of Space Station
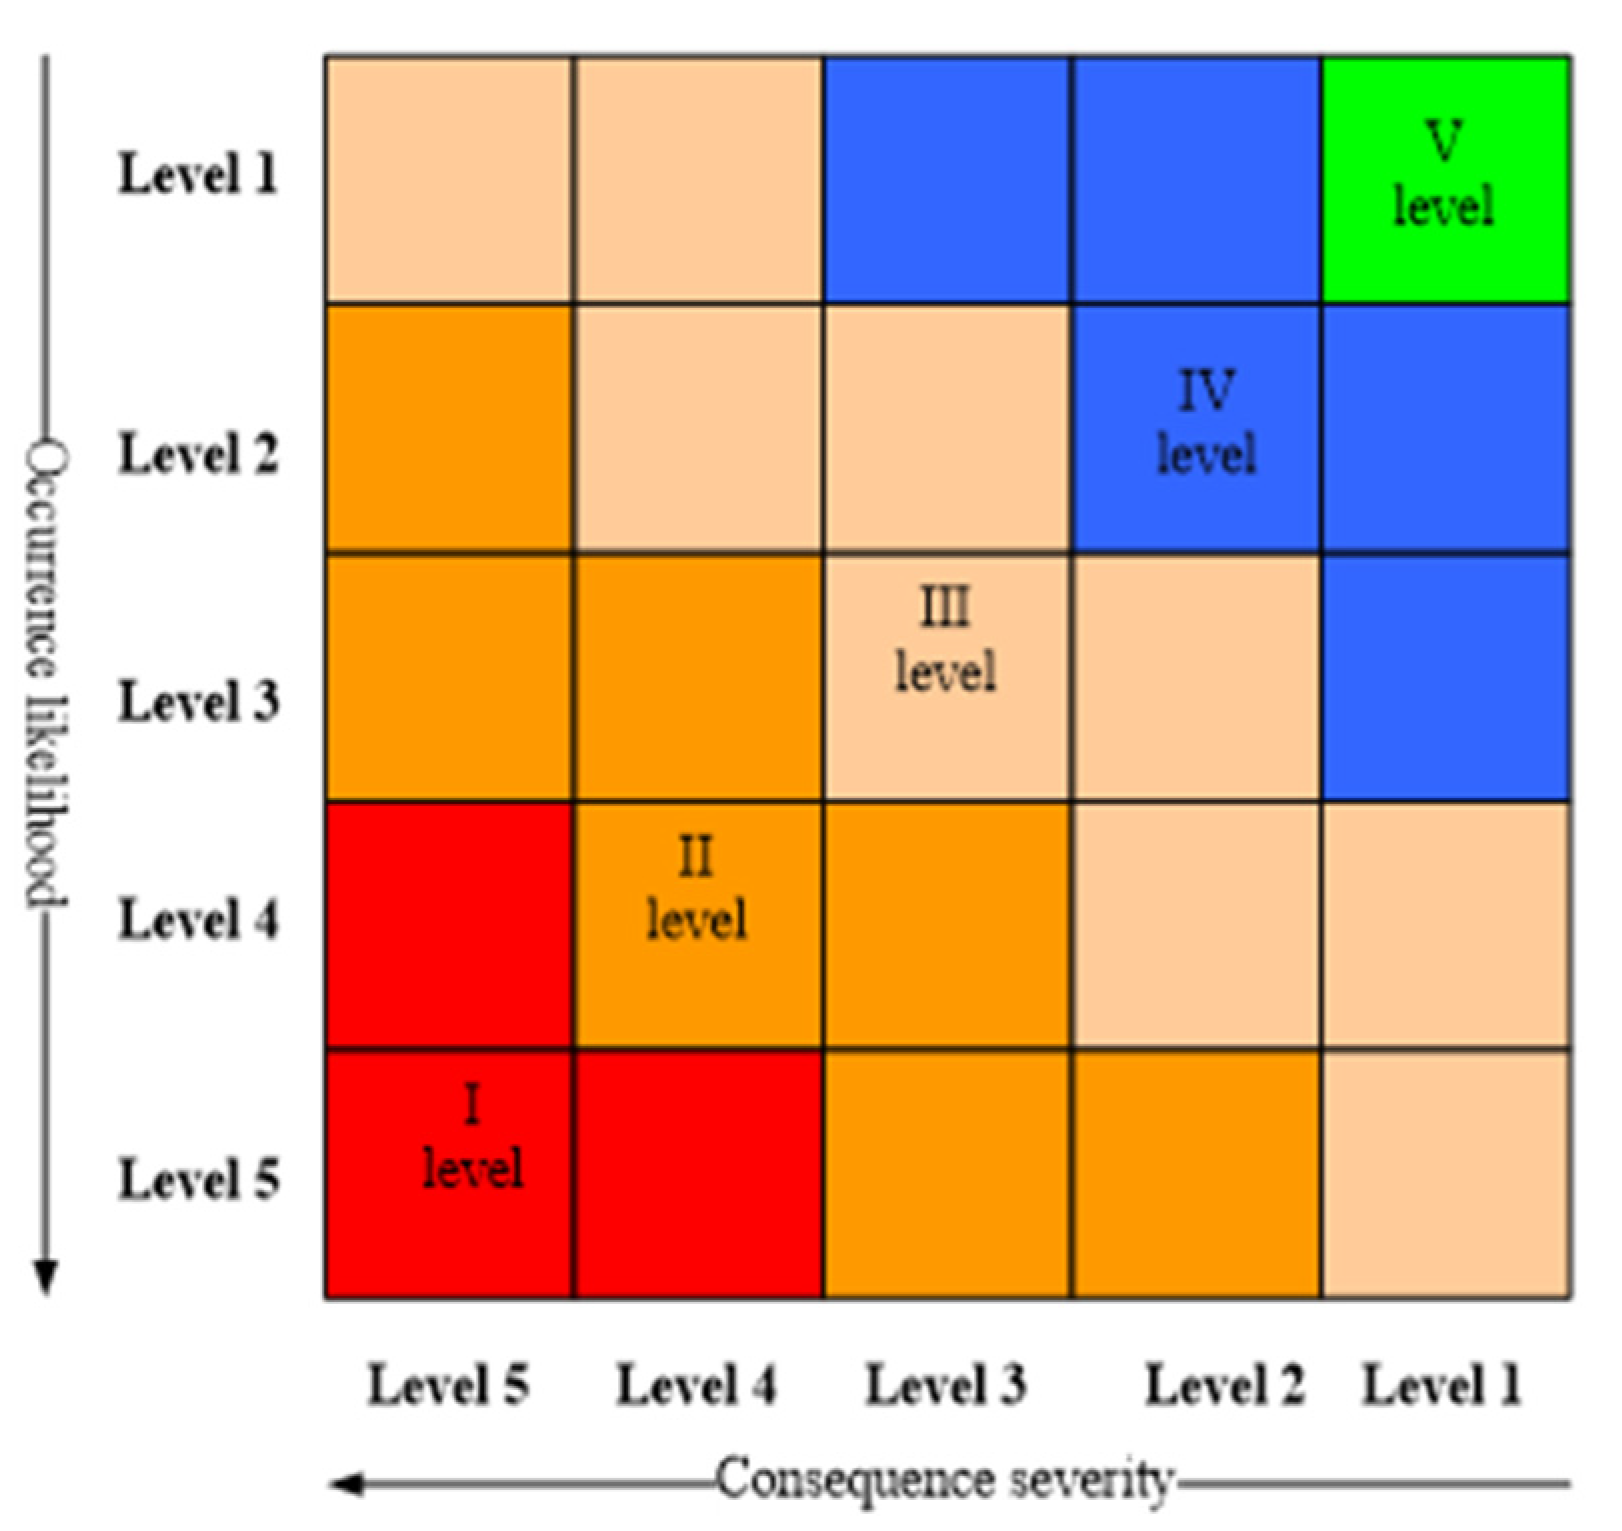
4.1. Risk Feature Qualitative Analysis
4.2. Risk Feature Quantitative Analysis
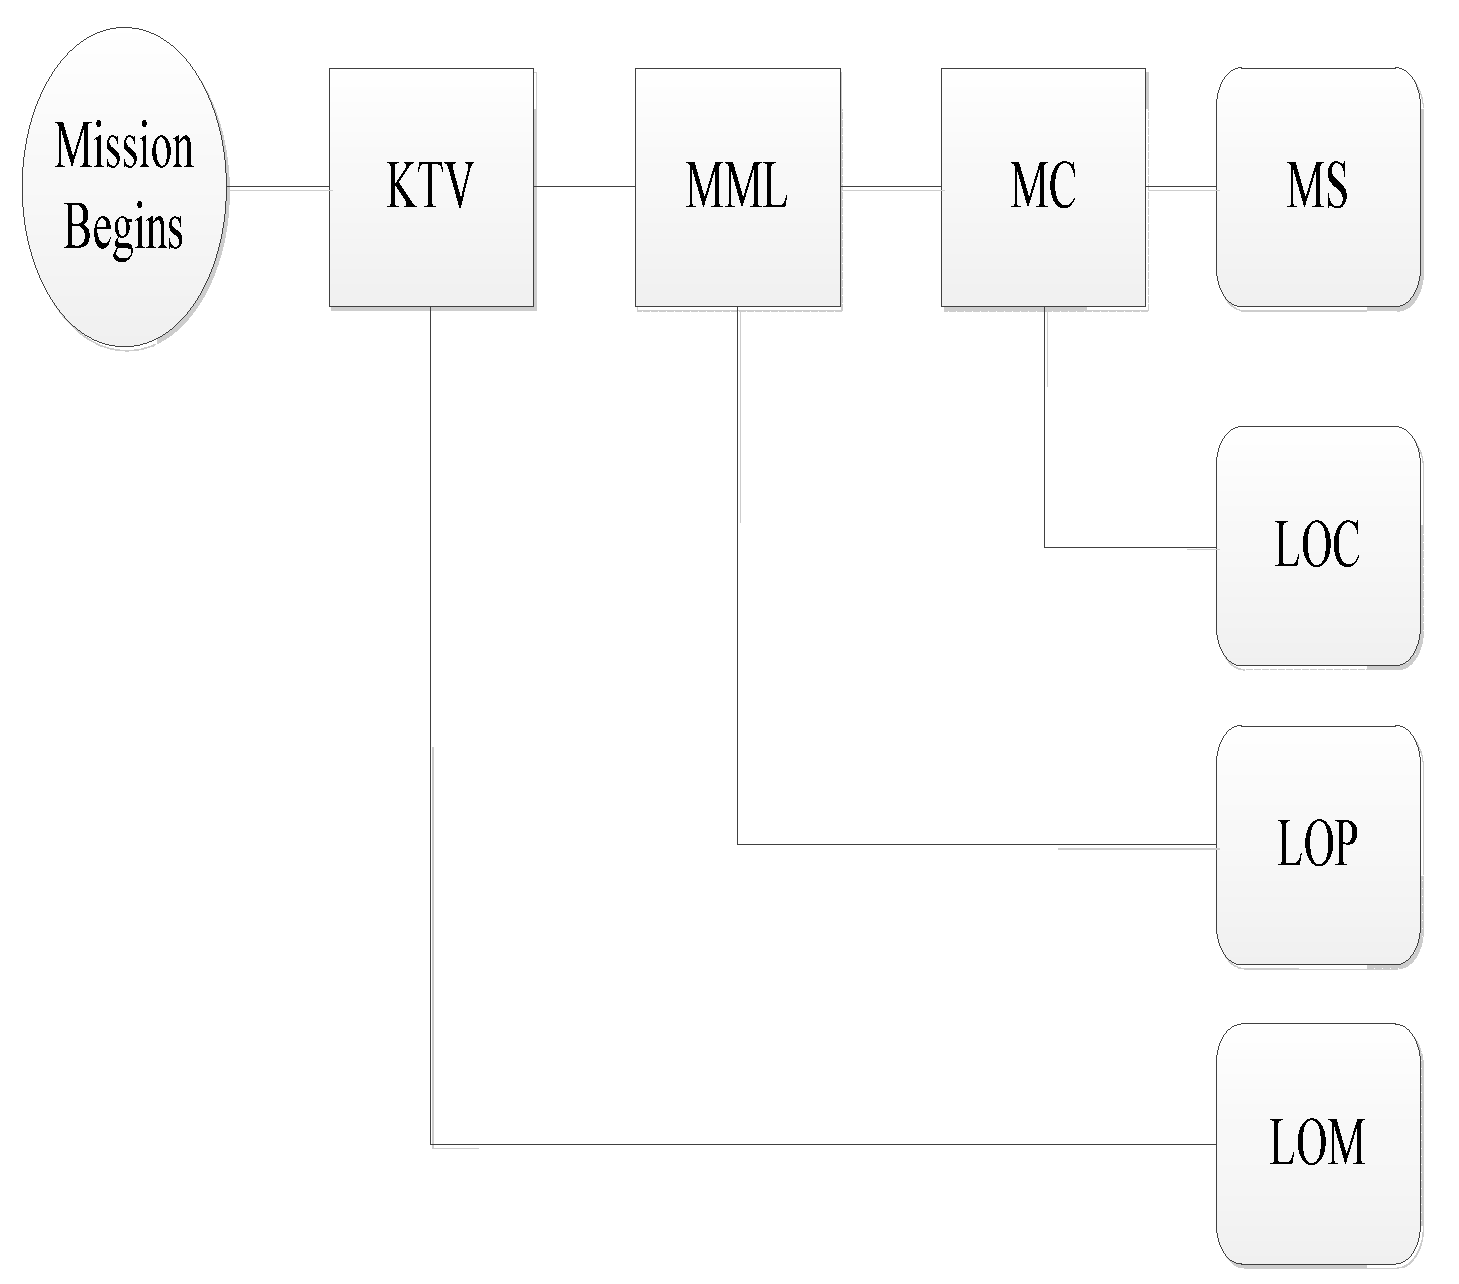
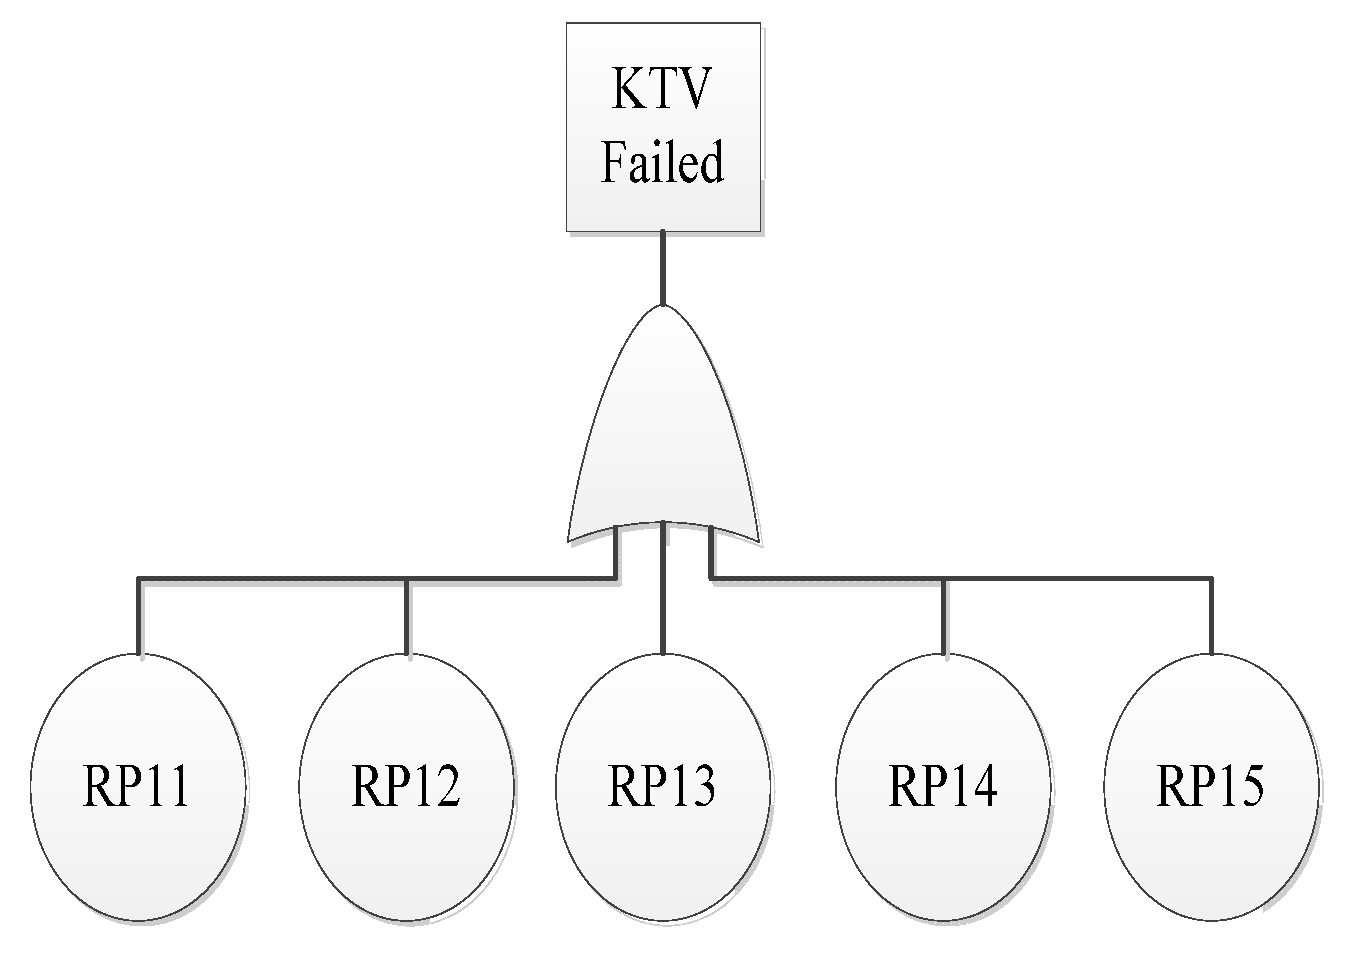
5. Reliability Model of Space Station Configuration
6. Data Collection of Space Station Configuration Risks
7. Reliability Assessment of Space Station Configuration Mission
8. Conclusions and Future Works
Author Contributions
Funding
Institutional Review Board Statement
Informed Consent Statement
Data Availability Statement
Conflicts of Interest
References
- Wang, K.Q.; Zhang, B.N.; Xing, T. Preliminary integrated analysis for modeling and optimizing space stations at conceptual level. Aerosp. Sci. Technol. 2017, 71, 420–431. [Google Scholar] [CrossRef]
- Wang, X.H.; Mao, L.H.; Yue, Y.X.; Zhao, J.W. Manned lunar landing mission scale analysis and flight scheme selection based on mission architecture matrix. Acta Astronaut. 2018, 152, 385–395. [Google Scholar] [CrossRef]
- Ryan, C.W.; John, D.B.; Damon, F.L.; Austin, K.N. Cargo logistics for a Notional Mars Base using Solar Electric Propulsion. Acta Astronaut. 2019, 156, 51–57. [Google Scholar] [CrossRef]
- Antonio, A.; Laura, G. Risk assessment in the aerospace industry. Saf. Sci. 2002, 40, 271–298. [Google Scholar]
- Mario, B.; Gwyn, G. A Bayesian approach for predicting risk of autonomous underwater vehicle loss during their missions. Reliab. Eng. Syst. Saf. 2016, 146, 55–67. [Google Scholar]
- Li, X.Y.; Huang, H.Z.; Li, Y.F.; Zio, E. Reliability Assessment of Multi-state Phased Mission System with Non-repairable Multi-state Components. Appl. Math. Model. 2018, 61, 181–199. [Google Scholar] [CrossRef] [Green Version]
- Li, X.Y.; Huang, H.Z.; Li, Y.F. Reliability analysis of phased mission system with non-exponential and partially repairable components. Reliab. Eng. Syst. Saf. 2018, 175, 119–127. [Google Scholar] [CrossRef]
- Li, X.Y.; Li, Y.F.; Huang, H.Z.; Zio, E. Reliability Assessment of Phased-mission Systems Under Random Shocks. Reliab. Eng. Syst. Saf. 2018, 180, 352–361. [Google Scholar] [CrossRef] [Green Version]
- Marko, Č. Application of shutdown probabilistic safety assessment. Reliab. Eng. Syst. Saf. 2018, 178, 147–155. [Google Scholar]
- Payam, A.H.; Mohammad, R. Probabilistic risk assessment of oil spill from offshore oil wells in Persian Gulf. Mar. Pollut. Bull. 2018, 136, 291–299. [Google Scholar]
- Diego, M.; Alper, Y.; Tunc, A.; Kyle, M.; Richard, D. Scenario clustering and dynamic probabilistic risk assessment. Reliab. Eng. Syst. Saf. 2013, 115, 146–160. [Google Scholar]
- Ha, B.; Tatsuya, S.; Justin, P.; Seyed, R.; Ernie, K.; Zahra, M. An algorithm for enhancing spatiotemporal resolution of probabilistic risk assessment to address emergent safety concerns in nuclear power plants. Reliab. Eng. Syst. Saf. 2019, 185, 405–428. [Google Scholar]
- Donovan, L.M.; Christopher, J.M.; Susie, G. Engineering Risk Assessment of a dynamic space propulsion system benchmark problem. Reliab. Eng. Syst. Saf. 2016, 145, 316–328. [Google Scholar]
- Papazoglou, I.A.; Aneziris, O.N.; Bellamy, L.J.; Ale, B.J.M.; Oh, J. Multi-hazard multi-person quantitative occupational risk model and risk management. Reliab. Eng. Syst. Saf. 2017, 167, 310–326. [Google Scholar] [CrossRef]
- Abdul, A.; Salim, A.; Faisal, K.; Chris, S.; Annes, L. Operational risk assessment model for marine vessels. Reliab. Eng. Syst. Saf. 2019, 185, 348–361. [Google Scholar]
- Terje, A.; Zio, E. Some considerations on the treatment of uncertainties in risk assessment for practical decision making. Reliab. Eng. Syst. Saf. 2011, 96, 64–74. [Google Scholar]
- Mi, J.; Li, Y.F.; Yang, Y.J.; Peng, W.; Huang, H.Z. Reliability assessment of complex electromechanical systems under epistemic uncertainty. Reliab. Eng. Syst. Saf. 2016, 152, 1–15. [Google Scholar] [CrossRef]
- Mi, J.; Beer, M.; Li, Y.F.; Broggi, M.; Cheng, Y. Reliability and importance analysis of uncertain system with common cause failures based on survival signature. Reliab. Eng. Syst. Saf. 2020, 201, 69–88. [Google Scholar] [CrossRef]
- Mi, J.; Li, Y.F.; Peng, W.; Huang, H.Z. Reliability analysis of complex multi-state system with common cause failure based on evidential networks. Reliab. Eng. Syst. Saf. 2018, 174, 71–81. [Google Scholar] [CrossRef]
- Mi, J.; Li, Y.F.; Liu, Y.; Yang, Y.J.; Huang, H.Z. Belief universal generating function analysis of multi-state systems under epistemic uncertainty and common cause failures. IEEE Trans. Reliab. 2015, 64, 1300–1309. [Google Scholar] [CrossRef]
- Li, Y.F.; Liu, Y.; Huang, T.; Huang, H.Z.; Mi, J. Reliability assessment for systems suffering common cause failure based on Bayesian networks and proportional hazards model. Qual. Reliab. Eng. Int. 2020, 36, 2509–2520. [Google Scholar] [CrossRef]
- Li, Y.F.; Huang, H.Z.; Mi, J.; Peng, W.; Han, X. Reliability analysis of multi-state systems with common cause failures based on Bayesian network and fuzzy probability. Ann. Oper. Res. 2019. [Google Scholar] [CrossRef]
- Su, W.; Ren, J. Risk propagation model based on social life and credit activities multilayers fusion network. Concurr. Comput. Pr. Exper. 2019, 31, e4732. [Google Scholar] [CrossRef]
- Zhu, F.; Zhong, P.A.; Sun, Y.M.; William, W.G.Y. Real-time optimal flood control decision making and risk propagation under multiple uncertainties. Water Resour. Res. 2017, 53, 10635–10654. [Google Scholar] [CrossRef] [Green Version]
- Xu, S.; Wang, P. Identifying important nodes by adaptive LeaderRank. Phys. A Stat. Mech. Its Appl. 2017, 469, 654–664. [Google Scholar] [CrossRef]
- Li, Q.; Zhou, T.; Lü, L.Y.; Chen, D.B. Identifying influential spreaders by weighted LeaderRank. Phys. A Stat. Mech. Its Appl. 2014, 404, 47–55. [Google Scholar] [CrossRef] [Green Version]
- Surya, K.; Tripti, M.; Vinay, K.J.; Deepak, K.J.; Arun, K.S. LeaderRank based k-means clustering initialization method for collaborative filtering. Comput. Electr. Eng. 2018, 69, 598–609. [Google Scholar]
- Groen, F.J.; Smidts, C.S.; Mosleh, A. QRAS—The Quantitative Risk Assessment System. In Proceedings of the 46th Annual Reliability and Maintainability Symposium, Seattle, WA, USA, 28–31 January 2002; pp. 349–355. [Google Scholar]
- Durga, R.K.; Vinh, N.D. Quantification of Dynamic Event Trees—A comparison with event trees for MLOCA scenario. Reliab. Eng. Syst. Saf. 2016, 147, 19–31. [Google Scholar]
- Raiyan, A.; Das, S.; Islam, M.R. Event Tree Analysis of Marine Accidents in Bangladesh. Procedia Eng. 2017, 194, 276–283. [Google Scholar] [CrossRef]
- Xin, S.; Zhang, L.; Jin, X.N.; Zhang, Q. Reconstruction of the fault tree based on accident evolution. Process Saf. Environ. Prot. 2019, 121, 307–311. [Google Scholar] [CrossRef]
- Enno, R.; Daniël, R.; Pieter, T.B.; Mariëlle, S. Rare event simulation for dynamic fault trees. Reliab. Eng. Syst. Saf. 2019, 186, 220–231. [Google Scholar]
- Gu, W.W.; Luo, J.; Liu, J.F. Exploring small-world network with an elite-clique: Bringing embeddedness theory into the dynamic evolution of a venture capital network. Soc. Netw. 2019, 57, 70–81. [Google Scholar] [CrossRef] [Green Version]
- Zhou, Y.; Li, C.S.; Ding, L.Y. Combining association rules mining with complex networks to monitor coupled risks. Reliab. Eng. Syst. Saf. 2019, 186, 194–208. [Google Scholar] [CrossRef]
- Wang, H.; Gu, T.; Jin, M.Z.; Zhao, R.; Wang, G.X. The complexity measurement and evolution analysis of supply chain network under disruption risks. Chaos Solitons Fractals 2018, 116, 72–78. [Google Scholar] [CrossRef]
- Wang, Z.Y.; David, J.H.; Chen, G.; Dong, Z.Y. Power system cascading risk assessment based on complex network theory. Phys. A Stat. Mech. Its Appl. 2017, 482, 532–543. [Google Scholar] [CrossRef]
- Gong, L.; Zhang, S.G.; Tang, P.; Feng, Y. Implication of mishaps to preliminary hazard analysis of hypersonic vehicles. Procedia Eng. 2014, 80, 437–444. [Google Scholar] [CrossRef] [Green Version]
- Abdul, A.; Salim, A.; Faisal, I.K. An ontology-based method for hazard identification and causation analysis. Process Saf. Environ. Prot. 2019, 123, 87–98. [Google Scholar]
- Jain, P.; Rogers, W.J.; Pasman, H.J.; Keim, K.K.; Mannan, M.S. A Resilience-based Integrated Process Systems Hazard Analysis (RIPSHA) approach: Part I plant system layer. Process Saf. Environ. Prot. 2018, 116, 92–105. [Google Scholar] [CrossRef]
- Yu, X.C.; Liang, W.; Zhang, L.B.; Genserik, R.; Lu, L.L. Risk assessment of the maintenance process for onshore oil and gas transmission pipelines under uncertainty. Reliab. Eng. Syst. Saf. 2018, 177, 50–67. [Google Scholar] [CrossRef]
- Guo, J.; Li, Z.J.; Thomas, K. A Bayesian approach for integrating multilevel priors and data for aerospace system reliability assessment. Chin. J. Aeronaut. 2018, 31, 41–53. [Google Scholar] [CrossRef]
- Vincent, C.; Mathieu, B.; Jean, M.B.; Jérôme, M.; Nicolas, G. Evaluation of failure probability under parameter epistemic uncertainty: Application to aerospace system reliability assessment. Aerosp. Sci. Technol. 2017, 69, 526–537. [Google Scholar]
- Tiffaney, M.A. A case based human reliability assessment using HFACS for complex space operations. J. Space Saf. Eng. 2019, 6, 53–59. [Google Scholar]
- Alexander, P.K.; Ginestra, B. Beyond the clustering coefficient: A topological analysis of node neighbourhoods in complex networks. Chaos Solitons Fractals X 2019, 1, 100004. [Google Scholar]
- Li, Y.S.; Shang, Y.L.; Yang, Y.T. Clustering coefficients of large networks. Inf. Sci. 2017, 382–383, 350–358. [Google Scholar] [CrossRef]
- Gao, F.; Le, A.B.; Xi, L.F.; Yin, S.H. Asymptotic formula on average path length of fractal networks modeled on Sierpinski gasket. J. Math. Anal. Appl. 2016, 434, 1581–1596. [Google Scholar] [CrossRef]
- Andreas, I.R.; Konstantinos, S.; Constantinos, I.S. Tuning the average path length of complex networks and its influence to the emergent dynamics of the majority-rule model. Math. Comput. Simul. 2015, 109, 186–196. [Google Scholar]
- Julio, F.; Miguel, R. On eigenvector-like centralities for temporal networks: Discrete vs. continuous time scales. J. Comput. Appl. Math. 2018, 330, 1041–1051. [Google Scholar]
- Phillip, B. Some unique properties of eigenvector centrality. Soc. Netw. 2007, 29, 555–564. [Google Scholar]


| Risk Layer | Risk Type | Risk Number |
|---|---|---|
| Between-mission risks (57) | Technology risk | 12 |
| Management Risk | 5 | |
| Product risk | 23 | |
| Operation risk | 17 | |
| Between-system risks (166) | Technology risk | 34 |
| Management risk | 11 | |
| Product risk | 87 | |
| Operation risk | 34 | |
| Inner-system risks (234) | Technology risk | 56 |
| Management risk | 18 | |
| Product risk | 113 | |
| Operation risk | 47 |
| Level | Logic | Linguistic Descriptions |
|---|---|---|
| Level 1 | Rarely | The risk hardly occurs in the whole mission |
| Level 2 | Improbable | The risk cannot occur in the whole mission |
| Level 3 | Moderate | The risk occurs with a certain probability |
| Level 4 | Possible | The risk may occur in the whole mission |
| Level 5 | Probable | The risk likely occurs in the whole mission |
| Level | Logic | Linguistic Descriptions |
|---|---|---|
| Level 1 | Unaffected | no damage to the crew and platform |
| Level 2 | Light | light damage to the crew and platform |
| Level 3 | Moderate | some damage to the crew and platform |
| Level 4 | Severe | severe damage to the crew lives and platform condition |
| Level 5 | Fatal | fatal damage to the crew lives and platform condition |
| Risk Level | Between-Mission Risk Numbers | Between-System Risk Numbers | Inner-System Risk Numbers |
|---|---|---|---|
| Level V | 19 | 55 | 77 |
| Level IV | 8 | 25 | 46 |
| Level III | 17 | 23 | 26 |
| Level II | 9 | 46 | 54 |
| Level I | 4 | 17 | 31 |
| No. | Risk Name | Risk Layer | Risk Type | Symbol |
|---|---|---|---|---|
| 1 | Lack of adequate verification of space docking technology | Between-mission | Technology | RP11 |
| 2 | Insufficient verification of large assembly control technology | Between-mission | Technology | RP12 |
| 3 | Incomplete coverage of critical measurement control segment | Between-system | Technology | RP13 |
| 4 | Insufficient continuous launch support | Between-system | Management | RP14 |
| 5 | Power supply interruption | Inner-system | Product | RP15 |
| 6 | Main module failed to enter the scheduled orbit | Between-mission | Product | RP21 |
| 7 | Main module out of control | Between-mission | Product | RP22 |
| 8 | Rocket thrust deficiency | Between-system | Product | RP23 |
| 9 | Inadequate measurement and control accuracy | Between-system | Technology | RP24 |
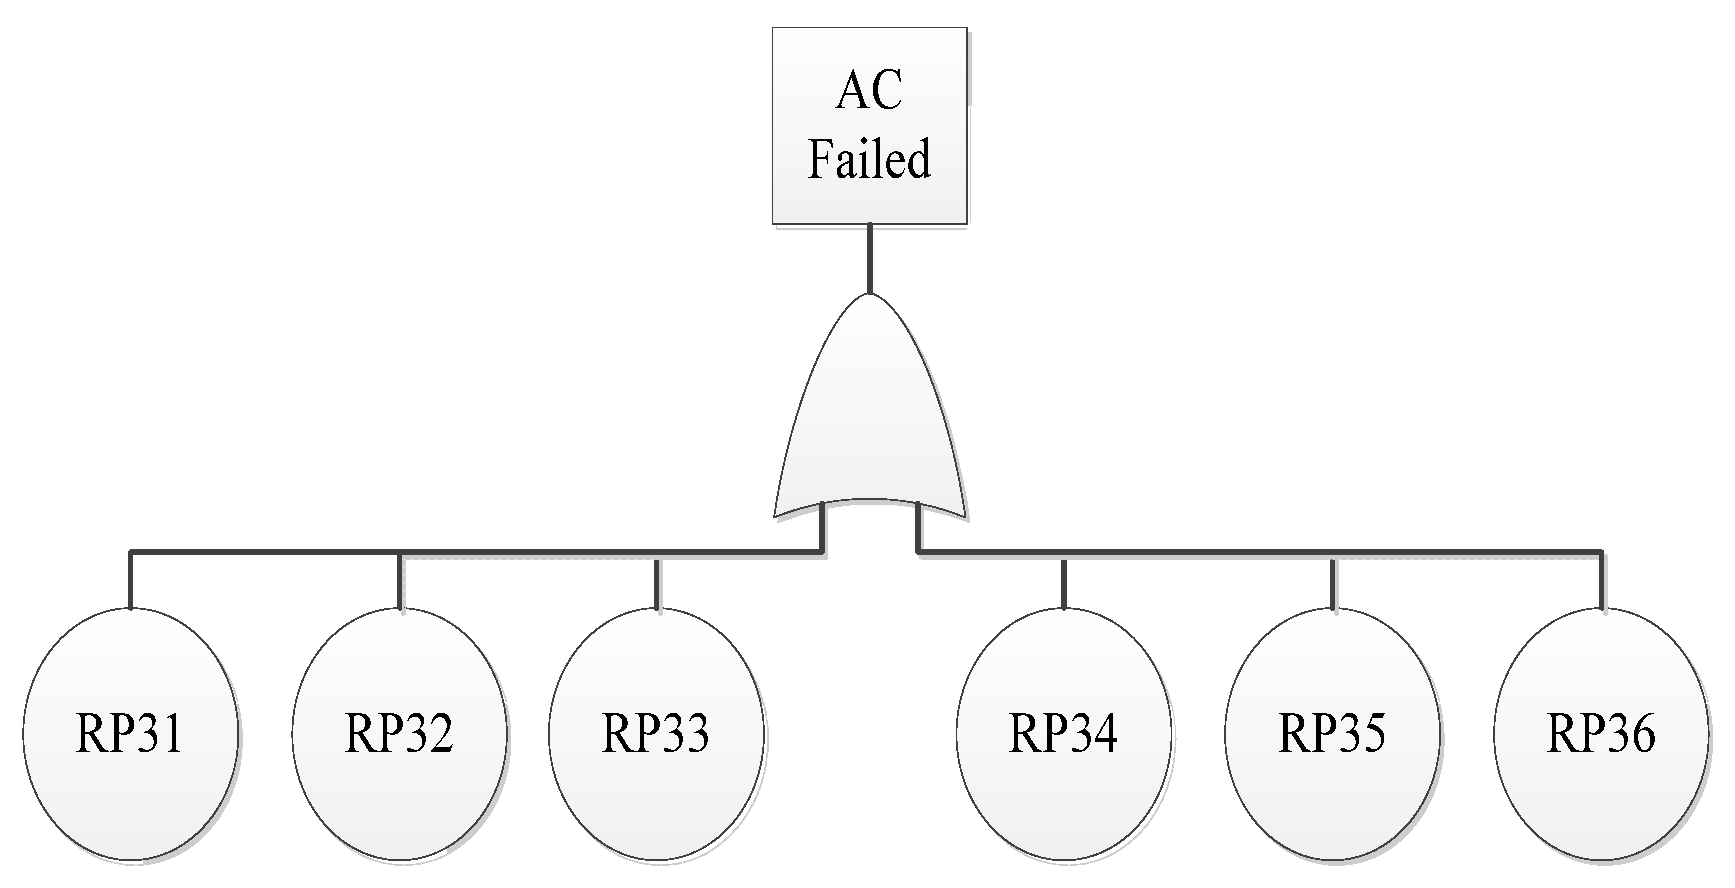
| 10 | Insufficient on-orbit material support | Between-mission | Management | RP31 |
| 11 | Main module structure damage | Between-system | Product | RP32 |
| 12 | Lack of emergency life-saving training in the crew | Between-system | Operation | RP33 |
| 13 | Cargo mission failed | Between-system | Management | RP34 |
| 14 | Cargo ship failure | Between-system | Product | RP35 |
| 15 | Main module docking interface damaged | Inner- system | Product | RP36 |
| No. | Risk Symbol | |||
|---|---|---|---|---|
| 1 | RP11 | 6.4051 | 3.8054 | 4.937 |
| 2 | RP12 | 1.4046 | 2.1985 | 5.557 |
| 3 | RP13 | 1.2188 | 4.6507 | 7.529 |
| 4 | RP14 | 4.156 | 9.421 | 6.258 |
| 5 | RP15 | 5.5806 | 8.871 | 7.036 |
| 6 | RP21 | 5.9727 | 7.2391 | 6.575 |
| 7 | RP22 | 6.7152 | 5.4309 | 6.039 |
| 8 | RP23 | 7.82 | 3.9489 | 5.557 |
| 9 | RP24 | 6.4778 | 3.7065 | 4.9 |
| 10 | RP31 | 4.1927 | 3.5042 | 3.833 |
| 11 | RP32 | 5.4695 | 1.5461 | 2.908 |
| 12 | RP33 | 2.1032 | 1.234 | 1.611 |
| 13 | RP34 | 3.9967 | 7.296 | 5.4 |
| 14 | RP35 | 1.3215 | 6.6503 | 9.343 |
| 15 | RP36 | 3.3989 | 2.1879 | 2.727 |
| End State | Mean Probability |
|---|---|
| MS | 0.9912 |
| LOC | 0.002733 |
| LOP | 0.0007357 |
| LOM | 0.005322 |
Publisher’s Note: MDPI stays neutral with regard to jurisdictional claims in published maps and institutional affiliations. |
© 2021 by the authors. Licensee MDPI, Basel, Switzerland. This article is an open access article distributed under the terms and conditions of the Creative Commons Attribution (CC BY) license (https://creativecommons.org/licenses/by/4.0/).
Share and Cite
Li, X.; Li, F. Reliability Assessment of Space Station Based on Multi-Layer and Multi-Type Risks. Appl. Sci. 2021, 11, 10258. https://doi.org/10.3390/app112110258
Li X, Li F. Reliability Assessment of Space Station Based on Multi-Layer and Multi-Type Risks. Applied Sciences. 2021; 11(21):10258. https://doi.org/10.3390/app112110258
Chicago/Turabian StyleLi, Xiaopeng, and Fuqiu Li. 2021. "Reliability Assessment of Space Station Based on Multi-Layer and Multi-Type Risks" Applied Sciences 11, no. 21: 10258. https://doi.org/10.3390/app112110258
APA StyleLi, X., & Li, F. (2021). Reliability Assessment of Space Station Based on Multi-Layer and Multi-Type Risks. Applied Sciences, 11(21), 10258. https://doi.org/10.3390/app112110258