1. Introduction
Natural products and their derivatives have successfully been developed as medicines that have enabled the treatment of various diseases [
1]. Natural products differ from compounds that can be found in synthetic screening libraries by occupying a different chemical space that makes them a valuable source for new chemical scaffolds [
2]. Microorganisms in general and bacteria in particular are promising sources for new bioactive natural products that can be developed as drug leads [
3,
4]. Natural product drug discovery commonly starts with the preparation of an extract, and this extract maybe pre-fractionated or directly investigated for bioactivity using bioassays such as anti-microbial or anti-cancer assays [
5,
6]. If bioactivity is detected, extracts or fractions are subsequently investigated for the presence of known active metabolites, which will then be removed from the pipeline [
7]. This process is called dereplication and usually relies on hyphenated mass spectrometry techniques such as HPLC-MS [
8,
9]. An extract may also be investigated for novel metabolites without preceding bioactivity testing [
10]. Potential new compounds will be isolated and subjected to structural elucidation and bioactivity profiling.
Extraction is a crucial step in the search for new active compounds. If a compound is not successfully extracted from the biomass or fermentation broth, it can obviously not be detected in downstream bioassays or chemical analysis. For bacterial fermentations, many possible extraction techniques and protocols exist, but as it is usually not feasible to apply more than one of them when screening larger collections of bacterial isolates, it is important to be aware of the limitations of the selected protocol. While we have used liquid–solid phase extraction of fermentation broths in previous studies [
11,
12], there are other relevant techniques such as liquid–liquid partition with ethyl acetate (EtOAc) [
13] or extraction of the bacterial mycelium with ethanol in case of actinobacteria [
14]. Sample pre-treatment and solvent selection are also dependent on whether intracellular or secreted metabolites are of interest [
15].
To assess the suitability of our standard method for extraction of bacterial and fungal fermentations (liquid–solid phase extraction), we conducted a small study to compare it with liquid–liquid partition using EtOAc. We investigated the qualitative difference when extracting a bacterial culture spiked with seven different natural products. So-called spike and recovery tests are an established method for verifying the suitability and detection limits of an analytical method or sample preparation, including extraction procedures [
16,
17].
In addition, the two methods were compared quantitatively by extraction of four of the natural products from aqueous solution. We also investigated a potential effect of the pH level of the aqueous solution on the extraction yields.
2. Materials and Methods
The chemicals used were of appropriate purity, as indicated by the supplier, and pure water (pH2O) was produced using an in-house MilliQ system. For vacuum filtrations, a Büchner funnel with Whatman No. 3 filter paper (Whatman plc., Maidstone, UK) was used.
2.1. Preparation of the Spiked Culture
A
Flavobacteria sp. isolate was cultured over 7 d at 10 °C in a 450 mL shaking bottle culture, shaking at 300 rpm. A DVR1 medium was used for cultivation, consisting of 6.0 g malt extract (Sigma-Aldrich, St. Louis, MO, USA), 10.0 g Peptone from casein (Sigma-Aldrich), 6.0 g yeast extract (Sigma-Aldrich), 450 mL filtrated seawater and 450 mL pH
2O [
11]. The media was sterilized by autoclaving at 120 °C for 30 min under pressure and inoculated using an inoculation loop. After cultivation, the fermentation broth was centrifuged at 4000 rpm for 10 min to remove the cells using a Multifuge 3 S-R equipped with a SORVALL 75,006,445 rotor (Heraeus GmbH & Co. KG, Hanau, Germany).
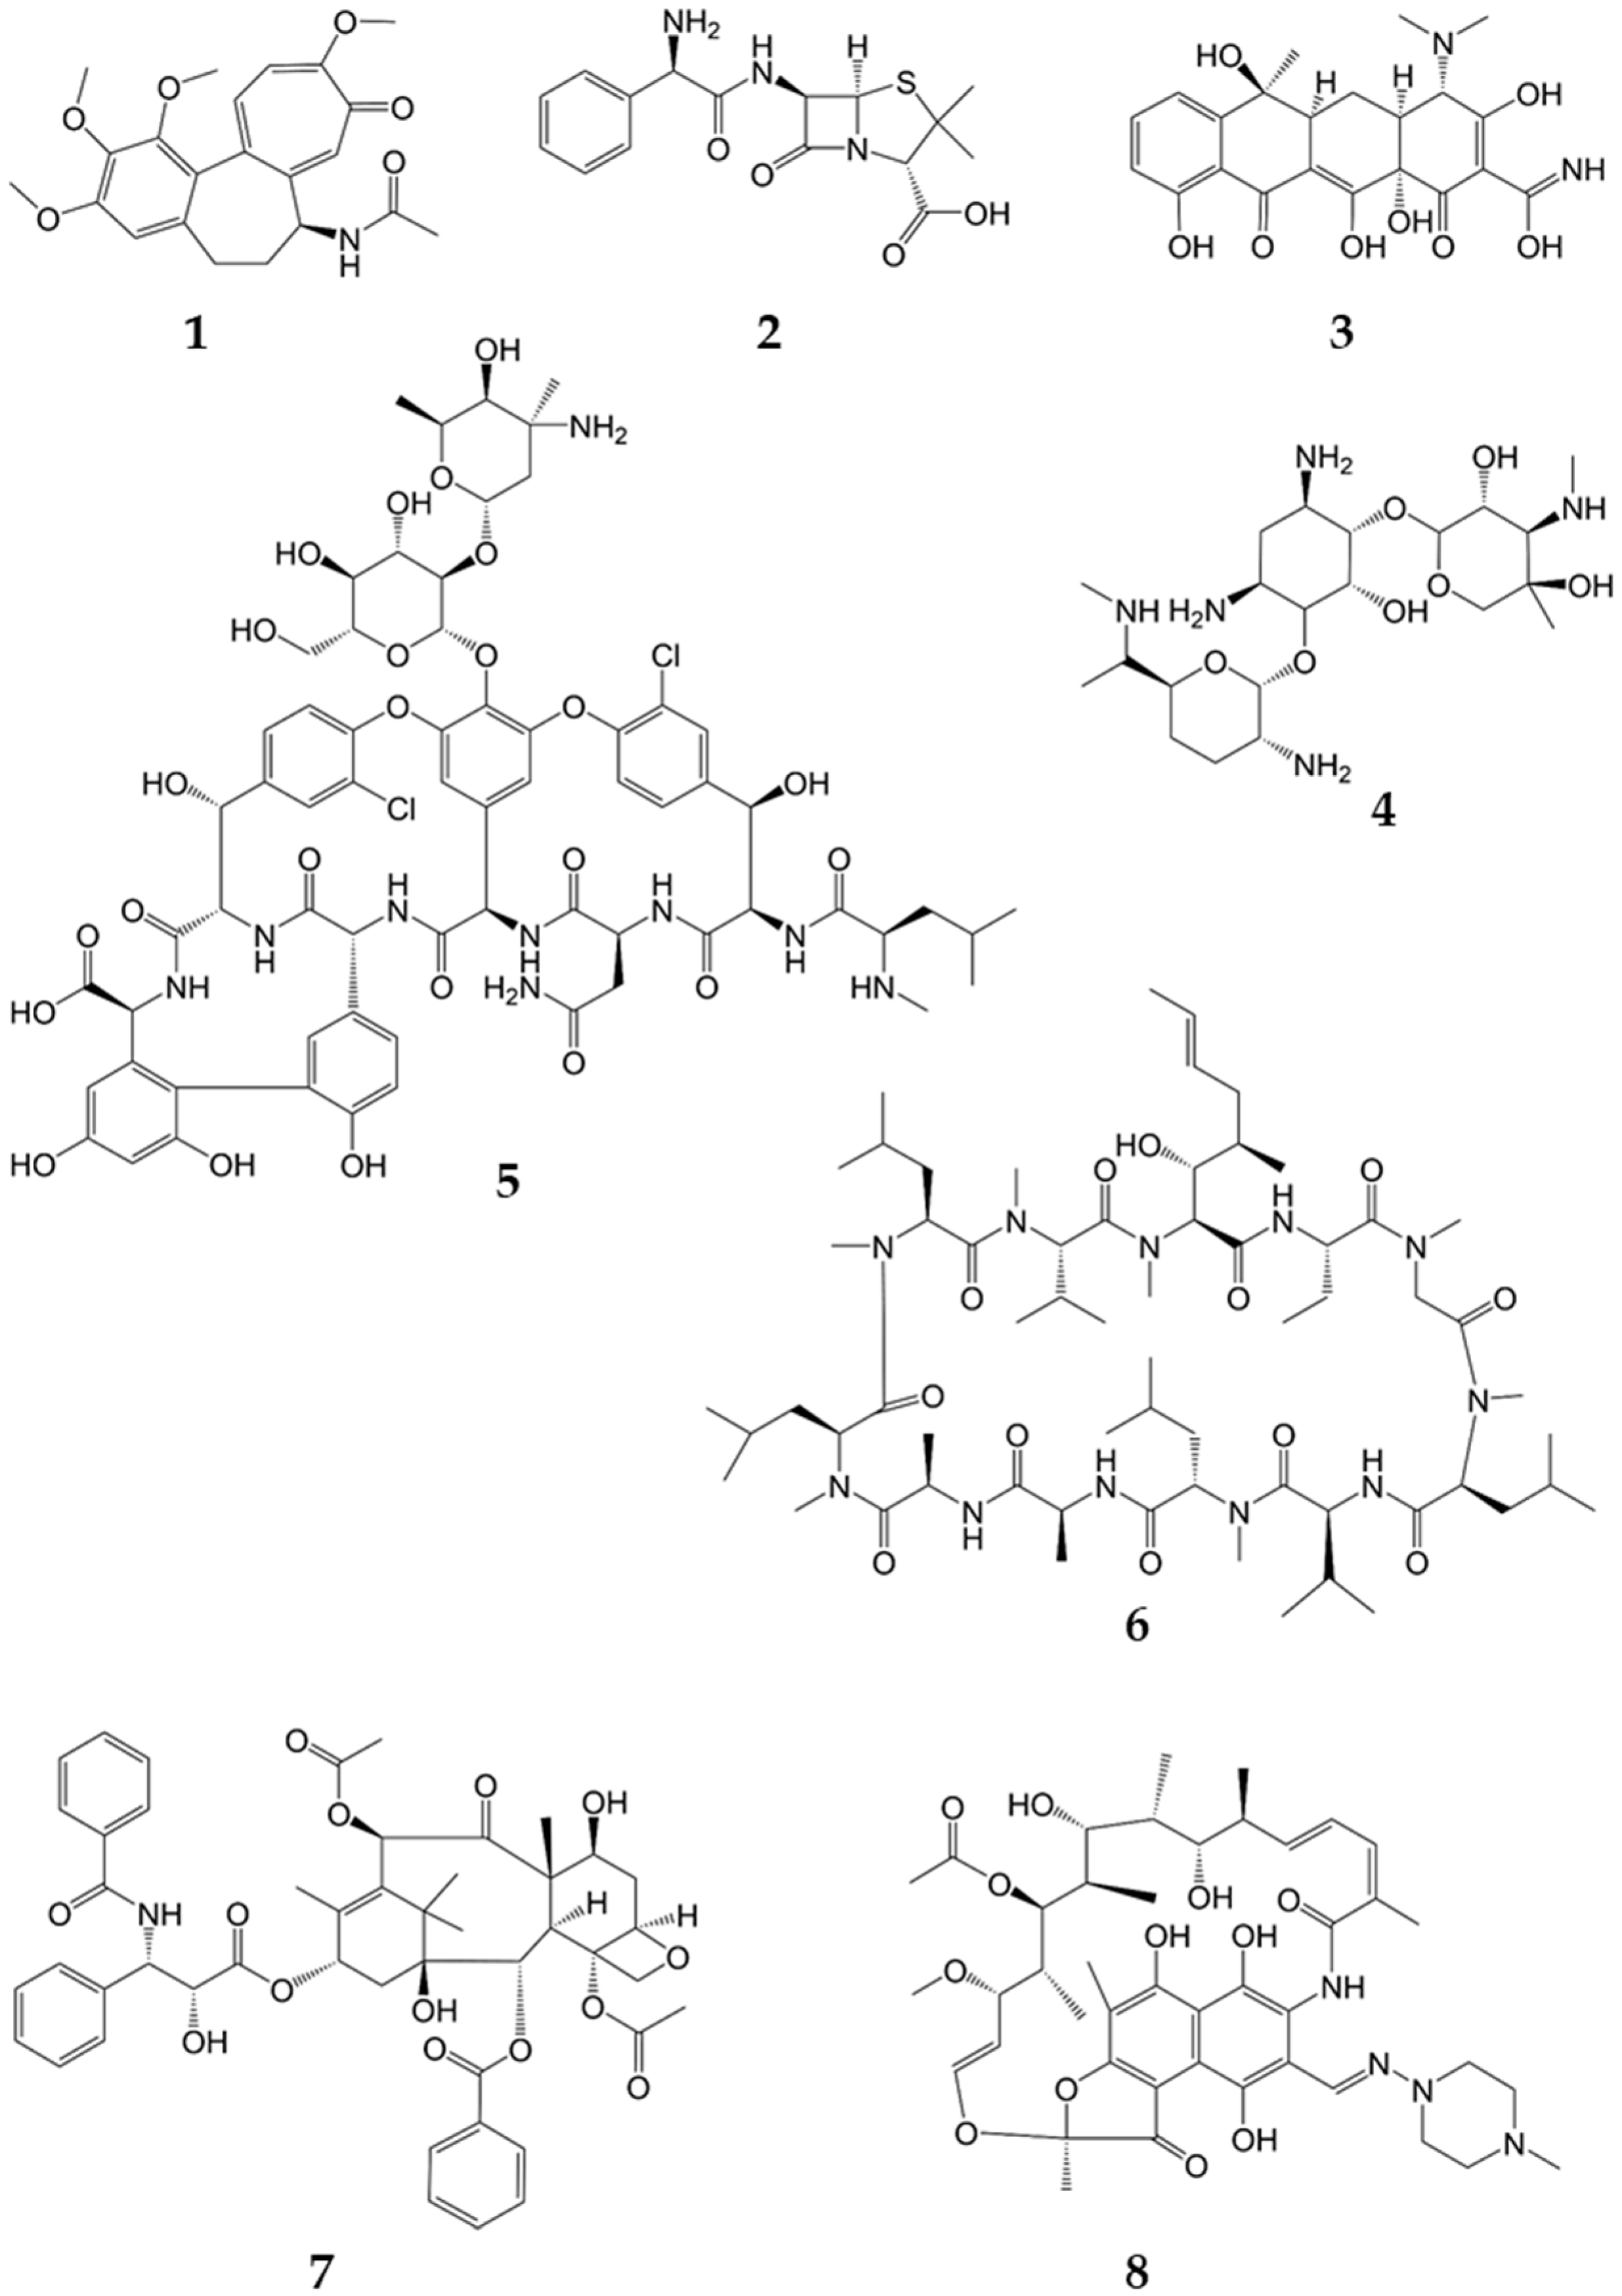
An aliquot of 300 mL of the supernatant was spiked with eight natural products—namely, rifampicin (R3501, Sigma-Aldrich), vancomycin (Sigma-Aldrich), colchicine (C3915, Sigma-Aldrich), cyclosporine (32425, Fluka
®, Honeywell, Charlotte, NC, USA), paclitaxel (86346, Fluka
®, Honeywell), ampicillin (A5354, Sigma-Aldrich) and gentamycin (A2712, Merck, Darmstadt, Germany). The concentrations of the respective natural products are given in
Table 1 (structures in
Figure 1). After the supernatant was spiked, it was thoroughly mixed and split into two samples of 150 mL each. The two samples were processed in parallel; one was extracted using liquid–liquid extraction and one using liquid–solid extraction.
2.2. Extraction
2.2.1. Liquid–Liquid Phase Extraction
For the liquid–liquid phase extraction, the 150 mL sample was extracted three times using 75 mL EtOAc (Sigma-Aldrich) and a separation funnel. The extracts were reduced to dryness at 40 °C under reduced pressure, and the yield was determined gravimetrically.
2.2.2. Liquid–Solid Phase Extraction
For the liquid–solid phase extraction, Diaion® HP-20 (SUPELCO, Sigma-Aldrich) resin was used. An amount of 6.75 g resin was soaked in methanol (MeOH, HiPerSolv, VWR, Radnor, PA, USA) for 30 min for activation and transferred to pH2O to wash out MeOH (~4.5 g resin was used for 100 mL sample or culture). After 20 min of washing in pH2O, the resin was added to the spiked fermentation broth and shaken for 72 h at 10 °C for extraction. The resin was filtered from the sample using a cheese-cloth filter (1057, Dansk Hjemmeproduktion, Ejstrupholm, Denmark) placed on a Büchner funnel and subsequently washed in pH2O. Thereafter the resin was eluted twice using 50 mL MeOH. Extraction was done by eluting the resin in MeOH for 1 h and by subsequently removing the resin by vacuum filtration. The extracts were reduced to dryness at 40 °C under reduced pressure, and the yield was determined gravimetrically.
2.3. Preparation and Extraction of Spiked Water for Quantitative Comparison and Investigation of the pH Effect on Extraction Yields
Stock solutions of tetracycline (10 mg/mL aq.), cyclosporine (10 mg/mL in EtOH), colchicine (5 mg/mL in EtOH) and gentamicin (10 mg/mL aq.) were prepared to spike the five water samples. Five 200 mL samples of pH2O were set to a pH of 4.0, 5.0, 6.0, 7.0 and 8.5, respectively, using 1 M HCl (EMSURE, Merck), 0.3 M NaOH (VWR) and a pH meter (WTW InoLab pH 720, Xylem Inc. Rye Brook, NY, USA) equipped with a SenTix®41 electrode (WTW). The five conditions were spiked with the natural products to reach a final concentration of 10 µg/mL for tetracycline, cyclosporine A and gentamicin and 5 µg/mL for colchicine. Thereafter the five conditions (each 200 mL) were split into two aliquots of 100 mL each for parallel extraction using liquid–liquid phase extraction and liquid–solid phase extraction. For liquid–liquid phase extraction, the 100 mL aliquots were extracted with 100 mL EtOAc using a separation funnel. After shaking the two phases for ~1 min, the funnel was left to rest until the two phases separated properly. The EtOAc fractions were reduced to dryness at 40 °C under reduced pressure. The other aliquot for each water sample for resin or liquid–solid phase extraction was extracted using resin as described above (using ~4.5 g resin/100 mL of sample).
2.4. Analysis of the Extracts
2.4.1. Gravimetrical Analysis
The yields were determined gravimetrically using an analytical balance (Mettler Toledo AB204-S, Mettler Toledo, Columbus, OH, USA).
2.4.2. UHPLC-IMS-MS Analysis
For detection of the compounds, the extracts were re-dissolved in DMSO (Sigma-Aldrich) to a final concentration of 40 mg/mL and diluted 1:4 with 80% MeOH aq. to prepare an injection solution for UHPLC analysis.
For analysis of the presence of the respective natural products, UHPLC-IMS-MS was used. The analytical system consisted of an Acquity I-class UPLC (Waters, Milford, MA, USA) coupled to a PDA detector and a Vion IMS QToF (Waters). The chromatographic separation was performed using an Acquity BEH C18 UPLC column (1.7 µm, 2.1 mm × 100 mm) (Waters). Mobile phases consisted of acetonitrile (HiPerSolv, VWR) for mobile phase B and pH2O produced by the in-house Milli-Q system as mobile phase A, both containing 0.1% formic acid (v/v) (Merck). The gradient was run linearly from 10% to 90% B over 12 min at a flow rate of 0.45 mL/min. Samples were run in ESI+ and ESI− ionization mode. The data were processed and analyzed using UNIFI 1.9.4 (Waters). Stock solutions of the respective natural products were injected as reference for unambiguous identification and to confirm that the compounds were detectable within the analytical setup.
For the quantitative analysis, the extracts were dissolved in 1.0 mL 80% MeOH aq., and a 10-fold dilution with 80% MeOH aq. was prepared for injection. A sample of each of the four stock solutions was diluted to 0.1 mg/mL in 80% MeOH aq. to obtain a reference solution. An amount of 5.0 µL was injected and analyzed using the same UHPLC protocol as above. For the quantification, three injections per sample were made, and the response/ion count of the respective m/z signal of the pseudo-molecular ion was used for quantification. The results were analyzed using GraphPad Prism 8.1.0 for linear regression.
3. Results
3.1. Qualitative Comparison
The EtOAc extraction of the spiked bacterial ferment was done three times with the same spiked sample, and the yield was determined for each of the three extractions individually. The yields for the three extractions were 26.9, 11.7 and 15.0 mg, respectively. The combined yield of the extractions was 53.6 mg (dry weight). The liquid–solid extraction yielded 325.7 mg of extract. The first EtOAc extract and the solid-phase extract were analyzed using UHPLC-IMS-MS and investigated for the presence of the spiked natural products. A small quantity of the stock solutions was injected as reference to determine the retention time and mass spectra for the respective natural products. The extracts were investigated for the presence of the spiked compounds by comparison with the retention time and mass spectra of the references. The results for the qualitative comparison of the extraction methods are given in
Table 2.
When comparing the chromatograms from the liquid–liquid and liquid–solid extractions, it appeared that many more polar metabolites and media components were extracted using the liquid–solid phase extraction compared with the liquid–solid phase extraction.
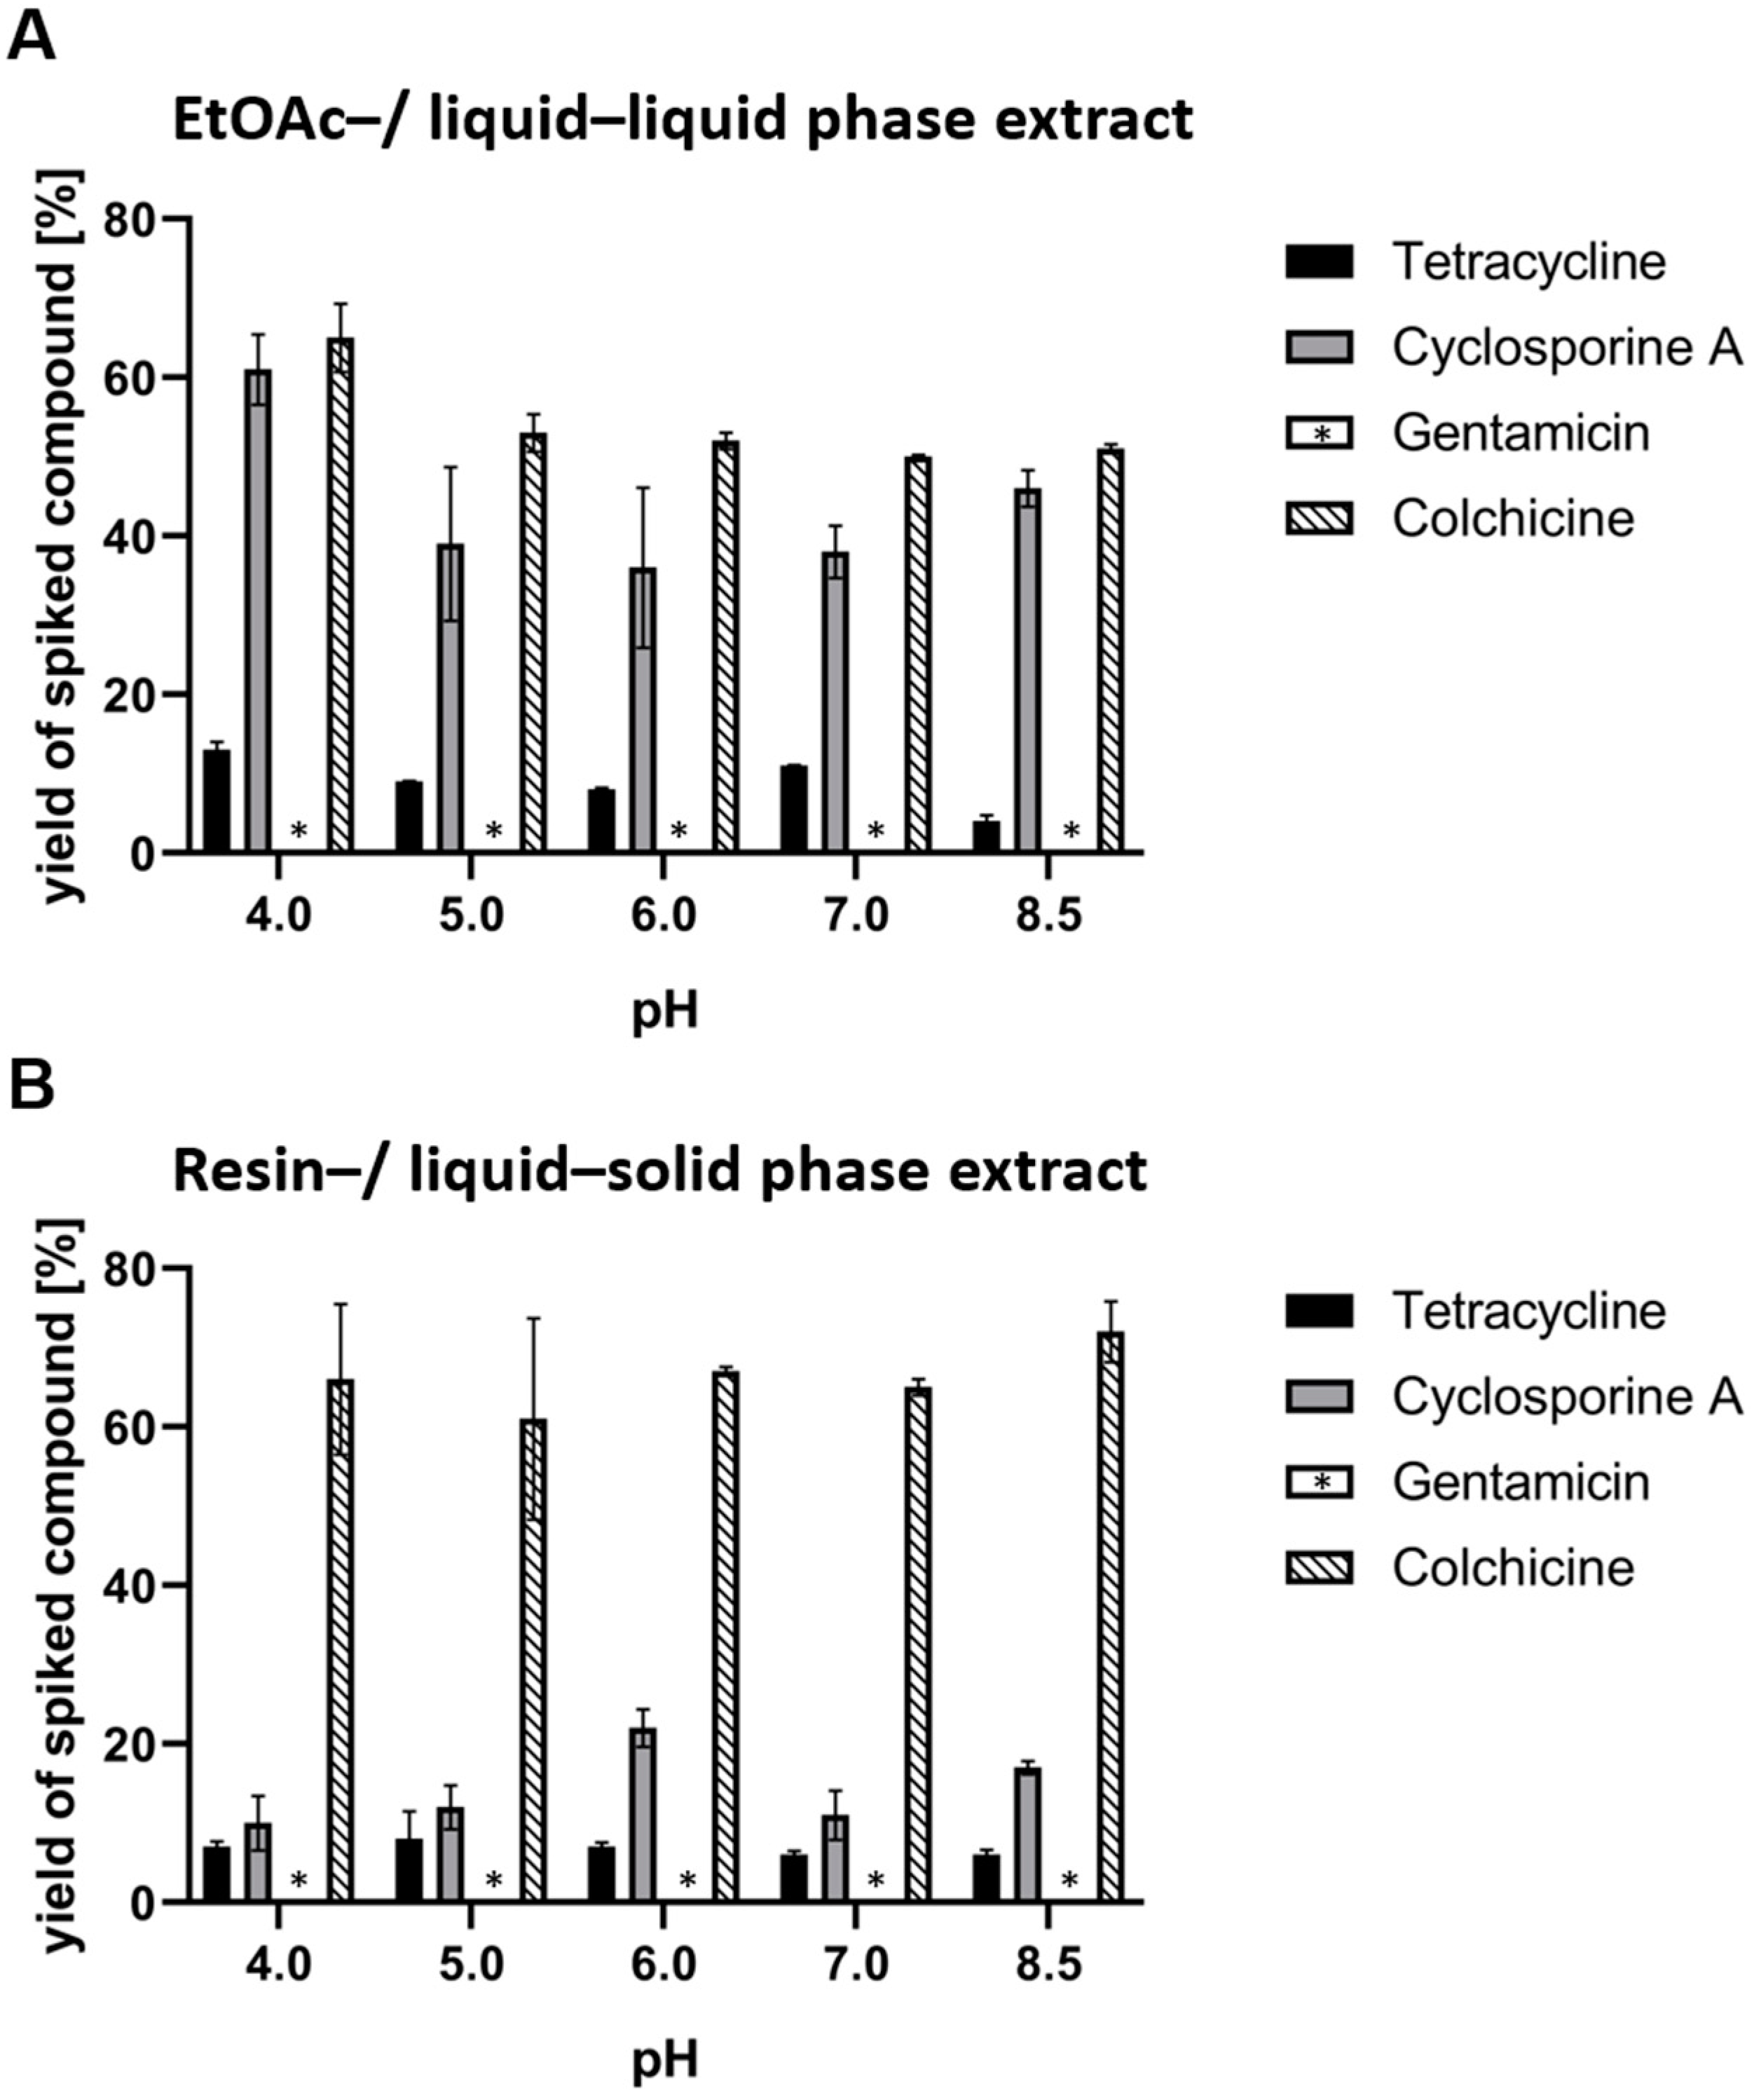
3.2. Quantitative Comparison
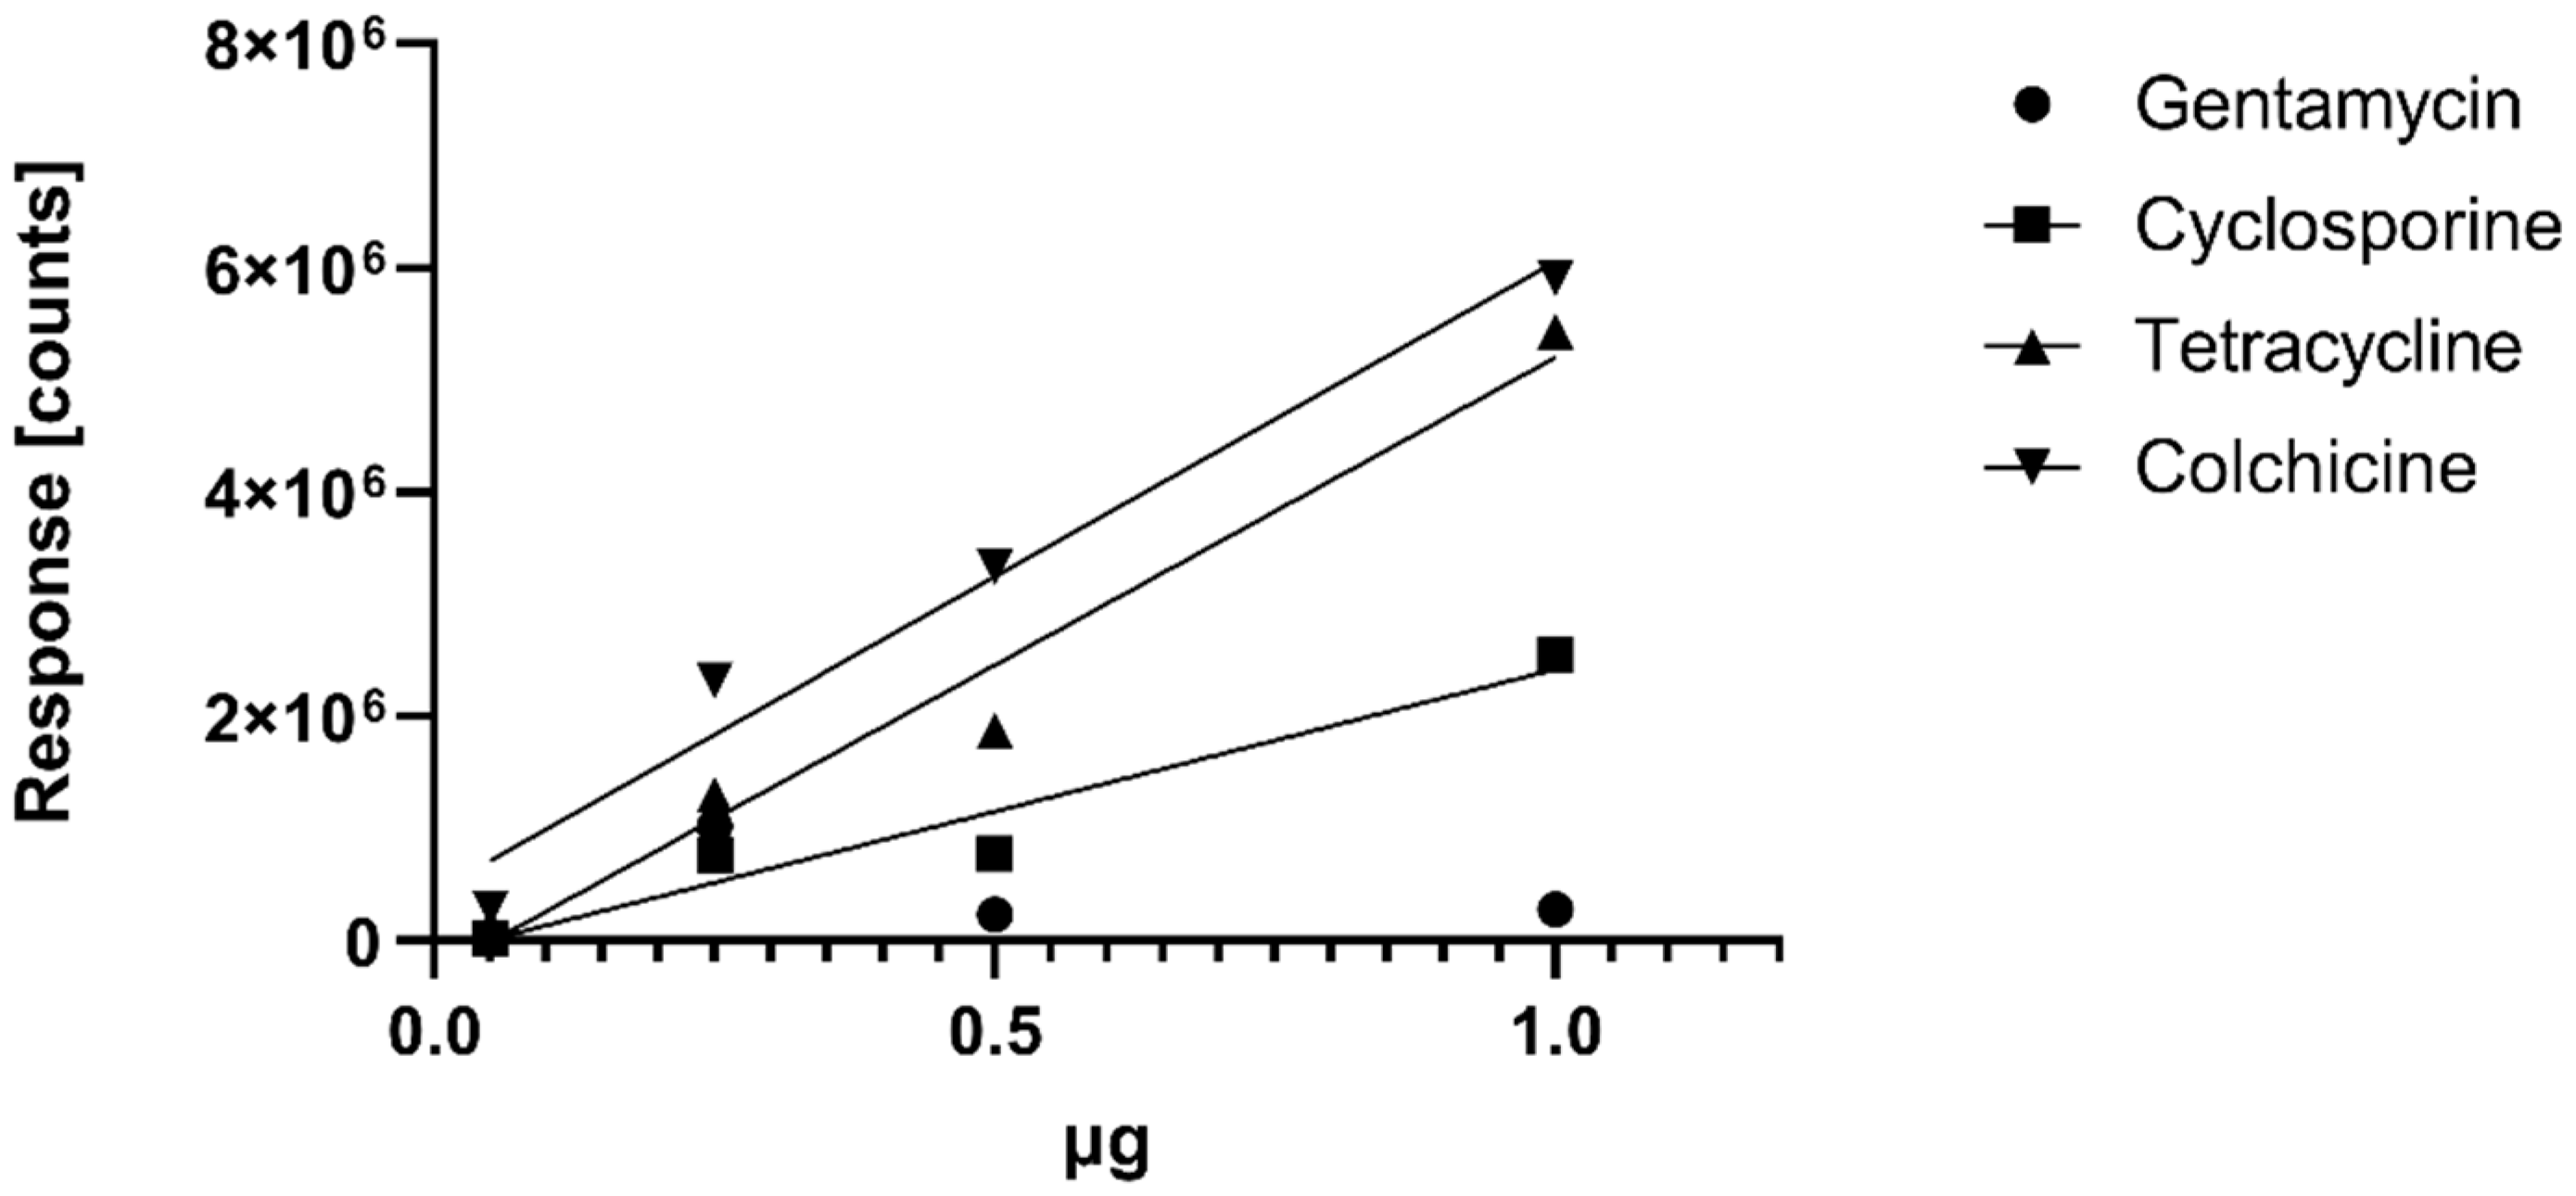
Water samples with pH values of 4.0, 5.0, 6.0, 7.0 and 8.5 were spiked with natural products, and an aliquot of each sample was extracted using EtOAc as well as resin extraction, as described above. For the quantitative comparison, the response of the protonated pseudo-molecular ions of the respective standard injections was used as reference to calculate the concentrations of the respective spike compounds. For determination of a calibration curve, LOQ and LOD, we injected 0.05, 0.25, 0.5 and 1 µg of cyclosporine, gentamycin, colchicine and tetracycline using the analytical protocol described above. We also injected 0.25 µg and 0.05 µg of ampicillin to determine the LOD of ampicillin that was not detected in the qualitative study. The calibration curves are shown in
Figure 2. The LOD for ampicillin was <0.05 µg; LOD for tetracycline, cyclosporine and colchicine was <0.05 µg; LOD for gentamycin was <0.25 µg, and a proper quantification of gentamycin failed (see
Figure 2). We also failed to detect gentamycin at 0.05 µg in negative electrospray. The extracts were dissolved in 1.0 mL of 80% MeOH aq., and the final yields were determined by multiplying the concentration with the volume; the final yields are given in
Appendix A. Relative yields were calculated as ratios of the initial quantity of spike compound in the 100 mL of aqueous solution to be extracted. The relative yields are given in
Figure 3.
4. Discussion
The number of different protocols that can be used for extraction of microbial secondary metabolites is high, and they range from classical liquid–liquid extractions to more sophisticated applications, such as ultrasound assisted extraction and supercritical fluid extraction [
18,
19]. Furthermore, the selection of extraction solvents will have an impact on extracted metabolites, as observed in plant material [
20]. However, we chose the two selected techniques in this investigation because they required no specialized equipment that went beyond the common equipment in a chemical laboratory, and they were widely used. When establishing the biodiscovery pipeline for bioactive secondary metabolites in our laboratory, we were not able to find a direct experimental comparison of the extraction methods using a spike and recovery test. To assess the potential difference of extraction efficacy and to make our data available to others were therefore the main objectives of this study.
5. Conclusions
The liquid–liquid and liquid–solid state methods are comparable when extracting the selected natural products from a microbial fermentation broth or water solutions at different pH levels. Both methods are less suitable for the extraction of polar metabolites. The liquid–liquid extract contains fewer media components, but this method is less suited when extracting larger cultivations due to high consumption of organic solvents.
Author Contributions
Conceptualization, E.H.H., J.H.A. and Y.K.S.; investigation, S.M.J. and Y.K.S.; writing—original draft preparation, Y.K.S.; writing—review and editing, E.H.H. and J.H.A. All authors have read and agreed to the published version of the manuscript.
Funding
Y.K.S. received funding from the Marie Skłodowska-Curie Action MarPipe, grant agreement GA 721421 H2020-MSCA-ITN-2016, of the European Union, and from UiT–The Arctic University of Norway.
Institutional Review Board Statement
Not applicable.
Informed Consent Statement
Not applicable.
Data Availability Statement
Not applicable.
Acknowledgments
Dana Elizabeth Wright (UiT—The Arctic University of Norway) is gratefully acknowledged for proofreading the manuscript.
Conflicts of Interest
The authors declare no conflict of interest.
Appendix A
Table A1.
Table of calculated yields from the quantitative comparison.
Table A1.
Table of calculated yields from the quantitative comparison.
| Calc. Compound Yields in (µg) | EtOAc Extraction | Resin Extraction |
|---|
| pH | 4.0 | 5.0 | 6.0 | 7.0 | 8.5 | 4.0 | 5.0 | 6.0 | 7.0 | 8.5 |
|---|
| Colchicine | 327 | 267 | 260 | 251 | 254 | 332 | 303 | 338 | 325 | 359 |
| Cyclosporine | 607 | 389 | 362 | 383 | 461 | 97 | 118 | 220 | 112 | 171 |
| Tetracycline | 134 | 88 | 78 | 106 | 44 | 70 | 77 | 69 | 58 | 59 |
| Gentamycin | - | - | - | - | - | - | - | - | - | - |
References
- Newman, D.J.; Cragg, G.M. Natural products as sources of new drugs over the nearly four decades from 01/1981 to 09/2019. J. Nat. Prod. 2020, 83, 770–803. [Google Scholar] [CrossRef]
- Rosén, J.; Gottfries, J.; Muresan, S.; Backlund, A.; Oprea, T. Novel Chemical Space Exploration via Natural Products. J. Med. Chem. 2009, 52, 1953–1962. [Google Scholar] [CrossRef] [PubMed] [Green Version]
- Ganesan, A. The impact of natural products upon modern drug discovery. Curr. Opin. Chem. Biol. 2008, 12, 306–317. [Google Scholar] [CrossRef] [PubMed]
- Pham, J.V.; Yilma, M.A.; Feliz, A.; Majid, M.T.; Maffetone, N.; Walker, J.R.; Kim, E.; Cho, H.J.; Reynolds, J.M.; Song, M.C.; et al. A Review of the Microbial Production of Bioactive Natural Products and Biologics. Front. Microbiol. 2019, 10, 1404. [Google Scholar] [CrossRef] [Green Version]
- Wagenaar, M.M. Pre-fractionated Microbial Samples—The Second Generation Natural Products Library at Wyeth. Molecules 2008, 13, 1406–1426. [Google Scholar] [CrossRef] [Green Version]
- Grkovic, T.; Akee, R.K.; Thornburg, C.C.; Trinh, S.K.; Britt, J.R.; Harris, M.J.; Evans, J.R.; Kang, U.; Ensel, S.; Henrich, C.J.; et al. National Cancer Institute (NCI) Program for Natural Products Discovery: Rapid Isolation and Identification of Biologically Active Natural Products from the NCI Prefractionated Library. ACS Chem. Biol. 2020, 15, 1104–1114. [Google Scholar] [CrossRef] [PubMed] [Green Version]
- Cordell, G.A.; Shin, Y.G. Finding the needle in the haystack. The dereplication of natural product extracts. Pure Appl. Chem. 1999, 71, 1089–1094. [Google Scholar] [CrossRef] [Green Version]
- Ito, T.; Masubuchi, M. Dereplication of microbial extracts and related analytical technologies. J. Antibiot. 2014, 67, 353–360. [Google Scholar] [CrossRef]
- Sashidhara, K.V.; Rosaiah, J.N. Various Dereplication Strategies Using LC-MS for Rapid Natural Product Lead Identification and Drug Discovery. Nat. Prod. Commun. 2007, 2, 193–202. [Google Scholar] [CrossRef]
- Zou, Y.; Yin, H.; Kong, D.; Deng, Z.; Lin, S. ATrans-Acting Ketoreductase in Biosynthesis of a Symmetric Polyketide Dimer SIA7248. Chembiochem Eur. J. Chem. Biol. 2013, 14, 679–683. [Google Scholar] [CrossRef]
- Schneider, Y.K.-H.; Hansen, K.Ø.; Isaksson, J.; Ullsten, S.; Hansen, E.H.; Hammer Andersen, J. Anti-Bacterial Effect and Cytotoxicity Assessment of Lipid 430 Isolated from Algibacter sp. Molecules 2019, 24, 3991. [Google Scholar] [CrossRef] [PubMed] [Green Version]
- Schneider, Y.; Jenssen, M.; Isaksson, J.; Hansen, K.; Andersen, J.; Hansen, E. Bioactivity of Serratiochelin A, a Siderophore Isolated from a Co-Culture of Serratia sp. and Shewanella sp. Microorganisms 2020, 8, 1042. [Google Scholar] [CrossRef]
- Hayashida-Soiza, G.; Uchida, A.; Mori, N.; Kuwahara, Y.; Ishida, Y. Purification and characterization of antibacterial substances produced by a marine bacterium Pseudoalteromonas haloplanktisstrain. J. Appl. Microbiol. 2008, 105, 1672–1677. [Google Scholar] [CrossRef]
- Wietz, M.; Månsson, M.; Bowman, J.S.; Blom, N.S.; Ng, Y.; Gram, L. Wide Distribution of Closely Related, Antibiotic-Producing Arthrobacter Strains throughout the Arctic Ocean. Appl. Environ. Microbiol. 2012, 78, 2039–2042. [Google Scholar] [CrossRef] [Green Version]
- Pinu, F.R.; Villas-Boas, S.G.; Aggio, R. Analysis of Intracellular Metabolites from Microorganisms: Quenching and Extraction Protocols. Metabolites 2017, 7, 53. [Google Scholar] [CrossRef] [PubMed] [Green Version]
- Sturini, M.; Speltini, A.; Pretali, L.; Fasani, E.; Profumo, A. Solid-phase extraction and HPLC determination of fluoroquinolones in surface waters. J. Sep. Sci. 2009, 32, 3020–3028. [Google Scholar] [CrossRef] [PubMed]
- Xu, J.; Zhu, L.-Y.; Shen, H.; Zhang, H.-M.; Jia, X.-B.; Yan, R.; Li, S.-L.; Xu, H.-X. A critical view on spike recovery for accuracy evaluation of analytical method for medicinal herbs. J. Pharm. Biomed. Anal. 2012, 62, 210–215. [Google Scholar] [CrossRef]
- Grosso, C.; Valentão, P.; Ferreres, F.; Andrade, P.B. Alternative and Efficient Extraction Methods for Marine-Derived Compounds. Mar. Drugs 2015, 13, 3182–3230. [Google Scholar] [CrossRef] [PubMed] [Green Version]
- Baldino, L.; Scognamiglio, M.; Reverchon, E. Supercritical fluid technologies applied to the extraction of compounds of industrial interest from Cannabis sativa L. and to their pharmaceutical formulations: A review. J. Supercrit. Fluids 2020, 165, 104960. [Google Scholar] [CrossRef]
- Pintać, D.; Majkić, T.; Torovic, L.; Orčić, D.; Beara, I.; Simin, N.; Mimica-Dukić, N.; Lesjak, M. Solvent selection for efficient extraction of bioactive compounds from grape pomace. Ind. Crop. Prod. 2018, 111, 379–390. [Google Scholar] [CrossRef]
- Hedrich, S.; Schippers, A. Distribution of Acidophilic Microorganisms in Natural and Man-made Acidic Environments. Curr. Issues Mol. Biol. 2021, 40, 25–48. [Google Scholar] [CrossRef] [PubMed] [Green Version]
- Ding, Z.-G.; Li, M.-G.; Zhao, J.-Y.; Ren, J.; Huang, R.; Xie, M.-J.; Cui, X.-L.; Zhu, H.-J.; Wen, M.-L. Naphthospironone A: An Unprecedented and Highly Functionalized Polycyclic Metabolite from an Alkaline Mine Waste Extremophile. Chem.-A Eur. J. 2010, 16, 3902–3905. [Google Scholar] [CrossRef] [PubMed]
| Publisher’s Note: MDPI stays neutral with regard to jurisdictional claims in published maps and institutional affiliations. |
© 2021 by the authors. Licensee MDPI, Basel, Switzerland. This article is an open access article distributed under the terms and conditions of the Creative Commons Attribution (CC BY) license (https://creativecommons.org/licenses/by/4.0/).


