Article

Testing a Single-Case Experimental Design to Study Dynamic Light Exposure in People with Dementia Living at Home

by
Ellen van Lieshout-van Dal
1,2,*,
Liselore Snaphaan
1,2,
Samantha Bouwmeester
2,
Yvonne de Kort
3 and
Inge Bongers
1,2
1
Mental Health Care Institute Eindhoven (GGzE), 5626 ND Eindhoven, The Netherlands
2
Tranzo, School of Social and Behavioural Science, Tilburg University, 5037 DB Tilburg, The Netherlands
3
Department of Industrial Engineering and Innovation Sciences, Eindhoven University of Technology, 5600 MB Eindhoven, The Netherlands
*
Author to whom correspondence should be addressed.
Appl. Sci. 2021, 11(21), 10221; https://doi.org/10.3390/app112110221
Submission received: 8 September 2021 / Revised: 20 October 2021 / Accepted: 25 October 2021 / Published: 1 November 2021
(This article belongs to the Special Issue Advances in Human-Centric Lighting)

Abstract

:
Most people with dementia live at home supported by informal caregivers, but disturbed sleep patterns may induce a heavy burden of care. The beneficial effects of bright light on their sleep, health, and well-being have been demonstrated in clinical settings, but not in a home situation. We evaluated a dynamic lighting system in a real-life longitudinal single-case experimental design (SCED) with people with dementia living at home. Eleven people with dementia and their informal caregivers were included in this study with four 4-week periods of alternating exposure and nonexposure in an introduction–withdrawal setup (ABAB). Objective light exposure data were collected and analyzed. The used study design seems applicable for this population and suitable for home use. Participant dropout did occur, but was due to health conditions rather than participant burden. The lighting system led to more light in the homes of the participants, as well as to higher actual individual light exposures, although the latter increased only moderately and not consistently across all participants, seasons, and times of day. The participants appreciated the lighting system even after 6 months. We reflect on individual differences, seasonal and daypart influences, and differential light effects. Recommendations and lessons learned are discussed.

1. Introduction

Due to age-related changes in the eye, ageing comes with an increasing demand for higher light levels that support good vision and help synchronize one’s biological clock [1,2,3]. Extra bright light is needed for daily activities and to prevent people from falling. In addition, exposure to daylight or artificial light at the right time of day is a strong and crucial cue for synchronizing the biological clock. This biological clock plays an important role in the timing and coordination of physiological and psychological processes with a circadian (24 h) rhythm, including our sleep–wake rhythm and well-being. Dementia can disturb the biological clock more strongly compared with healthy ageing, which is especially problematic during the darker seasons, such as fall and winter [4]. This can result in the manifestation of symptoms, such as nightly wandering, restlessness, and agitation [5,6]. These symptoms form a high burden for informal caregivers (e.g., spouses, children, and relatives) and are the main reasons for institutionalization. In fact, the prevalence of these symptoms increases the chances of institutionalization by 10 times [7,8]. Because of their ageing eyes and their neural deterioration, persons with dementia would substantially benefit from extra bright light exposure in their home environment. Daylight is a natural source of well-timed and very bright light, yet indoor daylight entrance is limited and persons with dementia tend to spend less time outside than people without dementia [9]. Spending significantly less time outside causes further understimulation of their biological clock, and this increases the risk of loss of healthy circadian entrainment [8,9,10,11,12].
Daylight naturally offers contrasting light and dark conditions over the 24 h day that our biological clock requires for healthy entrainment. The exact natural light dynamics are, of course, dependent on geographical location, time of day, and season. The illuminance and spectral composition of natural light are additionally influenced by weather conditions, such as haze and overcast [13,14]. In addition, there are indications that, depending on the time of day and the individual’s affective and/or mental state, different lighting conditions across the day are needed to optimally support human functioning [15,16]. Particularly for persons who have older eyes, a diminished functioning of the internal clock, and who receive little direct exposure to daylight, dynamic artificial lighting that mimics the natural rhythm of night and day may stimulate physical and mental health and generate a positive experience. As the biological system is differentially sensitive to different wavelengths, dynamics in both light intensity and the light spectrum have an impact on physiological and psychological processes in the human body [17,18].
In recent years, the use of dynamic lighting for people with dementia has become increasingly popular, and several care facilities have purchased dynamic lighting with the intention of improving the well-being and day–night rhythm of persons with dementia. However, these lighting systems are in most cases not suitable for people with dementia still living at home, mostly due to the purchase and installation costs and practical implications, such as actual usability and the personal preferences of people with dementia and their caregivers [10,19]. Moreover, older adults best appreciate a lighting intensity level around 1000 lx, and due to age-related macular degeneration, their eyes are more sensitive to direct and, therefore, indirect light; thus lighting in which the light emitted by a source is diffusely reflected is often more appreciated [20,21]. Standard light therapy boxes are therefore unsuitable for people with dementia as these offer direct light of very high intensity illuminance levels (lx) and, sometimes, of high correlated color temperature (CCT).
Previous studies have demonstrated the beneficial effects of bright or dynamic light exposure on the sleep quality cognition and well-being of persons with dementia [22,23,24,25]. Most studies on this subject have, however, been performed in nursing and care homes. Studies focusing on persons with dementia still living at home are extremely scarce [21,26,27]. Kinnunen [27] concluded in a review article on interventions for people with dementia at home that light therapy is a promising strategy to alleviate the circadian disturbances and improve the well-being of people with dementia. It is important to note, though, that these studies used a variety of light therapy approaches and do not always report explicitly how the light doses received by the participants were measured or monitored. As Figueiro et al. [21] concluded, it is one of the biggest future challenges to find a suitable and practical method for effectively delivering brighter daytime light to the eyes of people with dementia still living at home.
It is difficult to conduct light research on people with dementia living at home because of the heterogeneous population, living circumstances, diffuse nature of the disease, and practical objections, such as being proficient in the use of devices. In addition, to measure the effect of a lighting intervention, participants need to be followed over a long period of time. A longitudinal study design is difficult—in this population—and many variables may influence data collection. For example, a recent field investigation in an office context demonstrated that light interventions may be far less effective than hoped in terms of increasing personal light exposure, and that this effectiveness is substantially influenced by contextual and behavioral factors [28]. It is therefore essential to take into account the individual user and his or her context. The individual characteristics, living situation, and dementia stage may all play a role in the practical feasibility of implementing light innovations in a home situation. Randomized placebo-controlled trials (RCTs) are still considered the gold standard in medical research, but naturally, they also have limitations. RCTs have strong internal validity, but their external validity often remains inadequate. The generalization of findings outside of the study group is, by no means, always justified. There is little “real-life evidence”, and the transition from group evidence to evidence relevant to the treatment of individuals cannot be made. There is no focus within an RCT on the influence of individual patient characteristics, and a heterogeneous group, such as patients with dementia, is hard to study properly using this design. A disadvantage of other study designs, however, is that without randomization in daily practice, it is difficult to reliably link positive effects to an intervention. In addition, researchers would like to be able to compare new interventions with existing ones.
Field studies on dementia are challenging. However, to determine what functional specifications an innovation requires to support patients with dementia and to find out in practice whether this system is experienced as effective, real-life or field studies are necessary and valuable. In several real-life studies [20,25,28,29,30,31,32,33,34,35,36,37,38,39], caregivers of patients with dementia have pointed out the need for support. Technological systems could be a solution to the problems they encounter, such as getting lost and wandering behavior at night due to circadian disruption. It seems that patients who are in an early stage of dementia would profit the most from these technological devices [33,34,35,36].
Therefore, in the current study a real-life single-case experimental design (SCED) was chosen in which the results were analyzed by randomization testing. In doing so, a combination of the advantages of an RCT and the advantages of a real-life field study was attempted. The ecological validity of this study design is high as lessons are learned and shared in the design of a sustainable research protocol. It is necessary to evaluate whether the applied SCED and the methods of data collection and data analysis are applicable for measuring the effect of dynamic lighting on people with dementia living at home.
The current study served two primary research aims: First, we tested whether the used study protocol is applicable and feasible, and by reporting our lessons learned, we aim to provide recommendations for developing a suitable measurement protocol to investigate light interventions for home use. Second, we investigated whether people with dementia living at home would be exposed to substantially brighter light when the dynamic lighting system was present in their home compared with regular lighting. Due to various external factors, such as participants not spending a whole day sitting under a lighting system and participants going outside into daylight during the intervention condition, whether a relatively limited set of off-the-shelf luminaires would result in a measurably different exposure is a relevant question. In addition, we explored differences in light exposure at different dayparts and assessed whether differences were moderated by season. Finally, the subjective experience of the participants on the light system was evaluated.

2. Materials and Methods

2.1. Design

A longitudinal study was performed among people suffering from dementia living at home to measure the effectiveness of a dynamic light intervention on persons’ personal light exposure. A SCED design was used [31,32,33,34] to include individual differences, such as living situation, phase, and progression of dementia. The results were evaluated at both the individual and group levels.
In SCEDs, patients are followed by means of repeated measurements during a baseline and an intervention phase and, as such, provide insight into the effects of an intervention [29,30,31]. In this study, a repeated introduction–withdrawal A1B1A2B2 design was used to evaluate (1) differences in the light supply in the A1 vs. B1 conditions, (2) the reversal effect of the removal of the lighting system during A2, and (3) light differences of the reintroduction during phase B2.
If a significant difference in lighting conditions was present in the first exposure condition (A1 vs. B1), this effect was expected again in the second exposure condition (A2 vs. B2), indicating a strong effect of the intervention. To minimize carry-over effects, the first 2 weeks of each condition were marked as washout and adjustment periods, and only the last week (4th week) was used for data collection [35,36].

2.2. Participants

Thirteen participants and their informal caregivers (n = 13) received information about the research project and were willing to participate. Written informed consent was obtained from all the participants and their caregivers. One couple decided to stop before data collection started, and 1 couple decided to stop on the 1st week of data collection due to changes in their health conditions (pp06). Therefore, the total sample size of this study was 11 participants. One participant, pp11, completed two of the four phases and decided not to complete the other two phases due to sudden deterioration of the condition, which required full attention. We obtained complete data of four phases of 10 participants. The participants were recruited by formal caregivers of the Innovate Dementia network [37] and through posts via social media and Alzheimer Café meetings in the Netherlands within the period of September 2019 to June 2020. The study protocol was approved (23 April 2015) by the Institutional Review Board of the mental health care institute Eindhoven (GGzE) and by the Medical Ethics Committee (METC) of Noord-Brabant (29 August 2018, P1826), the Netherlands. Both participants and their informal caregivers signed a written informed consent form, in accordance with the Declaration of Helsinki (Seoul Revision, 2008) [38] and the General Data Protection Regulation (AVG; www.eugdpr.org) (as applied in 2018).
The inclusion criteria for the study were: (1) having a primary diagnosis of dementia, diagnosed by a geriatrician, neurologist, or psychiatrist, based on the criteria of the Diagnostic and Statistical Manual of Mental Disorders, Fifth Edition (DSM-V) [39]; (2) living in a home situation; (3) having sleeping problems based on the Neuropsychiatric Inventory Questionnaire; (4) having sufficient cognitive ability to participate in this study, a score of 24 or above on the Mini-Mental State Exam (MMSE), and being mentally competent to decide for themselves to participate; (5) no visual disabilities or wheelchair dependence; and (6) having an actively involved informal caregiver who frequently checks the well-being of the participant. Patients were excluded from the study if any other neurological disorders or a serious eye disease, such as retinitis pigmentosa, was diagnosed, which makes light intervention incompatible.
As Table 1 shows, the study population included 11 participants (5 women and 6 men) with a mean age of 78.1 years. The mean score on the Mini-Mental State Exam (MMSE), a questionnaire to measure cognitive impairment, was 24.6. A score below 24 can indicate mild to severe cognitive impairment and possible mental incompetence to participate in the study. For 8 participants, the informal caregiver was their spouse, while for the other 3 participants, it was their daughter (in-law). The mean age of the informal caregivers was 68.2 years. Eight participants were diagnosed with Alzheimer’s dementia, 2 participants with Lewy body dementia, and 1 participant with frontotemporal dementia. All the participants experienced sleeping problems.

2.3. Procedure

A transportable dynamic lighting system was used in our study, which was designed for the home setting. It consisted of three high-intensity lamps that exposed people to indirect and direct dynamic light in their own home. The lighting system roughly follows a strong daylight curve in intensity, with an extra strong contribution of shorter wavelengths in the morning and lower contribution in the evening, as this is hypothesized to optimally support a healthy circadian rhythm (e.g., [40]). We placed one lamp in the living room, one in the kitchen, and one in the bedroom of the participants. As different kinds of light may have differential effects on people, we distinguished between light intensity (lx) and correlated color temperature (CCT; the color appearance of white LEDs). Where full spectral data were available, we also reported the melanopic equivalent daylight intensity (EDI), given its relevance to the circadian effects of light. In addition, we explored whether there were differences in light exposure at different dayparts (morning, afternoon, and evening) in the control and test conditions. We also assessed whether differences were moderated by season: the dynamic lighting system might be more appropriate in darker seasons (i.e., fall and winter) than in seasons with more natural light as is often the case in spring and summer.
To prevent the participants from adjusting the offered lighting scenario, a timer switch was connected to all the three systems, which enabled the systems to turn on and off in a program tailored to their preferred day rhythm. The light switches on the lamps were covered so that the participants could not turn them on and off themselves. The SCED design enables the incorporation of personal preferences. Personal lighting scenarios were programmed, and the researcher installed the app on a smartphone or tablet and provided the participant instructions on how to use the app. The participants received a wearable light sensor button that was connected to the app and needed to be placed as close to the eyes as possible, usually on the collar. Each condition lasted 4 weeks. The dynamic lighting system was removed from the home during the regular lighting condition. On the last week of every condition, the participants wore the light sensor button from the moment they woke up until the moment they went to bed. The charger of the light sensor was placed on the bedside table. Both the caregivers and participants received the instructions of the study protocol at the same time. During the study, a help desk was offered to resolve technical problems with the lighting system or light sensors. In consultation with the informal caregivers, manual control of the lighting system was disabled. The lighting system was stable and solid, and damage and destruction did not take place.
Immediately after finishing the study, the users were asked questions about their experiences in their participation and the study protocol. The subjective experiences of the people were evaluated, as their (positive) experiences will ultimately determine the usefulness of the lighting system. Six months after finishing the study, the users were asked via an evaluation form to answer questions about whether they experienced the lighting system as pleasant, disturbing, or too bright; if they believed it had had an impact on their health; and if they would recommend or purchase the system.

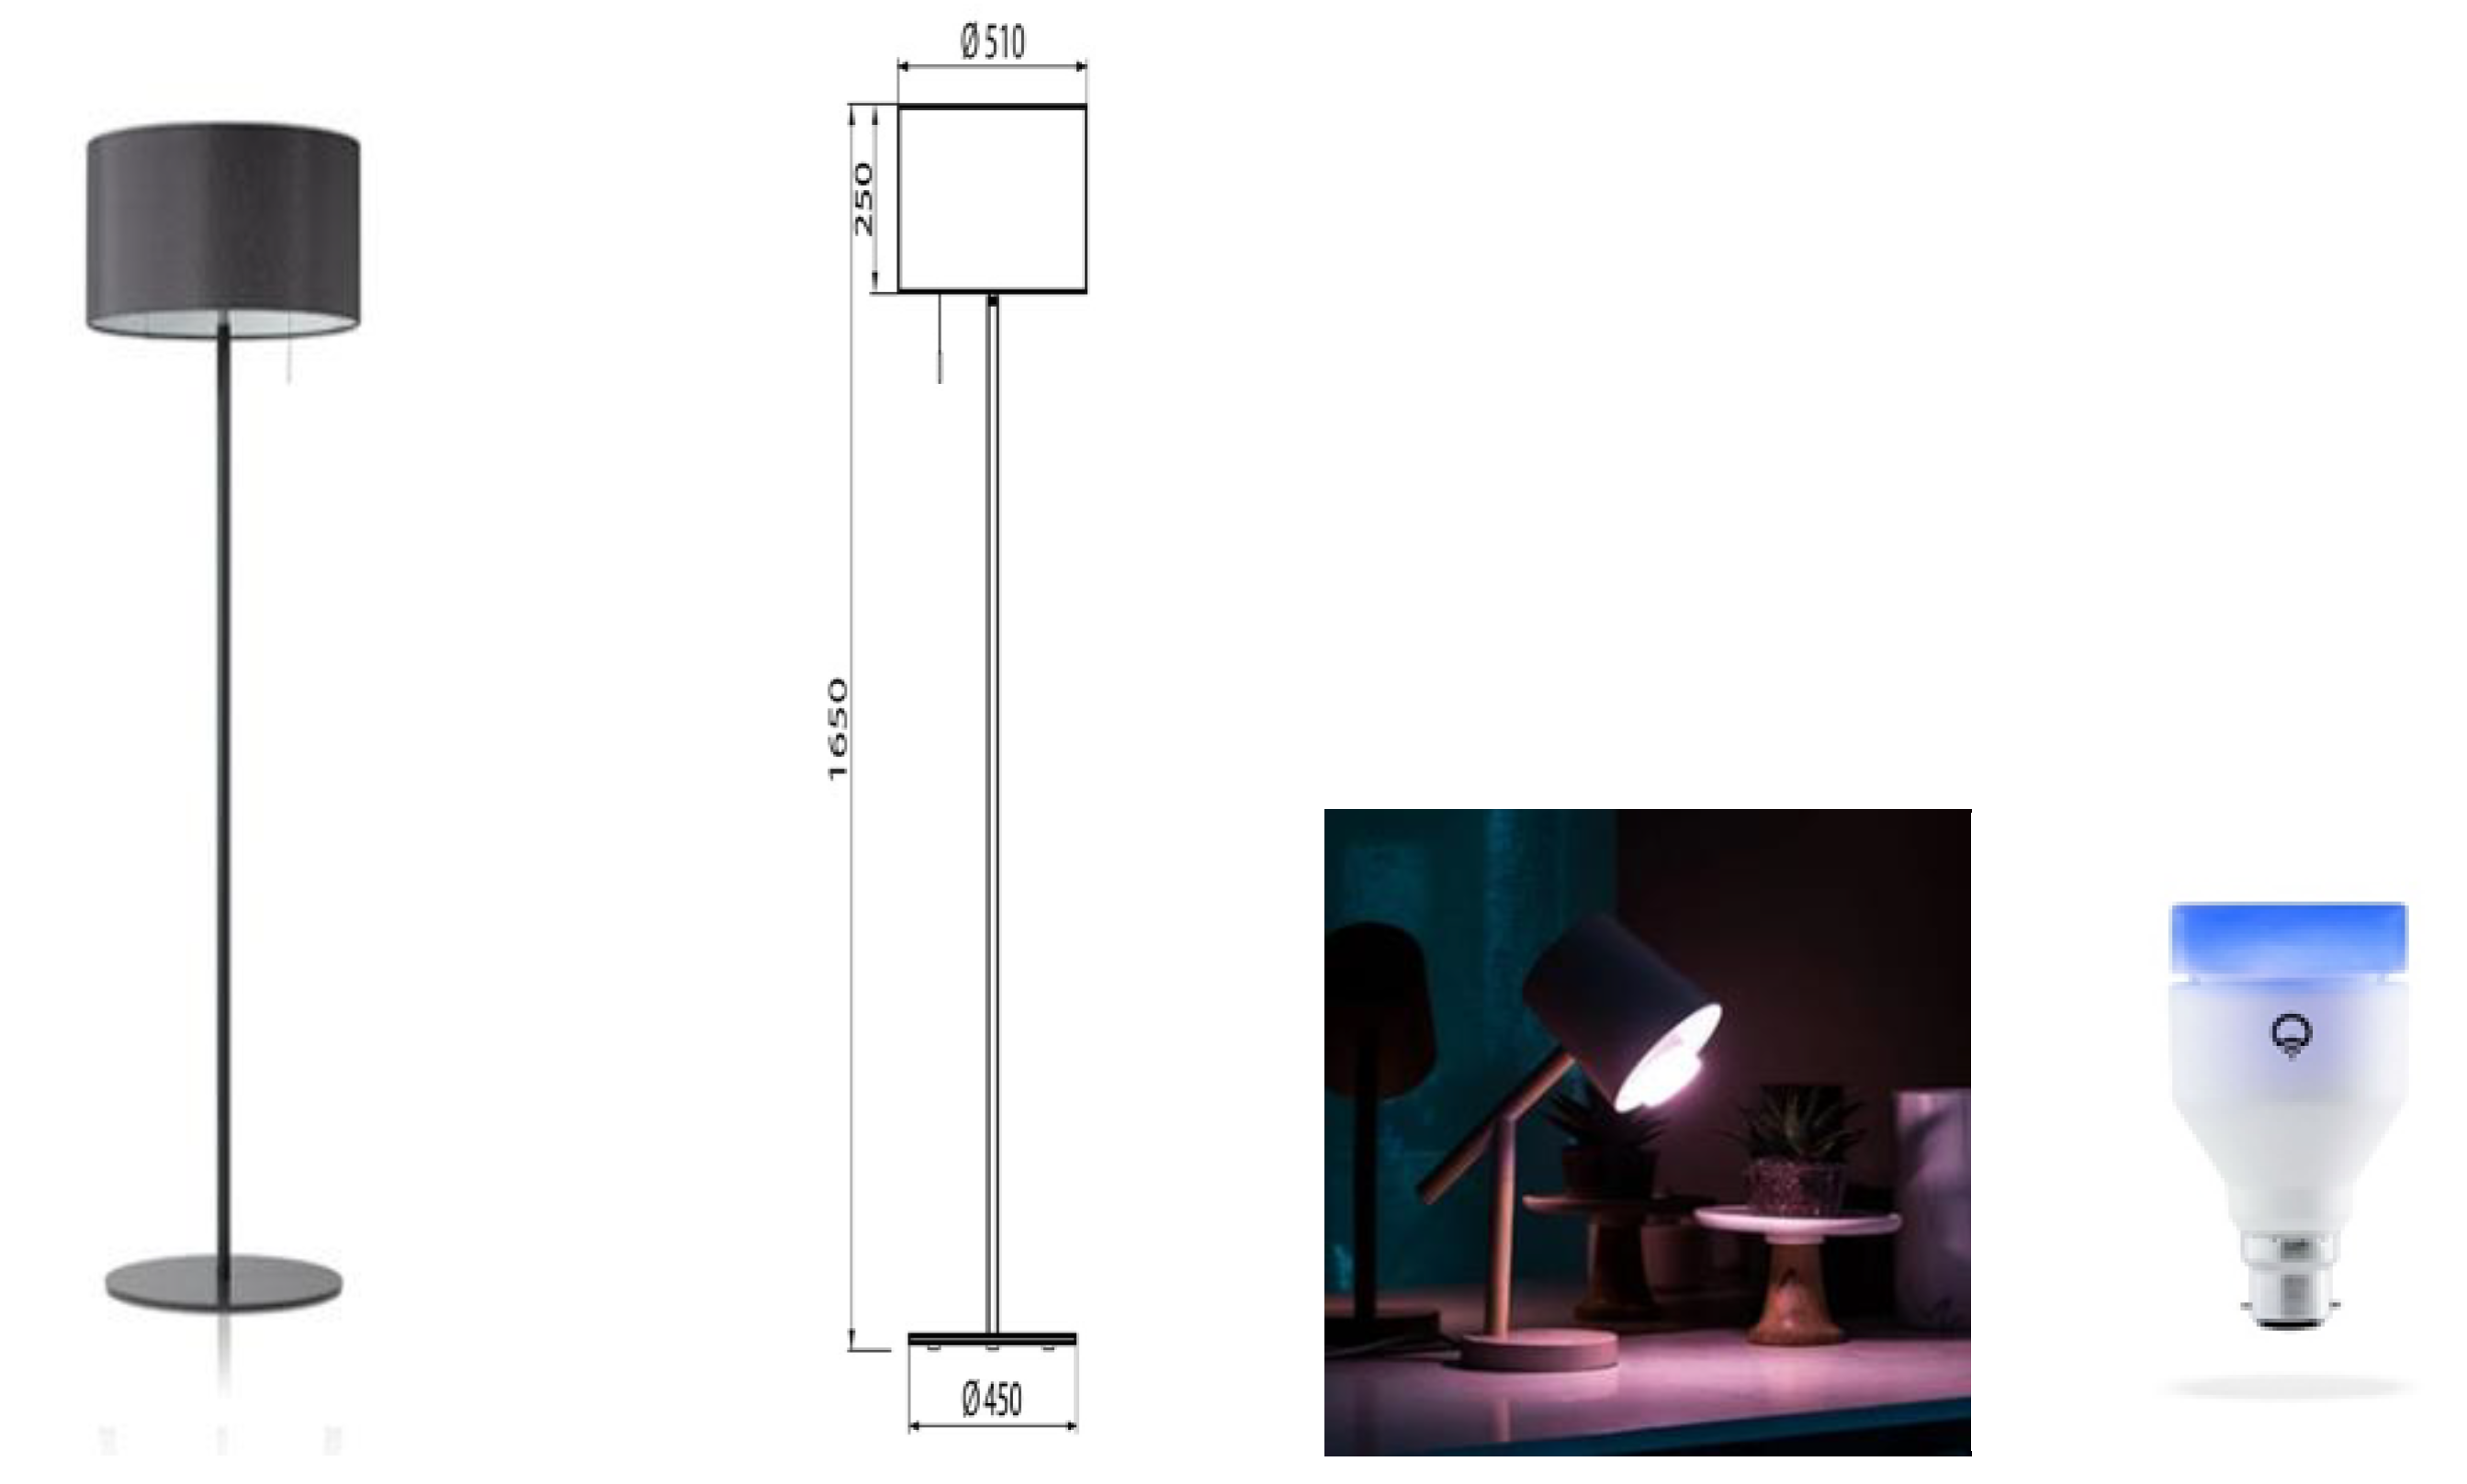
2.4. Lighting Intervention

In this study, a Waldmann VIVAA Free Visual Timing Light lamp (VTL-lamp) and a LIFX-A60 light bulb, both shown in Figure 1, were used in the dynamic lighting system. The VTL-lamps were placed in the kitchen and in the living room near those seats where the participants spent most of the daytime. The free-floor standing luminaires provided both direct and indirect lighting via the ceiling. The illuminance level and color temperature of the light varied dynamically across the day. From 7:00 a.m. onward, the light increased quite fast across 30 min to medium level, and then more slowly from 7:30 to 9:30 a.m. until its peak value. There, it remained until 3:30 p.m., when it gradually started to decline to reach 0 lx at 9:00 p.m. The CCT started high (6000 K, quite cool, blueish light) in the morning (7:00–9:00 a.m.) to boost the circadian rhythm. Then CCT gradually decreased to 4000 K (normal white light) and stayed there until 4:00 p.m. In the late afternoon and early evening, the CCT was lowered to 3000 K, and from 7:00 p.m. onward, it slowly lowered from 2500 K to 2250 K (warm yellowish light) until it was dimmed completely. The exact intensity levels depended on the exact seating position of the person, ceiling height and coloring, and shape and texture of the furniture, but were estimated as indicated in Table 2. Spectral distributions of the light varied constantly. Figure 2 visualizes the spectra in the middle of each phase described in Table 2. Full stimulus specification tables and spectra are publicly available via the Open Science Framework [41]. Measurements were taken horizontally, approximately at the lap level of a seated person, and vertically, approximately at eye level of a seated person. Both photometric illuminance and melanopic equivalent daylight (D65) illuminance (EDImel) are reported. The first measure is most relevant to the visual system, while EDImel is more indicative of the activation of the photoreceptors that project to the biological clock. There was a low risk of blue light hazard, the Unified Glare Rating was below 16, and there was no exposure to UV radiance. The color rendering index (Ra) was >80.
The LIFX-A60 LED-based light bulb was placed on a bedside table in the bedroom and offered a wake-up scenario of 30 min constant lighting in the morning. We used a light intensity of 770 lumen and a color temperature of 7500 K.

2.5. Measurements

In order to obtain objective measurements of the received amount of light and color temperature of each participant, lighting measures were collected using a spectrometer and personal light buttons.

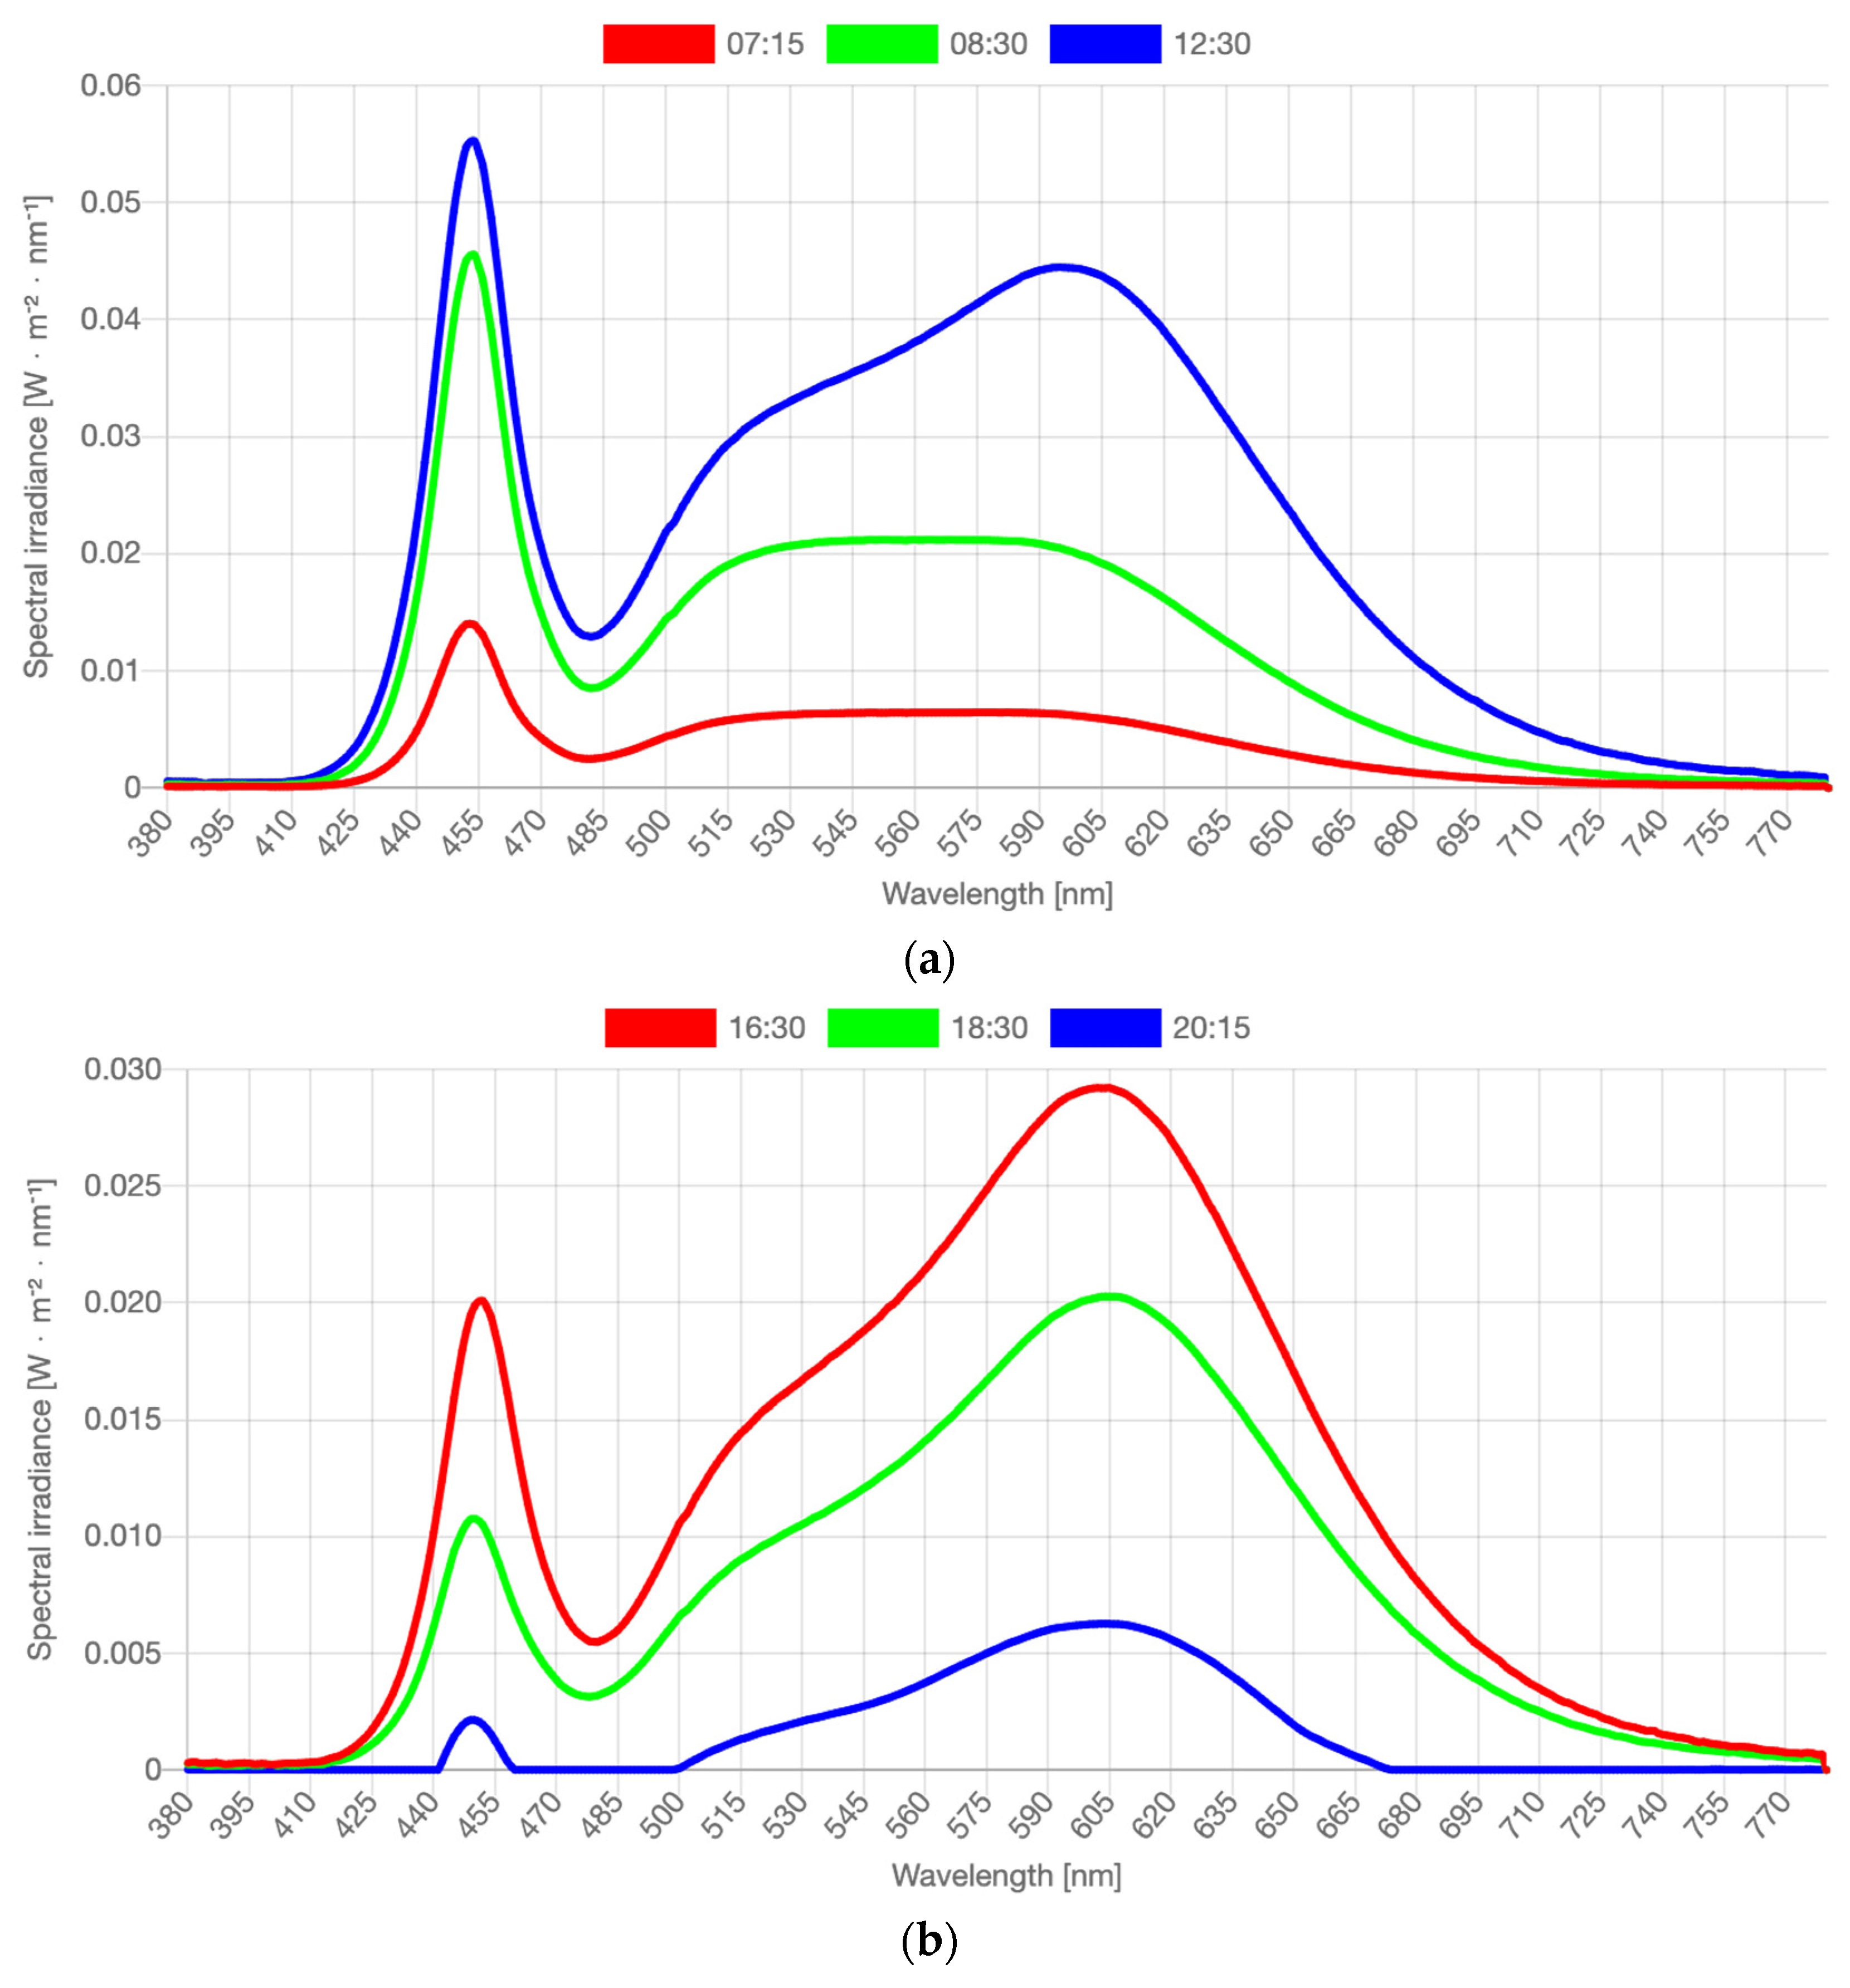
2.5.1. Baseline Light Measurements of the Home Situation Using a Spectrometer

In both the control condition and the exposure condition, in every individual’s home, the light intensity in lux, the color temperature in Kelvin, and the EDImel, based on the visual color spectrum, were measured vertically at eye level in a baseline measurement in the morning between 9:00 a.m. and 12:00 noon. The lighting measurements at home were collected with a Sekonic C-700 spectrometer. The measurements also included contributions of daylight and additional lighting routinely used in the home. Vertical measurements at eye level approach the real-life situation of light collected by the retina.

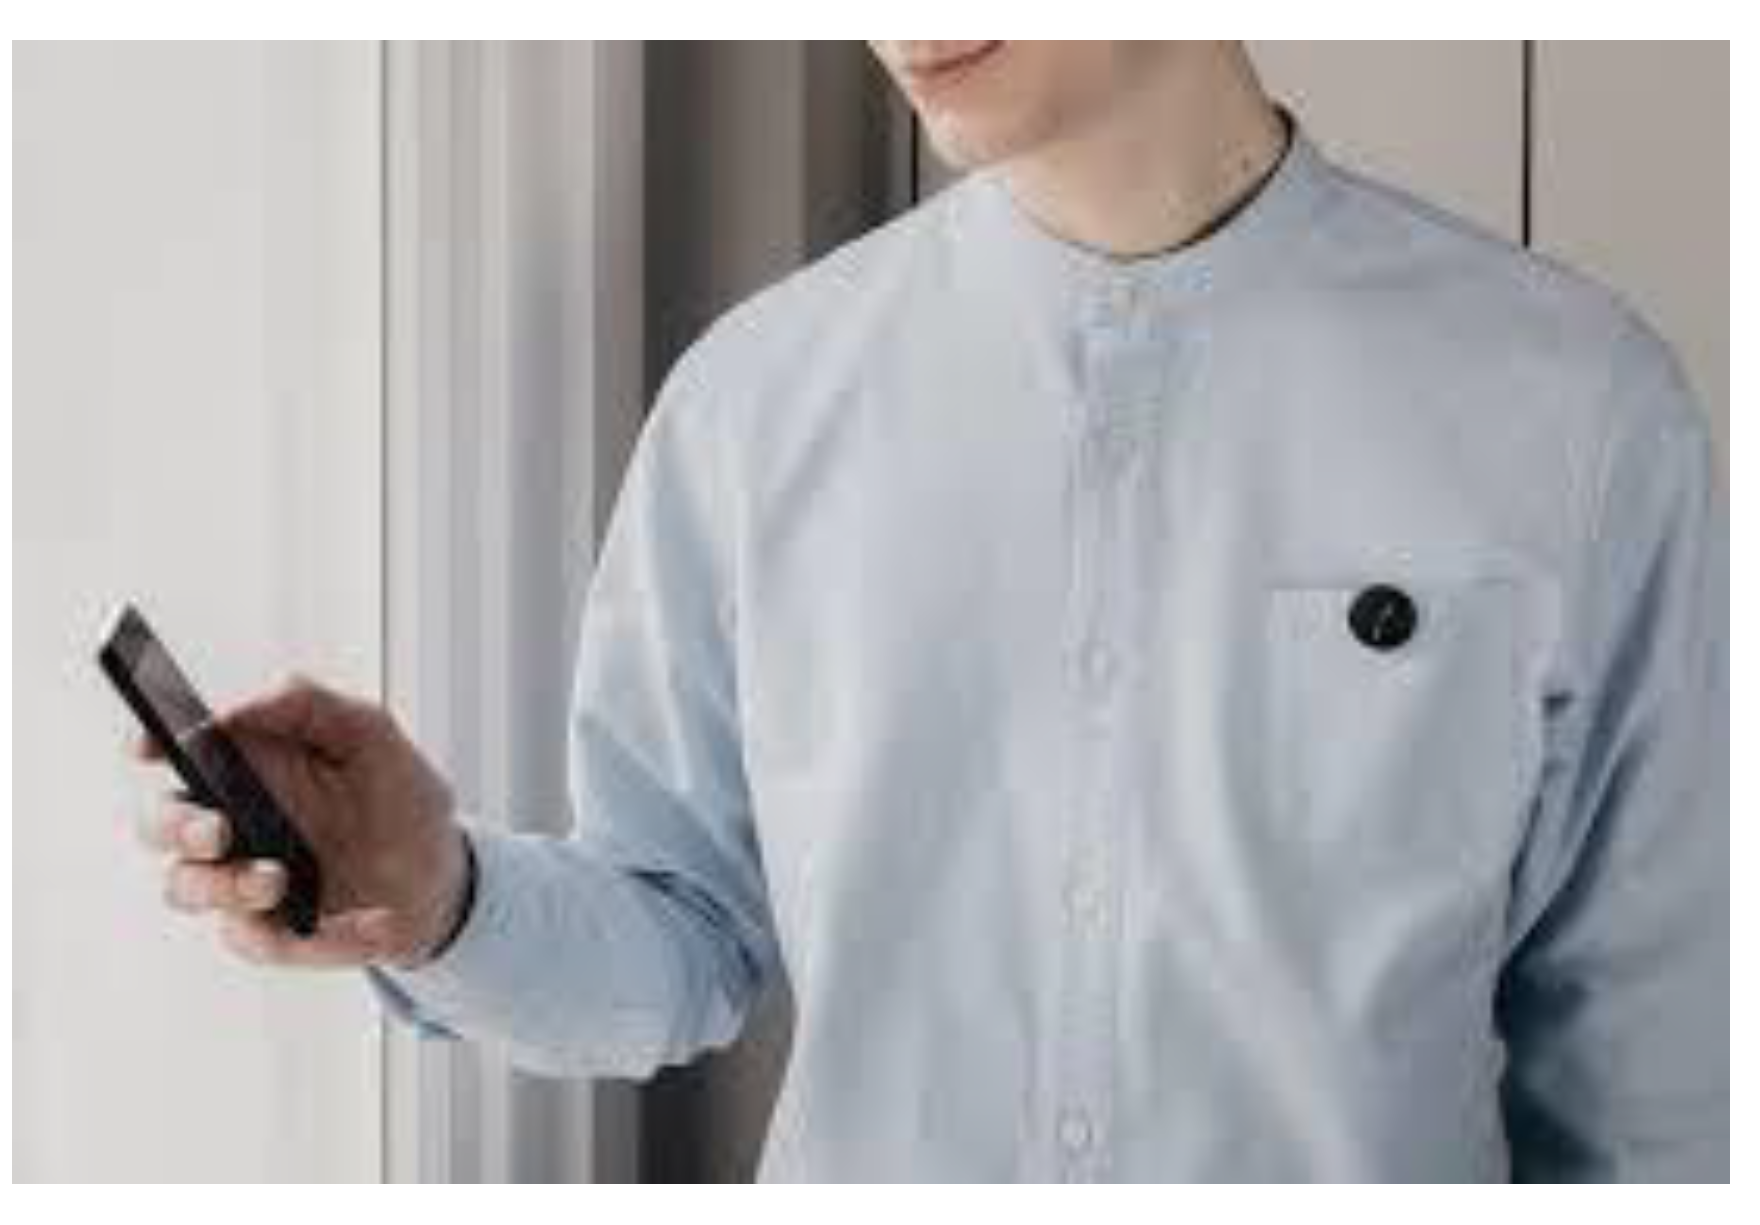
2.5.2. Personal Light Measurements during the Day Using a Sensor Button

To objectively measure the light received by each individual participant, a LYS button 1.0 sensor, app, and data services of LYS Technologies were used. This small device was placed as close to the participants’ eyes as possible, mainly on their collar and sometimes on their glasses. The button was placed in a charger on the bedside table during the night. The button used a Bluetooth connection to connect with a smart device (Figure 3). The spectral range from the LYS RGB sensor was from 350 to 750 nm. The illuminance range of the button was 0–100,000 lx. The measurements of color temperature were in Kelvin. Separate R, G, and B values were also recorded, but not analyzed or discussed in detail, as these were used to estimate CCT. A summary table is included in the Supplemental Materials (Tables S1–S3). The device also contained a three-axis accelerometer as a proxy for activity. These data were used to indicate whether a lux value of (close to) 0 was valid, as it was unlikely that the participants moved during daytime in complete darkness. Data were sampled every 15 s.

2.6. Statistical Analyses

2.6.1. Preparations

In order to analyze the light data, several steps were taken. First, for illuminance, negative values and values close to 0 indicate that there is hardly any light, which is unlikely since the sensor was only worn during daytime and evening. These values were replaced for missing values as the most likely explanation is that people covered the sensor with some clothes. Therefore, we assumed these close to 0 values to be invalid. When people move, it is even less likely that they do this in complete darkness. Therefore, we used different threshold criteria for movement vs. no movement. When the participants moved, values below 10 were assumed to be invalid, but when they did not move, values below 5 were assumed to be invalid. Second, for illuminance, an upper bound value of 1000 lx was used. This was because the visual system likely saturates above this level. Third, the illuminance and RGB levels were log10 transformed in order to make the data less skewed. Finally, the data were aggregated to daypart level. That is, for each of the 7 days the sensor button was worn, there were three measurements that indicated the average light measures during the morning, afternoon, and evening.

2.6.2. Randomization Tests

As the number of participants was small, the distributional assumptions of a parametric analysis, such as a mixed regression, could not be warranted. We therefore used a randomization test procedure. This randomization test was used to compare the different light measures for phases A1 and B1, B1 and A2, and A2 and B2 at the individual and group levels.

Randomization Test between Participants for the Spectrometer Data

For the spectrometer, there was one observation per light condition per participant at baseline. For each room, we randomly resampled all illuminance, EDImel, and CCT values of the A and B phases for all participants to create a randomized distribution. The observed mean difference between the two phases of A and B was compared with the randomization distribution, and the statistical significance was calculated by dividing the number of random mean differences that were equal to or larger than the observed mean difference. A type 1 error rate of 0.05 was used as the criterion to reject the null hypothesis (H0).

Randomization Test within Participants for the Sensor Button Data

In the randomization test, the mean difference between the observations within two phases was compared with a randomized distribution of random mean differences, which were formed by randomly resampling, without replacement, all observations within the two phases for a participant. The statistical significance could then be calculated by dividing the number of random mean differences from the randomized distribution that were equal to or larger (or smaller when the observed mean difference was negative) than the observed mean difference. Note that because the randomized distribution was not necessarily symmetric, the statistical test was one directional. In addition, H0 was not—as usual—that the mean difference between the two phases is 0, but instead that the observed mean difference does not differ from a mean difference in which the observations were randomly assigned to one of the two phases [44].
Each individual p-value shows whether a statistically significant effect was found for each individual. The power to find a significant effect for just one individual is low when the number of measurements within an individual is relatively small (i.e., <20). Therefore, we used a more lenient type 1 criterion of 0.1 to reject the null hypothesis at the individual level. By combining the results at the individual level, we evaluated the group effect for all the participants together using a replicated single-case design. The overall p-value for the replicated single-case design can be calculated by using the property of p-values that they are uniformly [0,1] distributed. When the overall null hypothesis is true, the sum of the p-values is just a random draw from all possible sums of p-values.
Then, the overall p-value is the proportion of combinations of p-values that would give a sum S as small as the observed sum Sobs:
P ( S S o b s ) = k = 0 S ( 1 ) k ( n k ) ( S k ) n n !
in which k are integers starting at 0 and with the maximum closest integer being smaller than S. The use of this equation in randomization testing is explained by Onghena et al. [45]. This overall p-value from the replicated single-case design has much more power since it is based on multiple participants. Therefore, a common type 1 error rate of 0.05 was used.
We used this randomization test procedure to compare the different light measures for phases A1 and B1, B1 and A2, and A2 and B2.

2.6.3. User Experiences

As the aim of this study was to investigate whether the study protocol is suitable for field studies in the home setting, it was also important to evaluate the subjective experience of the participants in participating in such long-lasting intensive research. Immediately upon completion of the study, the participants were asked about their experiences with the study setup and the duration. In addition, 6 months after finishing the study, the participants and caregivers received an evaluation form that included questions about their experiences with the lighting system. These questions were about whether people found the light pleasant, unpleasant, or distracting; whether they felt it had affected their well-being; whether they would like to purchase the lighting system themselves; and whether they missed the lighting system after the study.

3. Results

3.1. Effectiveness of the Light Intervention

3.1.1. Spectrometer

The spectrometer collected data in one baseline measurement to compare the intensity and CCT of the light in the three rooms of each participant’s home for phases A1 and B1.
For each of the three rooms, a randomization test was performed to test the significance between the A (without lamp) and B phases (with lamp). The results for illuminance, CCT, and EDImel are shown in Table 3. For the kitchen, the observed mean difference in illuminance was 674 lx, p < 0.001 (356 lx EDImel), with higher values in phase B. For the bedroom, the observed mean difference in illuminance was 1261 lx, p < 0.001 (653 lx EDImel), with higher values in phase B. For the living room, the observed mean difference in illuminance was 812.7 lx, p = 0.03 (559 lx EDImel), with higher values again in phase B.
For the kitchen, CCT remained virtually unchanged (−28 K, p = 0.532). For the bedroom, CCT was 567 K higher, though this difference was not statistically significant, p = 0.169. The same holds for the living room, where the average CCT was lower (−431 K), though not significantly so, p = 0.88.
The EDImel differences were substantial. The observed mean differences in the kitchen, bedroom, and living room were 356, 653, and 559 lx, respectively, with significantly higher values in phase B.

3.1.2. Spectrometer Conclusion

The results of the spectrometer data show that in the rooms in which the participants lived, the amount of light was significantly and substantially higher in the intervention condition, measured at the projected eye position of the participants. This is true for both traditional illuminance measures and melanopic EDI, which accounts for both intensity and spectrum changes with regard to melanopic activation of the photoreceptors that project to the biological clock. For all individual participants, the vertical illuminance values were higher in phase B than in phase A for all rooms with the exception of one kitchen of one participant. There were no significant differences in CCT between the two phases.

3.1.3. Personal Light Exposure Measured with Wearable Sensors

To test the hypothesis of whether the participants received more light in phases B1 and B2, when the lighting system was present, compared with phases A1 and A2, when the lighting system was absent, individual light data from the light sensors that the participants wore were compared at the individual and group levels between phases. These data included data on light intensity and the estimated correlated color temperature (CCT).

3.1.4. Light Intensity (lx)

Table 4 shows the results of the randomization tests for illuminance (in lx, log10 transformed; see Supplementary Material Table S4 for the descriptives of lux values.). The table shows that in phases A1 and B1, for most participants, the light intervention did not result in illuminance values. Only participants 8 and 12 showed (marginally) significant effects. The sum of the individual p-values was 3.612 and hence is not significant, p = 0.152, indicating that no overall effect of the light intervention emerged in the replicated single-case design. The overall mean difference was 0.039, and Cohen’s d was 0.14, indicating a small effect size. For the comparison of phases B1 and A2, we expected the illuminance values to decrease. Most participants indeed showed a decrease in mean illuminance value. The randomization tests showed that there was a significant decrease for participants 1, 2, 4, and 7. The sum of all individual p-values, 3.159, was significant, p = 0.02. The overall mean difference was −0.111 (log10 of illuminance), and Cohen’s d was 0.355, indicating a small-to-medium effect size. The comparison of the second baseline A2 and the reintroduction of the lamp in phase B2 showed higher illuminance values for most of the participants, except for participants 2 and 5. The randomization tests showed that these differences were significant for participants 1, 3, 4, 6, and 10. The sum of all individual p-values, 2.046, was significant, p < 0.001, indicating that there was an overall effect of the lighting system intervention in the replicated single-case design model. The overall mean difference was 0.142, and Cohen’s d was 0.367, indicating a small-to-medium effect size.

Light Intensity Conclusion

The difference in the light intervention between the first control phase A1 and the intervention phase B1 was not significant, but the light intensity was significantly higher in phases B1 and B2 than in phase A2. As full spectral data, unfortunately, could not be acquired with these wearable sensors, similar analyses could not be performed for EDImel.

Correlated Color Temperature (CCT)

The mean differences between the CCT values in phases A1 and B1 showed significant differences for participants 9, 11, and 12 in Table 5. The sum of all individual p-values was 4.41, which was not significant, p = 0.458. The overall mean difference was 39, and Cohen’s d was 0.065, indicating a very small effect size.
For the comparison of B1 and A2, the randomization tests showed that there was a significant decrease for participants 1, 2, 3, 4, 5, and 7. The sum of all individual p-values was 2.68, which was significant, p = 0.005. The overall mean difference was −184 K, and Cohen’s d was 0.350, indicating a small-to-medium effect size. The comparison of phases A2 and B2 showed significantly higher CCT values for participants 3, 5, 7, and 9. The sum of all individual p-values was 1.19, which was significant, p < 0.001. The overall mean difference was 268 K, and Cohen’s d was 0.469, indicating a medium effect size.
  • CCT Light Conclusion
The CCT of the light was not significantly different between the first control phase and the first intervention phase B1, but CCT was significantly higher in phases B1 and B2 than in phase A2.

3.1.5. Randomization Test per Daypart

In order to evaluate whether the effects of the intervention were different for the three dayparts, we performed randomization tests per daypart for all the light measures. Table 6 shows the results, and Supplementary Material Table S5 displays the descriptives. For the morning measurements, no significant differences were found between the phases. Only for the CCT measures, the differences between phases A1 and B1 and A2 and B2 reached marginal significance. For the afternoon data, all light measures showed significant differences between phases B1 and A2 and A2 and B2. For the evening data, there were significant differences for all light measures between phases A2 and B2. The difference between B1 and A2 was significant for CCT in the evening.

Daypart Differentiation Conclusion

The randomization tests showed that the differences between the phases were most pronounced in the afternoon for all light measures. In the evening, there were significant differences between phases A2 and B2 for all light measures. No differences in light measures between the phases were found in the morning.

3.1.6. Randomization Test of Seasonal Effects

In order to test whether there were seasonal effects, we performed a separate analysis for participants who participated from September to December and for participants who participated from January to April. Table 7 (see Supplementary Material Table S6 for the descriptives) shows that there were higher illuminance levels during phase A1 (no lighting system) than during phase B1 in summer–fall, though this difference was not statistically significant. For the winter–spring participants, however, the light measures showed the expected statistically significant increase from A1 to B1, indicating a clear effect of the lighting system intervention. With regard to the difference between B1 and A2, we observed statistically significant decreases in both illuminance and color temperature for the summer–fall participants. Remarkably, there were no significant differences between B1 and A2 for the winter–spring measures for both light parameters. Both seasons showed (marginal) significant effects for both light parameters from phase A2 to phase B2.

3.1.7. Seasonal Effects Conclusion

The results showed clear seasonal effects for all light measures. The sunny and clear skies in September 2019 even led to higher light values in phase A1 than in phase B1. At the same time, the start of the spring season in March 2020 during phase A2 probably led to no significant differences between phase B1 in February 2020 and phase A2. The weather statistics showed that the mean number of sun hours during phase A2 was 8.3 h per day compared with the mean number of sun hours during phase B1, which was 8.1 h per day [42].

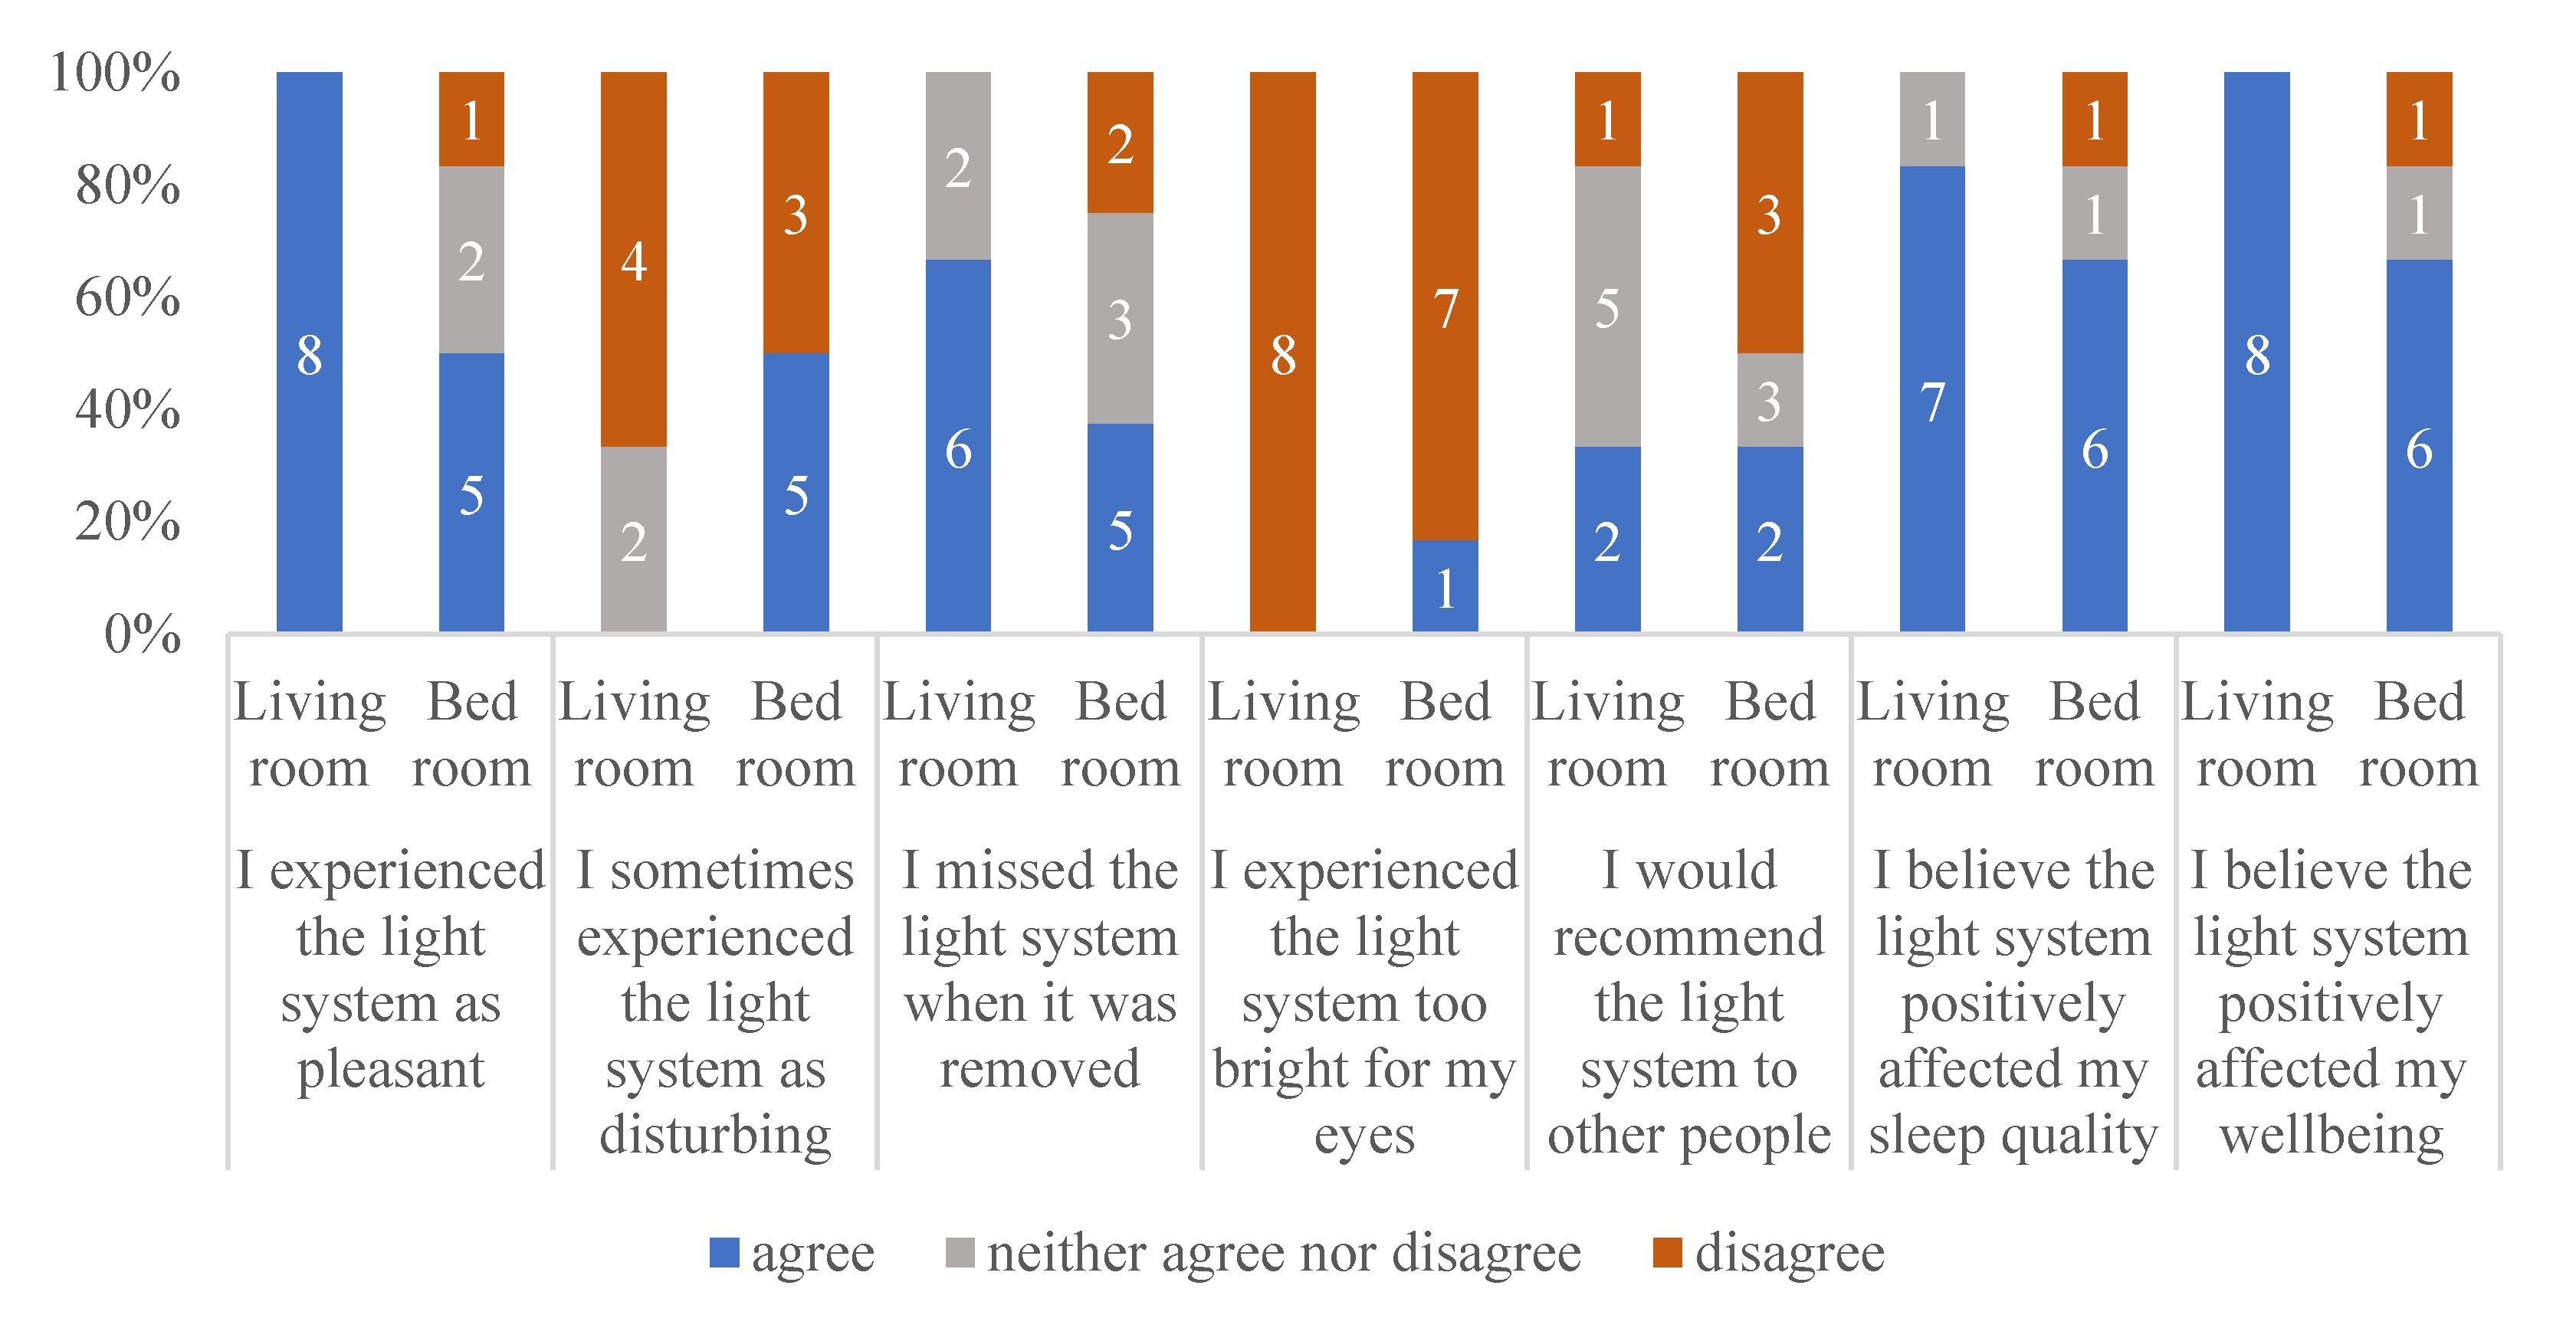
3.2. User Experiences

Immediately upon completion of the study, the participants were asked about their experiences of participation in this quite intense longitudinal study. None of the participants or their caregivers perceived the visits by the researchers as burdensome. It was sometimes considered strange to have lights left on during the day, even when they were not at home. In one participant, the lighting program was adjusted to his or her absence on several fixed days per week. Wearing the sensors was also not considered a burden by any of the participants. However, it was sometimes difficult to realize that the sensor should not be covered by clothing and should be moved to the collar of a jacket when going outside.
The participants regretted that the lights were removed for 4 weeks and indicated that they were greatly missed. The caregivers noticed that the participants liked to spend time under the lamp and seek out the light on their own. Several participants experienced problems with the connectivity of the app, which was needed to program the bed light. For all the participants, extra personal visits for technological support were necessary, as the participants and caregivers were insufficiently technically proficient to deal with these problems by telephone help desk. The problems were usually caused by Bluetooth or Wi-Fi problems. Sometimes support was also needed to be able to use the app correctly. Most participants managed to solve subsequent problems themselves, guided by a concrete user manual. In one participant, only personal visits could solve the problem.
To learn about the experiences of the participants in this study, 6 months after the end of participation, the participants and caregivers received an evaluation questionnaire. Eight participants completed and returned the evaluation. Two participants were moved to a care home, and one of these participants was incapable of answering the questions, while the other two had deceased. Figure 4 shows the responses of the eight participants and their caregivers regarding their experiences with respect to the lighting system.
As Figure 4 shows, most of the participants evaluated the lighting system as positive, and mostly not disturbing. They missed the lighting system after it had been removed. Most of the participants (or their caregivers) believed the lighting system positively affected their sleep quality and well-being. Figure 4 also shows that the participants were more positive about the lighting system in the living room than about the lighting system in the bedroom. The lighting system in the bedroom was not recommended by three of the eight participants.

4. Discussion

The aim of this study was to investigate whether a single-case experimental design (SCED) approach, taking into account personal preferences, an uncontrolled environment, the stage of dementia, and the heterogeneity of the population, is applicable to investigate differences in light consumption for people with dementia in a real-life situation, such as a home environment. In this first attempt to do so, the lessons learned should also provide recommendations to develop a suitable light protocol to study light interventions in the homes of people with dementia.
A subsequent question was whether people with dementia living at home would be exposed to substantially brighter light and light of a higher correlated color temperature when they used an off-the-shelf dynamic lighting system in their home compared with regular lighting. To gain more insight on its effectiveness, we also explored at what time of day the contribution of the lighting system was most pronounced (morning, afternoon, or evening) and whether the effectiveness was moderated by season. Finally, user experiences were evaluated, as their (positive) experiences ultimately determine the usefulness of the lighting solution.
It seems that the used real-life longitudinal single-case experimental design (SCED) is applicable to studying a lighting system suitable for people with dementia living at home, despite the uncontrolled environment, stage of dementia, and heterogeneity of the study population. In addition, this study approach is sufficiently sensitive for demonstrating differences in the presentation of light during the day after an exposure phase of 4 weeks in light intensity and color.
In the following, we first discuss the results on the light intervention. After this, we reflect on the study design, including the protocol, data collection, and analyses, by discussing five reasons why the used study design is applicable and meaningful for application to this heterogeneous population. Lastly, recommendations, based on lessons learned, for future research are made.

4.1. Reflection on the Results

The intervention lighting that was placed in the participants’ bedrooms, kitchens, and living rooms theoretically delivered up to 850 lx extra (580 lx EDImel; see Table 2, depending on the phase of the dynamic scenario) at eye level. These estimates were based on measurements in a small white room without daylight. The actual light exposure at eye level of the participants if seated correctly under the lamp, of course, depends on the exact placement of the lamp, furniture, and finishing of the room, as well as the available daylight. The measurements performed with the spectrometer in the rooms of the participants, under the lamps, indeed established an increase of 670–1250 lx (350–650 lx EDImel, depending on the room and measured in the morning, so at the peak of the scenario; see Table 3) between the intervention and baseline conditions. However, in daily life, the actual personal light exposure largely depends on the dynamic scenario and the person’s physical activity and location (e.g., spending time outdoors, opening and closing curtains, and screen usage). For instance, the added effect of the lighting system is only modest in comparison with the effect of direct exposure to daylight when people are outside. The amount of light on a sunny day is orders of magnitude higher than the amount provided by any indoor lighting system. The effectiveness of the placement of our intervention lighting furthermore depends on the time they would actually spend in the designated seating areas under the lamps. We therefore considered it important to establish the effectiveness of a light intervention in everyday situations and over a prolonged period of time.
Indeed, the personal light exposure data showed statistically significant differences between the two intervention periods and the second baseline week for most measurements. The difference in exposure in the first baseline week did not reach significance, potentially due to substantially better weather conditions in those weeks than in the remaining weeks. However, to put these findings into perspective, we should also note that the amount of extra light that was actually received according to the worn sensors was less than 20 lx (on average) during the participants’ waking episodes. This is the reality of field interventions, as also observed in a recent office-based field study [28]: what you see is not necessarily what you get. On the other hand, the 20 lx may be an underestimation of the actual circadian effect, as our loggers could not collect full spectra and hence potentially did not pick up spectral shifts towards the blue spectrum specifically.
In our sample, there was actually quite some variation in the effects of the lighting system. Although most participants showed effects in a positive direction, not all individual comparisons were statistically significant, and one participant (pp3) even had lower average light exposure when the lighting system was first presented in phase B1 and higher average light exposure when the lighting system was removed in phase A2. A possible explanation why this individual showed this deviant pattern is that he or she was not feeling well during this period and spent a lot of time in bed, where he or she only received the 30 min of wake-up light, not the full daylight curve of the free-floor standing lights. An advantage of the SCED design is that the data can be directly linked to this participant.
An additional explanation for the differences in the results on the worn sensors compared with the results on the spectrometer is that the quality of devices to achieve an accurate quantification of light exposure can differ. Furthermore, the location where the sensors were worn can also have an impact on the results. Aarts et al. [46] previously studied several commonly used wearable light measurement devices. They found that the quality and the outcome of these devices under different circumstances were very different, and that the location where these devices are worn has an impact on the results. The smallest deviation, both indoor and outdoor, was found when the device was placed on the sides of the eye. In our study, one participant placed the sensor on his glasses. Other participants wore the sensor on the chest, hence less close to the eye.
The actual personal light exposure as logged by the person-worn sensors also cannot be attributed singularly to the luminaires, as they may have also varied with, for instance, changing movement patterns and weather conditions. This is why we adopted prolonged tracking within conditions and repetition within conditions. It turned out that at the group level, the introduction of the lighting system did not result in a consistent statistically significant effect across the four phases. Additional results on the subgroups showed that this absence of an effect was probably at least partially caused by the subgroup of people who started the experiment during the summer. These people even had significantly higher illuminance values during the first phase A1 than during the introduction of the lighting system in phase B1. The subgroup of people who started the experiment in the winter showed significantly higher levels of light when the lighting system was introduced during phase B1. From the royal national weather station in the Netherlands [47], it is known that the number of sun hours in the Netherlands at the end of the summer (September) of 2019 was much higher than in October 2019 (157.4 h vs. 99.8 h), the month in which the lighting system was introduced for the subgroup.
The limitations of the study are fairly obvious. The participants were not blind to the exposure condition, as they knew when the lighting system was present and when it was removed. They also knew when data collection took place. Hence, we cannot attribute the participants’ subjective responses and experiences singularly to either the light or the mere presence and design of the luminaires. This study was conducted with a carefully selected lighting system, but other, potentially better or worse, systems could have been selected. Lighting systems could be compared by comparing one intervention with another. In addition, the target group was very heterogeneous, as often mentioned, and there were various external influences that were hopefully all considered, but it cannot be ruled out that there were also invisible confounders. People with dementia are not always able to put themselves and what is going on inside them into words. More field studies should be performed to define the best applicable study protocol for this population.

4.2. Reflection on the Used Design

Installing a novel lighting system in the houses of people with dementia does not guarantee that the lighting system will be used in a proper way. For example, the bedroom light worked with Wi-Fi and a Bluetooth connection, and sometimes it was accidently disconnected or turned off by the participants. Problem solving required physically reconnecting the system, which was only possible during home visits.
The wearable sensors that objectively measured the amount of light regularly registered negative or unrealistically low values. Perhaps the sensor was partly or completely covered by clothing at such times or worn too close to the face so that there was a shadow on the sensor. Furthermore, people sometimes forgot to wear the sensor. Probably due to attentiveness of the caregivers, no sensors disappeared, were hidden, or were thrown away. Negative or unrealistically low values can be detected in data analysis, as it is highly unlikely that the participants received no light intensity and, at the same time, were registered as moving or physically active. Therefore, the study design must take into account substantial amounts of missing data by ensuring sufficient power and/or redundancy. The used SCED design with the ABAB setup seems to be appropriate to fill these gaps [29,30,31].
Some caregivers reported that the strange new lights in the house sometimes caused some confusion among the participants and that this did not always make them sit down in their familiar places. The caregivers sometimes tried to support or encourage the participants to continue with their usual preferred daily routine. Some the caregivers encountered behavioral problems or agitation at these moments. These symptoms are common in people with dementia, and their prevalence is high also among persons still living at home. For instance, in a cross-sectional study by Huang et al. [48], 80% of the population scored positively on the behavioral and psychological symptoms of dementia (BPSD) spectrum at the onset of the disease, and even 97.5% in the moderate stage of dementia. Nevertheless, they appreciated the lighting system as indicated in the user evaluation.
Finally, our study is a field experiment in a very heterogeneous, vulnerable, and hard-to-reach population. The results of our study have high ecological validity, much more than a fully controlled experimental design, yet confounding variables may influence the results and could have made it hard to find a statistically significant effect at the group level. However, this is an inevitable property of the population and setting. The fact that an effect of the lighting system was found despite these confounding variables shows that the effect of the lighting system is rather robust and may therefore be a real benefit in practice and the real-life setting of people with dementia at home.

4.3. Lessons Learned

Based on this study, some lessons learned could be formulated for the implementation of the light protocol in practice. First, implementing a lighting system in the homes of people with dementia is possible and possibly useful. However, in sunny seasons, such as spring and summer, the added value of the lighting system compared with daylight is marginal. Therefore, it might be more useful to install the lighting system in darker seasons, such as fall and winter [25].
Besides these seasonal effects, the results also revealed differential effects for the lighting system with respect to the parts of the day. The effect of the lighting system was most pronounced in the afternoon and mostly absent in the morning. This result may be explained by the fact that the participants tended to be more active and outside in the morning, receiving more natural daylight than in the afternoon and evening, when the sun had already set by 5:00 or 6:00 p.m. in the fall and winter months. The effects were also less in the evening, but this would be in line with recommendations and the dynamic scenario as evening light is generally considered bad for sleep. This might indicate that it is useful to emphasize to users to use the lighting system in the afternoon and evening and to stimulate these users to (continue to) go outside in the morning.
The correlated color temperature did not significantly differ for the spectrometer results in the three rooms with and without the lighting system. This was likely caused by the fact that these measurements were taken late in the morning, when the correlated color temperature of the scenario was close to that of standard lighting. Across the day, the scenario varied between both higher and lower CCT values, so one would not necessarily expect large overall changes.
Carefully designed technological interventions can respond to unmet needs of people with dementia and family caregivers at different stages as dementia progresses [49]. Existing products, systems, and services are often too complex to be used by people with dementia [50]. Meiland et al. [51] found that it is very important that innovations are supported by the users, are experienced as user-friendly, and are practically feasible in terms of successful implementation. Therefore, the development of assistive technology for people with dementia needs to be evaluated in a real-life context [52,53,54].
Although the evaluation of the subjective experience of the lighting system by the participants is, of course, difficult because of the dementia, we were still able to gather information from most of the participants (6 out of 11) based on a short questionnaire. The vulnerability became painfully obvious with the fact that two of the people had passed away and two had moved to a care home shortly after the end of the study. The participants valued and missed the lighting system, the extra light exposure in terms of intensity and color and atmosphere, when removed. Moreover, the informal caregivers were positive, and most of them even reported a positive, though still subjective, effect on the sleep, activity, and psychological well-being of their loved ones. The vulnerability of the population and still the applicability and effect of the used study design indicate that the lighting system might be useful for people with dementia in moderate and severe stages of the disease. This seems an important finding as care innovations for home use are mostly developed and implemented by people with dementia in mild stages of the disease.

5. Conclusions

The results of this single-case design study are quite promising and indicate that future field studies are welcome. It is quite a challenge to perform a SCED study in such a specific and vulnerable population in a real-life setting. Nevertheless, we believe that people with dementia, particularly those still living at home, may greatly benefit from such an easy intervention as a low-cost, easy-to-implement-and-use lighting system, and this deserves to be tested in the field.

Supplementary Materials

The following are available online at https://www.mdpi.com/article/10.3390/app112110221/s1. Table S1: Mean Red Light log10 Values and Mean Differences and p-Values for All Phases. Table S2: Mean Green Light log10 Values and Mean Differences and p-Values for All Phases. Table S3: Mean Blue Light log10 Values and Mean Differences and p-Values for All Phases. Table S4: Mean and median Lux values per participant per phase. Table S5: Results of the Randomization Tests for RGB in Morning, Afternoon and Evening. Table S6: Results of the Randomization Tests for RGB Apart for Fall-Winter and Winter-Spring.

Author Contributions

Conceptualization, E.v.L.-v.D., I.B. and L.S.; methodology, E.v.L.-v.D.; software, S.B.; validation, E.v.L.-v.D.; formal analysis, S.B.; investigation, E.v.L.-v.D.; resources, E.v.L.-v.D.; data curation, E.v.L.-v.D. and S.B.; writing—original draft preparation, E.v.L.-v.D.; writing—review and editing, E.v.L.-v.D., L.S., S.B., Y.d.K. and I.B.; visualization, E.v.L.-v.D. and S.B.; supervision, E.v.L.-v.D.; project administration, E.v.L.-v.D. All authors have read and agreed to the published version of the manuscript.

Funding

This research received no external funding.

Institutional Review Board Statement

This study was conducted according to the guidelines of the Declaration of Helsinki, and approved by the Medical Ethics Committee (METC Brabant, NL63355.028.17/P1826; date of approval: 29 August 2018).

Informed Consent Statement

Informed consent was obtained from all subjects involved in the study.

Data Availability Statement

The data presented in this study are available on request from the corresponding author. The data are not publicly available because subjects are easily identifiable due to the used single-case experimental design.

Acknowledgments

The authors would like to thank all the people with dementia and their caregivers who took part in the study. They would also like to thank Waldmann and LYS Technologies, who made their products available for our study and provided noncommittal technical and practical assistance during this study.

Conflicts of Interest

The authors declare no conflict of interest.

References

  1. Figueiro, M.G. Light, sleep and circadian rhythms in older adults with Alzheimer’s disease and related dementias. Neurodegener. Dis. Manag. 2017, 7, 119–145. [Google Scholar] [CrossRef] [Green Version]
  2. Boyce, P.R. Lighting for the elderly. Technol. Disabil. 2003, 15, 165–180. [Google Scholar] [CrossRef]
  3. Shikder, S.; Mourshed, M.; Price, A. Therapeutic lighting design for the elderly: A review. Perspect. Public Health 2012, 132, 282–291. [Google Scholar] [CrossRef] [PubMed]
  4. Wahl, S.; Engelhardt, M.; Schaupp, P.; Lappe, C.; Ivanov, I.V. The inner clock: Blue light sets the human rhythm. J. Biophotonics 2019, 12, e201900102. [Google Scholar] [CrossRef] [PubMed]
  5. Abbott, A. Restless nights, listless days. Nature 2008, 245, 896–898. [Google Scholar] [CrossRef] [PubMed]
  6. Riemersma, R.F. Light and melatonin: Effect on sleep, mood and cognition in demented elderly. Neurobiol. Aging 2004, 25, 194. [Google Scholar] [CrossRef]
  7. Harper, D.G.; Volicer, L.; Stopa, E.G.; McKee, A.C.; Gitta, M.; Satlin, A. Disturbance of endogenous circadian rhythm in aging and Alzheimer disease. Am. J. Geriatr. Psychiatry 2005, 13, 359–368. [Google Scholar] [CrossRef] [PubMed]
  8. Hatfield, C.F.; Herbert, J.; van Someren, E.J.W.; Hodges, J.R.; Hastings, M.H. Disrupted daily activity/rest cycles in relation to daily cortisol rhythms of home-dwelling patients with early Alzheimer’s dementia. Brain 2004, 127, 1061–1074. [Google Scholar] [CrossRef] [Green Version]
  9. Bantry White, E.; Montgomery, P. Supporting people with dementia to walkabout safely outdoors: Development of a structured model of assessment. Health Soc. Care Community 2016, 24, 73–484. [Google Scholar] [CrossRef]
  10. Skene, D.J.; Swaab, D.F. Melatonin rhythmicity: Effect of age and Alzheimer’s disease. Exp. Gerontol. 2003, 38, 199–206. [Google Scholar] [CrossRef]
  11. Goudriaan, I.; van Boekel, L.C.; Verbiest, M.; van Hoof, J.; Luijkx, K.G. Dementia Enlightened?! A Systematic Literature Review of the Influence of Indoor Environmental Light on the Health of Older Persons with Dementia in Long-Term Care Facilities. Clin. Interv. Aging 2021, 16, 909–937. [Google Scholar] [CrossRef]
  12. Hanford, N.; Figueiro, M. Light therapy and Alzheimer’s disease and related dementia: Past, present, and future. J. Alzheimer Dis. 2013, 33, 913–922. [Google Scholar] [CrossRef] [PubMed] [Green Version]
  13. Scott, J.; Abaraogu, U.O.; Ellis, G. A systematic review of the physical activity levels of acutely ill older adults in Hospital At Home settings: An under-researched field. Eur. Geriatr. Med. 2020, 12, 227–238. [Google Scholar] [CrossRef] [PubMed]
  14. White, M.D.; Ancoli-Israel, S.; Wilson, R.R. Senior living environments: Evidence-based lighting design strategies. HERD Health Environ. Res. Des. J. 2013, 7, 60–78. [Google Scholar] [CrossRef]
  15. Aarts, M.P.J.; Stapel, J.C.; Schoutens, T.A.M.C.; van Hoof, J. Exploring the impact of natural light exposure on sleep of healthy older adults: A field study. J. Daylighting 2018, 5, 4–20. [Google Scholar] [CrossRef] [Green Version]
  16. Kompier, M.E.; Smolders, K.C.H.J.; de Kort, Y.A.W. Abrupt light transitions in illuminance and correlated colour temperature result in different temporal dynamics and interindividual variability for sensation, comfort and alertness. PLoS ONE 2021, 16, e0243259. [Google Scholar] [CrossRef] [PubMed]
  17. Kompier, M.E.; Smolders, K.C.H.J.; de Kort, Y.A.W. A systematic literature review on the rationale for and effects of dynamic light scenarios. Build Environ. 2020, 186, 107326. [Google Scholar] [CrossRef]
  18. Figueiro, M.G.; Hamner, R.; Higgins, P.; Hornick, T.; Rea, M.S. Field measurements of light exposures and circadian disruption in two populations of older adults. J. Alzheimer Dis. 2012, 31, 711–715. [Google Scholar] [CrossRef] [PubMed] [Green Version]
  19. Blume, C.; Garbazza, C.; Spitschan, M. Effects of light on human circadian rhythms, sleep and mood. Somnologie 2019, 23, 147–156. [Google Scholar] [CrossRef] [PubMed] [Green Version]
  20. Fontana Gasio, P.; Kräuchi, K.; Cajochen, C.; van Someren, E.J.W.; Amrhein, I.; Pache, M.; Savaskan, E.; Wirz-Justice, A. Dawn-dusk simulation light therapy of disturbed circadian rest-activity cycles in demented elderly. Exp. Gerontol. 2003, 38, 207–216. [Google Scholar] [CrossRef]
  21. Figueiro, M.G.; Hunter, C.M.; Higgins, P.; Hornick, T.; Jones, G.E.; Plitnick, B.; Brons, J.; Rea, M.S. Tailored Lighting Intervention for Persons with Dementia and Caregivers Living at Home. Sleep Health 2015, 1, 322–330. [Google Scholar] [CrossRef] [PubMed] [Green Version]
  22. Figueiro, M.G.; Plitnick, B.; Rea, M.S. A self-luminous light table for persons with Alzheimer’s disease. Light. Res. Technol. 2016, 48, 253–259. [Google Scholar] [CrossRef] [Green Version]
  23. Riemersma-van Der Lek, R.F.; Swaab, D.F.; Twisk, J.; Hol, E.M.; Hoogendijk, W.J.; Van Someren, E.J. Effect of bright light and melatonin on cognitive and noncognitive function in elderly residents of group care facilities: A randomized controlled trial. JAMA 2008, 299, 2642–2655. [Google Scholar] [CrossRef] [PubMed]
  24. Lieverse, R.; Van Someren, E.J.; Nielen, M.M.; Uitdehaag, B.M.; Smit, J.H.; Hoogendijk, W.J. Bright light treatment in elderly patients with nonseasonal major depressive disorder: A randomized placebo-controlled trial. Arch. Gen. Psychiatry 2011, 68, 61–70. [Google Scholar] [CrossRef]
  25. Van Hoof, J.; Aarts, M.P.; Rense, C.G.; Schoutens, A.M. Ambient bright light in dementia: Effects on behaviour and circadian rhythmicity. Build. Environ. 2009, 44, 146–155. [Google Scholar] [CrossRef]
  26. Gul, S. Chromo therapy—An Effective Treatment Option or Just a Myth? Critical Analysis on the Effectiveness of Chromo therapy. Am. Res. J. Pharm. 2015, 1, 62–70. [Google Scholar]
  27. Nioi, A.; Roe, J.; Gow, A.; McNair, D.; Spinall, P. Seasonal Differences in Light Exposure and the Associations With Health and Well-Being in Older Adults: An Exploratory Study. HERD Health Environ. Res. Des. J. 2017, 10, 64–79. [Google Scholar] [CrossRef] [PubMed] [Green Version]
  28. Sloane, P.D.; Figueiro, M.; Garg, S.; Cohen, L.W.; Reed, D.; Williams, C.S.; Preisser, J.; Zimmerman, S. Effect of home-based light treatment on persons with dementia and their caregivers. Light. Res. Technol. 2015, 47, 161–176. [Google Scholar] [CrossRef] [PubMed]
  29. Kinnunen, K.M.; Vikhanova, A.; Livingston, G. The management of sleep disorders in dementia: An update. Curr. Opin. Psychiatry 2017, 30, 491–497. [Google Scholar] [CrossRef]
  30. Peeters, S.T.; Smolders, K.C.; de Kort, Y.A. What you set is (not) what you get: How a light intervention in the field translates to personal light exposure. Build. Environ. 2020, 185, 107288. [Google Scholar] [CrossRef]
  31. Dallery, J.; Cassidy, R.N.; Raiff, B.R. Single-case experimental designs to evaluate novel technology-based health interventions. J. Med. Internet Res. 2013, 15, e22. [Google Scholar] [CrossRef] [PubMed]
  32. Krasny-Pacini, A.; Evans, J. Single-case experimental designs to assess intervention effectiveness in rehabilitation: A practical guide. Ann. Phys. Rehabil. Med. 2018, 61, 164–179. [Google Scholar] [CrossRef]
  33. Smith, J.D. Single-case experimental designs: A systematic review of published research and current standards. Psychol. Methods 2012, 17, 510–550. [Google Scholar] [CrossRef] [Green Version]
  34. Sekiguchi, H.; Iritani, S.; Fujita, K. Bright light therapy for sleep disturbance in dementia is most effective for mild to moderate Alzheimer’s type dementia: A case series. Psychogeriatrics 2017, 5, 275–281. [Google Scholar] [CrossRef]
  35. Rasquin, S.M.C.; Willems, C.; De Vlieger, S.; Geers, R.P.J.; Soede, M. The Use of Technical Devices to Support Outdoor Mobility of Dementia Patients. Technol. Disabil. 2007, 19, 113–120. [Google Scholar] [CrossRef]
  36. Hein, A.; Krüger, F.; Bader, S.; Eschholz, P.; Kirste, T. Challenges of Collecting Empirical Sensor Data From People with Dementia in a Field Study. In Proceedings of the 2017 IEEE International Conference on Pervasive Computing and Communications Workshops (PerCom Workshops), Kona, HI, USA, 13–17 March 2017; pp. 22–25. [Google Scholar] [CrossRef]
  37. Corrà, M.F.; Warmerdam, E.; Vila-Chã, N.; Maetzler, W.L.; Maia, L. Wearable Health Technology to Quantify the Functional Impact of Peripheral Neuropathy on Mobility in Parkinson’s Disease: A Systematic Review. Sensors 2020, 20, 6627. [Google Scholar] [CrossRef]
  38. Bonci, T.; Keogh, A.; Del Din, S.; Scott, K.C.; Mazzà, C. An Objective Methodology for the Selection of a Device for Continuous Mobility Assessment. Sensors 2020, 20, 6509. [Google Scholar] [CrossRef] [PubMed]
  39. Kieboom, R.; Bongers, I.; Mark, R.; Snaphaan, L. Protocol: Innovate Dementia 2.0: A user-driven living lab for assistive technology to support people living at home with dementia. JMIR Res. Protoc. 2018, 8, e10952. [Google Scholar] [CrossRef]
  40. World Medical Association Declaration of Helsinki. Ethical Principles for Medical Research Involving Human Subjects; Bulletin of the World Health Organization; World Health Organization: Geneva, Switzerland, 2001; Volume 79, pp. 373–374. [CrossRef] [Green Version]
  41. American Psychiatric Association. Diagnostic and Statistical Manual of Mental Disorders, 5th ed.; American Psychiatric Association: Washington, DC, USA, 2013. [Google Scholar] [CrossRef]
  42. CIE; International Commission on Illumination. CIE Position Statement on Non-Visual Effects of Light—Recommending Proper Light at the Proper Time. Available online: https://cie.co.at/files/CIE%20Position%20Statement%20-%20Proper%20Light%20at%20the%20Proper%20Time%20(2019)_0.pdf (accessed on 17 October 2021).
  43. Open Science Framework OSF Home Page. Available online: https://osf.io/5au6g/?view_only=5083989abe0f424487c8f4529afcf10b (accessed on 17 October 2021). [CrossRef]
  44. Spitschan, M. Luox: Platform for Calculating Quantities Related to Light and Lighting [Software]. Available online: https://luox.app/ (accessed on 17 October 2021).
  45. Spitschan, M.; Mead, J.; Roos, C.; Lowis, C.; Griffiths, B.; Mucur, P.; Herf, M. Luox: Novel Validated Open-Access and Open-Source Web Platform for Calculating and Sharing Physiologically Relevant Quantities for Light and Lighting. Available online: https://wellcomeopenresearch.org (accessed on 17 October 2021). [CrossRef]
  46. Bouwmeester, S.; Jongerling, J. Power of a randomization test in a single case multiple baseline AB design. PLoS ONE 2020, 15, e0228355. [Google Scholar] [CrossRef] [PubMed]
  47. Onghena, P.; Edgington, E.S. Customization of pain treatments: Single-case design and analysis. Clin. J. Pain 2005, 21, 56–72. [Google Scholar] [CrossRef]
  48. Aarts, M.; Duijnhoven, J.; Aries, M.; Rosemann, A.L.P. Performance of personally worn dosimeters to study non-image forming effects of light: Assessment methods. Build. Environ. 2017, 117, 60–72. [Google Scholar] [CrossRef]
  49. Koninklijk Nederlands Meteorologisch Instituut (KNMI). Available online: https://weerstatistieken.nl/eindhoven/2019/oktober (accessed on 16 June 2021).
  50. Huang, S.S.; Wang, W.F.; Liao, Y.C. Severity and prevalence of behavioral and psychological symptoms among patients of different dementia stages in Taiwan. Arc. Clin. Psychiatry 2017, 44, 89–93. [Google Scholar] [CrossRef] [Green Version]
  51. Van Den Kieboom, R.C.; Bongers, I.M.; Mark, R.E.; Snaphaan, L.J. User-Driven Living Lab for Assistive Technology to Support People Living at Home with Dementia: Protocol for Developing Co-Creation-Based Innovations. JMIR Res. Protoc. 2019, 8, e10952. [Google Scholar] [CrossRef] [PubMed]
  52. Astell, A.; Ellis, M.; Bernardi, L.; Alm, N.; Dye, R.; Gowans, G. Using a touch screen computer to support relationships between people with dementia and caregivers. Interact. Comput. 2010, 22, 267–275. [Google Scholar] [CrossRef]
  53. Meiland, F.; Innes, A.; Mountain, G. Technologies to Support Community-Dwelling Persons With Dementia: A Position Paper on Issues Regarding Development, Usability, Effectiveness and Cost-Effectiveness, Deployment, and Ethics. JMIR Rehabil. Assist. Technol. 2017, 4, e6376. [Google Scholar] [CrossRef]
  54. Koskinen, I.; Zimmerman, J. Design Research Through Practice. In Computer Graphics; Elsevier Science Ltd.: Waltham, MA, USA, 2018. [Google Scholar]
Figure 1. The used lighting system: (left) Waldmann VTL-lamp; (right) LIFX dynamic light bulb.
Applsci 11 10221 g001
Figure 2. (a) Spectral distributions measured in the middle of dynamic phases as reported in Table 2: measured at 07:15 a.m., 08:30 a.m., and 12:30 p.m. (b) Spectral distributions measured in the middle of dynamic phases as reported in Table 2: measured at 16:30 p.m., 18:30 p.m., and 20:15 p.m. Note: Full stimulus specification tables and spectra are publicly available via the OSF [41]. Graphs and stimulus specifications were generated with the Luox platform [42], companion paper [43].
Applsci 11 10221 g002
Figure 3. The LYS button and a smartphone.
Applsci 11 10221 g003
Figure 4. Responses to a short follow-up survey regarding the experiences of the participants with respect to the living room and bedroom.
Applsci 11 10221 g004
Table 1. Participant and caregiver demographic variables at baseline (n = 11).
GenderParticipantsCaregivers
Male63
Female58
Dementia type
Alzheimer’s8
Lewy body2
Frontotemporal1
Relationship with participant
Spouse 8
Daughter (in-law) 3
Mean age (SD)78.1 (8.56)68.2 (11.59)
Mean MMSE score (SD)24.55 (2.3)
Table 2. Estimated illuminance and equivalent daylight (D65) illuminance (EDI) based on the task/lap and eye levels of the free-floor standing luminaire.
Phase DescriptionCCTTask Lighting
(Ehorizontal at Lap Level)
Personal Exposure
(Evertical at Eye Level)
FromToIntensityColor Illuminance (lx)EDImel
(lx)
Illuminance
(lx)
EDImel
(lx)
7:00 a.m.7:30 a.m.Fast increaseCool white6000 K0–10000–11000–3500–370
7:30 a.m.9:30 a.m.Slow increaseRegular white6000–4000 K1000–26001100–2300350–850370–770
9:30 a.m.3:30 p.m.StableRegular white4000 K26002300850770
3:30 p.m.5:30 p.m.Slow dimmingWarm white4000–3000 K2600–13001700–700850–430580–250
5:30 p.m.7:30 p.m.Very slow
dimming
Warm white3000 K1300–650800–300430–220270–100
7:30 p.m.9:00 p.m.Very slow
dimming
Very warm white2500–2250 K350–0115–0115–040–0
Note: Estimates based on measurements performed in a small white room without daylight, with a spectrometer fixed at the average estimated lap position to measure horizontal task illuminance and at the estimated eye position to measure vertical illuminance. This table reports the beginning and end states of dynamic phases. Numbers have been rounded off for readability.
Table 3. Results of the illuminance, CCT, and EDImel spectrometer values in phases A1 and B1 for the kitchen, bedroom, and living room measured vertically at eye level.
Illuminance (in lx)CCT (in lxK)EDImel (in lx)
KitchenBedroomLiving RoomKitchenBedroomLiving RoomKitchenBedroomLiving Room
A1B1A1B1A1B1A1B1A1B1A1B1A1B1A1B1A1B1
pp1417774119416540592444654516670438203152405563219527263
pp219581824919300035503603390944444456412241041215201965921312496
pp384772432030233243149311516006214350741784443782182918192
pp44812802613205021405029418040574620430042184185318964361413
pp548577227205130032703884160034242582418128371013771854
pp71147104776682575508543374782349848744247954893843069390
pp84398253212011013602894411553683521408641932063447116572892
pp937745152170877614386424648143459565343862555813117281528
pp10119722076695121037864140469034655629445376311641677860
pp1113352831053554843883621160033576018335010231935634299
pp12858411100051402661385324293417359429835432115420248
MeanDif674 1261 813 −28 567 −431 356 653 599
Sig.<0.001 <0.001 0.03 0.532 0.169 0.88 0.002 0.004 <0.001
Table 4. Mean lx log10 values and mean differences and p-values for all phases.
A1B1A2B2B1–A1A2–B1B2–A2
Participant 1MeanMdp2MdpMdp
pp1 1.401.211.35 −0.200.022 *0.140.031 *
pp2 2.291.841.50 −0.450.007 *−0.340.989
pp31.781.631.701.87−0.150.7630.080.7420.170.074 *
pp41.791.791.581.820.000.481−0.210.035 *0.240.041 *
pp51.801.671.631.61−0.130.853−0.040.339−0.020.551
pp71.961.921.652.07−0.040.678−0.270.008 *0.410.001 *
pp81.541.831.721.840.290.003 *−0.120.1270.120.152
pp91.441.551.651.770.110.1510.110.8160.120.161
pp101.491.521.581.740.020.3680.070.7950.160.044 *
pp112.282.35 0.070.247
pp121.681.851.772.200.170.068 *−0.080.2680.430.002
Overall Effects
Mean difference 30.039 −0.111 0.142
Cohen’s d 30.135 0.355 0.376
Sum p3.612 3.159 2.046
Overall p0.152 0.02 <0.001
1 Participants 1 and 2 had no valid observations for phase A1. Participant 6 dropped out of the study. Participant 11 had no valid observations for phases A2 and B2. 2 Individual p-values below 0.1 are marked with an asterisk. 3 Note that the overall mean difference and Cohen’s d were not used in the randomization test.
Table 5. Mean Kelvin values and mean differences and p-values for all phases.
A1B1A2B2B1–A1A2–B1B2–A2
Participant 1MeanMdp2MdpMdp
pp1 389632083460 −687.930.01 *251.970.131
pp2 451242154300 −297.420.01 *85.290.244
pp33779368733243566−91.780.608−362.910.03241.960.059 *
pp44137425938454179121.770.274−413.240.06 *333.860.119
pp54522424938144069−273.020.899−435.080.01254.690.096
pp74325389836883880−426.610.986−210.230.06 *191.600.061 *
pp84010384443584609−165.990.806514.080.99250.510.187
pp93410384738014370437.290.01−45.600.4568.330.003
pp104060385939184249−201.080.75958.740.59331.450.111
pp1136764006 330.160.058
pp123496411541494319619.530.007 *33.550.53170.520.179
Overall effects
Mean difference 339 −184 268
Cohen’s d 30.065 0.350 0.469
Sum p4.41 2.68 1.19
Overall p0.458 0.01 * <0.001 *
1 Participants 1 and 2 had no valid observations for phase A1. Participant 6 dropped out of the study. Participant 11 had no valid observations for phases A2 and B2. 2 Individual p-values below 0.1 are marked with an asterisk. 3 Note that the mean differences and Cohen’s d were not used in the randomization test.
Table 6. Results of the randomization tests for morning, afternoon, and evening.
MorningAfternoonEvening
Md 1Sum_ppMdSum_ppMdSum_pp
Illuminance
B1–A10.043.6640.1700.043.8380.2250.034.0680.312
B1–A20.114.5320.3070.202.9520.012 *0.163.2880.082
B2–A20.044.1060.1660.182.2310.001 *0.290.949<0.001 *
CCT
B1–A1257.663.1810.065−75.45.0240.724−43.884.4960.498
B1–A2160.083.9450.126191.622.7390.006 *218.612.6610.016 *
B2–A268.993.5290.054125.613.4610.046 *708.140.350<0.001 *
1 A positive difference indicates a higher mean for the first term.
Table 7. Results of the separate randomization tests apart for fall–winter and winter–spring.
Summer–FallWinter–Spring
Md 1Sum_ppMdSum_pp
Illuminance
B1–A1−0.052.2760.9040.230.8610.004 *
B1–A20.181.1290.003 *0.101.9810.487
B2–A20.101.6830.031 *0.180.3980.001 *
CCT
B1–A1−107.152.8230.920203.981.5920.082
B1–A2401.140.178<0.001 *−122.242.5410.819
B2–A2226.560.725<0.001 *330.200.433<0.001 *
1 A positive difference indicates a higher mean for the first term.
Publisher’s Note: MDPI stays neutral with regard to jurisdictional claims in published maps and institutional affiliations.

