Article

A Statistical Approach for Modeling Individual Vertical Walking Forces

1
Department of Sciences and Methods for Engineering (DISMI), University of Modena and Reggio Emilia, 42122 Reggio Emilia, Italy
2
INTERMECH MO.RE., Interdepartmental Research Center, University of Modena and Reggio Emilia, 42122 Reggio Emilia, Italy
3
Department of Engineering “Enzo Ferrari” (DIEF), University of Modena and Reggio Emilia, 41125 Modena, Italy
*
Author to whom correspondence should be addressed.
Appl. Sci. 2021, 11(21), 10207; https://doi.org/10.3390/app112110207
Submission received: 30 September 2021 / Revised: 23 October 2021 / Accepted: 27 October 2021 / Published: 31 October 2021

Abstract

:
This paper proposes a statistical approach for modeling vertical walking forces induced by single pedestrians. To account for the random nature of human walking, the individual vertical walking force is modeled as a series of steps and the gait parameters are assumed to vary at each step. Walking parameters are statistically calibrated with respect to the results of experimental tests performed with a force plate system. Results showed that the walking parameters change during walking and are correlated with each other. The force model proposed in this paper is a step-by-step model based on the description of the multivariate distribution of the walking features through a Gaussian Mixture model. The performance of the proposed model is compared to that of a simplified load model and of two force models proposed in the literature in a numerical case study. Results demonstrate the importance of an accurate modeling of both the single step force and the variability of the individual walking force.

1. Introduction

As a result of the increasing slenderness and liveliness of modern footbridges, the serviceability assessment against vibrations due to human excitation has become a key aspect in the design of this kind of structure. Reliable assessment of human-induced vibrations of footbridges relies mostly on adequate mathematical representation of the pedestrian loading. Over the years, several time-domain force models have been proposed in the literature, most of them based on the same pedestrian load for any individual and on the assumption that both feet produce exactly the same periodic force [1,2]. The main gait parameters characterizing the walking process are the walking speed, step length, step width, pacing rate and force amplitude [3,4]. More recently, stochastic modeling approaches have gained increasing attention as they can provide a more realistic description of the random nature of the walking process. Indeed, the human-induced walking force is affected by the so-called inter-subject variability as well as the intra-subject variability. The former means that the walking gait parameters in a population of different individuals vary, while the latter represents the intrinsic variations in the gait parameters induced by a single individual step-by-step.
The inter-subject variability of the walking force is usually characterized through the mean value and the standard deviation of the average gait parameters within a studied population [5]. Several studies were performed to statistically characterize the pacing rate of the walking force, such as [6,7,8,9,10,11]. They found that the pacing rate followed a normal distribution with mean values ranging between 1.8 Hz and 2.2 Hz and standard deviations in the range [0.11; 0.3] Hz. Živanović [12] explained that the differences among the pacing rates obtained in the different studies are related to the different samples of people analyzed. As far as the step length l is considered, Pachi and Ji [9] observed that it is related to the pacing rate f s through the walking speed v by v = l f s . They also estimated that the pedestrians walked with a mean walking speed of 1.3 m/s. A correlation between the step length and the walking frequency was also suggested by Wheeler [13]. On the contrary, Živanović et al. [11] assumed that the pacing frequency and the step length are independent random variables, the latter following a normal distribution with mean value and standard deviation of 0.71 m and 0.071 m, respectively. The main study concerning the force amplitude is from Kerr and Bishop [8], who estimated the dynamic loading factors of the main forcing harmonics of the walking force, which increase with the pacing frequency. Similar studies were proposed by Ellis [14] and Rainer et al. [15].
Unlike inter-subject variability, intra-subject variability has often been neglected as its impact on vibration levels was traditionally considered insignificant [16]. Nevertheless, more recent studies demonstrated the great impact of the variability of individual walking force on the accuracy of the predicted vibration response [17,18,19]. As an example, Rezende et al. [18] demonstrated the impact of both the inter- and intra-subject variability on the tuned mass damper (TMD) efficiency through simulations involving pedestrian densities up to 0.5 ped/m2. Similarly, Ramos-Moreno et al. [19] highlighted the importance of considering the step frequency variability for individuals in simulations with multiple-pedestrian scenario (pedestrian densities of 0.2 ped/m2 and 0.2 ped/m2). To describe the intra-subject variability, the variation in the gait parameters induced by a single pedestrian step-by-step needs to be evaluated [16,20]. This variation can be expressed through the mean value and the standard deviation of the considered parameter. A few studies on this subject exist in the literature. Among these, Brownjohn et al. [21] measured the continuous walking force generated on a treadmill by three test subjects (TSs) walking at a self-selected pacing rate with different speeds. They observed that the coefficient of variation of the pacing frequency on a step-by-step basis is about 3%. Yamasaki et al. [22] found that the mean coefficient of variation of the step length ranges from 2% and 5% and depends on the walking speed and gender. A detailed description of the intra-subject variability has been proposed by Dang and Živanović [5], who statistically characterized the walking gait parameters of a population of ten TSs using a motion capture system that tracks human body movements.
The statistical description of the walking gait parameters can be used as a direct input for stochastic modeling. Based on the probabilistic approach, the vibration response can be expressed as a probability that a certain level of vibration will not be exceeded. Over the last decade, stochastic models for vertical human-induced excitations have been developed both in time [11,16,23] and frequency domain [21,24,25,26,27]. Among these, Živanović et al. [11] proposed a probability-based approach to predict the vibration response caused by a single pedestrian crossing the footbridge. The pedestrian force is described in the time domain, and the inter-subject variability is considered using the probability distributions of walking frequency, step length and force amplitude, while the intra-subject variability is included through the phase angle. The stochastic model proposed by Racic and Brownjohn [23] was developed starting from the analysis of 824 walking time histories collected from about 80 TSs and is able to replicate temporal and spectral features of real walking loads. Similarly, García-Diéguez et al. [16] presented a model of variable individual forces based on the vertical ground reaction forces measured in an experimental campaign involving 50 TSs walking on a treadmill. In the frequency domain, the random nature of human walking is accounted for by presenting the walking forces as auto-spectral densities [23,28,29]. The theory of turbulent wind on linear structures can be adopted to describe the correlation among pedestrians at different locations on the structure [24].
This paper proposes a framework for the statistical modeling of the vertical walking forces induced by single pedestrians on a rigid surface based on a step-by-step variation of gait parameters. Basically, the pedestrian walk is modeled as a series of consecutive steps, each one characterized by the typical M shape [1], where parameters of the given step are independent of those of the previous steps. The proposed mathematical model for the pedestrian gait takes inspiration from the well known application of Markov chains called “random walk” [30]. Gait parameters of each step are randomly extracted from their probability distributions. Statistical characteristics of the walking gait parameters are estimated from the experimental tests conducted to measure individual walking forces through the force plate system developed by Fontanili et al. [31]. Experimental tests involved three TSs and allowed measuring about 700 steps for each TS. The analysis of the experimental measurements demonstrated that walking features are related with each other and characterized by multivariate distributions. In this paper, multivariate distributions of the walking features are described through Gaussian Mixture (GM) models [32]. GM is an interesting approach to the problem of fitting multivariate distributions, since it depends on a limited number of parameters, can accurately approximate several practical distributions and can rely on simple algorithms for parameter estimation.
The main benefit of the proposed approach lies in the in-depth investigation of the correlation among the walking features and its accurate characterization through multivariate distributions. As the aim of the paper is to provide a framework for the statistical modeling of the walking force induced by single pedestrians and highlight the importance of faithful description of its random nature, experimental and numerical results refering to three TSs are presented. Results from a small number of test subjects allow us to show that the proposed procedure is suitable for real experimental data. Furthermore, the proposed approach can be used to calibrate a force model representative of the behavior of different individuals based on the results of experiments involving many test subjects.
The proposed walking model is adopted to predict the human-induced vibrations of a simply supported beam considering different footbridge parameters. The performance of the proposed model is compared to those of a simplified model presented in this paper and of two simulation models presented in the literature, namely the above-mentioned force model by Živanović et al. [11] and the single-step load model by Li et al. [33]. Both models are defined in the time domain: the former accounts for the intra-subject variability of the walking force while the latter is one of the few models proposed in the literature that defines the single foot force. Finally, the simplified model presented in this paper differs from the proposed one according to the definition of the single step force. Unlike the typical M shape, the foot force is assumed to be constant over the step duration. The comparison with this simplified model allows us to highlight the importance of a reliable description of the footfall forces.
The paper is organized as follows. Section 2 presents the experiments performed to measure the ground reaction forces, while Section 3 describes the proposed modeling approach. The statistical characterization of the walking features is performed in Section 4. Section 5 presents and compares the performance of the proposed model for the evaluation of human-induced vibrations in a numerical case study. Finally, conclusions are drawn in Section 6.

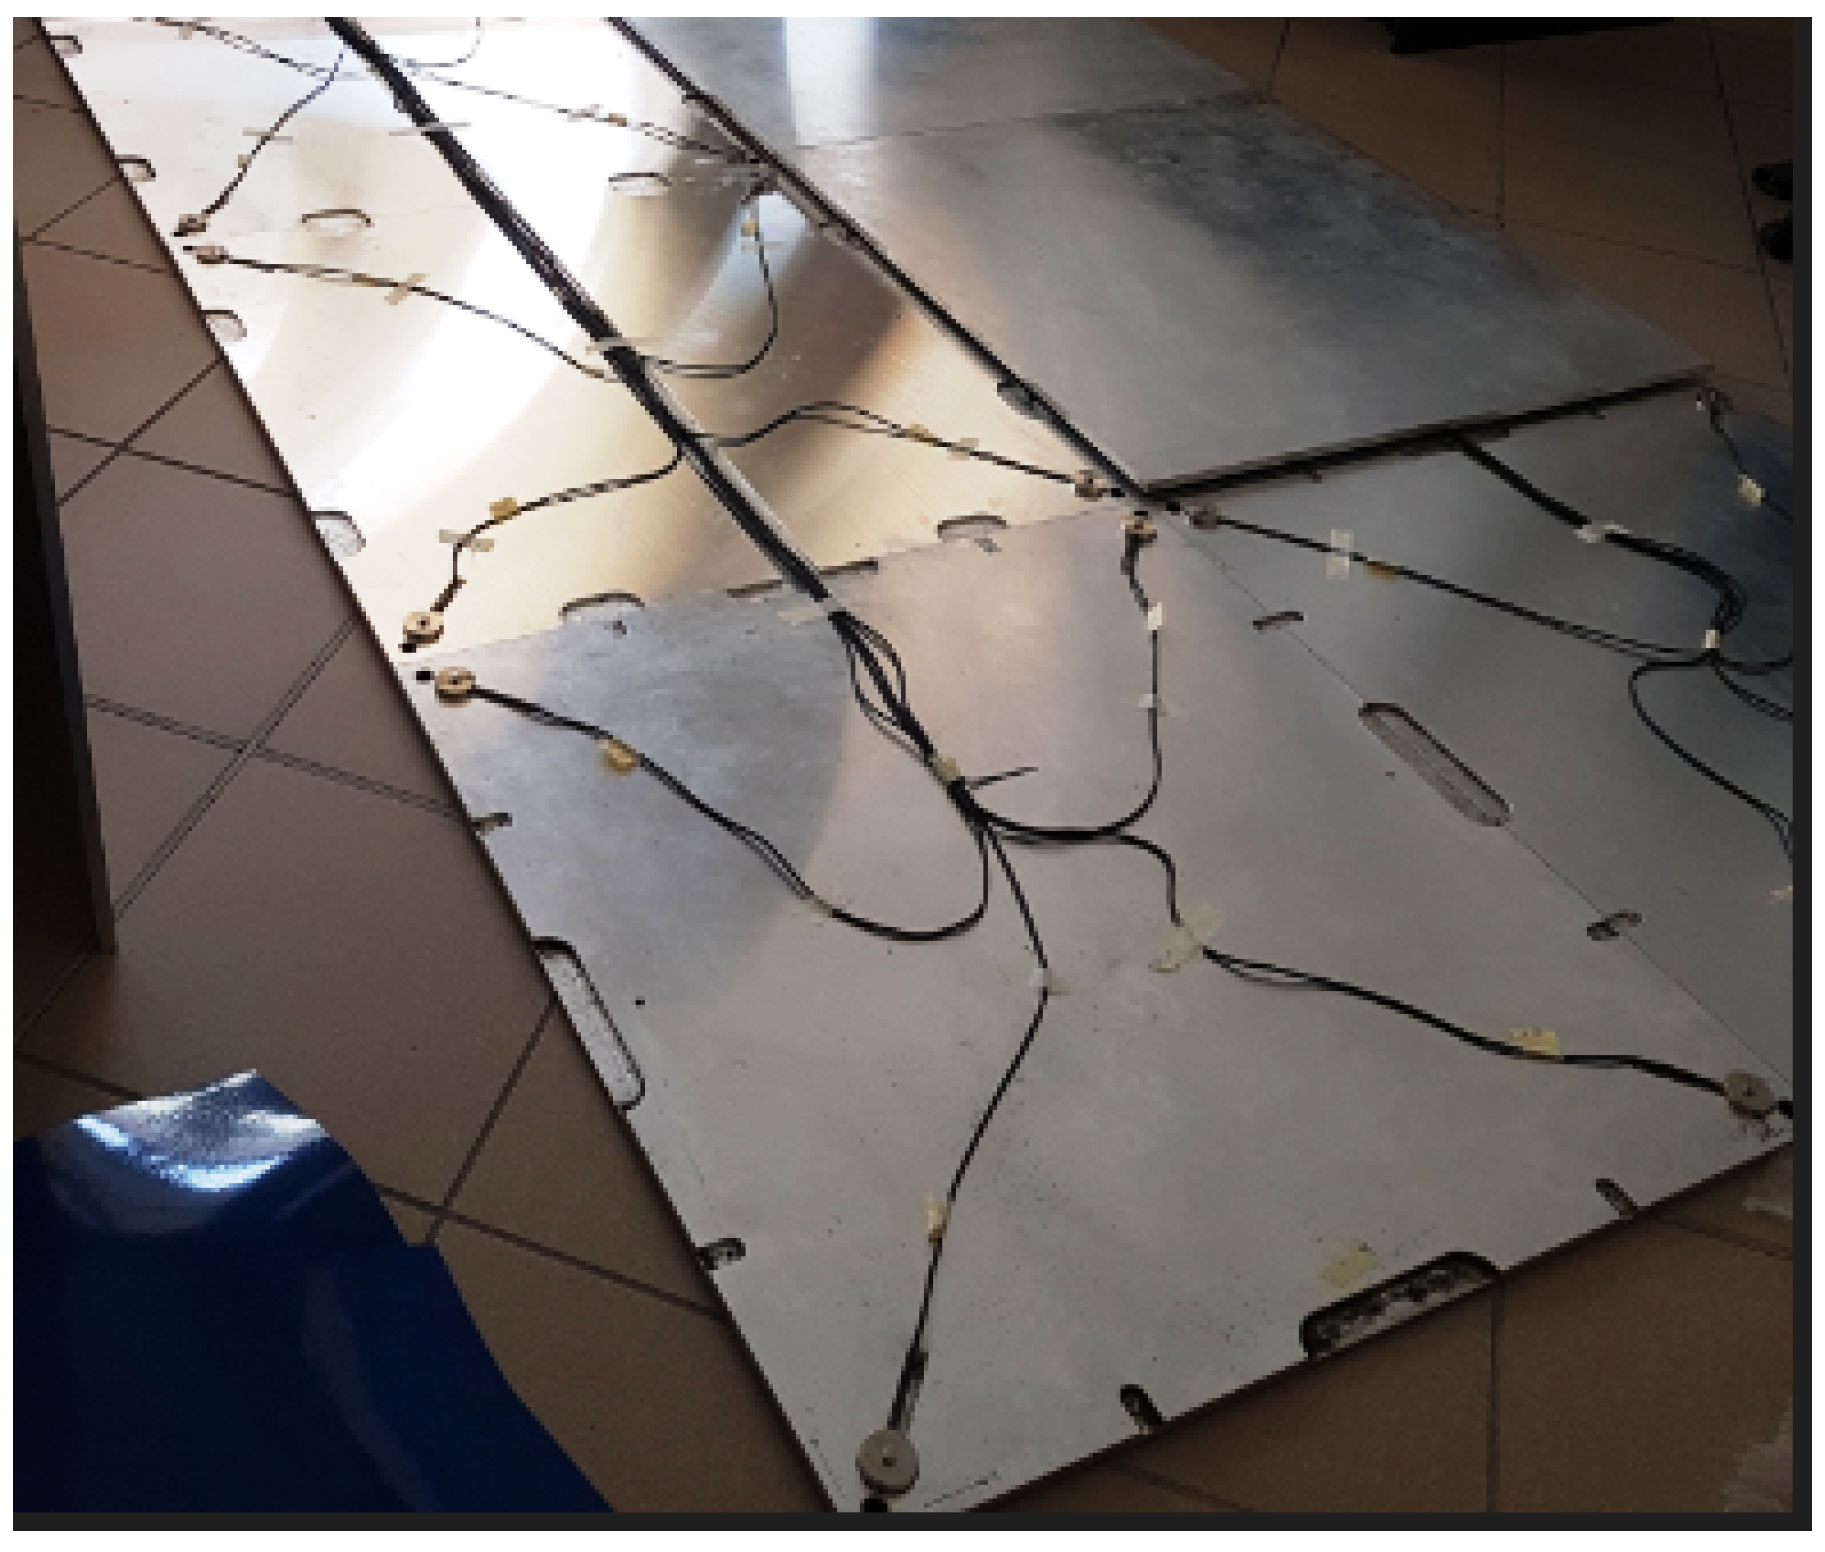
2. Experimental Setup and Measurements

Properties of pedestrian walking have been investigated through an experimental campaign at the University of Modena and Reggio Emilia, Department of Engineering “Enzo Ferrari” (Italy), which allowed measuring force, time and position of the vertical forces induced by single pedestrians on an instrumented floor. It is worth pointing out that this approach allows us to directly acquire the quantity of interest for the study of the footbridge. On the contrary, the measurement of the acceleration through an accelerometer, for instance, constrained to a foot, requires a suitable procedure to evaluate the step forces that may introduce large uncertainties. In fact, the human body is not a rigid system and the force applied to the floor cannot be simply inferred from the acceleration and the static mass of the person.
Ground reaction forces are measured adopting the force plate system developed by Fontanili et al. [31] and shown in Figure 1. Each unit of the force plate system is a stand-alone uniaxial force platform composed of two aluminum plates. The lower plate is constrained to the ground, hosts the force measurement devices and measures 1000 × 1000 × 12 (mm). The upper plate is 1000 × 1000 × 15 (mm) and allows the TS to walk on it. Load cells are installed between the plates, along the diagonals of the surface and at the farthest end from the plate center. A control unit acquires the signal from the four load cells in each force plate and transfers it to the management software that enables selecting the sampling frequency and viewing measurements. In the presented experiments, the sampling frequency was set to 100 Hz. Thanks to a specifically designed interface, data acquired from the four load cells are combined, and ground reaction forces as well as foot positions are evaluated for each force plate. The force plate system is characterized by a high flexibility and modularity, allowing us to set up the measuring surface on the basis of the test to perform.
To characterize the intra-subject variability of the walking force induced by single pedestrians, an instrumented walkway is built with two rows of force plates placed side by side. Tests involved three test subjects. The characteristics of the three TSs are summarized in Table 1.
Each walking test involved one person and was carried out as follows. First, the TS took a few steps before getting on the walkway, and then she walked through it with her self-selected comfortable walking speed. Once the TS left the walkway, she took a few more steps, turned around and crossed the walkway in the opposite direction. The TS kept walking back and forth for the whole duration of the test, namely 10 min. The steps taken before getting on the walkway allowed the TS to get used to her comfortable walking speed and achieve a natural rhythm when she made contact with the force plate. The TS walked astride the center of the walkway so that the right food was placed on the right row of force plates and vice versa. Note that the pacing was not prompted by any device (e.g., a metronome) and the pacing rate was determined only from the post-processing of the measured signal.
Since the time histories of the right and left foot are separately recorded by the two rows of force plates, the vertical force induced by a single step can be clearly recognized from the measurements. Figure 2 shows an example of the time histories of the right and left foot along with the continuous walking force obtained by adding the contribution of both feet. A total of about 700 single step forces were collected for each TS.
The analysis of the experimental data presented in Section 4 has shown that the main gait parameters describing the walking force are random variables correlated each other. This is reflected in the statistical model proposed in the following section.

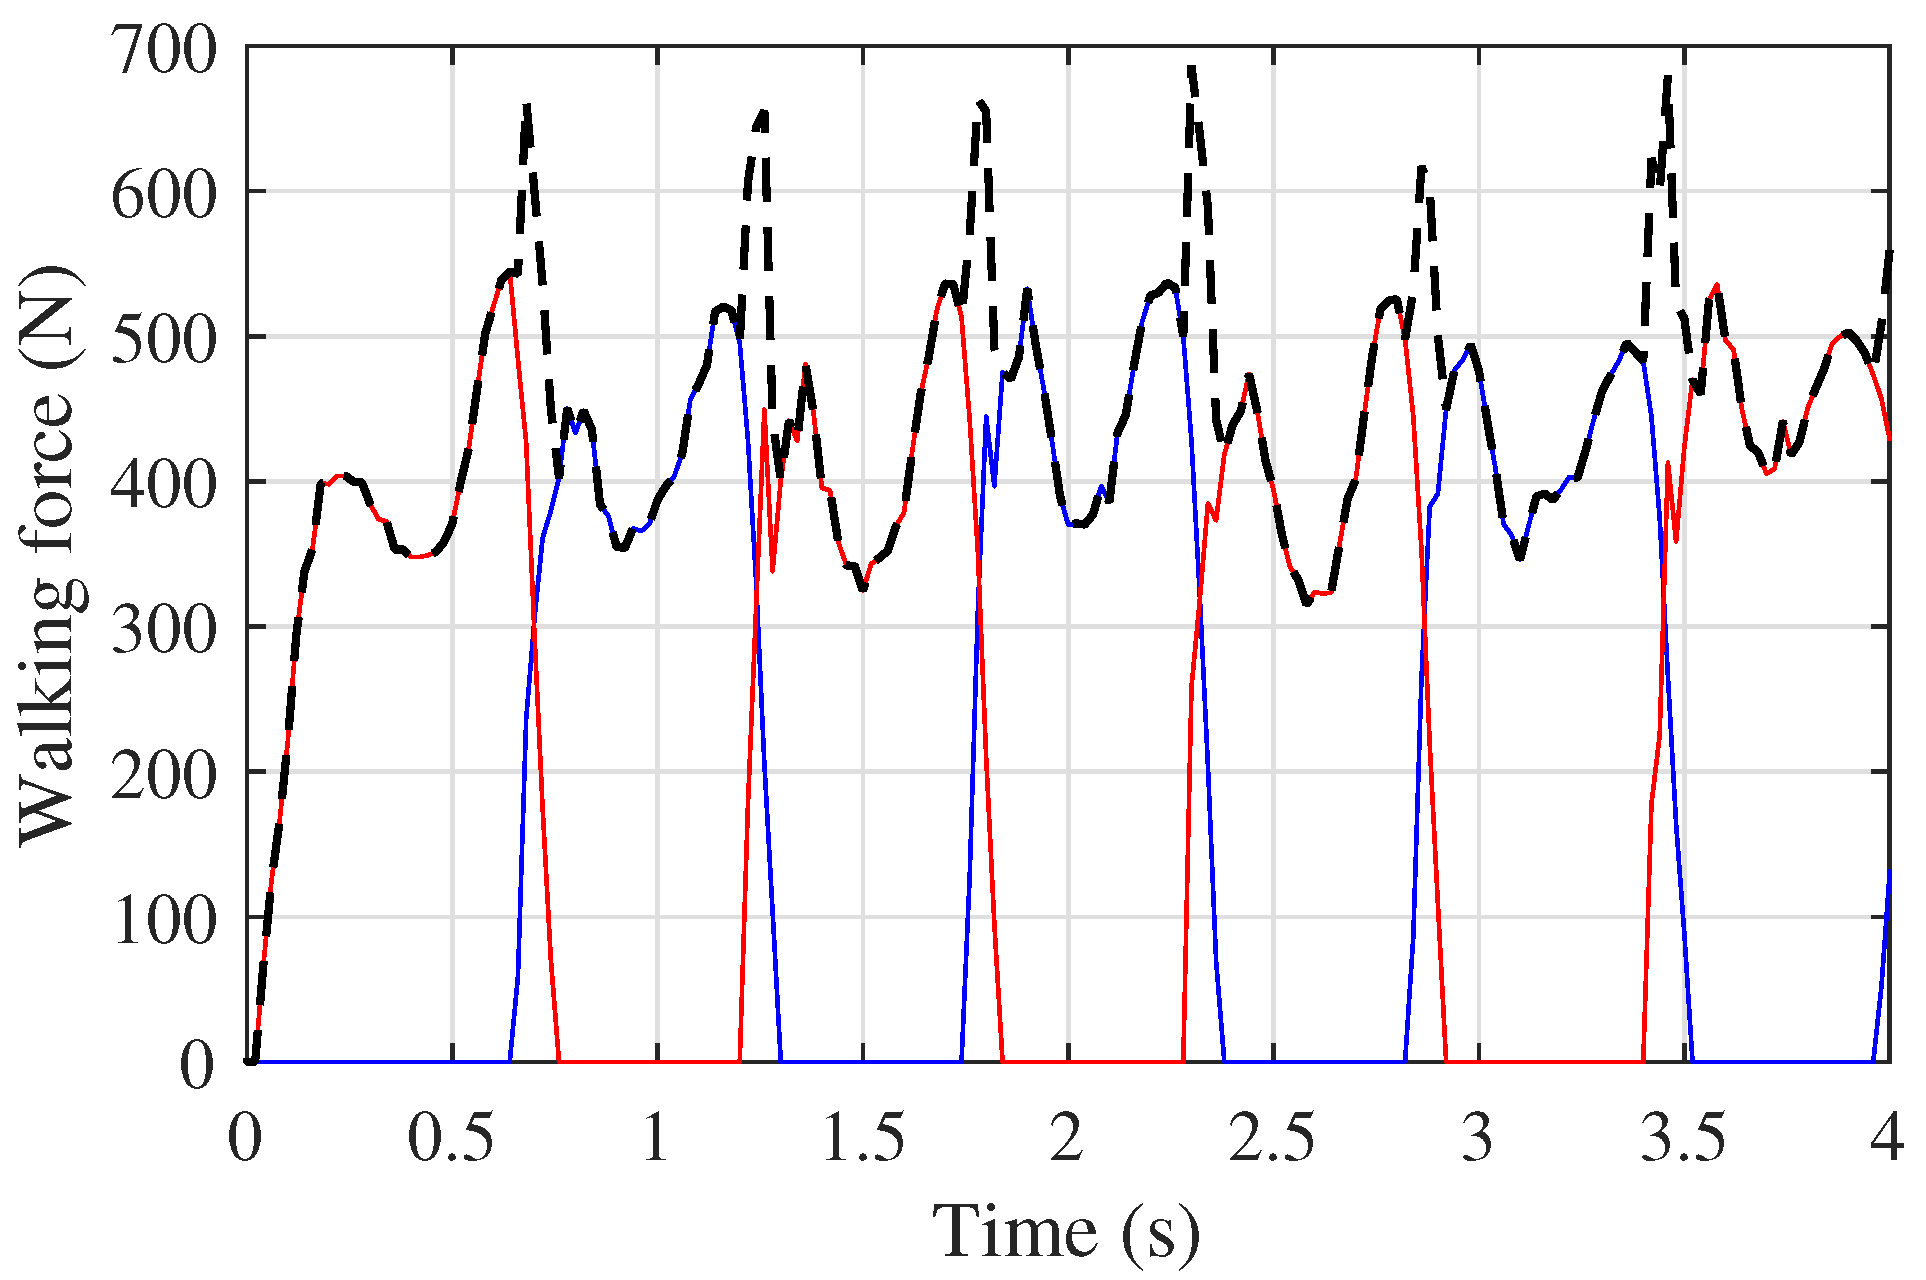
3. Walking Force Models

The approach proposed in this paper is based on the modeling of the individual walking force as a series of moving footsteps. To account for the intra-subject variability of the walking force, the gait parameters of the single foot force are defined as random variables. Walking parameters of the given step are assumed as independent of those of the previous, and they are randomly extracted from the multivariate distributions described in Section 4. On the one hand, this approach is able to grasp the individual variability of the gait, since the steps of the same person are never identical to each other. On the other hand, the proposed model is memoryless, such that it is not able to describe particular event as a stumble or a collision. This approach takes inspiration from the well-known application of Markov chains called “random walk” [30]. In practice, the position of the agent is given by a sequence of steps, where the position of each step depends only on the position of the previous step. In the classical random walk, the step direction is uniformly distributed between 0 , 2 π , and the step size depends on the specific phenomenon under investigation. However, in our scenario, the pedestrian is walking towards a given endpoint, so its direction cannot be uniformly distributed.
The force model proposed in this paper is thoroughly described as follows (Section 3.2). For comparison purposes, a simplified model is also defined (Section 3.1), which differs from the proposed one by the definition of the single foot force. In the proposed model, the typical M shape of the vertical foot force is assumed, while in the simplified model the step force is supposed to be constant over the step duration.

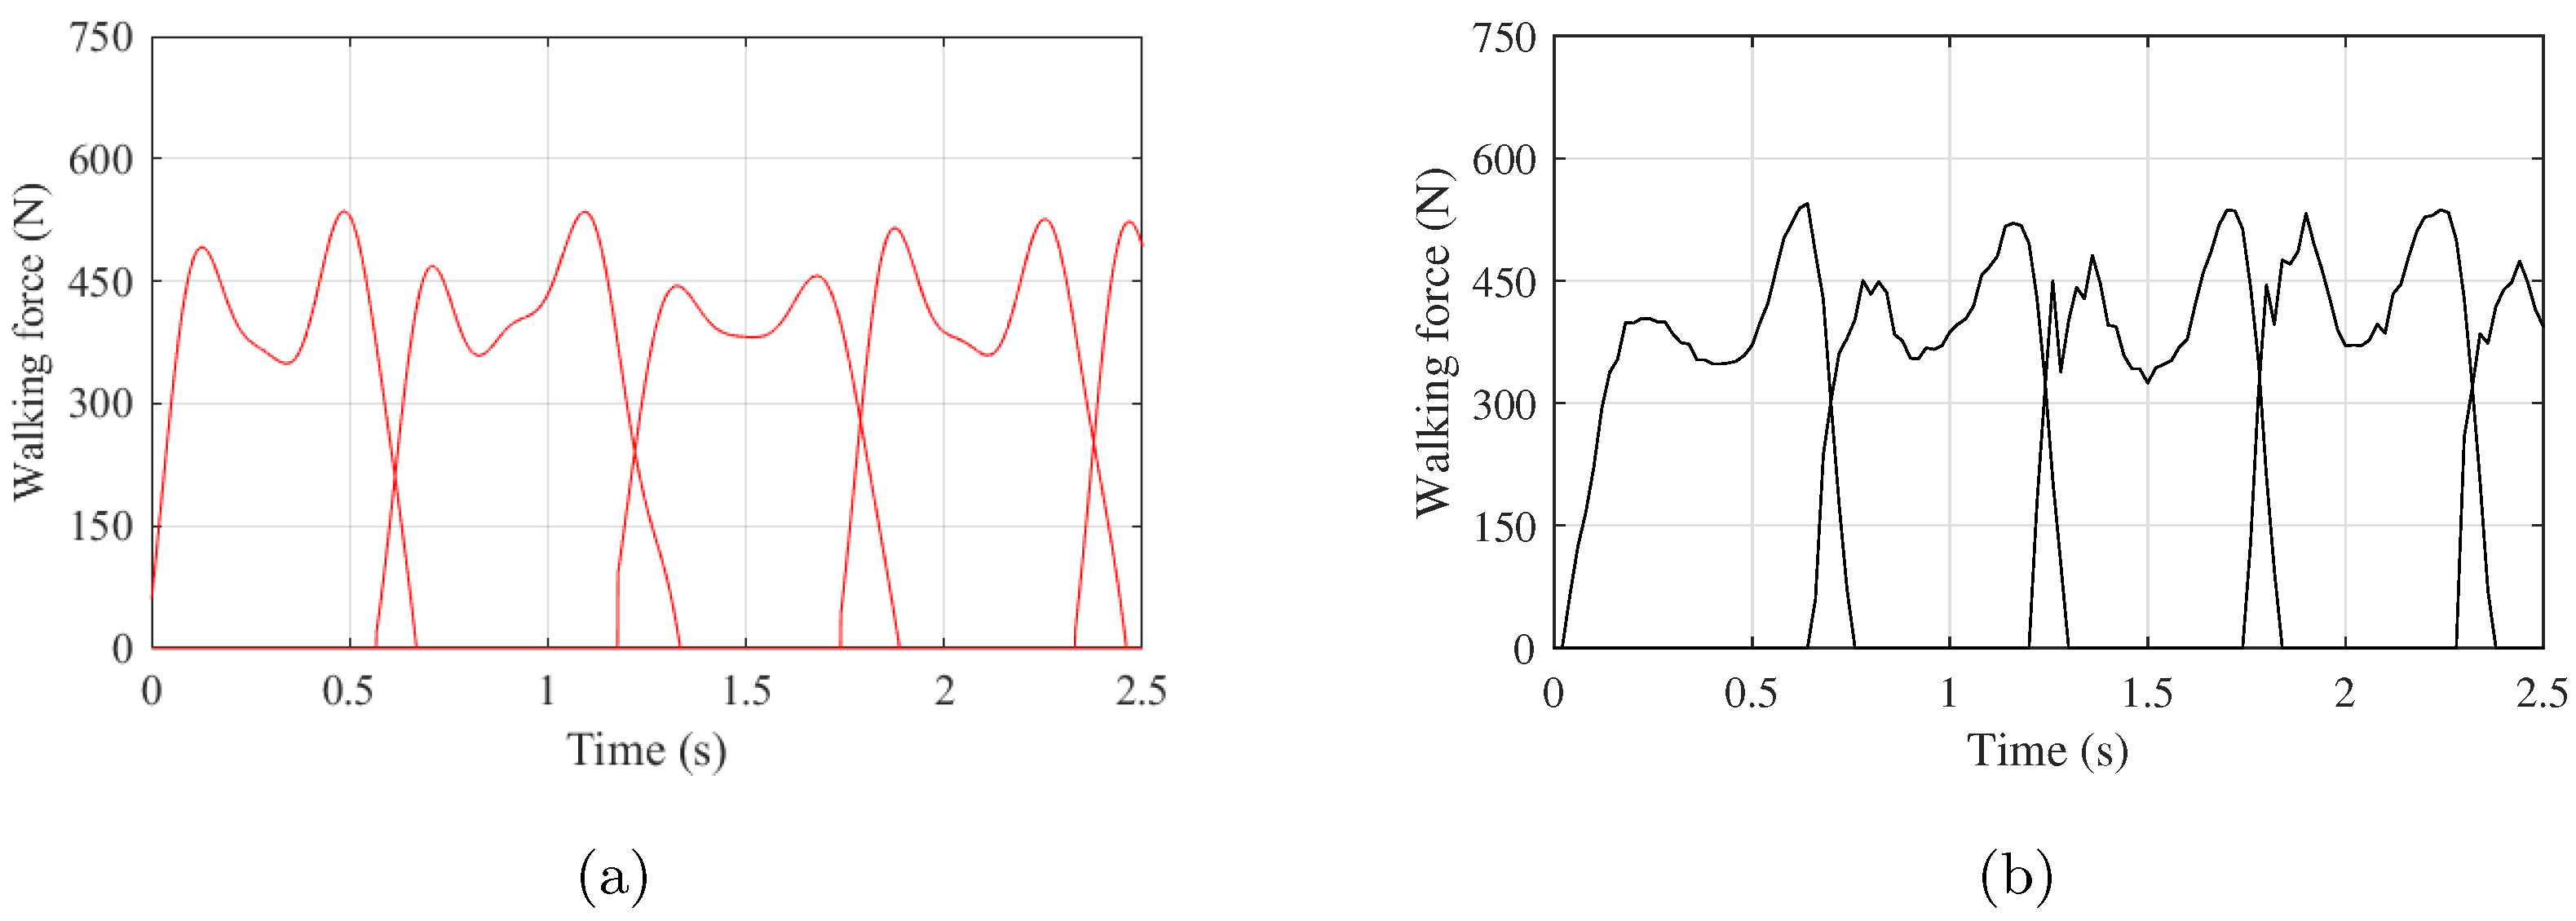
3.1. Proposed Force Model

The proposed force model is based on the assumption that the single foot force presents the typical M shape. Hence, the dynamic force P m , k ( t ) induced by the kth step is described by a Fourier series as follows:
P m , k ( t ) = 0 t < T i , k n = 1 4 A n , k cos ( n 2 π f s , k t + Φ n , k ) T i , k t T i , k + T c , k 0 t > T i , k + T c , k
where n is the harmonic number, A n , k (N) and Φ n , k (-) are the amplitude and phase shift of the nth harmonic and f s , k (Hz) is the walking frequency. The contribution of four harmonics is accounted for as we found that the first four harmonics allow for an accurate description of the measured foot forces. The variable t (s) denotes time, T i , k (s) and T c , k (s) are, respectively, the instant of application and the duration of the contact between the foot and the ground. Hereafter, the subscript k (if present) denotes the kth step; however, sometimes the subscript k is dropped to simplify notation and increase readability. The instant of application T i , k of the kth step can be expressed as a function of the previous k 1 steps:
T i , k = i = 0 k 1 T s , i
where T s , i ( s ) is the time elapsed between the two successive heel-strikes of steps i and i 1 , with T s , 0 = 0 . It is worth pointing out that step duration T c and walking period T s are related by T c = T s + Δ t , where Δ t (s) represents the period during which both feet are in contact with the ground.
The continuous walking force F m ( t ) in the time domain is modeled as a series of moving footsteps, each one described by Equation (1), i.e.,
F m ( t ) = k = 1 N p P m , k ( t )
where N p is the total number of considered steps.
To describe the continuous walking force, spatial parameters also need to be introduced. These are the step length l and the step direction θ , which are the polar representation of the coordinates where the foot force is applied. In particular, the step length l represents the distance between two successive heel-strikes.
According to the proposed load model, the pedestrian’s walking is described by ten gait parameters, each being a random variable: the period Δ t , the pacing frequency f s , the amplitudes A 1 , A 2 , A 3 , A 4 , the phase shifts Φ 1 , Φ 2 , the step length l, and the step direction θ . Note that the walking frequency f s is directly related to the walking period T s by f s = 1 / T s and the step duration T c can be evaluated from Δ t and T s . The phase shifts Φ 3 , Φ 4 are selected so that the walking forces at P m ( 0 ) and P m ( T c ) are as close as possible to zero. The state of the Markov chain at the kth step is described by S k = f s , k , A 1 , k , A 2 , k , A 3 , k , A 4 , k , Δ t k , l k , Φ 1 , k , Φ 2 , k , θ k . The geometrical interpretation of the proposed model is illustrated in Figure 3.
Figure 4 shows an example of the numerical single foot forces compared to the experimental ones. It is observed that the shape of the simulated step forces is qualitatively the same as the experimental ones, despite the differences due to the variability of the walking parameters.
Formally, this Markov chain is continuous in the state space S and discrete in “time”, since the process is represented by a countable sequence of steps. If we assume that the steps are independent and identically distributed, then the Markov chain is fully described by the transition probability density function (pdf) p S . Note that this Markov chain is stationary, i.e., the transition pdf does not depend on step index k. In practice, the proposed approach consists of devising the transition pdf p S from the experimental measurements as shown in Section 4 and on generating the random walk accordingly.

3.2. Simplified Force Model

A simplified version of the force model presented in Section 3.1 is described in the following. In this case, the single foot force is assumed to be constant over the step duration. The comparison among the results of these two models allow evaluating the effect of a reliable modeling of the single foot force. The dynamic force P s , k ( t ) induced by the kth step is described by a Fourier series as follows:
P s , k ( t ) = 0 t < T i , k A 0 , k T i , k t T i , k + T c , k 0 t > T i , k + T c , k
where A 0 , k [ N ] is the force amplitude. The continuous walking force is obtained by adding the contribution of each foot force:
F s ( t ) = k = 1 N p P s , k ( t )
The simplified load model is described by five parameters: the force amplitude A 0 , the period Δ t , the step duration T c , the step length l and the step direction θ . The state of the Markov chain at the kth step is described by the 5-tuple S k = A 0 , k , Δ t k , T c , k , l k , θ k . An example of consecutive steps modeled according the the simplified model is shown in Figure 5.

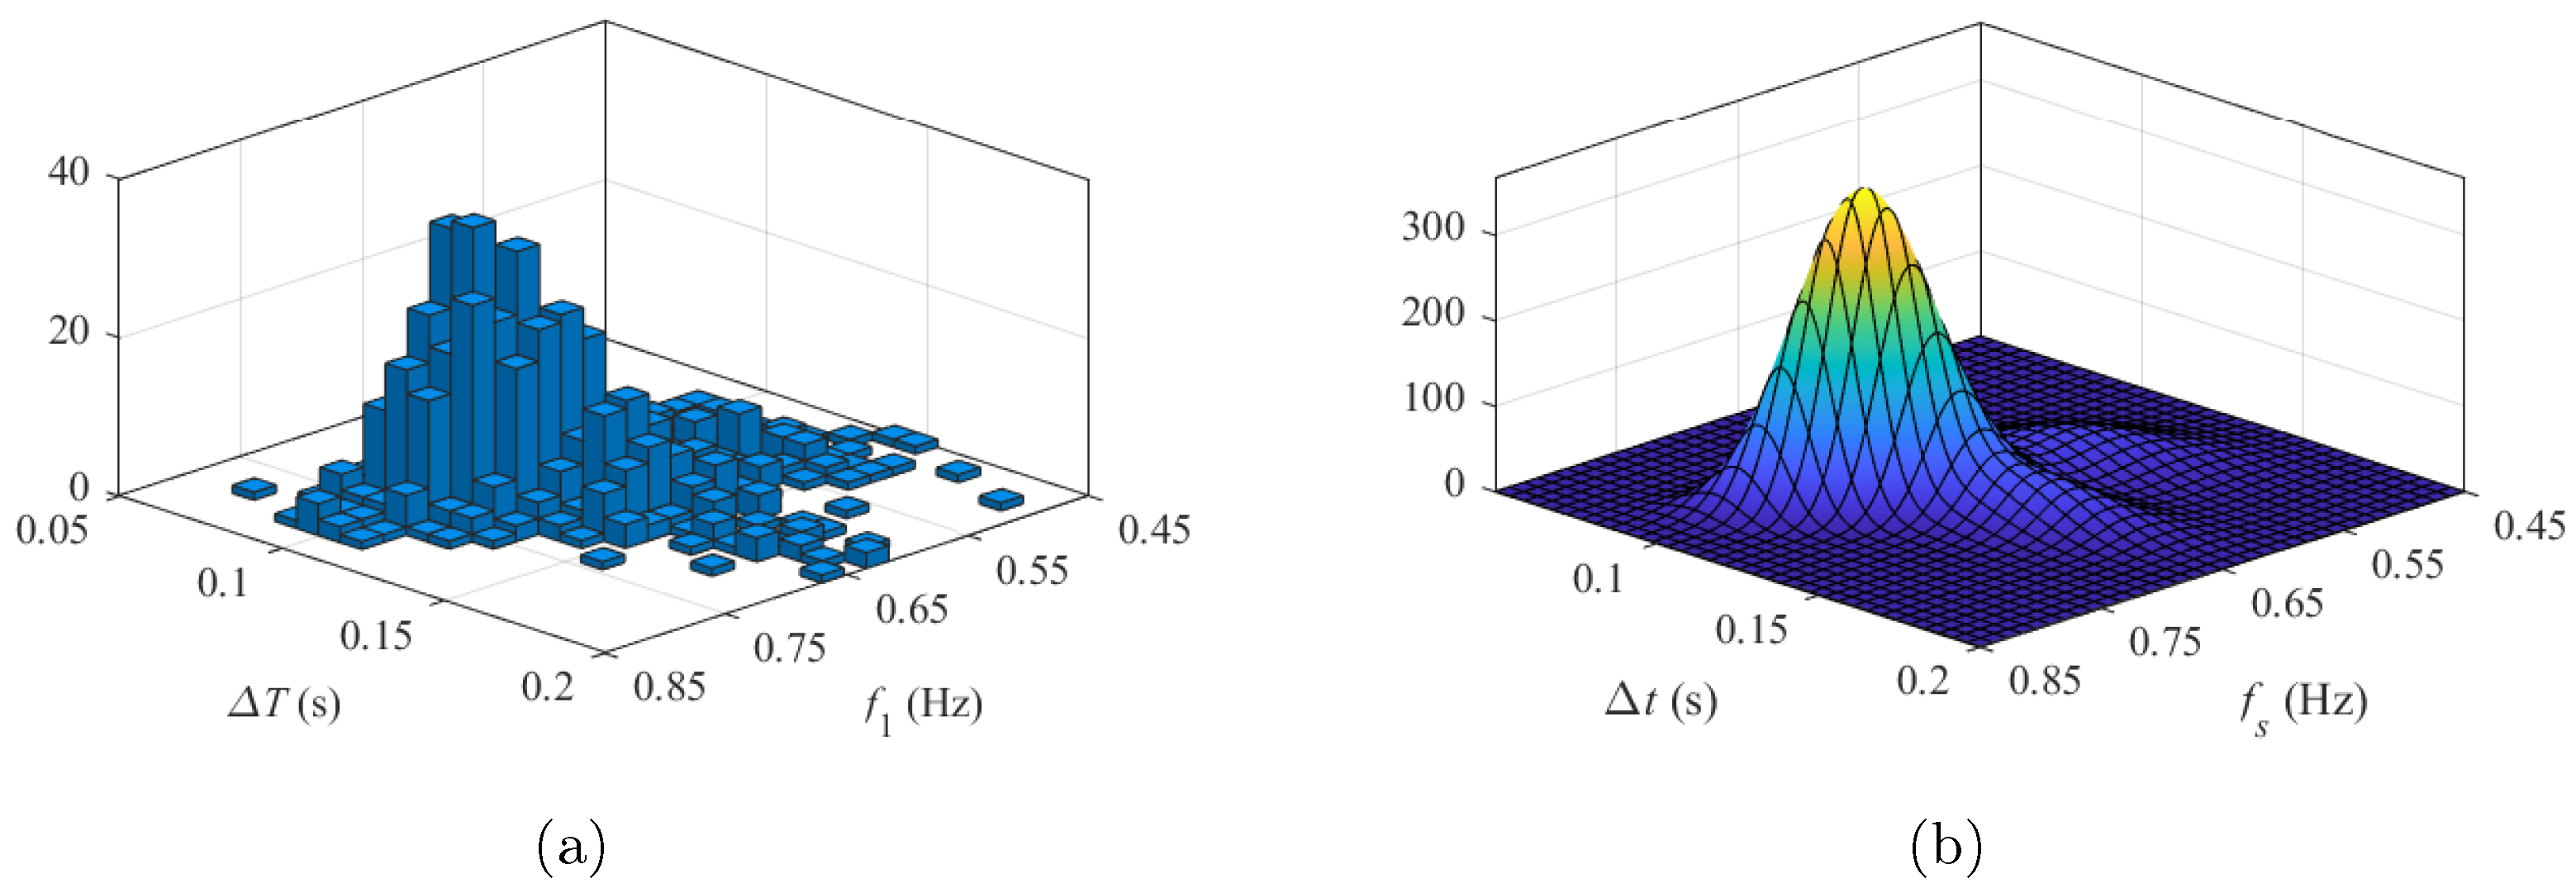
4. Statistical Characterization of the Walking Parameters

This section summarizes the procedure adopted to statistically characterize the walking parameters of the force models presented in Section 3.
  • For each TS, collect all the measured steps N s t e p .
  • For each step, evaluate the temporal and spatial parameters that characterize the force models of Section 3:
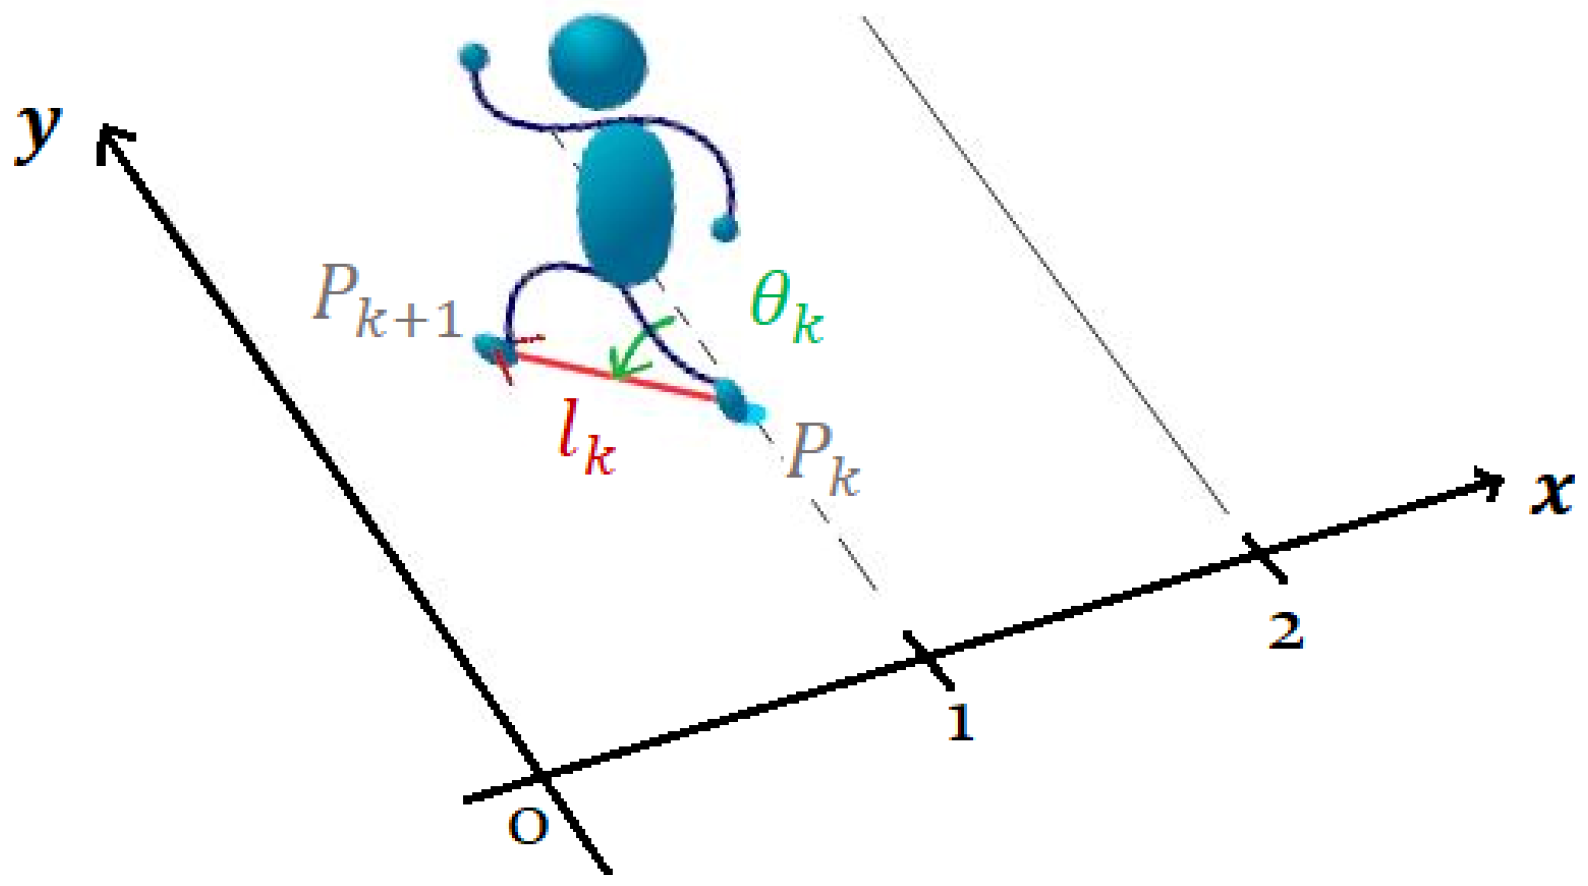
    For the proposed force model, the model parameters are: f s , A 1 , A 2 , A 3 , A 4 , Δ t , l, Φ 1 , Φ 2 and θ . In particular, the temporal feature Δ t is easily evaluated measuring the period during which the analyzed step overlaps the following one. The step frequency f s (equal to the frequency of the first harmonic), the amplitudes A 1 , A 2 , A 3 , A 4 and the phases Φ 1 , Φ 2 are evaluated based on a Fourier analysis of the measured step. Finally, the distance l and the direction θ from the step to the next one are evaluated considering the mid-position of the foot. These parameters are collected in three matrices, one for each TS, of dimensions N s t e p × 10 .
    For the simplified load model, the model parameters are: A 0 , T c , Δ t , l and θ . Besides the parameters previously described, the temporal parameter T c is evaluated measuring the total duration of the foot force while the amplitude A 0 of the constant footfall force is calculated so that the integrals of the experimental and simulated step forces over the step duration T c are the same. These parameters are collected in three matrices, one for each TS, of dimensions N s t e p × 5 .
  • For each TS, calculate the correlation matrices R starting from the parameter matrices defined in the previous step. Correlation matrices collect the pairwise linear correlation coefficient between each pair of walking parameters. Depending on the considered force model (proposed or simplified), the resulting matrices have dimensions 10 × 10 or 5 × 5 .
  • To devise general information, calculate the average correlation matrix R ¯ over the three TSs: Equations (6) and (11) for the proposed and simplified load model, respectively.
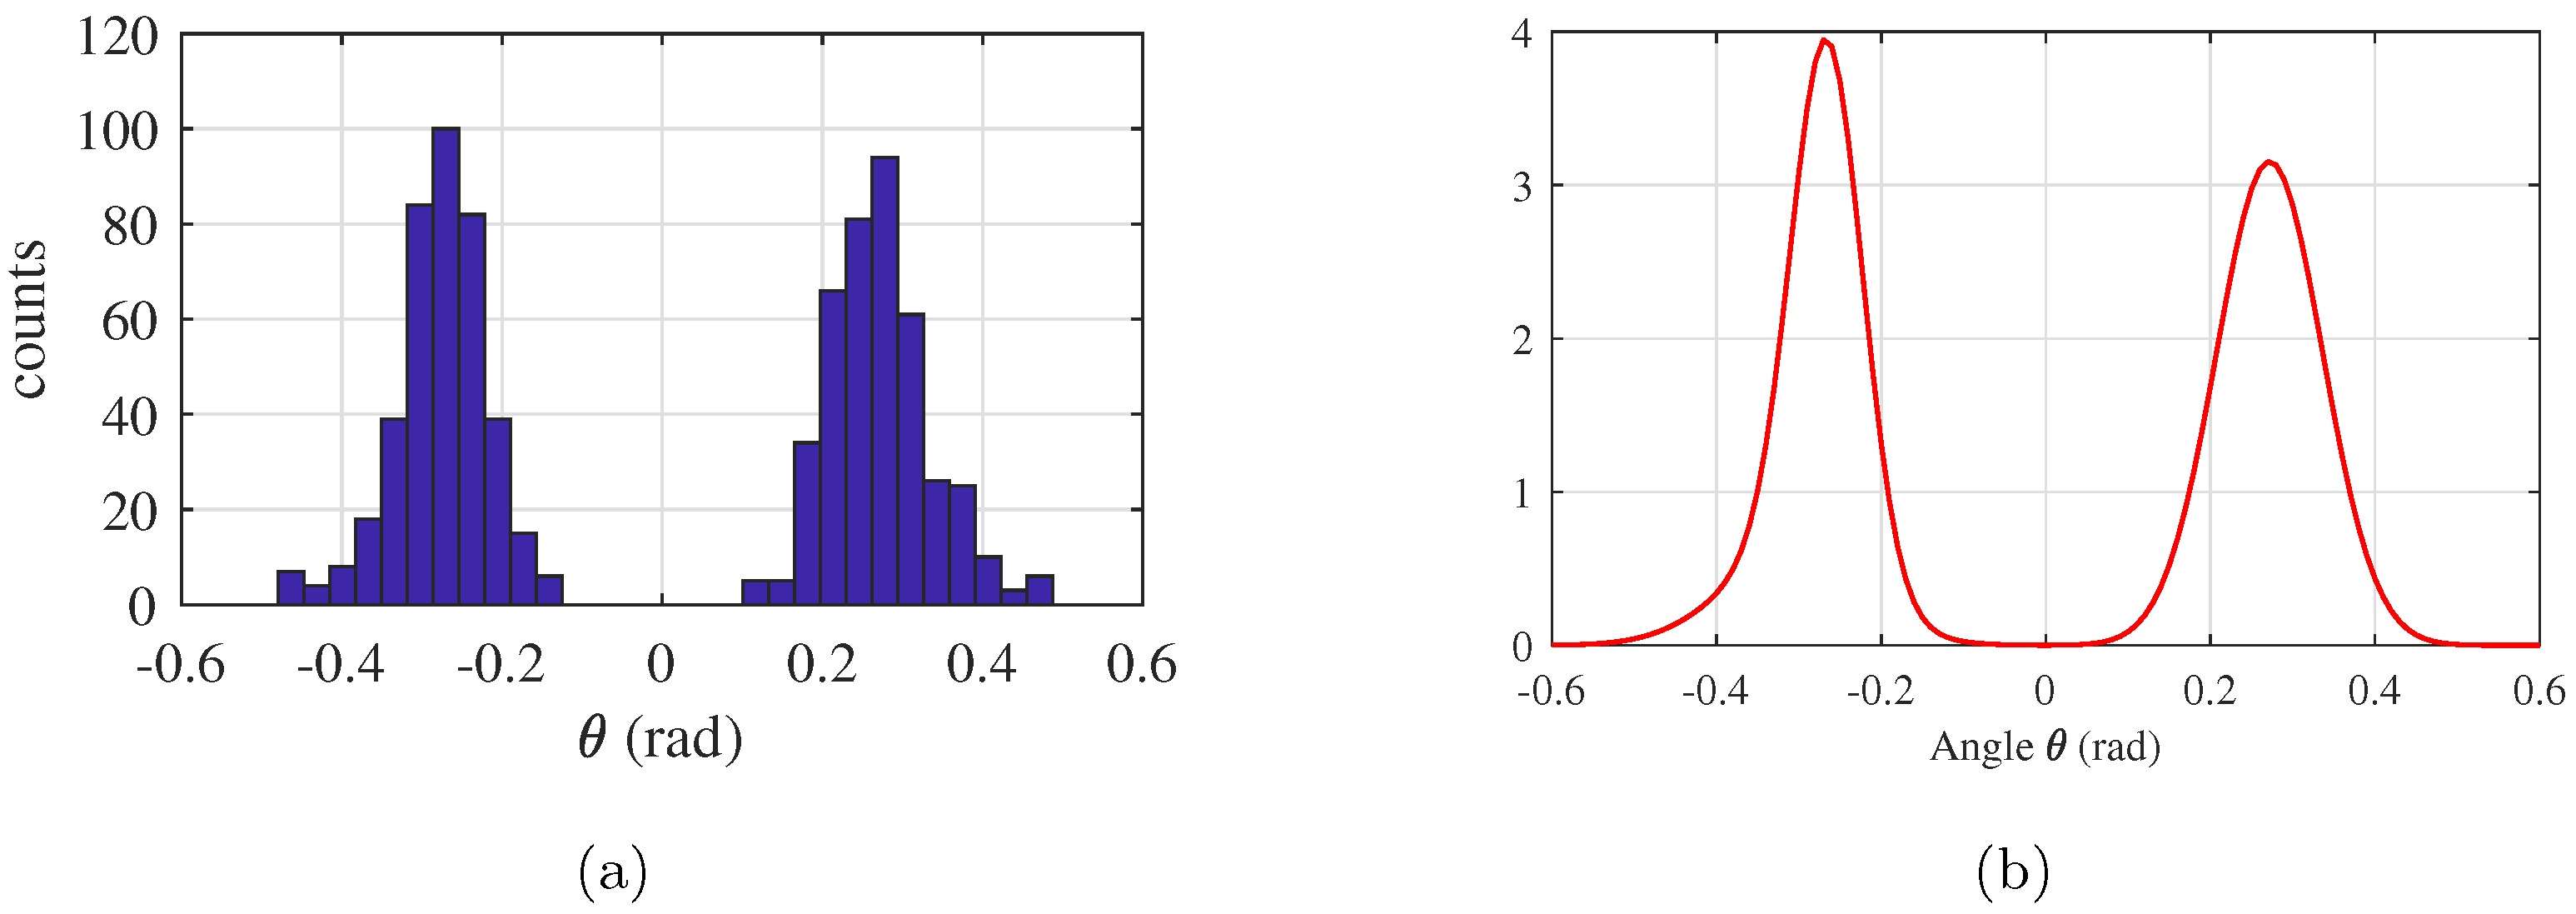
  • Based on the average correlation matrices, evaluate which parameters are correlated and which are not. For both force models, results show that all model parameters are correlated except for the step direction θ .
  • Assume a normal distribution for the uncorrelated model parameters and a multivariate distribution p S for the correlated parameters: Equation (7) for the proposed model and Equation (12) for the simplified one.
  • Fit the multivariate distributions adopting a Gaussian Mixture model [32]: Equation (10) for the proposed model and Equation (14) for the simplified one.
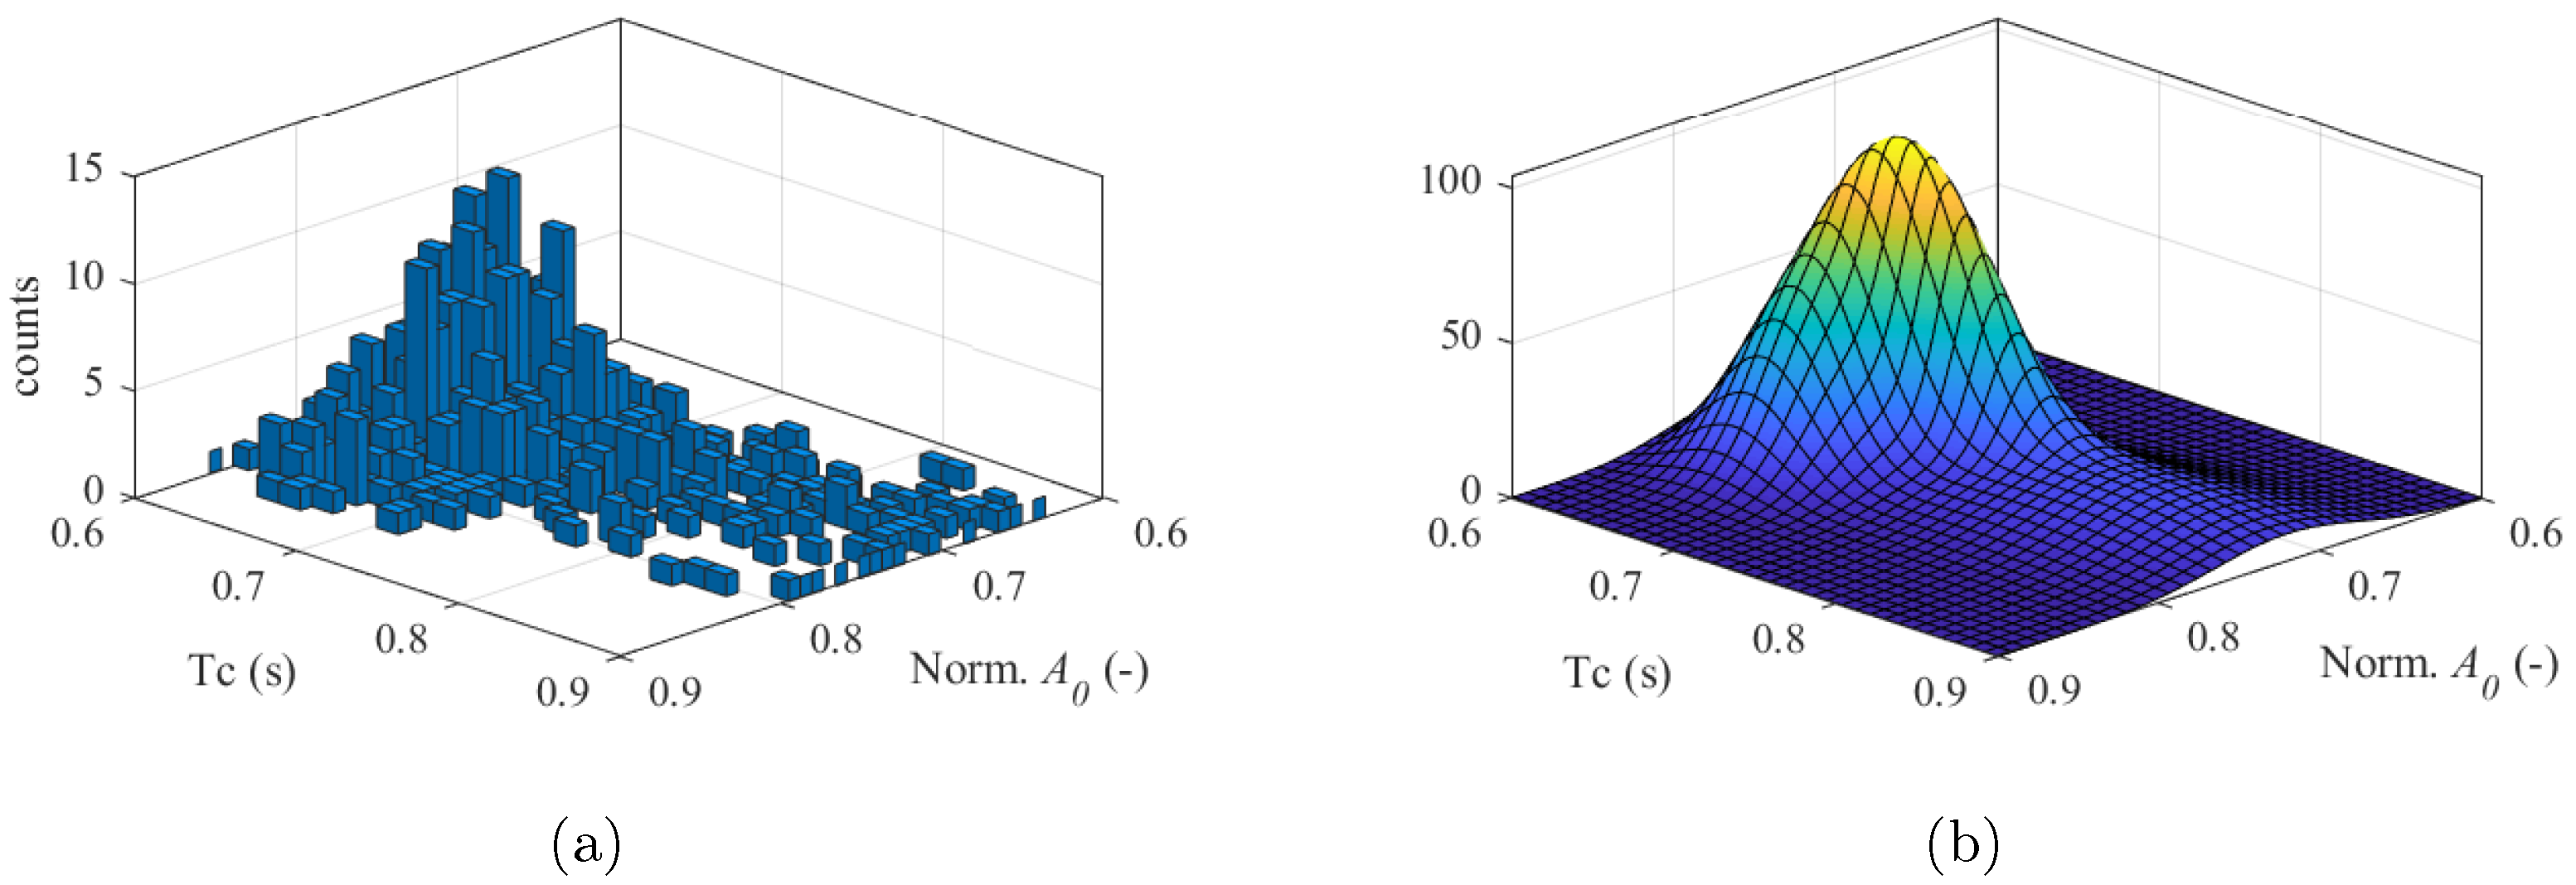
  • Assess the accuracy of the calibrated GM model through the Kolmogorov–Smirnov test [34].

4.1. Proposed Force Model

According to the procedure presented above, the average correlation matrix R ¯ = R ¯ i j computed from experimental measurements is:
R ¯ = 1.000 0.847 0.195 0.467 0.476 0.391 0.328 0.566 0.069 0.000 0.847 1.000 0.062 0.359 0.347 0.286 0.324 0.456 0.003 0.195 0.195 0.062 1.000 0.253 0.153 0.113 0.076 0.404 0.271 0.103 0.467 0.359 0.253 1.000 0.439 0.459 0.380 0.132 0.028 0.006 0.476 0.343 0.153 0.439 1.000 0.263 0.174 0.223 0.010 0.158 0.391 0.286 0.113 0.459 0.263 1.000 0.744 0.219 0.100 0.113 0.328 0.324 0.0760 0.380 0.174 0.744 1.000 0.202 0.081 0.102 0.566 0.456 0.404 0.132 0.223 0.219 0.202 1.000 0.237 0.018 0.069 0.003 0.271 0.028 0.010 0.100 0.081 0.237 1.000 0.154 0.000 0.195 0.103 0.006 0.158 0.113 0.102 0.018 0.154 1.000
where the order of the variables i , j is the following: f s , A 1 , A 2 , A 3 , A 4 , Δ t , l, Φ 1 , Φ 2 and θ . A moderate correlation among almost all parameters is observed, except for the step direction θ . Hence, we consider that, for each step, the parameters f s , A 1 , A 2 , A 3 , A 4 , Δ t , l, Φ 1 , Φ 2 are correlated, whereas the step direction θ is statistically independent of the other features. Then the step pdf p S can be simplified as:
p S = p f s , A 1 , A 2 , A 3 , A 4 , Δ t , l , Φ 1 , Φ 2 , θ = p f s , A 1 , A 2 , A 3 , A 4 , Δ t , l , Φ 1 , Φ 2 p θ
Gaussian Mixture (GM) models represent an interesting approach to the problem of fitting multivariate distributions, since they depend on a limited number of parameters, can accurately approximate several practical distributions and can rely on simple algorithms for parameter estimation. For instance, the experimental f s Δ t histogram and the corresponding GM fit are shown in Figure 6 for the TS 1. The f s Δ t domain has been divided into a grid of dimension 21 × 21 , corresponding to 20 × 20 = 400 bins. The number of steps falling into each bin, i.e., the number of counts, is reported in Figure 6a.
The GM p ^ f s , A 1 , A 2 , A 3 , A 4 , Δ t , l , Φ 1 , Φ 2 fitting the multivariate pdf p f s , A 1 , A 2 , A 3 , A 4 , Δ t , l , Φ 1 , Φ 2 is based on N c = 5 components, since this option has shown a good trade-off between complexity and accuracy.
Hence, the pdf p f s , A 1 , A 2 , A 3 , A 4 , Δ t , l , Φ 1 , Φ 2 is approximated through the GM
p ^ f s , A 1 , A 2 , A 3 , A 4 , Δ t , l , Φ 1 , Φ 2 = i = 1 N c w i N μ i , Σ i
where w i is weight of the ith component and N μ i , Σ i denotes a multivariate normal distribution with mean μ i and covariance matrix Σ i , for i = 1 , , 5 .
The accuracy of the proposed model based on GM has been assessed through the Kolmogorov–Smirnov test [34]. In particular, the distribution of experimental data has been compared with that of data randomly generated on the basis of the GM p ^ f s , A 1 , A 2 , A 3 , A 4 , Δ t , l , Φ 1 , Φ 2 .
For all three test subjects, random data have passed 100 % of Kolmogorov–Smirnov tests with a 5 % significance level, thus leading to a great accuracy of the developed model.
The pdf of the step direction p θ has been analyzed independently of the other features according to Equation (7). The experimental histogram of the angle and the corresponding GM pdf are shown in Figure 7 for test subject 1. The angle domain has been divided into 20 bins, whereas N c = 3 components have been employed for the GM p ^ θ . Note that (a) the distribution is bimodal and somewhat symmetric with respect to 0 because of the succession of right and left steps; (b) the distribution is not perfectly symmetric as naturally the human body is not perfectly symmetric.
The step direction pdf p θ is approximated through the GM:
p ^ θ = i = 1 N c α i N m i , σ i
where α i is the weight of the ith component and N m i , σ i denotes a univariate normal distribution with mean m i and standard deviation σ i , for i = 1 , 2 , 3 .
In sum, the transition pdf p S of Equation (7) is approximated asx
p ^ S = p ^ f s , A 1 , A 2 , A 3 , A 4 , Δ t , l , Φ 1 , Φ 2 p ^ θ
on the basis of Equations (8) and (9). The parameters of the GMs (8) and (9) are listed in the Appendix A (Table A1 and Table A2, respectively).

4.2. Simplified Force Model

The same correlation analysis is performed with reference to the walking parameters characterizing the simplified force model. In this case, the average correlation matrix R ¯ computed from experimental measurements is:
R ¯ = R ¯ i j = 1.000 0.312 0.334 0.133 0.078 0.312 1.000 0.583 0.027 0.068 0.334 0.583 1.000 0.237 0.018 0.133 0.027 0.237 1.000 0.154 0.078 0.068 0.018 0.154 1.000
where the order of the variables i , j is the following: A 0 , T c , Δ t , l and θ . A moderate correlation between the following pairs of variables is observed, A 0 T c , A 0 Δ t , A 0 l , T c Δ t , Δ t l and θ l , while any other correlation can be deemed negligible. Based on this consideration, it is assumed that the step direction θ is statistically independent of the other features, which are, in turn, correlated. Then, the pdf p S of the correlated variables can be simplified as
p S = p A 0 , T c , Δ t , l , θ = p A 0 , T c , Δ t , l p θ
A good compromise between complexity and accuracy of the model is obtained considering N c = 3 components in the definition of the GM fitting the experimental data:
p ^ A 0 , T c , Δ t , l   = i = 1 N c w i N μ i , Σ i
The parameters of the GM of Equation (13) are shown in Appendix A (Table A3). As an example, the experimental histogram and the corresponding GM fit of the pair T c A 0 are shown in Figure 8 for the TS 1. The great accuracy of the proposed model based on GM is proved by the results of the Kolmogorov–Smirnov test, which shows that, for all three TSs, random data have passed 100 % of tests with a 5 % significance level.
Hence, the transition pdf p S of Equation (12) is approximated as
p ^ S = p ^ A 0 , T c , Δ t , l p ^ θ
on the basis of Equations (9) and (13). Being the step direction θ statistically independent from the other parameters, its pdf (experimental and simulated) is the same described in Section 4.1.

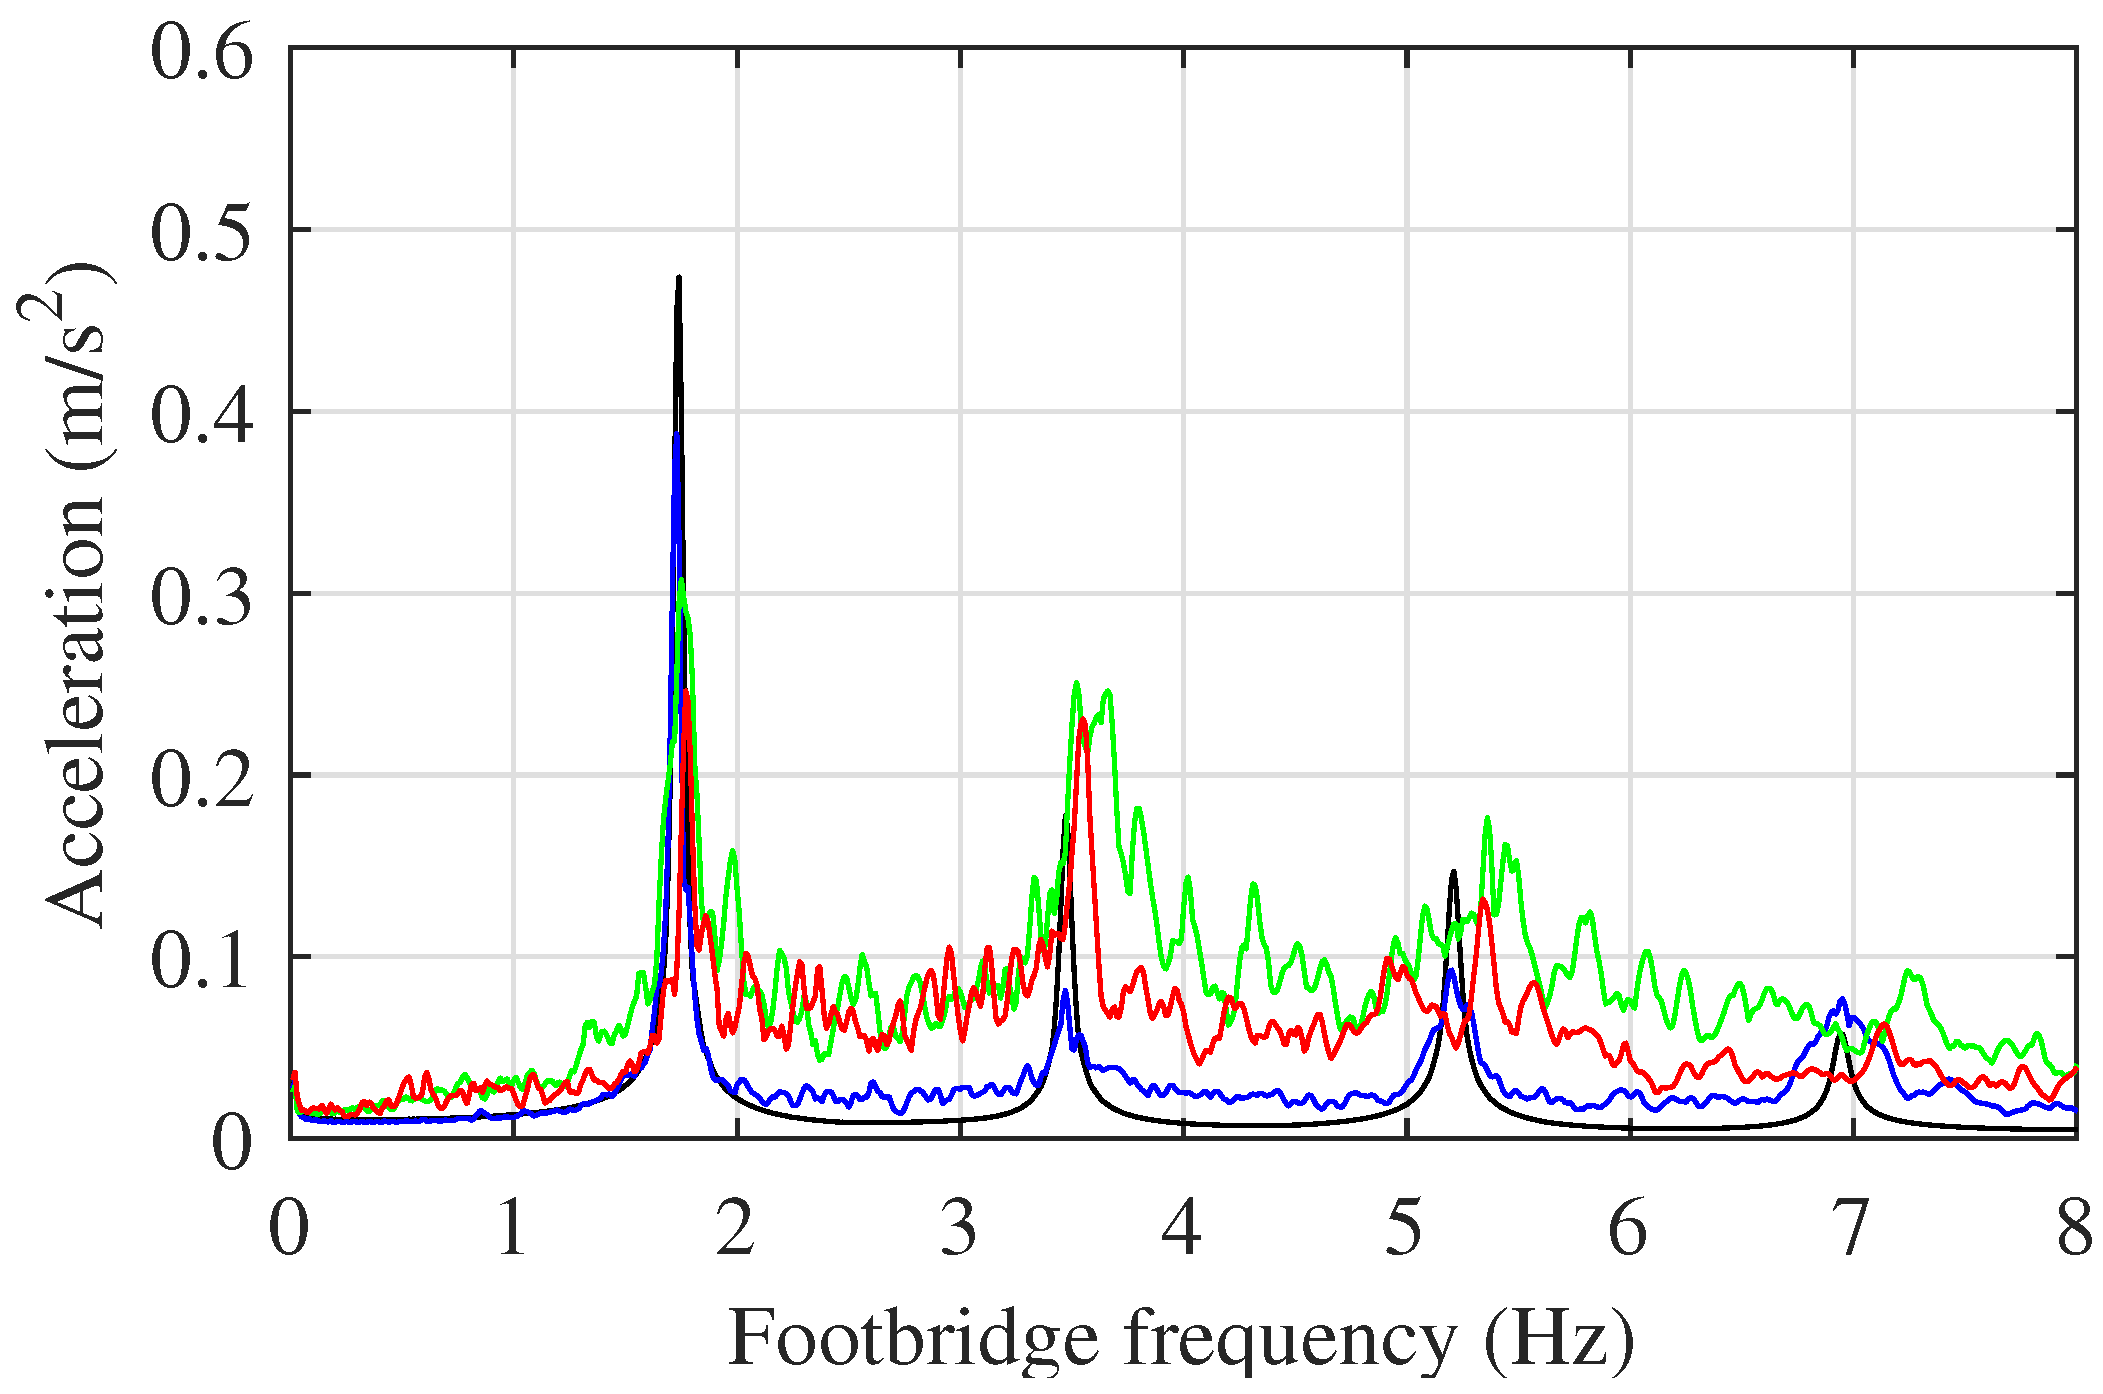
5. Simulation of Human-Induced Vibrations

In this section, the performance of the proposed force model is evaluated by calculating the structural response induced by single pedestrians crossing the footbridge considering different footbridge parameters. Results are then compared with those obtained from two load models proposed in the literature and from the simplified model of Section 3.2.

5.1. Footbridge Parameters

The footbridge is modeled as a simply-supported beam 50 m long and 3 m wide with a linear dynamic behavior. Only the contribution of the fundamental mode, namely the first bending mode with a half-sine mode shape, is taken into account. The damping ratio ξ 1 and the modal mass M 1 are, respectively, 0.04 % and 25 × 10 3 kg, while the natural frequency f 1 is assumed to vary from 0.1 Hz to 8.0 Hz with step 0.01 Hz. Since the case study is a one-dimensional problem, the pedestrian is assumed to walk on the footbridge centerline. Hence, in this case, the step direction θ is equal to zero, and the step length l represents the distance between two successive heel-strikes projected on the footbridge centerline. Note that this assumption would not be appropriate if a torsional mode contributed to the structural response.

5.2. Footbridge Response Simulation

Starting from the time history of the continuous walking force F ( t ) defined by Equation (3) or Equation (5) depending on the force model, the footbridge response to pedestrian load is evaluated through modal decomposition. The fundamental mode is modeled as an SDOF system with a load representing the pedestrian walking across the footbridge. The modal response of the SDOF system is calculated from [35]
y ¨ 1 ( t ) + 2 ξ 1 2 π f 1 y ˙ 1 ( t ) + ( 2 π f 1 ) 2 y 1 ( t ) = φ 1 ( t ) F ( t ) M 1
where y ¨ 1 ( t ) [ m / s 2 ] , y ˙ 1 ( t ) [ m / s ] and y 1 ( t ) [ m ] are the modal acceleration, velocity and displacement. The right hand side of Equation (15) is the modal force acting on the SDOF system, represented by the product of the pedestrian force F ( t ) and the mode shape. At each time instant t, the mode shape φ 1 ( t ) is evaluated in the position occupied by the pedestrian at that time, calculated by adding the length l of the steps taken up to t. The variable representative of the response is chosen as the maximum mid-span acceleration.
To evaluate the modal response y ¨ 1 ( t ) , Equation (15) is solved through a MATLAB routine. In particular, the integration procedure proposed by Mancuso and Ubertini [36] and based on a time discontinuous Galerkin formulation is adopted. This integration procedure has proved to be particularly well suited for the simplified force model because it allowed avoiding the numerical instabilities that may occur with step functions. Finally, the mid-span acceleration is evaluated as y ¨ 1 ( t ) φ 1 ( L / 2 ) , where L is the footbridge length.

5.3. Simulation Procedure

The flowchart of Figure 9 summarizes the procedure for the evaluation of the footbridge vibrations induced by single pedestrians adopting the proposed force model. Due to the random nature of the load model, simulations are repeated 500 times to statistically characterize the response. Parameters of the multivariate probability distributions adopted for the presented simulations are those calibrated with respect to the test subject 1.

5.4. Comparison with Existing Models

Results of the proposed force model are compared to (a) those of the simplified model, (b) those of the multi-harmonic force model by Živanović et al. [11] and (c) those of the single step load model by Li et al. [33]. The last two models are briefly described in the following. Input parameters of the single step load model and the multi-harmonic force model are defined according to the fact that parameters of the multivariate probability distributions are referred to as TS 1. In particular, based on the results of the experimental tests for TS 1, a mean step frequency f s = 1.73 Hz and step length l = 0.71 m are considered.
Similarly to the proposed and simplified models, the individual walking forces of Equations (18) and (19) are adopted to calculate the modal force acting on the SDOF system. At each time instant t, the mode shape φ 1 ( t ) is evaluated in the position occupied by the pedestrian at that time. In particular, with the force model by Li et al. [33], the position of the pedestrian at each time instant t is evaluated from its velocity v (assuming the pedestrian is moving at a constant speed) [37].

5.4.1. Single-Step Load Model

The model proposed by Li et al. [33] is based on the assumption that the footfall force induced by a single pedestrian is the same at each step, described as:
P L i ( t ) = G n = 1 5 α n sin π n T c t , 0 t T c
where α n (-) are the Fourier coefficients, normalized to the weight of the pedestrian G [kN). The duration T c and the period T s are related by T c = T s + Δ t , where Δ t = 0.24 T c . The single step force is defined accounting for the contribution of the first five harmonics. Values of the Fourier coefficients for the five harmonics can be found in [33].
The footfall force of the kth step is defined over the total duration of the analysis as:
P L i , k ( t ) = 0 , t < ( k 1 ) T s P L i k ( t ) , ( k 1 ) T s t ( k 1 ) T s + T c 0 , t > ( k 1 ) T s + T c
Finally, the continuous walking force is obtained:
F L i ( t ) = k = 1 N p P L i , k ( t )

5.4.2. Multi-Harmonic Force Model

The multi-harmonic force model for the calculation of the structural response to a single pedestrian crossing the footbridge is proposed by Živanović et al. [11]. The model is based on the force spectrum of the walking force measured by Brownjohn et al. [21], who found that the human-induced walking force is not periodic but rather a random narrow band process. This means that there is a leak of energy into adjacent frequencies on either side of the fundamental pacing rate and its multiples in the amplitude spectrum of a series of continuous footsteps. Hence, the model is developed in the time domain but it is also able to represent the intra-subject variability of the walking force thanks to the characterization of the force in the frequency domain.
The load model covers the frequency range related to the first five harmonics of the walking force. The contribution of both the five main harmonics, with frequencies as integer multiples of the step frequency, and the first five sub-harmonics, appearing between the main harmonics, is considered. The total force is the sum of the contribution of each harmonic and sub-harmonic (indicated by the superscript s):
F Z ( t ) = n = 1 5 F n ( t ) + n = 1 5 F n s ( t )
The contribution of the nth harmonic to the total force is the following:
F n ( t ) = G α n f ¯ j = n 0.25 n + 0.25 α ¯ n ( f ¯ j ) cos ( 2 π f ¯ j f s t + Φ ( f ¯ j ) )
while for the nth sub-harmonic it is:
F n s ( t ) = G α n s f ¯ j s = n 0.75 n 0.25 α ¯ n s ( f ¯ j s ) cos ( 2 π f ¯ j s f s t + Φ ( f ¯ j s ) )
In Equations (20) and (21), the product f ¯ j f s [ H z ] is a frequency line within the energy range of the analyzed (sub-)harmonic and Φ ( f ¯ j ) [ ] is the phase assigned to the spectrum line, based on a uniform distribution in the range π , + π . The reader is referred to [11] for the values of the Fourier coefficients.
Note that the multi-harmonic force model is also able to represent the inter-subject variability of the walking force, accounted for through probability-based modeling of the pacing frequency and step length. According to the aim of this paper, those parameters are assumed as deterministic variables defined on the basis of the experimental results.

5.5. Results and Discussion

5.5.1. Comparison among the Force Models

Figure 10, Figure 11, Figure 12 and Figure 13 present a comparison among the walking forces obtained from the different force models. Both the continuous walking forces and the modal forces are presented. Except for the multi-harmonic force model, the contribution of the single foot forces to the continuous walking force is shown with dashed lines. Due the random nature of the multi-harmonic force model, the proposed force model and the simplified one, the walking forces and the footbridge accelerations depend on the randomly generated model parameters. Hence, the walking forces shown in Figure 10, Figure 11, Figure 12 and Figure 13 only represent a possible realization of the walking process. On the contrary, the single-step-load model is deterministic and not affected by the variability of the input parameters.
As far as the simplified model is concerned, it is observed that the walking force is a step function due to the assumption of constant footfall forces (Figure 11a). Moreover, as a result of the intra-subject variability, the single step forces of both the proposed and simplified models differ from each other leading to non-periodic walking forces. The same goes for the multi-harmonic force model, characterized by a non-periodic walking force such as the one shown in Figure 13a. On the contrary, in the single step model, the gait parameters are the same for each step, resulting in the periodic walking force of Figure 12a. Note that the force of Figure 13a is obtained by adding the contribution of the static weight G to the force F Z ( t ) . In Equations (19)–(21) the weight of the pedestrian is neglected, as the acceleration caused by a constant force moving at a low velocity (as for pedestrians) is negligible compared to that caused by the dynamic part of the force.

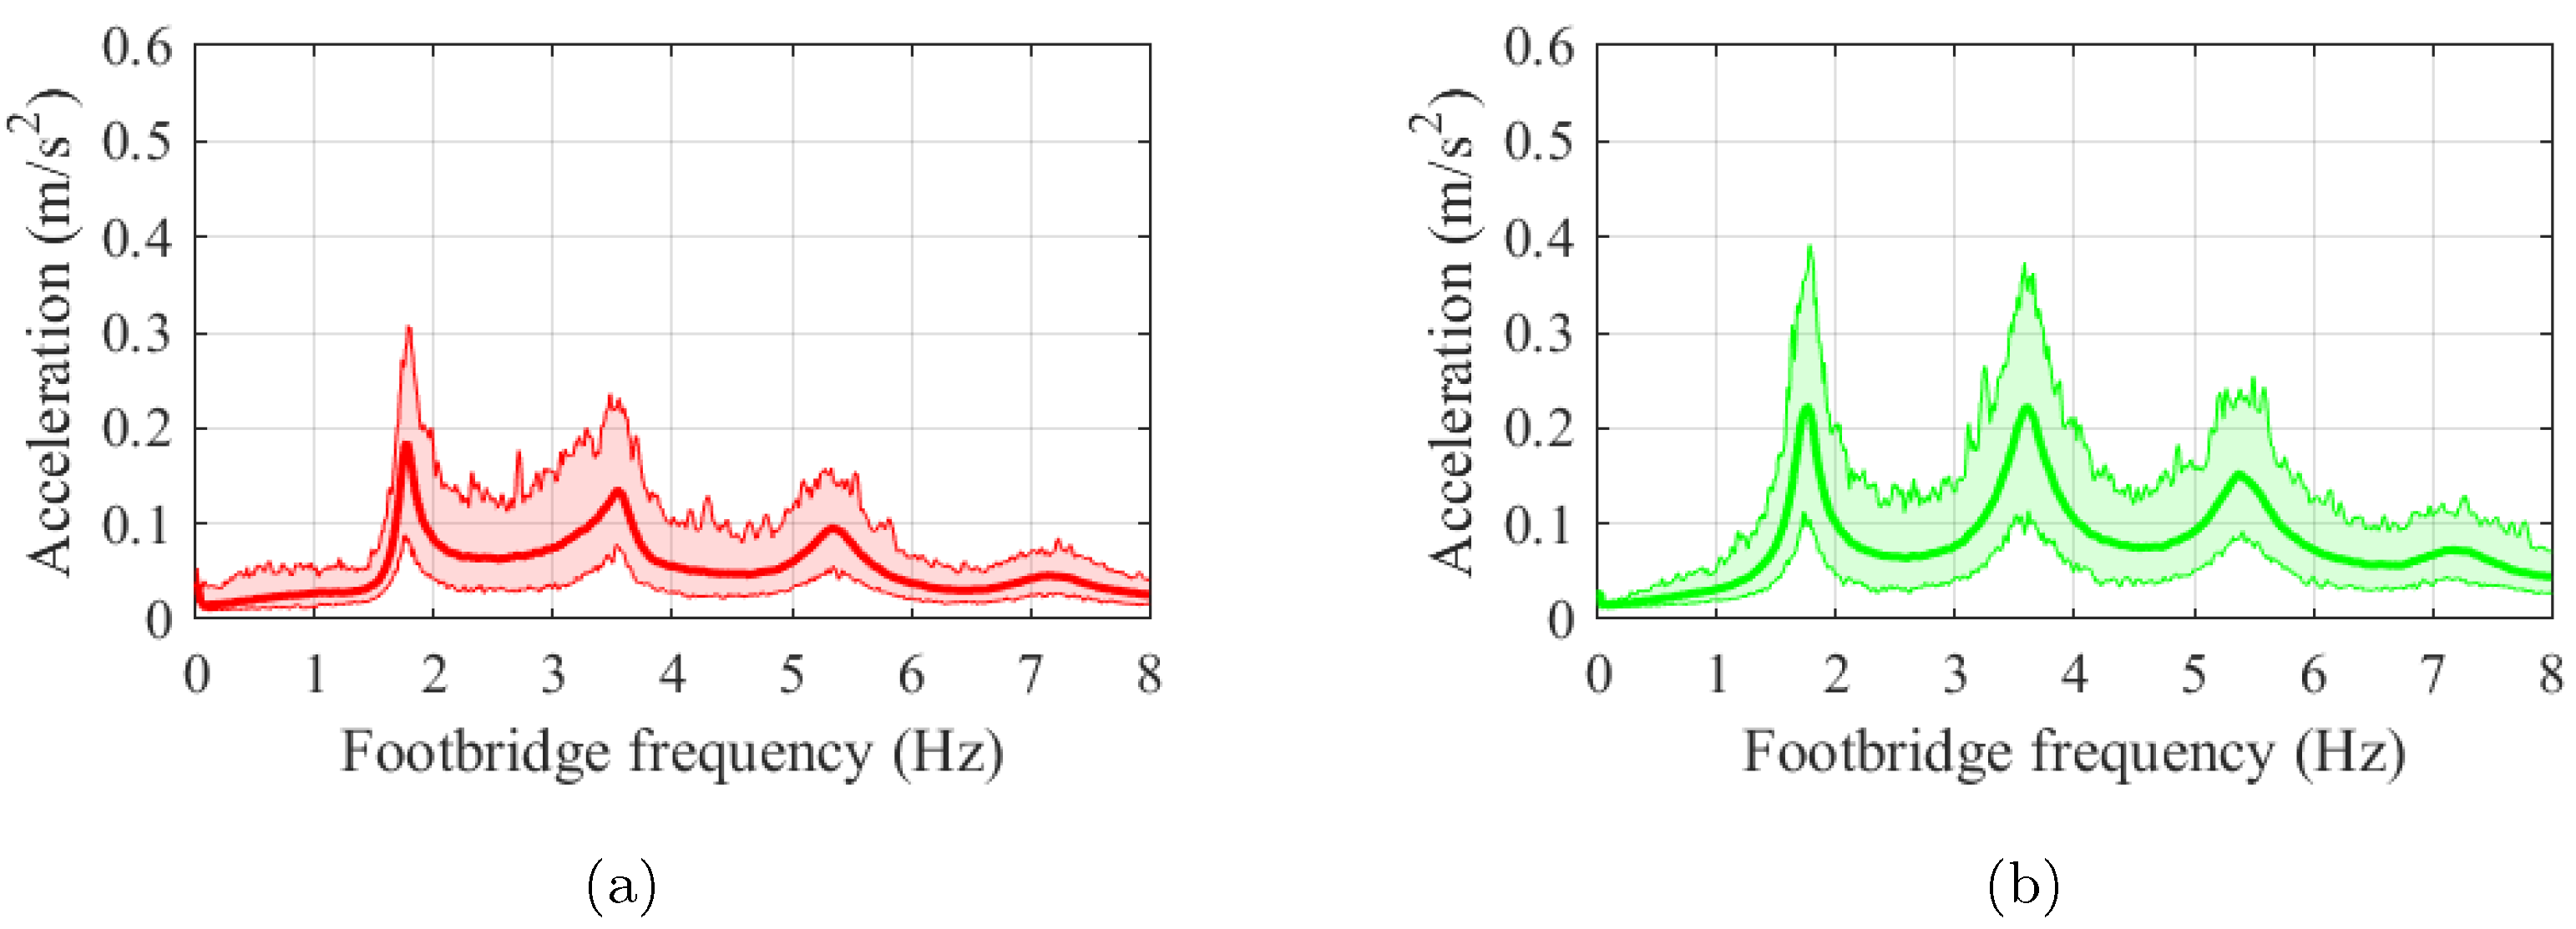
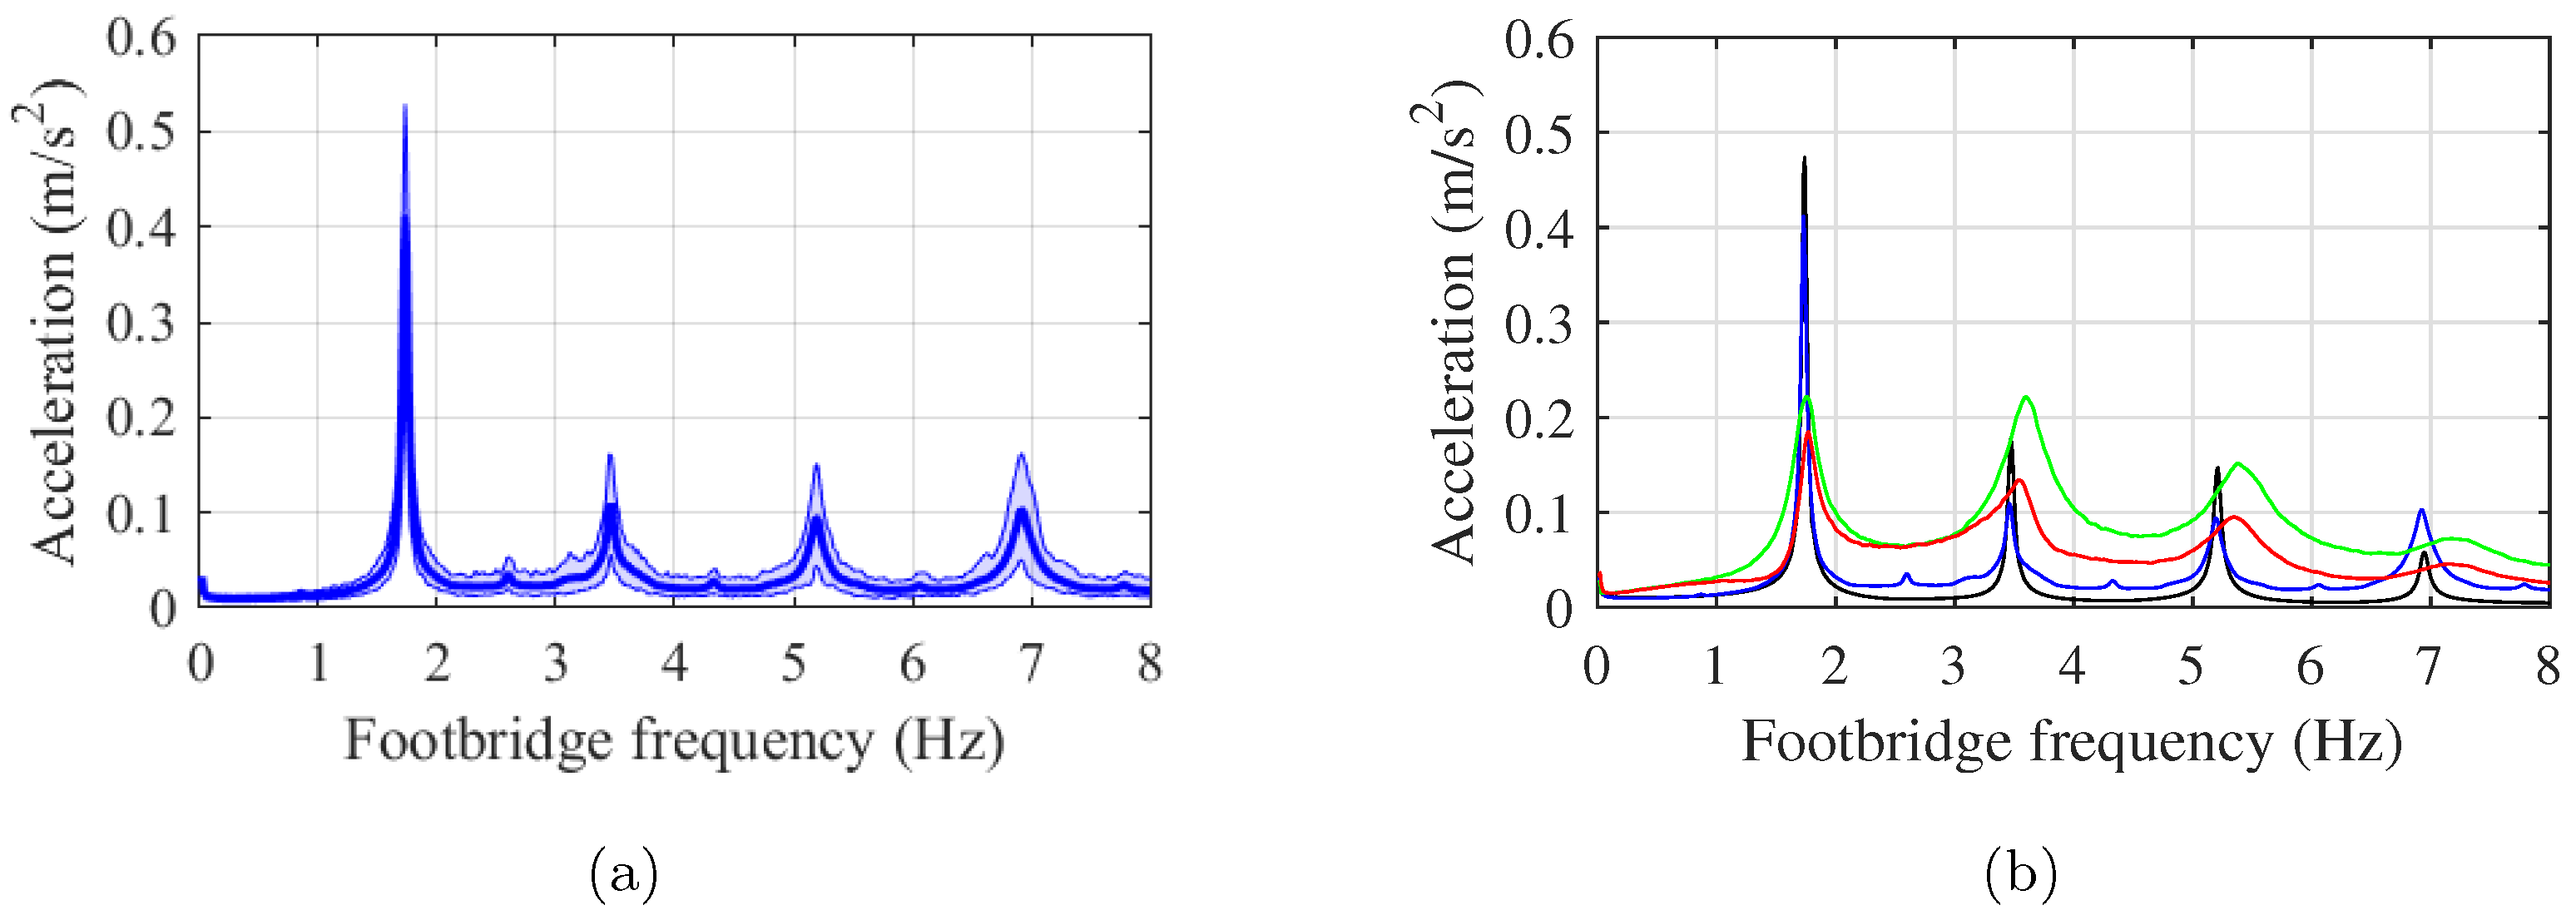
5.5.2. Simulation Results

The structural responses obtained from the different load models considering footbridge natural frequencies in the range [0.1; 8] Hz are shown and compared in Figure 14. Results are presented in terms of maximum structural acceleration. As mentioned before, maximum accelerations obtained from the multi-harmonic force model and the simplified and proposed force models depend on the randomly generated values of the gait parameters. By way of example, Figure 14 shows results obtained from a random sampling, while the envelopes of the results of 500 simulations are reported in Figure 15 and Figure 16a, together with the mean values. Finally, the same mean values of the maximum accelerations obtained from the statistical models and the acceleration of the single step load model are compared in Figure 16b.
With reference to the single step load model, high amplifications of the structural response can be observed for natural footbridge frequencies equal to the step frequency and its integer multiples. On the contrary, the structural acceleration quickly decreases for different values of natural frequency. This is due to the deterministic nature of the single step load model, which implies the assumption that the pacing frequency of the pedestrian is constant during walking. To account for the intra-subject variability means to consider that some gait parameters may change during walking. This causes amplifications of the structural response for a wider range of natural frequencies of the footbridge. Hence, this highlights the importance of considering imperfections in human walking to prevent underestimation of the structural response for frequencies different from the resonant frequencies and vice versa.
The greater variability of results from the simplified and proposed models than from the multi-harmonic force model can be explained as follows. Simplified and proposed force models see a step-by-step variation of all the walking features, while in the multi-harmonic force model, the intra-subject variability is taken into account through the phase angle only. Thus, the greater variability of input parameters leads to a greater variability of results. As far as the multi-harmonic force model is considered, slight increments of the response can be observed for frequencies between the main harmonics due to the effect of the sub-harmonics of the walking force. Similar amplifications are not observed from the other simulation models.
Proposed and simplified force models present maximum accelerations in correspondence of the main resonant frequency, which are significantly reduced compared to those of the other simulation models, whereas comparable results are obtained for higher harmonics of the walking force. Moreover, the proposed models present higher accelerations for frequencies between the main harmonics of the walking force. Compared to the proposed model, the simplified model shows greater accelerations for the second and third component of the walking force, namely around 3.6 Hz and 5.4 Hz. This is related to the nature of the simplified model. Indeed, from Figure 11a, it is observed that the walking force is a step function with narrow peaks and large troughs. The Fourier spectrum of this kind of function is characterized by high amplifications for frequencies two and three times the fundamental frequency. This is not the case of the proposed force model, where, because of the different shape of the foot force, the walking force is not a step function (Figure 10a).

6. Conclusions

This paper proposes a statistical approach for modeling vertical walking forces induced by single pedestrians. The approach is able to describe the intrinsic random nature of the walking force. Basically, the walking force is modeled as a series of consecutive steps, where the gait parameters are assumed to vary step-by-step. This approach takes inspiration from the application of Markov chains called “random walk”.
The analysis of experimental tests has showed that the gait parameters describing the load of each individual change during walking as well as that these parameters are correlated with each other. The statistical characterization of the walking features is performed by describing their multivariate distribution through Gaussian mixture models. According to the force model proposed in this paper, the individual walking force is described as a series of consecutive footfall forces each one characterized by the typical M shape. The gait parameters characterizing each steps are randomly extracted from their multivariate probability distributions, which have been properly calibrated on the basis of the experimental results. The proposed force model is adopted to predict the human-induced vibrations of a simply supported beam considering different footbridge parameters. The performance of the proposed model is compared to that of a simplified model based on the assumption that the foot force is constant over the step duration as well as to those of two simulation models presented in the literature, namely the single step load model and the multi-harmonic force model. The former defines a periodic walking force as a series of steps equal to each other, while the latter accounts for the intra-subject variability through the phase angle.
Simulation results highlight the importance of accounting for the variability in the human walking to prevent underestimation of the structural response for frequencies different from the resonant frequencies and vice versa. Moreover, results of the proposed and simplified models show a greater variability than those of the multi-harmonic force model where the intra-subject variability is accounted for through the phase angle only. Finally, the high response amplifications obtained from the simplified model for frequencies about two and three times higher than the pacing frequency demonstrate the importance of a faithful representation of the single-step force. Indeed, these amplifications are related to the simplifying assumption of constant footfall forces, whereas they are not observed considering the typical M shape.
The main benefit of the proposed approach lies in the fact that it is able to reliably represent the variability of the gait parameters observed from the measurements. Since the the aim of the paper is to demonstrate the importance of a faithful representation of the intra-subject variability of the walking force, experiments involving three test subjects are considered. However, a force model representative of the behavior of different individuals can be calibrated as shown in this paper based on the results of experiments involving many test subjects. Once a general force model is calibrated, it can be adopted for the design of footbridges especially in design situations that imply light pedestrian traffic. In those cases, in fact, to account for the intrinsic variability of individual walking forces is crucial for a proper assessment of the vibration response.

Author Contributions

Conceptualization, F.P., E.B. and L.V.; methodology, F.P., E.B. and L.V.; validation, L.V.; data curation, F.P. and E.B.; writing—original draft preparation, F.P. and E.B.; writing—review and editing, M.M. and L.V.; funding acquisition, M.M. All authors have read and agreed to the published version of the manuscript.

Funding

The present work is part of “Design and implementation of functional prototypes of advanced sensorized platforms”, within the project “JUMP - UNA PIATTAFORMA SENSORISTICA AVANZATA (PG/2015/726369)”. The project has received funding from the Emilia Romagna Region Project POR FESR 2014-2020, Axis 1 Research and Innovation. 1.2.2 Action. http://www.jump-project.it/ (accessed on 30 September 2021).

Institutional Review Board Statement

Not applicable.

Informed Consent Statement

Not applicable.

Data Availability Statement

The original contributions presented in the study are included in the article, further inquiries can be directed to the corresponding author.

Conflicts of Interest

The authors declare no conflict of interest.

Appendix A. Parameters of the Gaussian Mixture Models

The following table presents the parameters of the multivariate GM for the proposed model (Table A1), the univariate GM p ^ θ (Table A2) and the multivariate GM for the simplified model (Table A3).
Table A1. Parameters of the multivariate GM p ^ f s , A 1 , A 2 , A 3 , A 4 , Δ t , l , Φ 1 , Φ 2 (Equation (8)).
TS 1TS 2TS 3
w 1 w 2 w 3 w 4 w 5 w 1 w 2 w 3 w 4 w 5 w 1 w 2 w 3 w 4 w 5
0.1470.2810.1750.0350.3630.0170.2810.1810.2710.2510.2110.0530.1560.0920.490
μ 1 μ 2 μ 3 μ 4 μ 5 μ 1 μ 2 μ 3 μ 4 μ 5 μ 1 μ 2 μ 3 μ 4 μ 5
0.58380.72070.66820.55460.70560.53690.56700.56350.58950.55810.61320.55580.51000.58770.5957
1.03911.07631.02210.97901.01581.19301.26241.17141.22601.18581.39531.35351.29041.33151.3009
0.29930.37850.30190.22560.34330.24500.30640.30420.28700.23380.39230.27460.25290.28930.3238
0.08780.04370.04980.13720.05490.07450.04920.05550.03300.04230.04970.06990.13990.08030.0500
0.09620.05110.06320.10700.06520.11930.06820.08620.08110.07620.06590.08650.08900.06320.0683
−1.6275−1.5040−1.4590−1.6748−1.5174−1.4371−1.5002−1.5526−1.4864−1.4805−1.5018−1.4691−1.6193−1.5259−1.5065
−1.5025−1.2197−1.1513−1.5505−1.2441−1.1708−1.3136−1.2883−1.2956−1.2894−1.2201−1.0979−1.5144−1.2318−1.2310
0.12330.11340.14240.12650.11090.26370.17620.16580.17300.20210.15380.20290.17170.17780.1603
0.68270.72510.64160.70280.69190.91400.72890.71410.73310.60250.70280.59520.70650.48440.6610
Table A2. Parameters of the univariate GM p ^ θ (Equation (9)).
TS 1TS 2TS 3
α 1 0.5090.5050.493
m 1 0.2720.2350.331
σ 1 × 10 3 4.1373.4754.415
α 2 0.1170.1180.487
m 2 −0.311−0.316−0.333
σ 2 × 10 3 6.9953.2032.821
α 3 0.3750.3770.019
m 3 −0.266−0.222−0.478
σ 3 × 10 3 1.8571.2530.199
Table A3. Parameters of the multivariate GM p ^ A 0 , T c , Δ t , l (Equation (13)).
TS 1TS 2TS 3
w 1 0.2920.2080.663
μ 1 0.736 0.697 0.130 0.679 0.832 0.853 0.197 0.556 0.949 0.790 0.156 0.676
Σ 1 × 10 3 0.313 0.238 0.120 0.237 0.238 1.304 0.548 1.076 0.120 0.548 0.493 1.148 0.237 1.076 1.148 15.98 0.488 0.223 0.129 0.945 0.223 1.889 0.788 0.387 0.129 0.788 0.845 1.389 0.945 0.387 1.389 7.824 2.002 0.329 0.1975 0.835 0.329 2.186 0.746 0.283 0.197 0.746 0.381 0.252 0.836 0.283 0.252 5.860
w 2 0.2200.7080.168
μ 2 0.733 0.813 0.124 0.675 0.867 0.829 0.172 0.737 0.9209 0.892 0.180 0.600
Σ 2 × 10 3 2.168 1.078 0.203 2.485 1.078 7.712 0.650 0.582 0.203 0.650 0.280 0.907 2.485 0.582 0.907 17.44 1.609 0.134 0.011 0.075 0.134 1.535 0.345 0.297 0.011 0.345 0.289 0.274 0.075 0.297 0.274 5.754 3.477 2.824 0.044 8.700 2.824 5.880 0.900 6.482 0.044 0.900 0.456 0.770 8.700 6.482 0.770 26.31
w 3 0.4880.0840.169
μ 3 0.772 0.659 0.111 0.706 0.839 0.922 0.217 0.728 0.903 0.895 0.181 0.641
Σ 3 × 10 3 0.9817 0.054 0.001 0.562 0.054 0.854 0.193 0.038 0.001 0.193 0.103 0.047 0.562 0.038 0.047 5.240 2.122 0.818 1.502 3.403 0.818 3.350 1.817 4.169 1.502 1.817 2.481 4.004 3.403 4.169 4.005 35.63 1.482 0.435 0.882 0.929 0.435 6.377 0.340 3.633 0.882 0.340 1.243 1.111 0.929 3.633 1.111 27.78

References

  1. Živanović, S.; Pavić, A.; Reynolds, P. Vibration serviceability of footbridges under human-induced excitation: A literature review. J. Sound Vib. 2005, 279, 1–74. [Google Scholar] [CrossRef] [Green Version]
  2. Racic, V.; Pavic, A.; Brownjohn, J. Experimental identification and analytical modelling of human walking forces: Literature review. J. Sound Vib. 2009, 326, 1–49. [Google Scholar] [CrossRef]
  3. Van Nimmen, K.; Lombaert, G.; Jonkers, I.; De Roeck, G.; Van den Broeck, P. Characterisation of walking loads by 3D inertial motion tracking. J. Sound Vib. 2014, 333, 5212–5226. [Google Scholar] [CrossRef] [Green Version]
  4. Younis, A.; Avci, O.; Hussein, M.; Davis, B.; Reynolds, P. Dynamic Forces Induced by a Single Pedestrian: A Literature Review. Appl. Mech. Rev. 2017, 69, 020802. [Google Scholar] [CrossRef]
  5. Dang, H.V.; Živanović, S. Experimental characterisation of walking locomotion on rigid level surfaces using motion capture system. Eng. Struct. 2015, 91, 141–154. [Google Scholar] [CrossRef] [Green Version]
  6. Matsumoto, Y.; Nishioka, T.; Shiojiri, H.; Matsuzaki, K. Dynamic design of footbridges. IABSE Proceedings. 1978, pp. 1–15. Available online: https://www.e-periodica.ch/cntmng?pid=bse-pe-004:1978:2::30 (accessed on 30 September 2021).
  7. Kramer, H.; Kebe, H. Man-induced structural vibrations. Der Bauing. 1980, 54, 195–199. [Google Scholar]
  8. Kerr, S.; Bishop, N. Human induced loading on flexible staircases. Eng. Struct. 2001, 23, 37–45. [Google Scholar] [CrossRef]
  9. Pachi, A.; Ji, T. Frequency and velocity of people walking. Struct. Eng. 2005, 83, 36–40. [Google Scholar]
  10. Sahnaci, C.; Kasperski, M. Random loads induced by walking. In Proceedings of the 6th European Conference on Structural Dynamics, Paris, France, 4–7 September 2005. [Google Scholar]
  11. Živanović, S.; Pavić, A.; Reynolds, P. Probability-based prediction of multi-mode vibration response to walking excitation. Eng. Struct. 2007, 29, 942–954. [Google Scholar] [CrossRef]
  12. Živanović, S. Probability-Based Estimation of Vibration for Pedestrian Structure Due to Walking. Ph.D. Thesis, Departement of Civil and Structural Engineering, University of Sheffield, Sheffield, UK, 2006. [Google Scholar]
  13. Wheeler, J. Prediction and control of pedestrian-induced vibration in footbridges. ASCE J. Struct. Div. 1982, 108, 2045–2065. [Google Scholar] [CrossRef]
  14. Ellis, B. On the response of long-span floors to walking loads generated by individuals and crowds. Struct. Eng. Lond. 2000, 78, 17–25. [Google Scholar]
  15. Rainer, J.H.; Pernica, G.; Allen, D.E. Dynamic loading and response of footbridges. Can. J. Civ. Eng. 1988, 15, 66–71. [Google Scholar] [CrossRef] [Green Version]
  16. García-Diéguez, M.; Racic, V.; Zapico-Valle, J. Complete statistical approach to modelling variable pedestrian forces induced on rigid surfaces. Mech. Syst. Signal Process. 2021, 159, 107800. [Google Scholar] [CrossRef]
  17. Van Nimmen, K.; Zhao, G.; Seyfarth, A.; Van den Broeck, P. A Robust Methodology for the Reconstruction of the Vertical Pedestrian-Induced Load from the Registered Body Motion. Vibration 2018, 1, 18. [Google Scholar] [CrossRef] [Green Version]
  18. Rezende, F.; Brunet, O.; Diniz Varela, W.; Pereira, A.; Carvalho, E. Evaluation of TMD Performance in Footbridges Using Human Walking Probabilistic Models. Vibration 2021, 4, 21. [Google Scholar] [CrossRef]
  19. Ramos-Moreno, C.; Ruiz-Teran, A.M.; Stafford, P.J. Impact of stochastic representations of pedestrian actions on serviceability response. Proc. Inst. Civ. Eng. Bridge Eng. 2021, 174, 113–128. [Google Scholar] [CrossRef]
  20. Pedersen, L.; Frier, C. Sensitivity of footbridge vibrations to stochastic walking parameters. J. Sound Vib. 2010, 329, 2683–2701. [Google Scholar] [CrossRef]
  21. Brownjohn, J.; Pavić, A.; Omenzetter, P. A spectral density approach for modelling continuous vertical forces due to walking. Can. J. Civ. Eng. 2004, 31, 65–77. [Google Scholar] [CrossRef] [Green Version]
  22. Yamasaki, M.; Sasaki, T.; Torii, M. Sex difference in the pattern of lower limb movement during treadmill walking. Eur. J. Appl. Physiol. Occup. Physiol. 1991, 62, 99–103. [Google Scholar] [CrossRef]
  23. Racic, V.; Brownjohn, J. Stochastic model of near-periodic vertical loads due to humans walking. Adv. Eng. Inform. 2011, 25, 259–275. [Google Scholar] [CrossRef]
  24. Piccardo, G.; Tubino, F. Equivalent spectral model and maximum dynamic response for the serviceability analysis of footbridges. Eng. Struct. 2012, 40, 445–456. [Google Scholar] [CrossRef]
  25. Krenk, S. Dynamic response to pedestrian loads with statistical frequency distribution. J. Eng. Mech. 2012, 138, 1275–1281. [Google Scholar] [CrossRef]
  26. Caprani, C.C. Application of the pseudo-excitation method to assessment of walking variability on footbridge vibration. Comput. Struct. 2014, 132, 43–54. [Google Scholar] [CrossRef]
  27. Bassoli, E.; Van Nimmen, K.; Vincenzi, L.; Van den Broeck, P. A spectral load model for pedestrian excitation including vertical human-structure interaction. Eng. Struct. 2018, 156, 537–547. [Google Scholar] [CrossRef]
  28. Brownjohn, J.; Racic, V.; Chen, J. Universal response spectrum procedure for predicting walking-induced floor vibration. Mech. Syst. Signal Process. 2016, 70–71, 741–755. [Google Scholar] [CrossRef] [Green Version]
  29. Bocian, M.; Brownjohn, J.; Racic, V.; Hester, D.; Quattrone, A.; Gilbert, L.; Beasley, R. Time-dependent spectral analysis of interactions within groups of walking pedestrians and vertical structural motion using wavelets. Mech. Syst. Signal Process. 2018, 105, 502–523. [Google Scholar] [CrossRef]
  30. Papoulis, A.; Pillai, S.U. Probabiliy, Random Variables and Stochastic Processes, 4th ed.; McGraw-Hill: New York, NY, USA, 2002. [Google Scholar]
  31. Fontanili, L.; Milani, M.; Montorsi, L.; Valente, G. Gait Analysis for Muscular Forces Evaluation in Human Movement: Integration Protocol of Typical Measurement Methods. In Proceedings of the ASME 2018 International Mechanical Engineering Congress and Exposition, Pittsburgh, PA, USA, 9–15 November 2018; p. V003T04A084. [Google Scholar] [CrossRef]
  32. Reynolds, D. Gaussian Mixture Models. In Encyclopedia of Biometrics; Li, S.Z., Jain, A., Eds.; Springer: Boston, MA, USA, 2009; pp. 659–663. [Google Scholar] [CrossRef]
  33. Li, Q.; Fan, J.; Nie, J.; Li, Q.; Chen, Y. Crowd-induced random vibration of footbridge and vibration control using multiple tuned mass dampers. J. Sound Vib. 2010, 329, 4068–4092. [Google Scholar] [CrossRef]
  34. Massey, F.J. The Kolmogorov–Smirnov Test for Goodness of Fit. J. Am. Stat. Assoc. 1951, 46, 68–78. [Google Scholar] [CrossRef]
  35. Clough, R.; Penzien, J. Dynamics of Structures; McGraw-Hill: New York, NY, USA, 1993. [Google Scholar]
  36. Mancuso, M.; Ubertini, F. An efficient integration procedure for linear dynamics based on a time discontinuous Galerkin formulation. Comput. Mech. 2003, 32, 154–168. [Google Scholar] [CrossRef]
  37. Bassoli, E.; Gambarelli, P.; Vincenzi, L. Human-induced vibrations of a curved cable-stayed footbridge. J. Constr. Steel Res. 2018, 146, 84–96. [Google Scholar] [CrossRef]
Figure 1. Force sensors installed under the vertices of the plates.
Applsci 11 10207 g001
Figure 2. Experimental forces of the right (blue line) and left (red line) foot and continuous walking force (dashed black line).
Applsci 11 10207 g002
Figure 3. Geometrical interpretation of the proposed force model.
Applsci 11 10207 g003
Figure 4. Example of (a) consecutive steps from the proposed force model and (b) measured steps.
Applsci 11 10207 g004
Figure 5. Simplified load model: example of three successive steps. The dashed lines represent the measured steps while the solid lines are the corresponding modeled steps.
Applsci 11 10207 g005
Figure 6. (a) Experimental f s Δ t histogram and (b) GM fit for TS 1.
Applsci 11 10207 g006
Figure 7. (a) Experimental histogram and (b) corresponding GM fit of the step direction θ for TS 1.
Applsci 11 10207 g007
Figure 8. (a) Experimental T c A 0 histogram and (b) GM fit for TS 1.
Applsci 11 10207 g008
Figure 9. Flowchart of the simulation procedure.
Applsci 11 10207 g009
Figure 10. (a) Walking force and (b) modal force obtained from the proposed model. Solid line: continuous walking force; dashed line: single foot force.
Applsci 11 10207 g010
Figure 11. (a) Walking force and (b) modal force obtained from the simplified model. Solid line: continuous walking force; dashed line: single-foot force.
Applsci 11 10207 g011
Figure 12. (a) Walking force and (b) modal force obtained from the single step load model. Solid line: continuous walking force; dashed line: single foot force.
Applsci 11 10207 g012
Figure 13. (a) Continuous walking force and (b) modal force walking force obtained from the multi-harmonic force model.
Applsci 11 10207 g013
Figure 14. Maximum structural response obtained considering a random sampling of the gait parameters. Red: proposed force model; green: simplified force model; black: single step load model; blue: multi-harmonic force model.
Applsci 11 10207 g014
Figure 15. Envelope and mean value (bold line) of the maximum accelerations obtained from 500 simulations for (a) the proposed force model and (b) the simplified force model.
Applsci 11 10207 g015
Figure 16. (a) Envelope and mean value (bold line) of the maximum accelerations obtained from 500 simulations for the multi-harmonic force model; (b) Mean values of the maximum accelerations. Red: proposed force model; green: simplified force model; black: single step load model; blue: multi-harmonic force model.
Applsci 11 10207 g016
Table 1. Test subject characteristics.
TSMass [kg]Age [Years]Gender
14525female
25425female
35522female
Publisher’s Note: MDPI stays neutral with regard to jurisdictional claims in published maps and institutional affiliations.

