Article

Spatiotemporal Protein Expression Profiles of QSOX1 in the Murine Uterus, Placenta, and Embryo during Pregnancy

1
Department of Chemical Engineering and Biotechnology, National Taipei University of Technology, Taipei 106, Taiwan
2
Department of Neurosurgery, MacKay Memorial Hospital, Taipei 104, Taiwan
3
Department of Obstetrics and Gynecology, MacKay Memorial Hospital, Taipei 104, Taiwan
4
Department of Medical Research, MacKay Memorial Hospital, Tamsui District, New Taipei 251, Taiwan
5
MacKay Junior College of Medicine, Nursing, and Management, Beitou District, Taipei 112, Taiwan
*
Authors to whom correspondence should be addressed.
Appl. Sci. 2021, 11(21), 10151; https://doi.org/10.3390/app112110151
Submission received: 5 October 2021 / Revised: 22 October 2021 / Accepted: 25 October 2021 / Published: 29 October 2021
(This article belongs to the Special Issue Immunohistochemical Expression Volume II)

Abstract

:
Quiescin Q6 sulfhydryl oxidase 1 (QSOX1) catalyzes the oxidation of the sulfhydryl group to disulfide bond and is widely expressed in various tissues. This study focuses on investigating QSOX1′s spatiotemporal and cellular protein expression profile of the pregnant uterus, placenta, and developing embryo during mouse pregnancy. Immunohistochemical staining was used to reveal the localization of QSOX1 protein, and HistoQuest was applied to quantify protein levels. The expression level of QSOX1 in the decidua and muscle cells of the pregnant uterus fluctuated dramatically during pregnancy. QSOX1 was ubiquitously expressed in the labyrinth, junction zone, and chorionic plate in the placenta. The quantitative analysis found that this protein was highly expressed in the spinal cord, lens, midbrain, cerebellum, medulla oblongata, and tooth of mouse embryos, followed by the heart, intercostal muscle, diaphragm, intermediate zone, extrinsic ocular muscle, spine, pons, epidermis, tongue, ganglion, vomeronasal organ, thoracic vertebrae, and thymus. Interestingly, QSOX1 was also markedly expressed in olfactory system tissues. This comprehensive spatiotemporal study of QSOX1 protein expression will provide a basis for further investigations of the QSOX1 physiological function in the pregnant uterus, placenta, and developing embryo.

1. Introduction

Quiescin Q6 sulfhydryl oxidase 1 (QSOX1), a flavin adenine dinucleotide (FAD)-dependent sulfhydryl oxidase, was first purified from the rat seminal vesicle secretion and characterized to catalyze the oxidation of low molecular thiol compounds such as glutathione and 2-mercaptoethanol to disulfide bonds [1]. Sequence analyses and biochemical studies revealed that QSOX1 and egg white sulfhydryl oxidase belong to the FAD-dependent sulfhydryl oxidases [2]. Hoober et al. demonstrated that chicken egg white sulfhydryl oxidase utilizes an internal redox-active cysteine bridge and a FAD moiety, the same in the QSOX1, to oxidize low molecular weight thiols; the oxidase also exhibits a high catalytic activity toward a range of reduced peptides and proteins in vitro [3].
QSOX1 has two main isoforms, i.e., long-form (~82 kDa) and short-form (~65 kDa) [4]. The long-form includes a transmembrane region, while the short-form without the transmembrane part is secreted from the cell. Thus, the short form exists in biological fluids such as serum [5], seminal plasma [6], milk [7], etc. QSOX1 has been demonstrated to be expressed ubiquitously in various normal tissues [6,8] and is highly expressed in tumor cells such as breast, prostate, and pancreatic cancers [9]. Interestingly, the short form is the main QSOX1 form [6,8,9].
QSOX1 is expressed in the seminal vesicle, vas deferens, epididymis, and testis in male reproductive tissues [6,8,10]. It is also present in human seminal plasma [6]. The secretory QSOX1 can already be purified from the rodent’s seminal vesicle secretion [1,6]. Its enzyme activity is involved in cross-linking seminal vesicle proteins to form the vaginal plug after mating [11]. It has also been detected in sperm aggregates in mouse uterus and human semen. Those agglutinated sperm are rich in thiols, oxidatively stressed, and apoptotic sperm. Therefore, QSOX1 may help to remove injured sperm [6].
QSOX1 may have different distributions in the same tissue. For example, the expression of QSOX1 gradually increased from caput to cauda segment of the epididymis, while mouse sperm is mature in caudal epididymis, suggesting its role in sperm maturation [10]. Therefore, unraveling the detailed spatial and temporal expression of QSOX1 may help understand the physiological functions that QSOX1 may play in the tissue.
Guinea pig QSOX1 is expressed in the uterine epithelium during the estrus cycle. Because of its sulfhydryl oxidase activities, it is considered involved in the extracellular matrix modification during uterine differentiation and blastocyst implantation [12]. Although QSOX1 is present in the uterus [8], no report addressed QSOX1′s expression in the pregnant uterus. QSOX1 is also present in the syncytiotrophoblast of the human placenta [13] and has been suggested to regulate trophoblastic apoptosis in preeclampsia [14]; however, the dynamic changes of QSOX1 levels during the whole placentation process are still unknown. While a paper has been published on the expression of QSOX1 in the developing mouse embryo [15], we found some discrepancies, and a more comprehensive study is still necessary. Therefore, this study investigated the spatial and temporal expression of QSOX1 in the gestational uterus, placenta, and developing embryos of mice during pregnancy.

2. Materials and Methods

2.1. Animals and Tissue Collection

Specific pathogen-free outbred CD-1 mice purchased from BioLASCO (Yilan, Taiwan) were bred following institutional guidelines for the care and use of experimental animals. All animal experiments were approved and carried out under the regulation and permission of Institutional Animal Care and Use Committee protocols at MacKay Memorial Hospital (approval number: MMH-M-S-110-38). Animals were housed under controlled lighting (cycle of 14 h light and 10 h dark) at 21–22 °C and had free access to food and water.
The estrus cycle stages were determined using the vaginal smear method [16]. Before the vaginal smear, we used the MK-10B impedance checker (Muromachi Kikai, Tokyo, Japan) to monitor the electrical resistance in the vagina as a staging reference. The resistance value of the vagina has been used to determine the rat estrus cycle [17] and helps monitor the different stages of the estrus cycle in mice [18].
After observing the vaginal plug in the morning, we picked out the female mice, and the animals were sacrificed and dissected at noon. We designated the time as 0.5 days post-coitus (dpc). To study the detailed cellular expression of the QSOX1 protein in the uterus, placenta, and developing embryo tissues of pregnant female mice with various gestation days, we collected the tissues of each mouse; one part of which was stored in liquid nitrogen for protein analysis and the other one part was fixed in 10% (v/v) neutral buffered formalin for immunohistochemical analysis. The formalin-fixed paraffin-embedded tissues at 0.5, 6.5, 9.5, 11.5, 13.5, 15.5, and 17.5 dpc were used to reveal the temporal and spatial expression of QSOX1 protein.

2.2. QSOX1 Antiserum

The secreted form of QSOX1 was purified to homogeneity from mouse seminal vesicle secretion using cation-exchange high-performance liquid chromatography [6]. QSOX1 was dissolved in normal saline (0.5 mg/mL), emulsified with Freund’s complete adjuvant (1:1, v/v) (Sigma-Aldrich, St. Louis, MO, USA), and 2 mL of the emulsion was injected into multiple subcutaneous sites of New Zealand white rabbits. Then, QSOX1 (0.5 mg/mL) and Freund’s incomplete adjuvant (1:1, v/v, Sigma-Aldrich) emulsion were administrated twice every three weeks. Antiserum was collected ten days after the last injection.

2.3. Western Blot Analysis

The tissues were homogenized in an ice-cold phosphate-buffered saline (PBS) buffer supplemented with 1% Triton X-100 and protease inhibitor cocktail (Sigma-Aldrich), pH 7.4. Tissue lysates were centrifuged at 20,000× g for 20 min at 4 °C to remove the debris. Supernatants were frozen at −80 °C for 30 min and centrifuged again at 20,000× g for 5 min at 4 °C to remove the residual fat. Protein extracts were quantified using a BCA kit (Pierce); tissue homogenates (50 μg) were resolved using sodium dodecyl sulfate-polyacrylamide gel electrophoresis (SDS-PAGE) on a 12% gel (8.2 × 7.3 × 0.075 cm) and stained with Coomassie brilliant blue or electrotransferred onto a nitrocellulose membrane. For Western blotting, we incubated the membrane with 5% (w/v) skim milk in Tris-buffered saline containing 50 mM Tris-HCl, 150 mM NaCl, and 0.1% (v/v) Tween-20, pH 7.5 (TBST, the blocking solution) for 1 h and then incubated with anti-QSOX1 antiserum (1:5000), monoclonal anti-β-actin antibody, or monoclonal anti-α-tubulin antibody (1:10,000, Sigma-Aldrich) in blocking solution for 1 h at room temperature (RT). After washing thrice for 5 min with TBST, the horseradish peroxidase (HRP)-conjugated goat anti-rabbit IgG (Jackson ImmunoResearch Laboratories, Baltimore, PA, USA) or the HRP-conjugated goat anti-mouse IgG (Promega, Madison, WI, USA) diluted 1:10,000 in blocking solution was incubated with the membrane for 1 h at RT. After washing thrice for 5 min with TBST, the immunoreacted protein was revealed using a T-Pro LumiLong Plus Chemiluminescent Substrate Kit (T-Pro Biotechnology, New Taipei, Taiwan) and detected using the ChemiDoc-It Imaging System (UVP, Upland, CA, USA).

2.4. Immunohistochemical Staining and Quantification

Tissues were collected, fixed in 10% (v/v) neutral buffered formalin, embedded in paraffin, and cut into 5 μm sections. After the slides were deparaffinized with 100% xylene and rehydrated with gradient ethanol in water, they were placed in a plastic slide holder filled with the antigen retrieval buffer (10 mM Tris-Base, 0.05% Tween 20, pH 9.0), soaked in a 70 °C water bath, rapidly boiled to >95 °C, and maintained for 20 min. After cooling to room temperature, the slides were treated with 3% (v/v) H2O2 in PBS for 15 min, blocked with 10% (v/v) normal goat serum in PBS (the blocking solution) for 1 h at room temperature, and then incubated with or without anti-QSOX1 antiserum diluted 1: 200 in blocking solution at 37 °C for 1 h. After washing thrice for 5 min with PBS, the slides were treated with HRP-conjugated goat anti-rabbit IgG (Jackson ImmunoResearch Laboratories) diluted 1: 1000 in blocking solution for 1 h at RT. The slides were washed as described above and the staining signal was developed by PermaRed/HRP (Diagnostic BioSystems, Pleasanton, CA, USA) for 5~8 min depending on tissues. Slides were then counterstained with Mayer’s hematoxylin solution (BaSO, New Taipei, Taiwan) for 2 min, air-dried, and mounted with a permanent mounting media (Assistant-Histokitt, Sondheim, Germany). Staining images were automated acquired using a TissueFAXS system (TissueGnostics, Vienna, Austria) coupled with the Zeiss AxioImager Z1 microscope system equipped with a CCD camera.
QSOX1 protein expression levels on immunohistochemically stained tissues were quantified using the HistoQuest software (TissueGnostics). An area was determined as a region of interest; HistoQuest first discriminates cell range based on the primary marker (hematoxylin), that is, to use the position of the cell nucleus as a reference point to find the area of each cell. After the normalization against the background signal, the intensity of the antibody staining signal is quantified by the software’s proprietary method of colorimetric separation; therefore, the QSOX1 protein intensity in a single cell can be quantified. The results were visualized in the dot plot scattergram.

2.5. Statistical Analysis

Data are presented as the mean ± standard deviation (SD). One-way analysis of variance (ANOVA) with Tukey’s multiple comparisons test was used to evaluate statistical differences between groups using GraphPad Prism version 6 (GraphPad, San Diego, CA, USA). A p-value of <0.05 was considered statistically significant.

3. Results

3.1. Expression of QSOX1 in the Non-Pregnant and Early Pregnant Uterus

We analyzed QSOX1 expression in the mouse uterus during the estrous cycle by Western blotting. Two forms (about 80 and 65 kDa bands) of QSOX1 were detected from thousands of protein components in the uterine tissue extract collected from the cycling uterus, especially prominent in proestrus and estrus uteri. The 65 kDa band was the primary QSOX1 form (Figure 1a and Figure S1).
Immunohistochemical staining was conducted using anti-QSOX1 antiserum to reveal the cellular localization of the QSOX1 protein in the pregnant uterus. The QSOX1 protein was immunolocalized in luminal and glandular epithelial cells and was more weakly expressed in stromal cells, circular, and longitudinal smooth muscle cells in the non-pregnant uterus (Figure 1b, right). When slides were stained without anti-QSOX1 antiserum, nearly no signal was detected (Figure 1b, left; Figure S2). QSOX1 levels were remarkably elevated in uterine lumen and glands at 0.5 dpc, left still weaker signal in stromal cells, circular, and longitudinal smooth muscle cells (Figure 1c). Later, QSOX1 was highly expressed in 6.5 dpc pregnant uterus, including the decidua at mesometrial and anti-mesometrial regions, lateral vascular sinuses, uterine glands, ectoplacental cone, and embryo; however, the trophoblast giant cells around the embryo, circular, and longitudinal smooth muscle cells showed relatively weaker staining (Figure 1d–g).

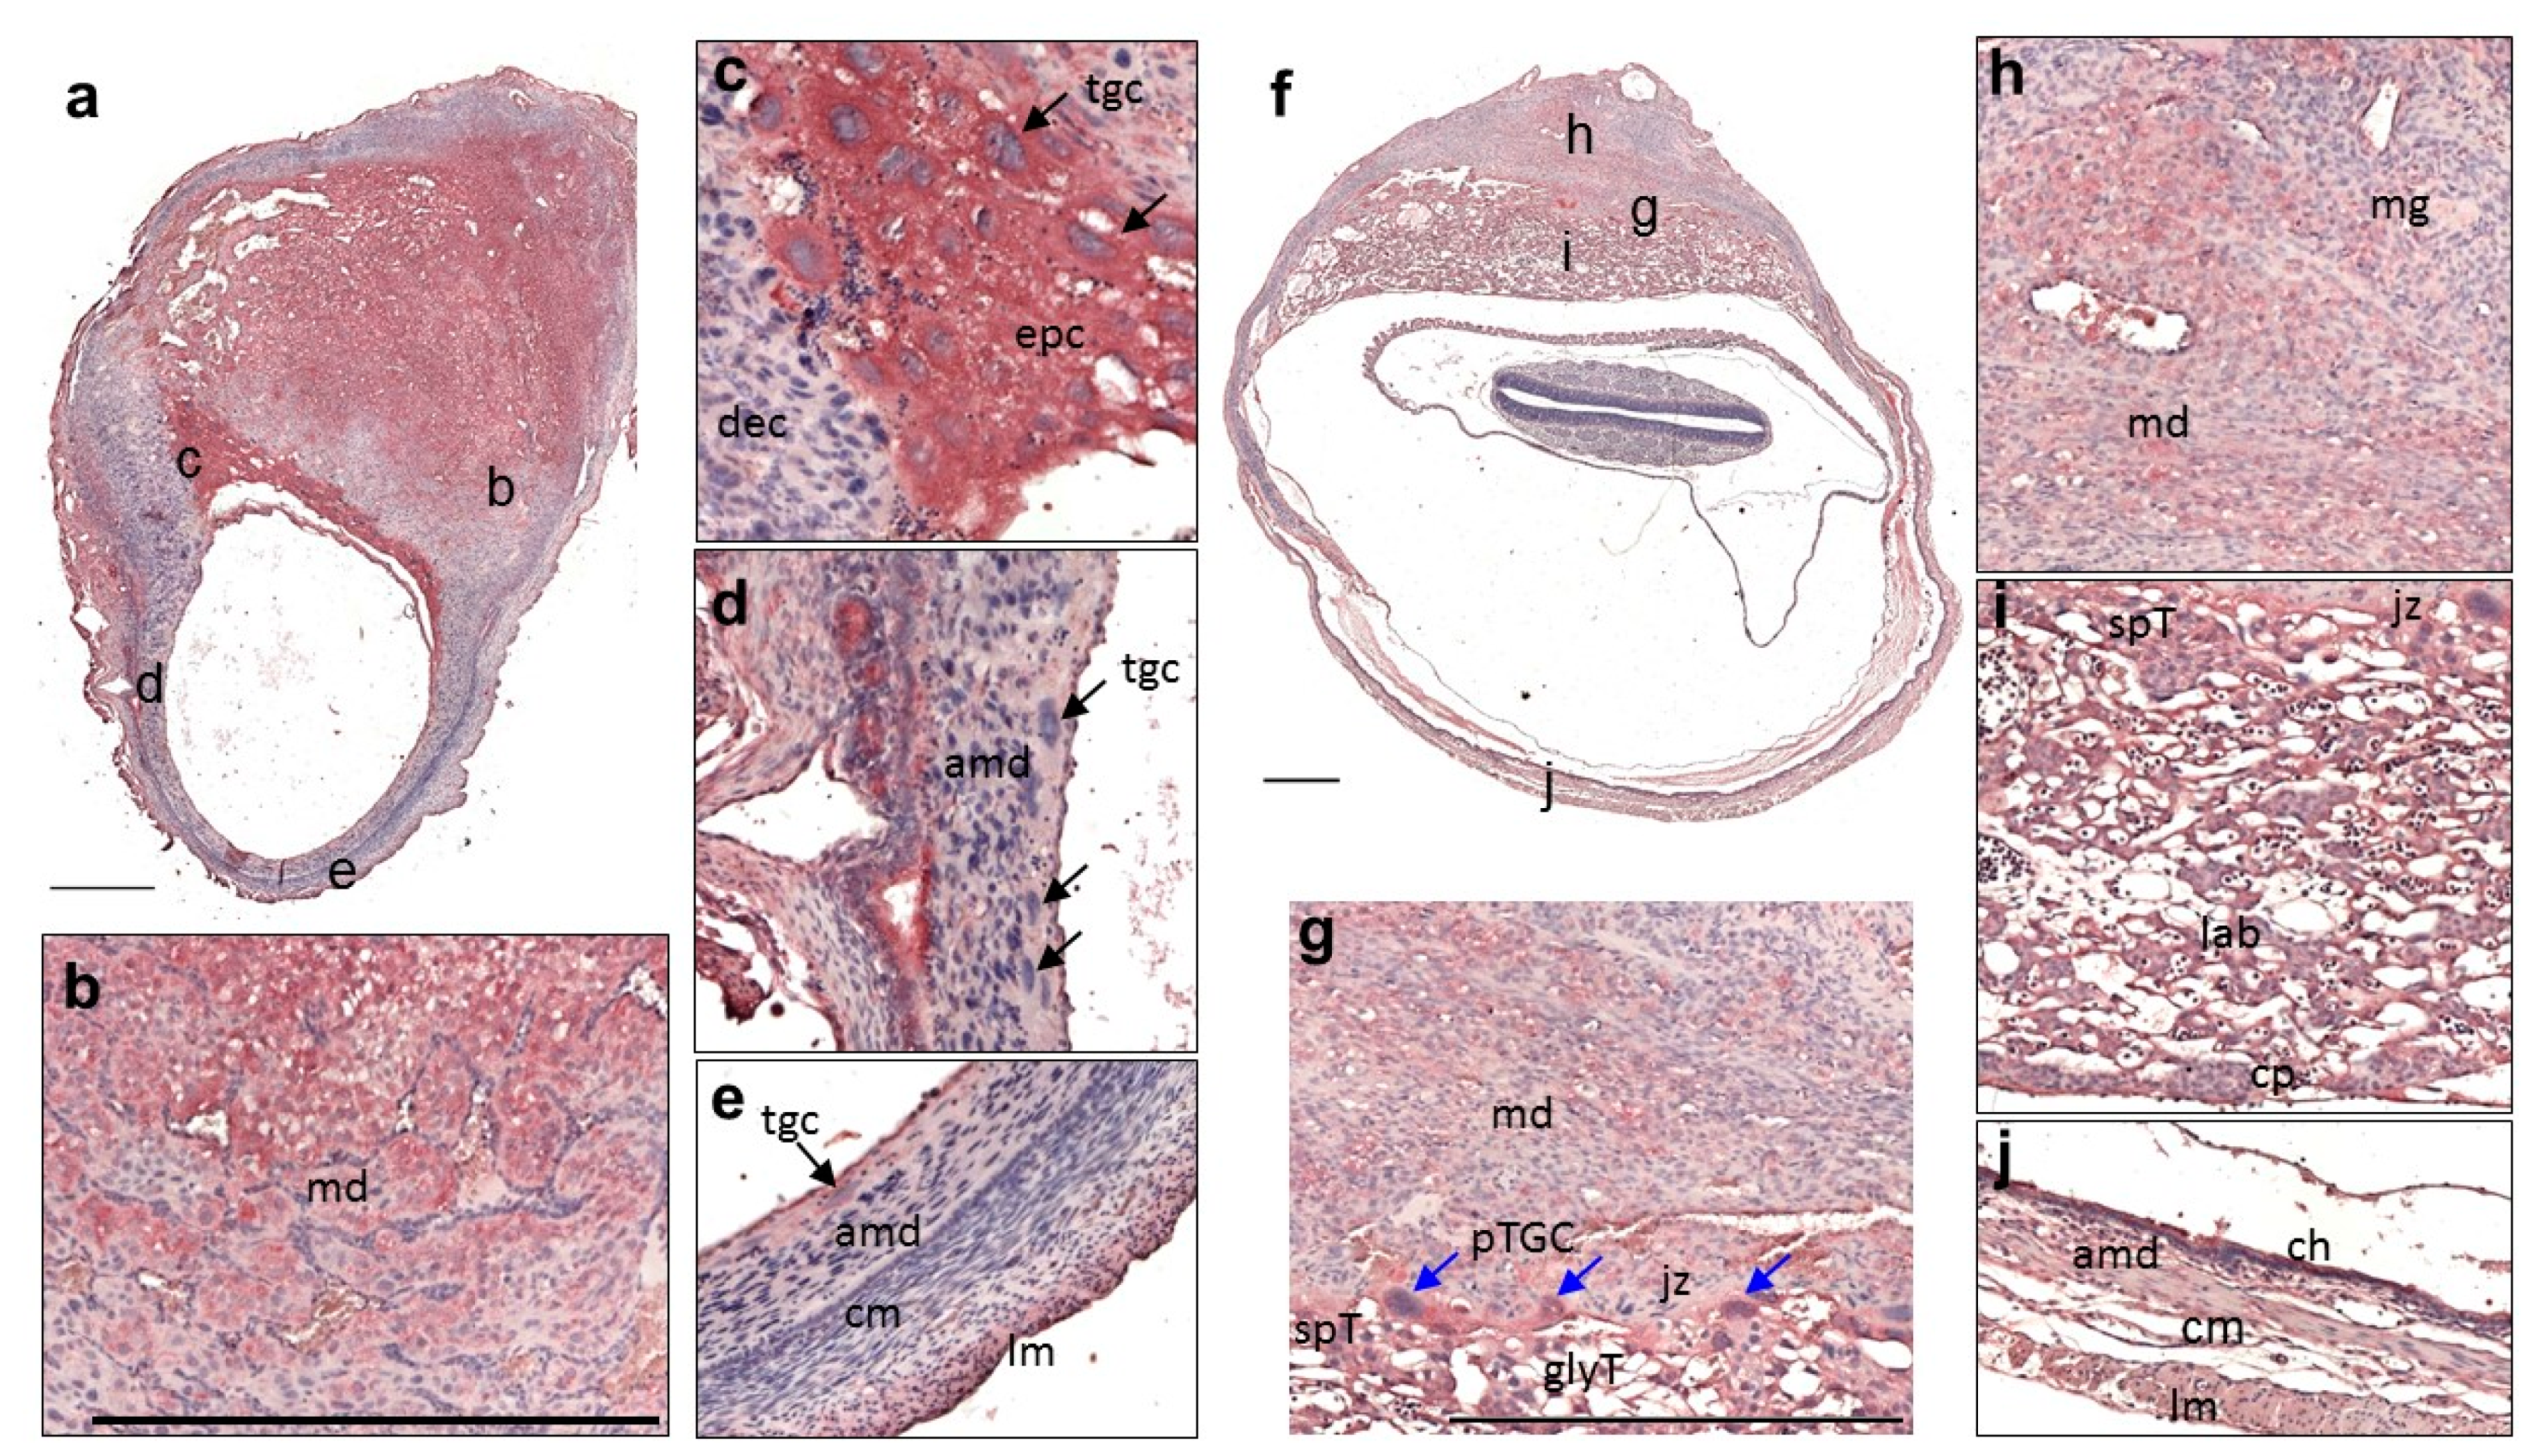
3.2. Expression of QSOX1 in the Pregnant Uterus and Placenta at 9.5 to 17.5 dpc

The expression of QSOX1 presented a sharp contrast in the 9.5 dpc uterus. QSOX1 was highly expressed in mesometrial decidua but regraded severely in anti-mesometrial decidua (Figure 2a). QSOX1′s levels decreased at the mesometrial decidua near the ectoplacental cone (Figure 2a,b). The intriguing feature of 9.5 dpc is that QSOX1 was intensively expressed in the trophoblast giant cells (TGCs) of the ectoplacental cone (Figure 2c). Some uterine glands still retained the considerable QSOX1 expression, but the QSOX1 staining in anti-mesometrial decidua was already feeble (Figure 2d,e). The TGCs around the embryo showed weak QSOX1 staining (Figure 2d,e). The protein was expressed relatively weak in the uterine muscle, while its levels in the circular muscle were close to the background staining (Figure 2d,e).
At 11.5 dpc, QSOX1 had a further down-regulation trend in the uterine mesometrial decidua, but the staining was still visible (Figure 2g,h). The main QSOX1 in the mouse placenta was still the short form (Figure S3). The parietal trophoblast giant cells (p-TGCs), spongiotrophoblast, and glycogen trophoblast cells were all highly expressed in the junctional zone of the placenta (Figure 2g,i). At the same time, QSOX1 levels were relatively low in the mesometrial gland. The trophoblasts in blood vessels near the mesometrial decidua also showed QSOX1 expression (Figure 2h). In addition, the staining signal also was intense in fetal and maternal blood vessels in the labyrinth, and even fetal erythrocytes exhibited QSOX1 staining signals (Figure 2i). The chorionic plate also expressed strong QSOX1 (Figure 2i). Compared with 9.5 dpc, QSOX1 in the uterine muscle layer seemed to have a more appreciable expression at 11.5 dpc (Figure 2j).
At 13.5 dpc, QSOX1 was weakly stained in some mesometrial decidua but strongly expressed in the mesometrial gland (Figure 3a–c). The p-TGC, the placental border, always showed considerable staining for QSOX1 (Figure 3b–d). Spongiotrophoblasts in the junction zone and their extension in the labyrinth showed strong QSOX1 staining signals (Figure 3b,d). Moreover, QSOX1 was highly expressed in the chorion; the anti-mesometrial decidua had almost regressed. The staining in the uterine muscle was still remarkable (Figure 3e).
QSOX1 was intensively stained in the uterus and placenta on day 17.5 (Figure 3f). Uterine mesometrial glands (Figure 3g) and the spongiotrophoblasts (Figure 3g–i) exhibited a robust QSOX1 expression. At the same time, glycogen trophoblasts that invaded the decidua expressed relatively weak QSOX1 compared with spongiotrophoblasts (Figure 3g–i). In the uterine muscle, it was still manifested in the longitudinal muscle (Figure 3h). On the chorionic plate, QSOX1 also showed strong expression (Figure 3j).

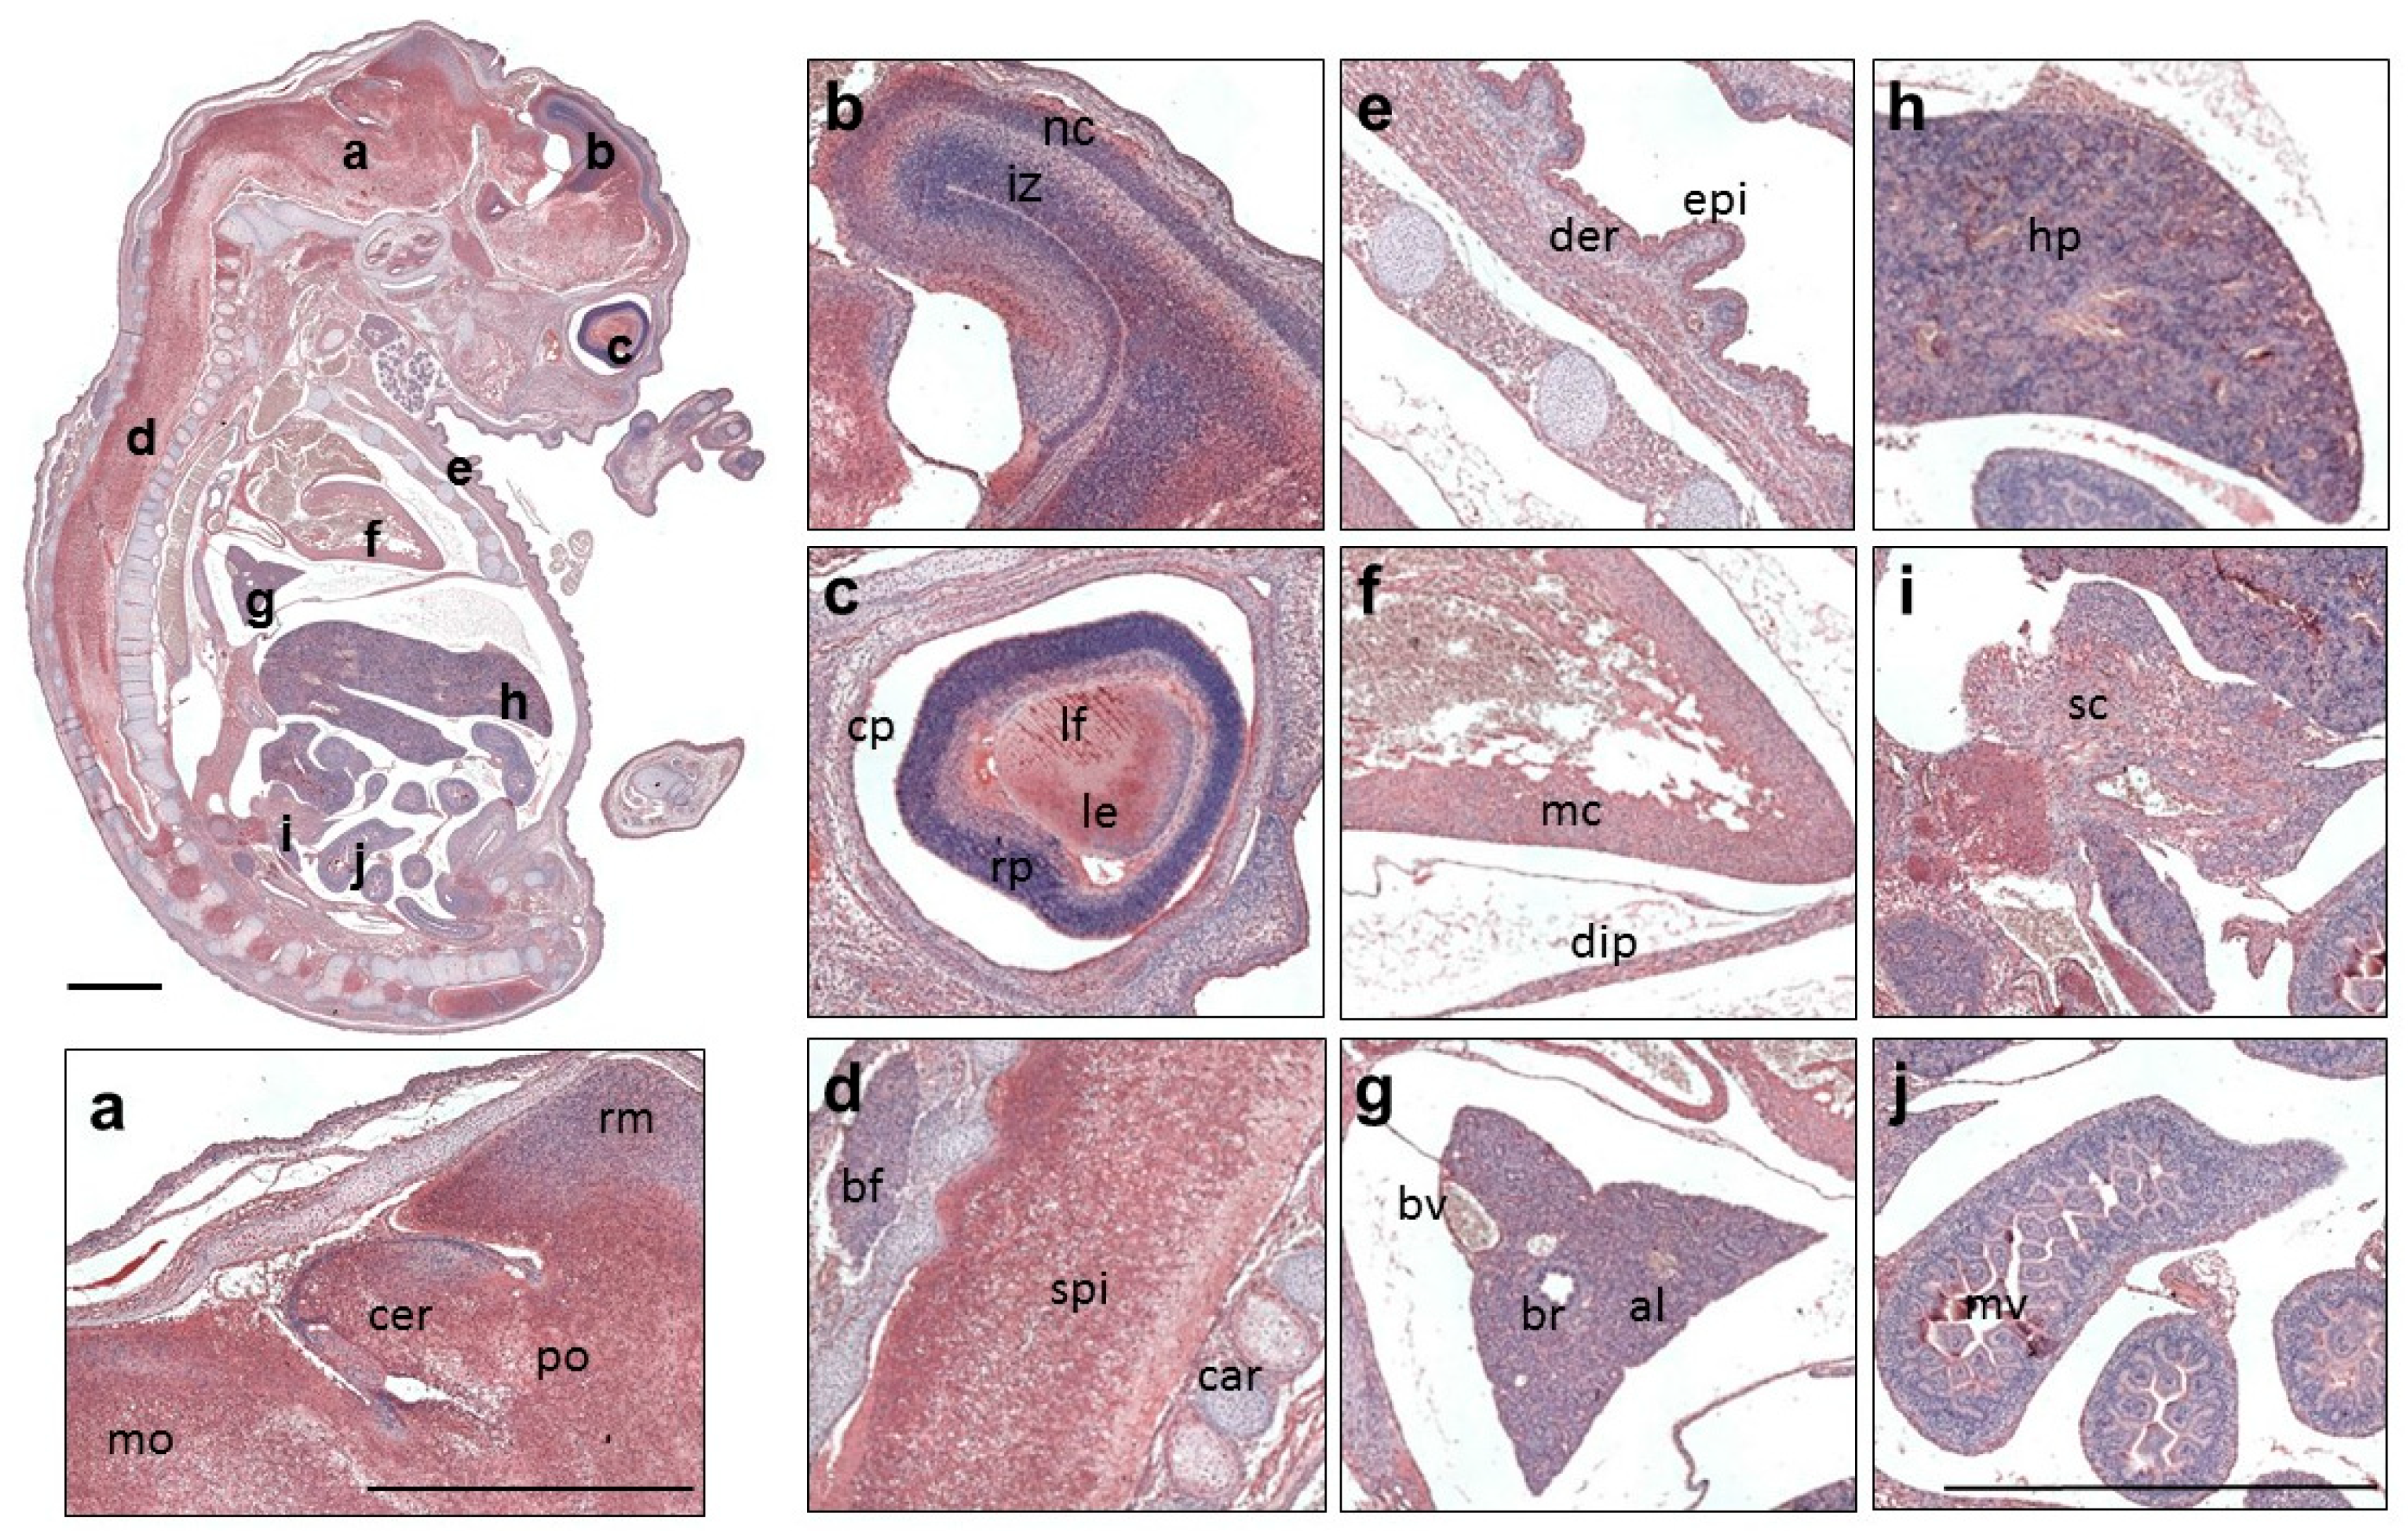
3.3. Expression Profile of QSOX1 in the Mouse Embryo

The long and short forms of QSOX1 were detected in the embryo tissue extract, and the short form was the major one (Figure S4).
Immunohistochemical staining showed that QSOX1 was widely expressed in various tissues at 15.5 and 17.5 dpc embryos (Figure 4a, Figures S5 and S6a). HistoQuest was applied to quantify levels of QSOX1 protein expressed in each embryonic tissue. We selected an area on each marked tissue (a to v) to include approximately 100 to 600 cells depending on the tissue size. For example, we set a rectangular area in the midbrain and identified 506 cells. The staining intensity of QSOX1 in each cell was shown in the dot blot scattergram with an average intensity of 76 (Figure 4b). Based on this principle, we quantified the expression intensity of QSOX1 in 22 embryonic tissues. We divide the average intensity into three levels; intensity <40 is the weak expression, 40–60 is defined as medium expression, and greater than 60 is the strong expression. As shown in Figure 4c, QSOX1 was significantly expressed in the spinal cord, lens, midbrain, and medulla oblongata. The heart, intercostal muscle, diaphragm, intermediate zone, extrinsic ocular muscle, spine, pons, and epidermis showed moderate expression. The lung, liver, submandibular gland, neopallial cortex, inner retina layer, small intestine, dermis, hair follicle, and pancreas were relatively weakly expressed.
QSOX1 was prominently expressed in the brain area at the cerebellum, medulla oblongata, and pons. The midbrain also showed intense staining except for the midbrain roof (Figure 5a). In the striatum, the staining was detected around the neopallial cortex and the intermediate zone (Figure 5b). In the eyes, the lens fiber and epithelium showed more strong staining than the corneal epithelium and retinal pigment (Figure 5c). Significant QSOX1 levels were detected in the spinal cord and observed in the spinal hypertrophic chondrocytes but not in the matured cartilage. Brown fat was weakly stained (Figure 5d). The epidermis showed intense QSOX1 staining, while the dermis was stained relatively weak (Figure 5e). The protein was also expressed in myocardial cells of the heart (Figure 5f), in the lung alveoli and bronchus (Figure 5g), in liver hepatocytes (Figure 5h), in pancreatic secretory cells (Figure 5i), and in mucosal villi of the small intestine (Figure 5j).
Although QSOX1 was still distributed in most embryonic tissues at 17.5 dpc, its levels in various tissues appeared to be changed (Figure S6a). QSOX1 was moderately expressed in the heart, liver, spinal cord, and brown fat, followed by the lung, submandibular gland, epidermis, midbrain, and mesentery. The expression levels in the diaphragm, striatum, small intestine, intercostal muscle, and dermis were low (Figure S6b). Compared with 15.5 dpc embryos, QSOX1 levels in the spinal cord, brain regions, epidermis, and diaphragm turned to decrease but increased in the liver and heart.
Figure 6a showed a representative cross-section image of QSOX1 immunostaining at 17.5 dpc; QSOX1 was strongly expressed in all detected tissues, including the placenta, at the late stage of embryogenesis. Quantification results showed that QSOX1 was significantly expressed in the tooth, moderately in the tongue, the out layer of the spinal cord, ganglion, epidermis, vomeronasal organ, thoracic vertebrae, and thymus, and weakly in the outer edge of the tongue, the inner layer of the spinal cord, submandibular gland, and dermis. In addition, QSOX1 has prominently expressed in the junction zone and the labyrinth in the placenta. During late pregnancy, the protein was weakly expressed in the uterine mesometrial gland and the yolk sac (Figure 6b).
Some vibrissae follicles expressed QSOX1. QSOX1 was also remarkably expressed in the nasal cavity and olfactory epithelium, and a robust QSOX1 protein expression appeared in the vomeronasal epithelium. Weak staining was detected in most of the nasal septal cartilage primordium, but, interestingly, numerous linear solid QSOX1 stainings appeared in the nasal septum and peripheral cartilage of the nasal cavity (Figure 7a), and the linear concrete staining also appeared in the sternebrae (Figure 7c) and spinal bone (Figure 7e). Vigorous QSOX1 staining intensity appeared on the pulp of the tooth and the tongue’s epithelium, while the submandibular glands’ staining was relatively weak (Figure 7b).
QSOX1 was highly expressed in the muscles around the sternum. In contrast to the mature cartilage, this protein was readily detected during the ossification of sternebrae (Figure 7c). QSOX1 was also strongly expressed in tracheal and esophageal epithelial cells and thymocytes (Figure 7d). The protein was scattered on the basal plate and intensely concentrated on the floor plate of the spinal cord, and strongly expressed in ganglion (Figure 7e). The signal of QSOX1 is also clearly displayed in yolk sac epithelial cells (Figure 7f).

4. Discussion

QSOX1 is primarily expressed in the luminal and glandular epithelium in the non-pregnant uterus but is weakly expressed in the muscle and only background stained in the stroma. Although the fertilization signal significantly increases QSOX1 expression in the luminal and glandular epithelium, QSOX1 levels in the stroma and muscle do not fluctuate. Implantation signal significantly up-regulates increases protein levels in decidua cells, which mainly derive from stroma cells. However, QSOX1 levels in the decidua are conspicuously downregulated with growing gestation days, especially in the anti-mesometrial decidua. In addition, uterine longitudinal muscle tends to increase protein levels in the later stages of pregnancy. The dramatic increases and decreases in QSOX1 levels in the pregnant uterus depict that the expression of QSOX1 in the pregnant uterus is delicately regulated.
The expression of QSOX1 in the primary TGCs around the embryo implantation site is relatively weak, while the cells surrounding the 9.5 dpc embryo are even feeble to almost undetectable; however, secondary TGCs of the ectoplacental cone are precursors of the spongiotrophoblast and p-TGCs, two types of main TGC in the junction zone. Indeed, QSOX1 was prominently expressed in the placental junction zone. The differentiation of these two TGCs is inherently different, and the regulation of QSOX1 in the two TGCs is also intriguing.
QSOX1 is highly expressed in the brainstem, including the spinal cord, midbrain, and medulla oblongata. This finding was also confirmed in the rat brain [19,20]. QSOX1 was detected in the central neuron system of the rat brains of embryos and adults [20]. Mairet-Coello et al. hypothesized that QSOX1 could play a role in guiding migrating cells, their settling, and neuronal maturation [20]; however, the results are contradictory with the investigation of QSOX1 in the mouse embryo at late embryogenesis and postnatal day 1 [15], which only slightly stained in the mouse brain by the immunohistochemical staining. The study also reported that fetal and postnatal epithelia and epidermis were not or only weakly stained. In the present study, QSOX1 was detected in the epithelia of numerous tissues such as the uterus, lens, olfactory, yolk sac, amnion, and chorion. The epidermis also showed substantial expression of QSOX1. Previous studies also demonstrated that QSOX1 is expressed in the epidermis of the rat [8,13] and can be cloned from the mouse epidermis [21].
The possible problem is that the antibodies used in that study were made from recombinant proteins produced by Escherichia coli (E. coli). E. coli-derived protein does not equip with the post-translational modification of glycosylation nor the secretory pathway of the eukaryotic cell; thus, the conformation of the recombinant protein is different from the native one. Its antibody may have specificity to QSOX1; however, the sensitivity may be insufficient. When QSOX1 levels in a tissue are low, it may be difficult for the antibody to detect the expression of QSOX1. Owing to high levels of QSOX1 expressed in the seminal vesicle, we can purify the native QSOX1 protein from the seminal vesicle secretion. The machinery of the secretory pathway sophisticatedly folds the native QSOX1; thus, the antibody produced by this native glycoprotein possesses high specificity and sensitivity. QSOX1 can be detected even with relatively low levels in any tissue.
QSOX1 is overexpressed in tumor cells of breast cancer [22] and pancreatic cancer [23]. QSOX1 was demonstrated to activate matrix metalloproteinase (MMP)-2 and MMP-9 activities on the extracellular matrix (ECM) to mediate cancer cell migration [22,23]. Using the short hairpin RNA to knock down the highly expressed QSOX1 in the breast and pancreatic cancer cells significantly inhibited tumor cell invasion [22,23]. These findings suggest high levels of QSOX1 may lead to tumor cell invasion and migration.
In this study, we found that QSOX1 was highly expressed in the spinal cord, brainstem, lens, tooth, and placental trophoblasts. Some cells in these tissues are involved in cell migration during tissue development. For instance, motor neuron migration is involved in the organization of spinal motor neurons [24]. The development of neuron cells in brain tissues, including the midbrain, cerebellum, medulla oblongata, and pons, require the cell migration process [16]. Neural crest cell migration is involved in the development of teeth [25]. Lens morphogenesis needs lens fiber cell migration [26]. QSOX1 is also expressed at a moderate intensity in the epithelial cells of the vomeronasal organ. The embryonic vomeronasal structure equips with migrating neurons such as the endocrine gonadotropin-releasing hormone one neuron, which migrates from the nasal area to the brain area [27]. In addition, QSOX1 is highly expressed in the placenta, especially in trophoblast cells in the junction zone. At the maternal–fetal interface, the migration of trophoblast cells, facilitated by proteinases such as urokinase-type plasminogen activator and MMP-9, is crucial during embryo implantation and placentation [28]. Interestingly, QSOX1 mediates tumor cell invasion/migration by activation of MMP-2 and MMP-9 [23]. These findings might indicate that QSOX1 plays a vital role in cell migration during embryogenesis, but it is also possible that QSOX1 has other functions that need to be clarified by more experiments in the future.
To investigate protein expression levels and their distribution, one should consider the spatiotemporal dynamical changes. The distinct expression levels and localization of QSOX1 described in reports may be caused by sampling at various times and spaces. Our research still has limitations. Serial sections only revealed the expression of QSOX1 in a small part of a tissue, which cannot fully understand the overall distribution of QSOX1 in the tissue under different times and spaces. Of course, the ideal situation is to analyze the genuine expression and distribution of QSOX1 in each tissue in various spatial and temporal conditions using longitudinal and transverse sections of the entire tissue. We acknowledge that this study may not have analyzed QSOX1 expression in all tissues. Nevertheless, there are some new findings, such as the expression in the teeth and vomeronasal organs, which were not found in previous studies.
ECM is a complex and dynamic structure outside the cells, which plays a vital role in development, wound healing, and physiological and pathological processes [29]. QSOX1 activity has been demonstrated to be required to incorporate laminin into fibroblast ECM, and without QSOX1, ECM cell migration is impaired [30]. QSOX1 has also been found to activate the activity of MMP-2 and MMP-9 on ECM of cancer cells [23], suggesting that QSOX1 could modulate ECM properties and affect cell migration.
Exogenous QSOX1 can induce vascular smooth muscle cell migration and proliferation and contribute to neointima thickening of the carotid artery in rats with balloon injury [31]. For future work, we can use the QSOX1, purified from SVS, to approach how QSOX1 modifies the components of ECM and to reveal the underlying mechanism of QSOX1-mediated cell migration—for example, culturing human villous explants or extravillous trophoblast-like 3A cells with QSOX1 to evaluate the effect of QSOX1 on villous outgrowth and trophoblast invasion/migration [32].

5. Conclusions

This study demonstrated that the pregnant uterus, placenta, and developing mouse embryo mainly express the short form (~65 kDa) of QSOX1. Its expression is low in the non-pregnant uterine stroma; however, the level in the decidua during embryo implantation increases significantly. The expression of QSOX1 in the decidua and muscle cells of the pregnant uterus fluctuates dramatically during pregnancy. In the placenta, this protein is strongly expressed in the junction zone and labyrinth. We quantified the relative expression level of QSOX1 in developing mouse embryos; we found that this protein is mainly expressed in the spinal cord, lens, midbrain, cerebellum, medulla oblongata, and tooth of mouse embryos, followed by the heart, intercostal muscle, diaphragm, intermediate zone, extrinsic ocular muscle, spine, pons, epidermis, tongue, ganglion, vomeronasal organ, thoracic vertebrae, and thymus. These findings provide comprehensive information on the temporal and spatial expression of QSOX1 and will help further study the physiological functions of QSOX1 in the pregnant uterus, placenta, and developing embryo.

Supplementary Materials

The following are available online at https://www.mdpi.com/article/10.3390/app112110151/s1, Figure S1: Western blotting detected two forms of QSOX1 in the cycling uterus. Figure S2: Immunohistochemical staining of QSOX1 in the non-pregnant uterus. Figure S3: Western blotting detected a 65-kDa form of QSOX1 in the placenta. Figure S4: Western blotting detected two forms of QSOX1 in the mouse embryo. Figure S5: Expression of QSOX1 in various embryonic tissues at 15.5 dpc. Figure S6: The expression level of QSOX1 in various embryonic tissues at 17.5 dpc. Table S1: Statistical comparison on expression levels among embryonic tissues at 11.5 dpc. Table S2: Statistical comparison on expression levels among embryonic tissues at 17.5 dpc.

Author Contributions

Conceptualization, H.-W.F. and S.-H.L.; methodology, H.-S.L. and T.-H.Y.; software, H.-S.L. and T.-H.Y.; validation, H.-S.L. and T.-H.Y.; investigation, H.-S.L.; data curation, R.K.-K.L. and S.-H.L.; writing—original draft preparation, H.-S.L., H.-W.F. and S.-H.L.; writing—review and editing, S.-H.L.; supervision, S.-H.L. All authors have read and agreed to the published version of the manuscript.

Funding

This research received no external funding.

Institutional Review Board Statement

All animal experiments were approved and carried out under the regulation and permission of Institutional Animal Care and Use Committee protocols at MacKay Memorial Hospital (approval number: MMH-M-S-110-38).

Informed Consent Statement

Not applicable.

Data Availability Statement

The data presented in this study are available on request from the corresponding author.

Conflicts of Interest

The authors declare no conflict of interest.

References

  1. Ostrowski, M.; Kistler, W.; Williams-Ashman, H. A flavoprotein responsible for the intense sulfhydryl oxidase activity of rat seminal vesicle secretion. Biochem. Biophys. Res. Commun. 1979, 87, 171–176. [Google Scholar] [CrossRef]
  2. Hoober, K.L.; Glynn, N.M.; Burnside, J.; Coppock, D.L.; Thorpe, C. Homology between Egg White Sulfhydryl Oxidase and Quiescin Q6 Defines a New Class of Flavin-linked Sulfhydryl Oxidases. J. Biol. Chem. 1999, 274, 31759–31762. [Google Scholar] [CrossRef] [Green Version]
  3. Hoober, K.L.; Sheasley, S.L.; Gilbert, H.F.; Thorpe, C. Sulfhydryl Oxidase from Egg White A facile catalyst for disulfide bond formation in proteins and peptides. J. Biol. Chem. 1999, 274, 22147–22150. [Google Scholar] [CrossRef] [Green Version]
  4. Rudolf, J.; Pringle, M.A.; Bulleid, N.J. Proteolytic processing of QSOX1A ensures efficient secretion of a potent disulfide catalyst. Biochem. J. 2013, 454, 181–190. [Google Scholar] [CrossRef]
  5. Israel, B.A.; Jiang, L.; Gannon, S.A.; Thorpe, C. Disulfide bond generation in mammalian blood serum: Detection and purification of quiescin-sulfhydryl oxidase. Free. Radic. Biol. Med. 2014, 69, 129–135. [Google Scholar] [CrossRef] [Green Version]
  6. Wang, T.-E.; Yeh, L.-Y.; Kuo-Kuang Lee, R.; Lu, C.-H.; Yang, T.-H.; Kuo, Y.-W.; Joshi, R.; Tsai, P.-S.; Li, S.-H. Secretory mouse quiescin sulfhydryl oxidase 1 aggregates defected human and mouse spermatozoa in vitro and in vivo. iScience 2021, 103167. [Google Scholar] [CrossRef]
  7. Jaje, J.; Wolcott, H.; Fadugba, O.; Cripps, D.; Yang, A.J.; Mather, I.H.; Thorpe, C. A Flavin-Dependent Sulfhydryl Oxidase in Bovine Milk. Biochemistry 2007, 46, 13031–13040. [Google Scholar] [CrossRef] [PubMed] [Green Version]
  8. Tury, A.; Mairet-Coello, G.; Esnard-Fève, A.; Benayoun, B.; Risold, P.-Y.; Griffond, B.; Fellmann, D. Cell-specific localization of the sulphydryl oxidase QSOX in rat peripheral tissues. Cell Tissue Res. 2006, 323, 91–103. [Google Scholar] [CrossRef] [PubMed]
  9. Lake, D.F.; Faigel, U.O. The Emerging Role of QSOX1 in Cancer. Antioxid. Redox Signal. 2014, 21, 485–496. [Google Scholar] [CrossRef] [Green Version]
  10. Wang, T.-E.; Li, S.-H.; Minabe, S.; Anderson, A.L.; Dun, M.D.; Maeda, K.-I.; Matsuda, F.; Chang, H.-W.; Nixon, B.; Tsai, P.-S.J. Mouse quiescin sulfhydryl oxidases exhibit distinct epididymal luminal distribution with segment-specific sperm surface associations†. Biol. Reprod. 2018. [Google Scholar] [CrossRef]
  11. Balu, R.; Ramachandran, S.S.; Paramasivam, S.G. Evidence for mouse sulfhydryl oxidase-assisted cross-linking of major seminal vesicle proteins. Mol. Reprod. Dev. 2019, 86, 1682–1693. [Google Scholar] [CrossRef] [PubMed]
  12. Musard, J.-F.; Sallot, M.; Dulieu, P.; Fraîchard, A.; Ordener, C.; Remy-Martin, J.-P.; Jouvenot, M.; Adami, P. Identification and Expression of a New Sulfhydryl Oxidase SOx-3 during the Cell Cycle and the Estrus Cycle in Uterine Cells. Biochem. Biophys. Res. Commun. 2001, 287, 83–91. [Google Scholar] [CrossRef] [PubMed]
  13. Thorpe, C.; Coppock, D.L. Generating Disulfides in Multicellular Organisms: Emerging Roles for a New Flavoprotein Family. J. Biol. Chem. 2007, 282, 13929–13933. [Google Scholar] [CrossRef] [Green Version]
  14. Li, J.; Tong, C.; Xu, P.; Wang, L.; Han, T.-L.; Wen, L.; Luo, X.; Tan, B.; Zhu, F.; Gui, S.; et al. QSOX1 regulates trophoblastic apoptosis in preeclampsia through hydrogen peroxide production. J. Matern. Neonatal Med. 2018, 32, 3708–3715. [Google Scholar] [CrossRef] [PubMed] [Green Version]
  15. Portes, K.F.; Ikegami, C.M.; Getz, J.; Martins, A.P.; De Noronha, L.; Zischler, L.F.; Klassen, G.; Camargo, A.A.; Zanata, S.M.; Bevilacqua, E.; et al. Tissue distribution of quiescin Q6/sulfhydryl oxidase (QSOX) in developing mouse. J. Mol. Histol. 2007, 39, 217–225. [Google Scholar] [CrossRef]
  16. Bertolin, K.; Murphy, B.D. 7-Reproductive Tract Changes During the Mouse Estrous Cycle. In The Guide to Investigation of Mouse Pregnancy; Croy, B.A., Yamada, A.T., DeMayo, F.J., Adamson, Eds.; Academic Press: Boston, MA, USA, 2014; pp. 85–94. ISBN 978-0-12-394445-0. [Google Scholar]
  17. Koto, M.; Miwa, M.; Togashi, M.; Tsuji, K.; Okamoto, M.; Adachi, J. A Method for Detecting the Optimum Day for Mating during 4-day Estrous Cycle in the Rat; Measuring the Value of Electrical Impedance of Vagina. Exp. Anim. 1987, 36, 195–198. [Google Scholar] [CrossRef]
  18. Chern, S.-R.; Li, S.-H.; Lu, C.-H.; Chen, E.I.T. Spatiotemporal expression of the serine protease inhibitor, SERPINE2, in the mouse placenta and uterus during the estrous cycle, pregnancy, and lactation. Reprod. Biol. Endocrinol. 2010, 8, 127. [Google Scholar] [CrossRef] [PubMed] [Green Version]
  19. Mairet-Coello, G.; Tury, A.; Esnard-Feve, A.; Fellmann, D.; Risold, P.-Y.; Griffond, B. FAD-linked sulfhydryl oxidase QSOX: Topographic, cellular, and subcellular immunolocalization in adult rat central nervous system. J. Comp. Neurol. 2004, 473, 334–363. [Google Scholar] [CrossRef] [PubMed]
  20. Mairet-Coello, G.; Tury, A.; Fellmann, D.; Risold, P.-Y.; Griffond, B. Ontogenesis of the sulfhydryl oxidase QSOX expression in rat brain. J. Comp. Neurol. 2005, 484, 403–417. [Google Scholar] [CrossRef]
  21. Matsuba, S.; Suga, Y.; Ishidoh, K.; Hashimoto, Y.; Takamori, K.; Kominami, E.; Wilhelm, B.; Seitz, J.; Ogawa, H. Sulfhydryl oxidase (SOx) from mouse epidermis: Molecular cloning, nucleotide sequence, and expression of recombinant protein in the cultured cells. J. Dermatol. Sci. 2002, 30, 50–62. [Google Scholar] [CrossRef]
  22. A Katchman, B.; Ocal, I.T.; E Cunliffe, H.; Chang, Y.-H.; Hostetter, G.; Watanabe, A.; LoBello, J.; Lake, D.F. Expression of quiescin sulfhydryl oxidase 1 is associated with a highly invasive phenotype and correlates with a poor prognosis in Luminal B breast cancer. Breast Cancer Res. 2013, 15, R28. [Google Scholar] [CrossRef] [Green Version]
  23. Katchman, B.A.; Antwi, K.; Hostetter, G.; Demeure, M.J.; Watanabe, A.; Decker, G.A.; Miller, L.J.; Von Hoff, D.D.; Lake, D.F. Quiescin Sulfhydryl Oxidase 1 Promotes Invasion of Pancreatic Tumor Cells Mediated by Matrix Metalloproteinases. Mol. Cancer Res. 2011, 9, 1621–1631. [Google Scholar] [CrossRef] [Green Version]
  24. Price, S.R. Cell adhesion and migration in the organization of spinal motor neurons. Cell Adhes. Migr. 2012, 6, 385–389. [Google Scholar] [CrossRef] [PubMed] [Green Version]
  25. Zhang, Y.; Wang, S.; Song, Y.; Han, J.; Chai, Y.; Chen, Y. Timing of odontogenic neural crest cell migration and tooth-forming capability in mice. Dev. Dyn. 2003, 226, 713–718. [Google Scholar] [CrossRef]
  26. Cvekl, A.; Ashery-Padan, R. The cellular and molecular mechanisms of vertebrate lens development. Development 2014, 141, 4432–4447. [Google Scholar] [CrossRef] [Green Version]
  27. Katreddi, R.R.; Forni, P.E. Mechanisms underlying pre- and postnatal development of the vomeronasal organ. Cell. Mol. Life Sci. 2021, 78, 5069–5082. [Google Scholar] [CrossRef] [PubMed]
  28. El-Hashash, A.H.; Warburton, D.; Kimber, S.J. Genes and signals regulating murine trophoblast cell development. Mech. Dev. 2010, 127, 1–20. [Google Scholar] [CrossRef] [Green Version]
  29. DeSimone, D.; Mecham, R. Extracellular Matrix in Development; The Company of Biologists Ltd.: Cambridge, UK, 2013; ISBN 978-3-642-35934-7. [Google Scholar]
  30. Ilani, T.; Alon, A.; Grossman, I.; Horowitz, B.; Kartvelishvily, E.; Cohen, S.R.; Fass, D. A Secreted Disulfide Catalyst Controls Extracellular Matrix Composition and Function. Science 2013, 341, 74–76. [Google Scholar] [CrossRef] [PubMed]
  31. Borges, B.E.; Appel, M.H.; Cofré, A.R.; Prado, M.L.; Steclan, C.A.; Esnard, F.; Zanata, S.M.; Laurindo, F.R.; Nakao, L.S. The flavo-oxidase QSOX1 supports vascular smooth muscle cell migration and proliferation: Evidence for a role in neointima growth. Biochim. Biophys. Acta (BBA)-Mol. Basis Dis. 2015, 1852, 1334–1346. [Google Scholar] [CrossRef] [Green Version]
  32. Chern, S.-R.; Li, S.-H.; Chiu, C.-L.; Chang, H.-H.; Chen, C.-P.; Chen, E.I.T. Spatiotemporal expression of SERPINE2 in the human placenta and its role in extravillous trophoblast migration and invasion. Reprod. Biol. Endocrinol. 2011, 9, 106. [Google Scholar] [CrossRef] [Green Version]
Figure 1. Expression of QSOX1 in the mouse uterus. (a) Western blotting detected two forms of QSOX1 in the uterus homogenates, with the ~65 kDa protein as the primary form. P, proestrus; E, estrus; M, metestrus; D, diestrus. Original blots are provided in the Supplementary Materials, Figure S1. Immunohistochemical staining of QSOX1 in the mouse uterus at non-pregnancy (b) or gestational days 0.5 dpc (c) and 6.5 dpc (d). The control section without treating with anti-QSOX1 antiserum showed nearly no staining signal (b). (eg) show partial enlarged images of the uterus at 6.5 dpc (d). Red colors show QSOX1 staining, and blue shows the counterstain of hematoxylin in the nucleus. Scale bar = 200 μm. Abbreviations: amd, anti-mesometrial decidua; bv, blood vessel; cm, circular muscle; dec, decidua; e, embryo; epc, ectoplacental cone; gc, giant cells; ic, implantation crypt; lm, longitudinal muscle; md, mesometrial decidua; s, stroma; ug, uterine glands; ul, uterine lumen.
Applsci 11 10151 g001
Figure 2. Expression of QSOX1 in the pregnant uterus and placenta at 9.5 and 11.5 dpc. (a) Representative image of immunohistochemical staining of QSOX1 in the pregnant uterus at 9.5 dpc. (be) Enlarged views of the marked area in (a). (f) Representative image of immunohistochemical staining of QSOX1 at 11.5 dpc. (gj) Enlarged views of the marked area in (f). The blue arrow indicates the parietal trophoblast giant cells. Red colors show QSOX1 staining, and blue shows the counterstain of hematoxylin in the nucleus. Scale bar = 500 μm. Abbreviations: amd, anti-mesometrial decidua; ch, chorion; cm, circular muscle; cp, chorionic plate; dec, decidua; epc, ectoplacental cone; glyT, glycogen trophoblast; jz, junction zone; lab, labyrinth; lm, longitudinal muscle; md, mesometrial decidua; mg, mesometrial gland; pTGC, parietal trophoblast giant cell; spT, spongiotrophoblast; tgc, trophoblast giant cell.
Applsci 11 10151 g002
Figure 3. Expression of QSOX1 in the pregnant uterus and placenta at 13.5 and 17.5 dpc. (a) Representative image of immunohistochemical staining of QSOX1 at 13.5 dpc. (be) Enlarged views of the marked area in (a). (f) Representative image of immunohistochemical staining of QSOX1 at 17.5 dpc. (gj) Enlarged views of the marked area in (f). The blue arrow indicates the parietal trophoblast giant cells. Red colors show QSOX1 staining, and blue shows the counterstain of hematoxylin in the nucleus. Scale bar = 500 μm (a) and (f); 400 μm (be) and (gj). Abbreviations: ch, chorion; cm, circular muscle; cp, chorionic plate; dec, decidua; glyT, glycogen trophoblast; lab, labyrinth; lm, longitudinal muscle; mg, mesometrial gland; spT, spongiotrophoblast.
Applsci 11 10151 g003
Figure 4. The expression level of QSOX1 in various embryonic tissues at 15.5 dpc. (a) A representative image of QSOX1 distribution in the 15.5 dpc embryo. The control staining without anti-QSOX1 antiserum is shown in Figure S5. The marks (a to v) indicate the tissues subjected to quantify and their locations. Scale bar = 1 mm. (b) The expression intensity of QSOX1 in all cells covered by the midbrain’s rectangular area, region of interest, was quantified using HistoQuest, as shown in the scattergram at the right. (c) The scatter plot shows the mean intensity of QSOX1 in cells of each tissue; every small circle indicates the expression intensity of QSOX1 in a single cell. Statistical comparison on expression levels among tissues is shown in the Supplementary Materials, Table S1.
Applsci 11 10151 g004
Figure 5. Cellular expression and localization of QSOX1 in tissues of the embryo at 15.5 dpc. The representative longitudinal section of the 15.5 dpc embryo is shown on the top left. The detailed QSOX1 cellular distribution is enlarged from ten subregions (a to f). (a) the brain; (b) the striatum; (c) the eye; (d) the spinal cord; (e) the skin; (f) the heart; (g) the lung; (h) the liver; (i) the pancreas; (j) the small intestine. Red colors show QSOX1 staining, and blue shows the counterstain of hematoxylin in the nucleus. Scale bar = 1 mm. Abbreviations: al, alveoli; bf, brown fat; br, bronchus; bv, blood vessel; car, cartilage; cer, cerebellum; cp, corneal epithelium; der, dermis; dip, diaphragm; epi, epidermis; hp, hepatocyte; iz, intermediate zone; le, lens epithelium; lf, lens fiber; mc, myocardial cell; mo, medulla oblongata; mv, mucosal villi; nc, neopallial cortex; po, pons; rm, roof of midbrain; rp, retinal pigment; sc, secretory cell; spi, spinal cord.
Applsci 11 10151 g005
Figure 6. Expression levels of QSOX1 in various embryonic tissues at 17.5 dpc. (a) A representative cross-section image of QSOX1 distribution in the 17.5 dpc embryo. The marks (a to q) indicate the tissues subjected to quantify and their locations. Scale bar = 1 mm. (b) The scatter plot shows the mean intensity of QSOX1 in cells of each tissue; every small circle indicates the expression intensity of QSOX1 in a single cell. Statistical comparison on expression levels among tissues is provided in the Supplementary Materials, Table S2.
Applsci 11 10151 g006
Figure 7. Cellular expression and localization of QSOX1 in tissues of the embryo at 17.5 dpc. The cross-section of the 17.5 dpc embryo is shown on the top left. The detailed QSOX1 cellular distribution is enlarged from six subregions (a to f). (a) the nose and vibrissae follicles; (b) the tongue and tooth; (c) the muscle and sternebrae; (d) the thymus, trachea, and esophagus; (e) the spinal cord and ganglion; (f) uterine muscle, yolk sac, embryo membrane, and skin. Red colors show QSOX1 staining, and blue shows the counterstain of hematoxylin in the nucleus. Scale bar = 1 mm. Abbreviations: cans, cartilage primordium of the nasal septum; car, cartilage; foli, follicles of vibrissae; gan, ganglion; mus, muscle; nc, nasal cavity; oe, olfactory epithelium; oes, esophagus; oss, ossification with sternebrae; spi, spinal cord; sub, submandibular gland; thy, thymus; to, tongue; too, tooth; tra, trachea; vo, vomeronasal organ; ys, yolk sac.
Applsci 11 10151 g007
Publisher’s Note: MDPI stays neutral with regard to jurisdictional claims in published maps and institutional affiliations.

