Abstract
Circular economy promotes the use of waste materials into new production processes as a key factor for resource efficiency. The construction sector, and specifically the fired clay industry, is able to assimilate large amounts of waste in their processes, without significantly altering the technical properties of products. The introduction of different waste in ceramic products at the laboratory level has been extensively studied in the literature, but most of these studies have not yet been scaled-up to industrial production. Differences in processing with respect to laboratory conditions introduces uncertainty in relation to the expected properties of the final products. This paper uses a Self-Organizing Map (SOM)-based methodology for analysing and assessing the incorporation of industrial waste, Waelz slag (WS) and foundry sand dust (FSD), in ceramic products obtained sequentially at laboratory, semi-industrial and industrial level, over technological properties and metals release. As a result, from the SOM analysis, a clustered map of the samples developed is obtained that highlights the most important parameters affecting the technological and environmental properties to be the type of clay and therefore, the firing temperature; secondly, the Waelz slag content, being independent of the foundry sand addition; and finally, the type and level of processing (laboratory-pressing, semi-industrial extruder, industrial extruder).
1. Introduction
The implementation of the circular economy through the incorporation of residual raw materials into material cycles is a high priority for the Green Deal (Circular Economy Action Plan adopted by the European Commission on 11 March 2020). Wastes addition to manufacture building materials plays a key role in the circularity of construction sector through the development of innovative solutions of materials efficiency, as saving of raw materials by substitution of primary raw material with recycled materials from urban and industrial wastes [1]. Specifically, one of the most extended construction materials is fired clay products [2,3]. Although clay brick and tile industries are showing innovative solutions to add to the circular economy in Europe, regulatory and technical barriers still exist to scale up current initiatives or to start new ones. Some of them are the differentiated interpretations of end-of-waste and by-products status among Member States, the lack of a well-functioning European market for secondary raw materials, as well as the need for an efficient system for collection, sorting and separation of waste that includes the adaptation of technical requirements of installations [4].
Some recently published research works have supported these limitations for an evolution towards a circular economy. Zanelli et al. [5], analysed the effects of different types of waste on technological behaviour, technical performance and environmental impact of ceramic tiles in the prospect of an industrial transfer. Dondi et al. [6], shows the conflict between resource efficiency and market trends in the ceramic tile industry, and how it reflects on the supply chain raw materials. The environmental impact of Italian ceramic tiles production is analysed and discussed by Boschi et al. [7], highlighting the larger number of technological innovations incorporated.
On the one hand, many scientific works have been dedicated to the incorporation of wastes into clay ceramics during the last decade. Some researchers have also shown, not only that the use of residues contributes to the reduction of natural resources, but that certain residues can even produce several improvements regarding the manufacturing process and properties of fired clay products [8,9,10,11,12,13]. Fuel or organic wastes contribute to savings in firing energy, while fluxing or inorganic wastes improve the ceramic properties [12,14,15]. Specifically, inorganic wastes containing metals and minerals can melt and react with the clay minerals [16,17,18]. Despite these advantages, these trials have not yet been scaled up to mass production in industrial facilities. Among other reasons, processing differences between laboratory and real factory lead to high uncertainty in the compulsory final product properties, particularly when waste materials are incorporated in the raw materials formulation [9].
As is highlighted in the review by Zanelli et al. [5], a correct design of experiments is crucial to achieve useful results for a technological transfer to the industrial practice. In this sense, aspects such as the use of experimental conditions as close as possible to the actual industrial technology, the scale factor, the use of industrial references without waste addition and the analysis of the appropriate amount of recyclable waste in each experimental step are critical.
Waste additions and processing conditions effect on the physico-chemical, technological and environmental properties of the final product have been extensively studied using classical multivariate statistical techniques [19,20,21,22,23,24,25,26,27]. Otherwise, Artificial Neural Networks (ANN) and Self-Organizing Maps (SOMs) have thus far been used in a more limited way as an alternative to assess the abovementioned relationships. A Self-Organizing Map (SOM) is a single layer artificial neural network with unsupervised learning developed by Teuvo Kohonen in 1984 [28], which arises as a statistical tool alternative to classical multivariate statistical techniques. The SOM analysis allows to establish relationships and classify different samples by converting complex nonlinear statistical relationships into simple geometric relationships offering greater potential for data visualization. Currently, there is a considerable amount of research, which uses this tool tackling environmental subjects with different purposes, as for example, to assess sediment and dredged material quality [28,29,30,31], to interpret and analyse the release of pollutants from sediment in contact with acidified seawater [32] and to assess water [33,34] and air quality [35,36,37]. However, it is important to highlight that there are no published studies which apply this tool to analyse the technical and environmental feasibility of construction materials incorporating waste.
The general objective of this work is the technical and environmental assessment of Waelz slag (WS), an industrial by-product from the recovery of electric arc furnace dust (EAFD) and foundry sand dust (FSD) incorporation in fired clay ceramic cycles through the Self-Organizing Maps, evaluating experimental results of authors’ previous studies [20,21,38,39,40,41,42]. Specifically, the effect of scale-up is analysed, introducing results from technological and environmental tests carried out at the laboratory, semi-industrial, and industrial levels into the SOM tool.
2. Materials and Methods
2.1. Raw Materials
Four clays (referred to as C1 to C4) extracted from different quarries and supplied by Northern Spain brick factories have been used for production of ceramic products. A calcareous clay (C1) used for laboratory wall bricks pieces, semi-industrial prototypes and large-format hollow brick (also named lightweight brick); two non-calcareous clays (C2 and C3) used for laboratory roof tiles and face bricks pieces, respectively, and an illitic-calcareous clay, C4 clay, used to develop a perforated brick (also named ceramic block), with which the results obtained with the other clays, will be validated.
The Waelz slag (WS) was supplied by Befesa Zinc Aser (Abengoa Group), who operates a commercial Waelz plant in Erandio (Basque Country Region, Spain). This material is marketable under the trade name Ferrosita. Foundry sand dust (FSD) was supplied by Nissan Motor Ibérica S.A. and was obtained from the ventilation bag-house system at the automotive foundry facility located in Corrales de Buelna (Cantabria, Spain). Wood pulp (Pulp), which is used as an additive in the manufacture of semi-industrial prototypes and light industrial bricks, was made of pinewood and supplied by one of the local brick factories. Wood pulp additions lead to obtaining ceramic products with greater porosity than conventional brick, thereby improving (i) acoustic performance, since they are basically used as partition bricks and, (ii) manageability due to the lighter products obtained in large formats. Table 1 illustrates the major oxide and trace element concentrations of the raw materials employed in the manufacture of the fired products in the present work.

Table 1.
Major oxide and trace elements concentrations of the raw materials employed in the manufacture of the ceramic products.
2.2. Ceramic Mixtures Processing
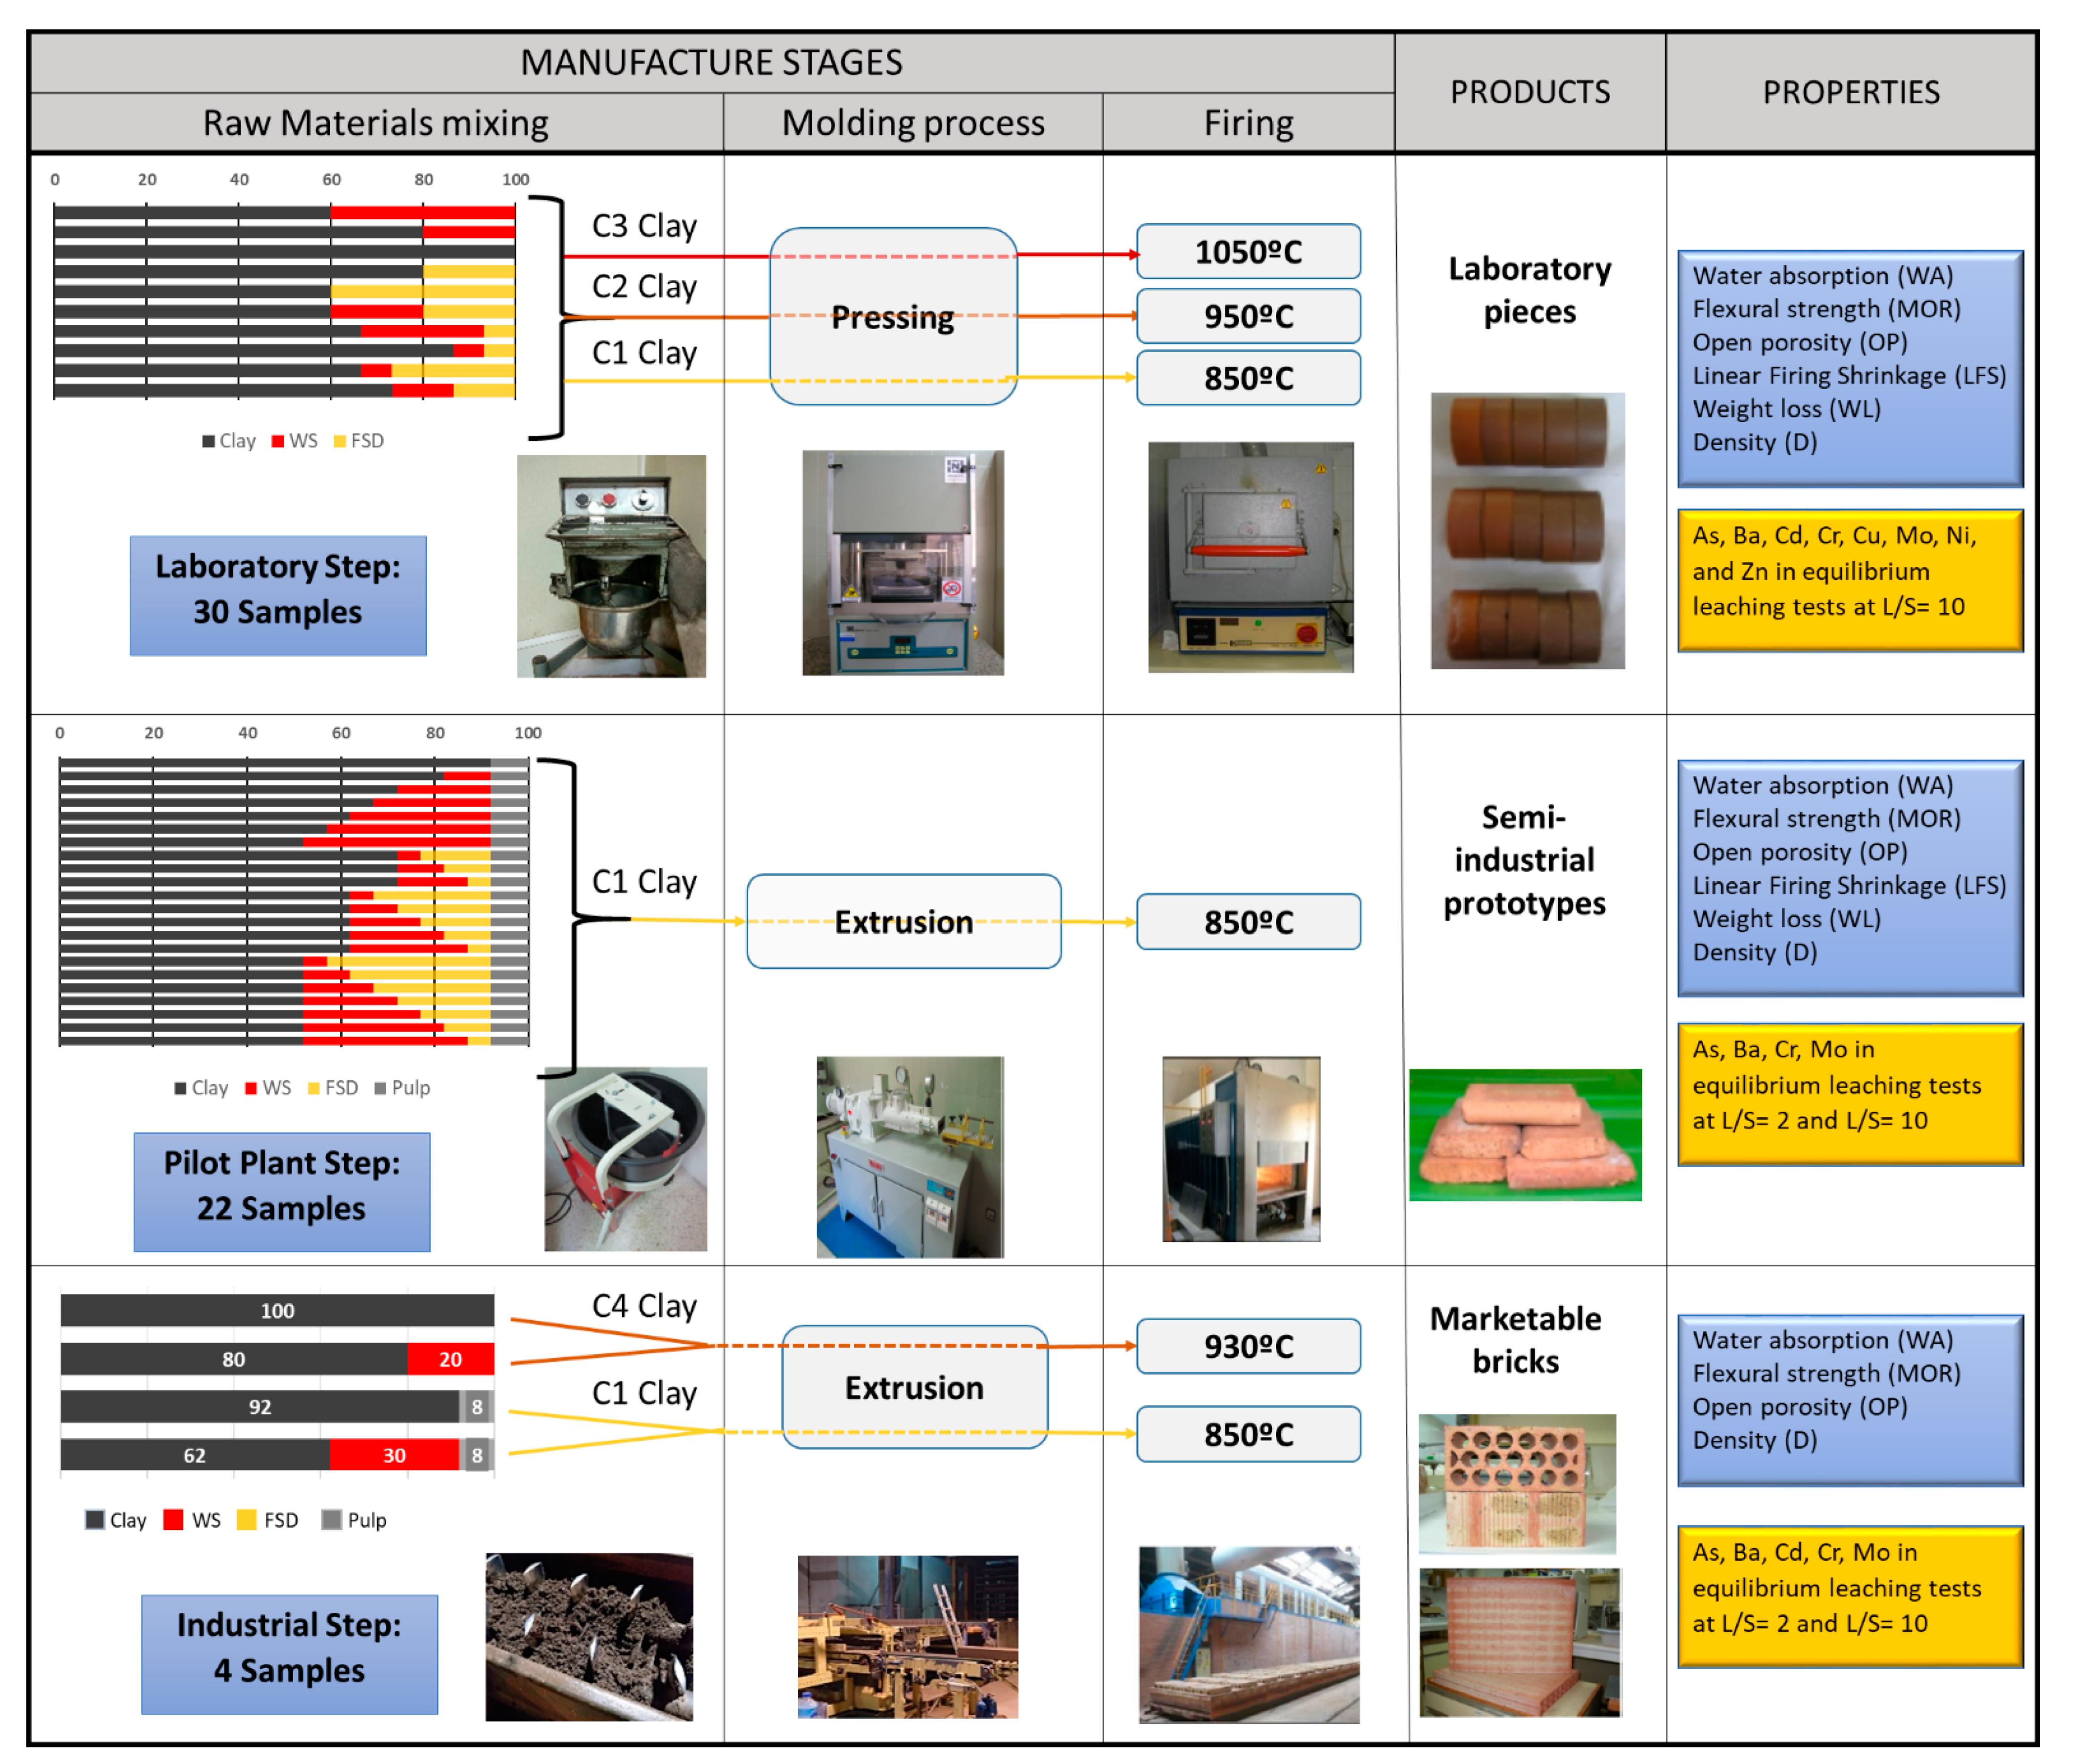
The methodology used in this work is illustrated in Figure 1. Three different sets of experiments were carried out. A first group of laboratory trial (30 samples) was made in order to determine the viability to obtain suitable pieces at the laboratory conditions. The mixing process of WS (0–40%), FSD (0–40%) and clay (100–60%) (Figure 2) was carried out with a small percentage of water, in a Raimondi Iperbet Jobsite Mixer. Moulding was performed by uniaxial pressing of test-pieces under 10 MPa with a Mignon SS/EA Nanetti laboratory press. Drying and firing of mixtures were performed in a laboratory electric furnace, Hobersal Model 12 PR/300 following the industrial firing cycles: C1-based mixtures (wall bricks and blocks to cover) were fired at 850 °C for ~45 h; C2-based mixtures (roof tiles) were fired at 950 °C for ~35 h, and C3-based mixtures (face bricks) were fired at 1050 °C for ~24 h. Further details can be found elsewhere in Coronado et al. [19,20,38]. These samples are labelled with a first tag, which means the experimental scale, L (laboratory), the next one corresponds to the type of clay (C1 to C3), and the following the percentage of Waelz slag (W) and foundry sand dust (F) in the mixture. Reference pieces without waste addition are labelled as LC1 to LC3.
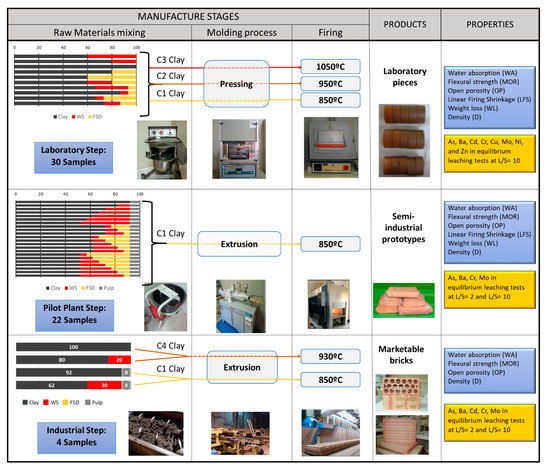
Figure 1.
Stages in the manufacture of the studied ceramic products and analysed properties.
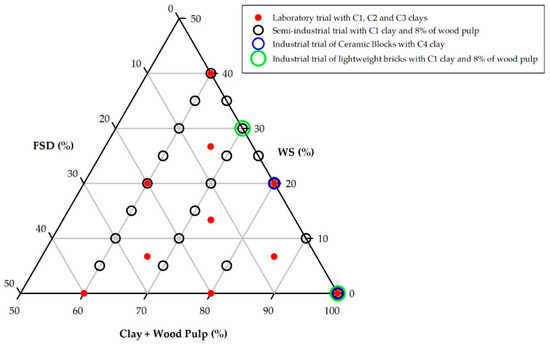
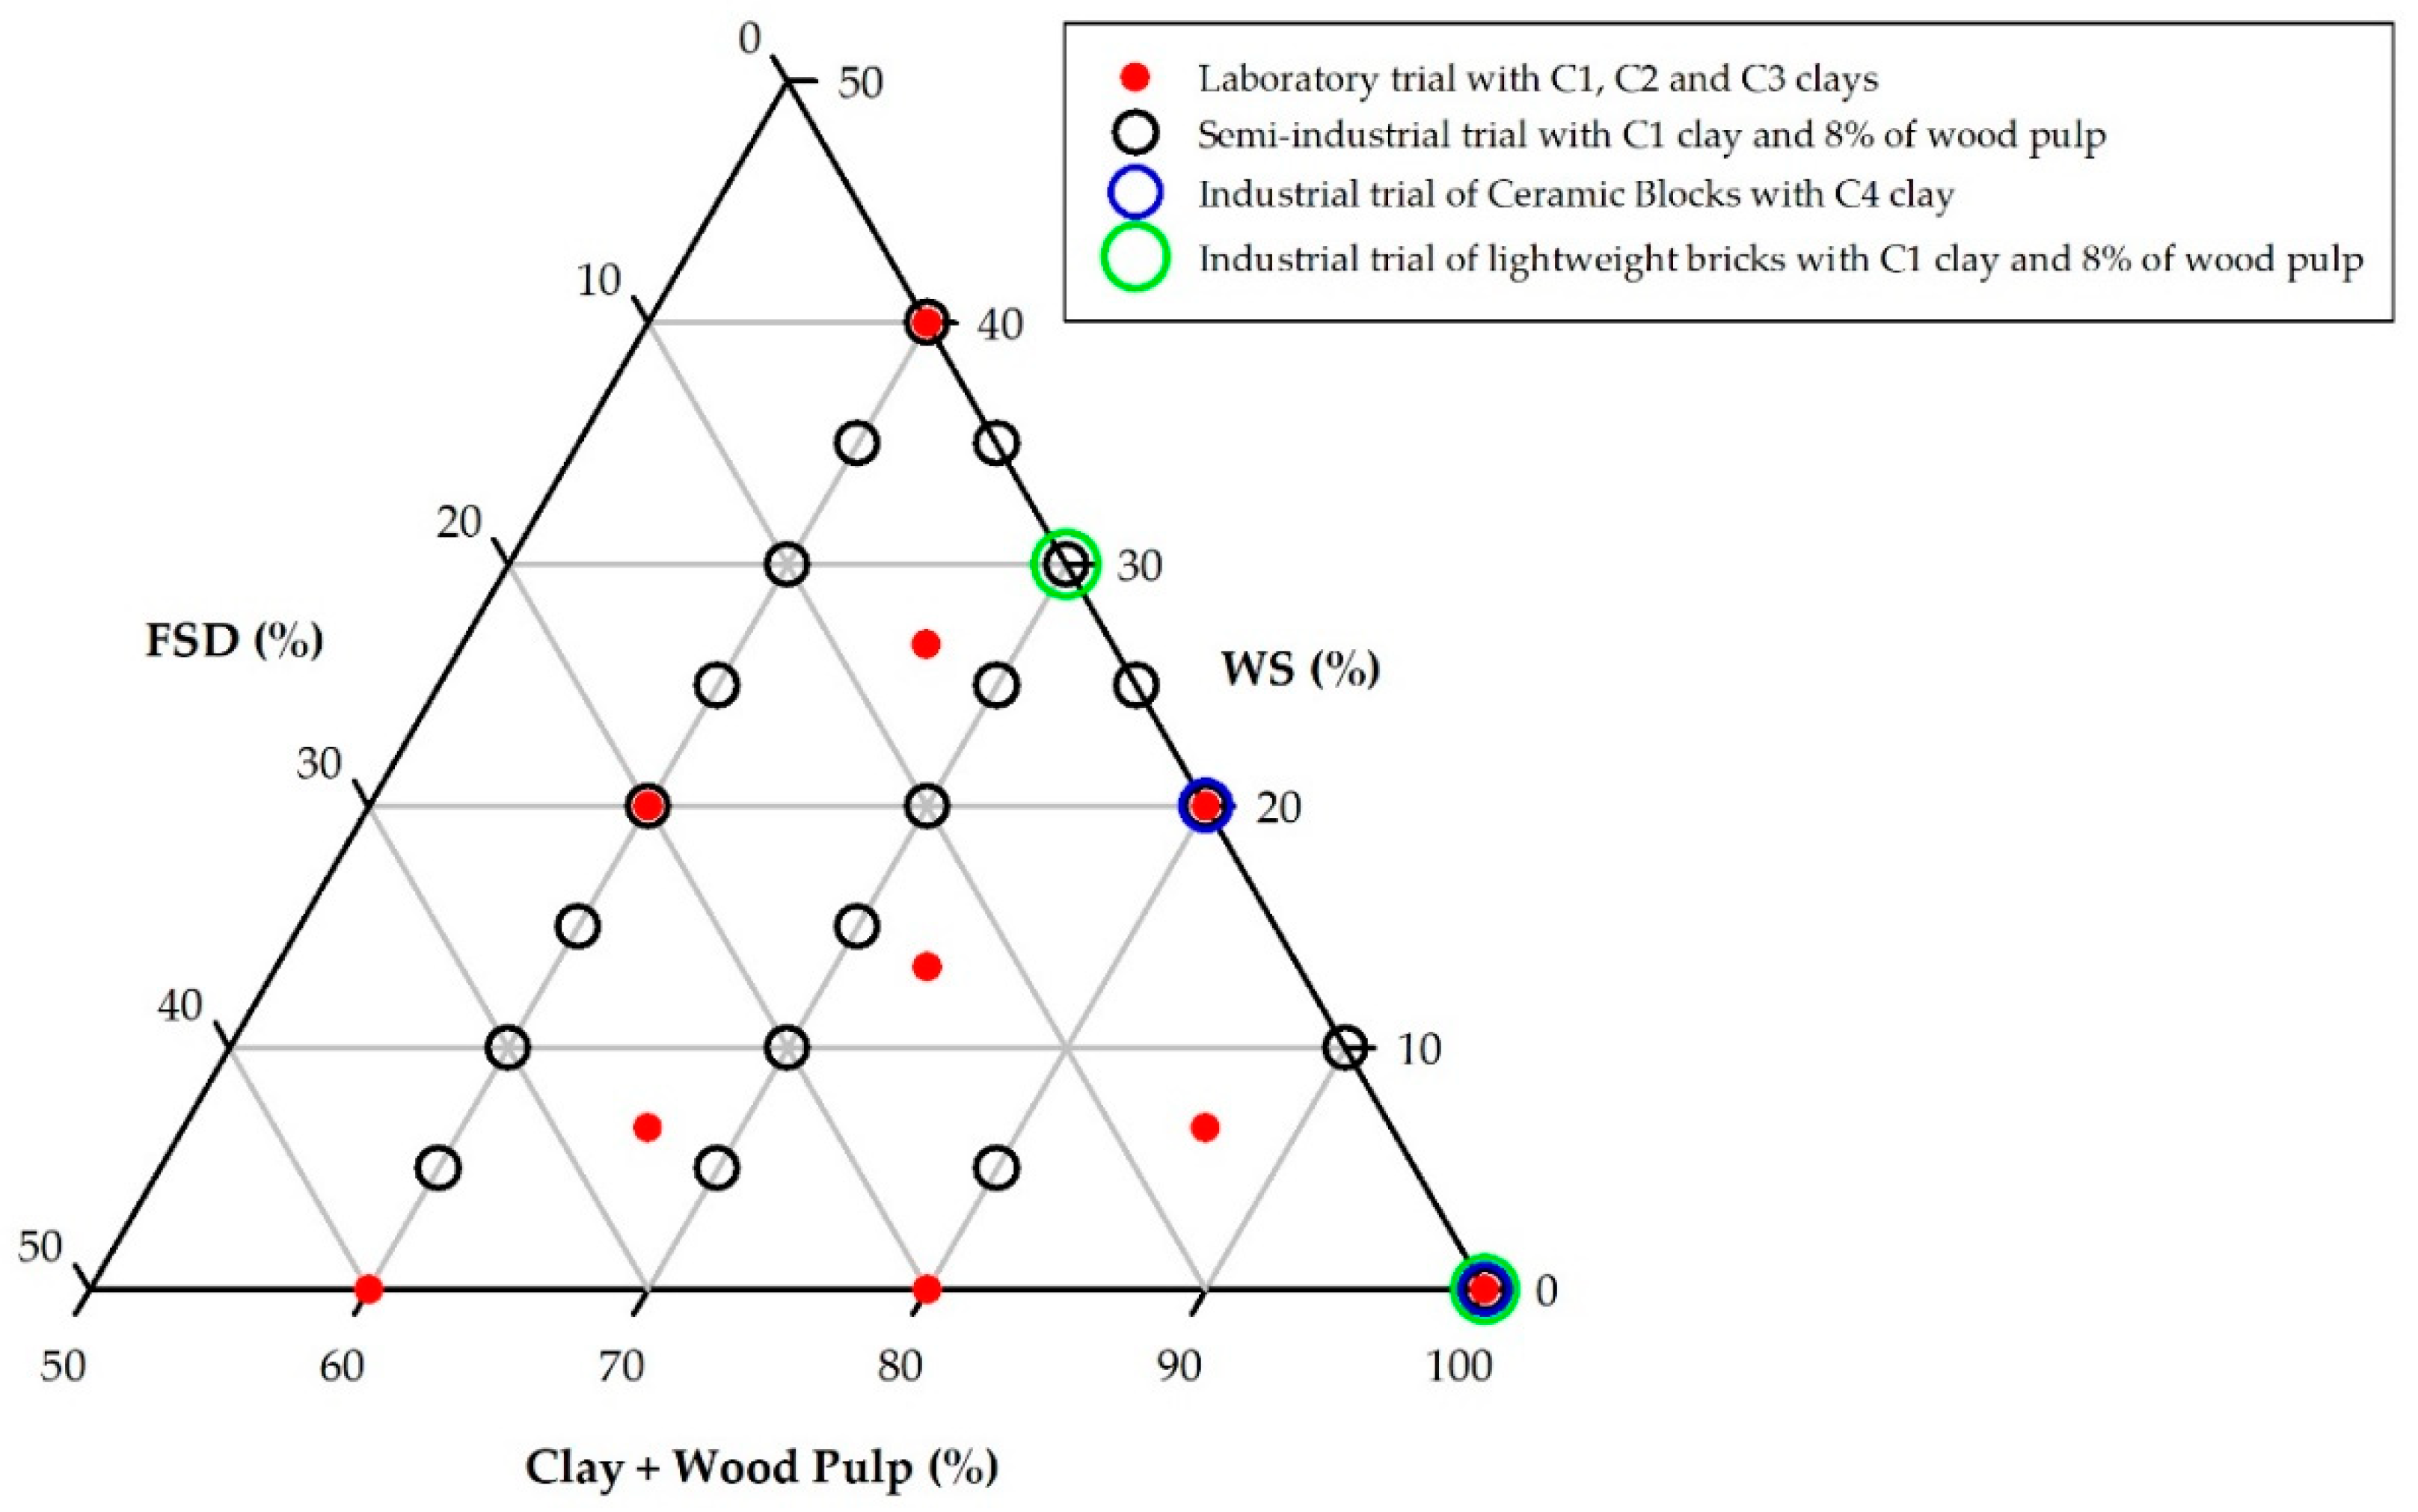
Figure 2.
Location of the mixtures in the ternary diagram of raw material components in the ceramic product trials.
In a second development stage, a semi-industrial trial of 22 samples was obtained based on mixtures of C1 clay, WS (0–40%), FSD (0–35%) and a fixed 8% of wood pulp (Figure 2). Mixtures were moulded through a pilot-plant scale extrusion, with a Verdés Model 050C extruder. The obtained prototypes of solid bricks were dried in a muffle furnace at 100 °C during 24 h and the firing cycle was completed in an industrial furnace, reaching temperatures up to 850 °C. These samples are labelled with a first tag, which means the experimental scale, S (Semi-industrial), then the type of clay used, C1, and the WS and FSD content was W and F, respectively. Further information can be found in Quijorna et al. [21,40].
Finally, in the demonstration stage at industrial level, two market sizes of hollow brick were manufactured: perforated brick (also named ceramic block) and large-format hollow brick (also named lightweight brick). In both cases, clay C4 and C1 and optimal incorporations of 20% and 30% of WS were moulded with a Verdés Model 050C extruder system, dried in a muffle furnace at 100 °C during 24 h and fired in an industrial furnace up to 950 °C and 850 °C according to the industrial firing cycle of each product. These products were labelled with a first tag of the experimental scale, I (Industrial), a second tag of the type of clay (C4 and C1), and the content of WS (W). Further information can be found in Quijorna et al. [40,42]. The composition and label of the studied ceramic mixtures are summarized in Figure 2 and Table S1 (Supplementary material).
2.3. Analytical Methods
The chemical composition of the samples was determined at Activations Laboratories (Canada). Major elements were determined by fusion-inductively coupled plasma (FUS-ICP). The contents of Cd, Cu, Mo, Ni, Pb, and Zn were determined using total digestion ICP. Contents of As and Cr were determined by non-destructive instrumental neutron activation analysis (INNA) and Ba by means of INNA/FUS-ICP. Fired brick specimens (pieces, prototypes and bricks) were analysed for their technological (physical, mechanical, and chemical) properties according to standard methods employed for characterisation of ceramic construction materials [43,44]. These characterisations included: (i) water absorption capacity (WA) [43,45], (ii) flexural strength (MOR) [46] through the modulus of rupture that was assessed using a servohydraulic apparatus equipped with a 15 Tm Suzpecar MES-150 stress cell; (iii) open porosity (OP) [45] determined by mercury intrusion porosimetry using a Micromeritics AutoPore IV 9500; (iv) Linear firing shrinkage (LFS) measured with a precision calliper; (v) weight loss during firing (WL) and (vi) bulk density (D) [45]. High quality commercial ceramic bricks typically exhibit WA below 16%, LFS values below 8%, WL values between 5 and 15% and D in the range 2–2.15 g/cm3, depending on the type of brick (wall bricks, roof tiles or face bricks) [47,48,49], which will be considered as threshold values of the technical properties.
The environmental properties assessed on the fired specimens were the release of potentially toxic species during their leaching of metals after disposal in landfill sites, simulating the end of life when they become construction and demolition waste. Leaching was assessed from crushed samples and sieved to a particle size below 4 mm following EN 12457-1 and 2 methods. Distilled water is used as leachant in the compliance equilibrium leaching tests (one-stage batch tests), using liquid to solid ratios of 2:1 [50] and 10:1 [51]. Leachates were analysed for critical elements included in the Landfill Directive 2003/33/CE [52]. Concentrations of Ba, Cd, Cr, Cu, Mo, Ni and Zn were analysed using ICP-OES (Perkin Elmer Plasma 400), As and Pb were determined by Atomic Absorption (Perkin Elmer 1100B).
2.4. Self-Organizing Maps
Self-Organizing Maps (SOMs) are the most widely used type of neural network without supervised learning [33]. SOMs are a type of single-layer artificial neural network developed by Teuvo Kohonen in 1984 [28]. The interest of self-organizing maps as an analytical and visualization tool in exploratory data analysis has grown in recent years, as it allows the conversion of nonlinear complex statistical relationships from a high-dimensional data set to simple geometric relationships in a space of low dimension [53,54].
The SOM tool applied to the environmental classification of sediments and to analyse sediment leaching behaviour have been previously used by the authors; in these works [31,32], the SOM is shown as an effective tool for the integration of multiple physical, chemical, and ecotoxicological variables in order to classify different sites and behaviours under study according to their similar sediment quality and leaching characteristics. Details about the methodology background and use of the SOM are described in these previous articles.
Quantization Error (QE) is the average of the sum of the Euclidean distance between the data vector and the neuron that fits better with that input data, or Best Matching Unit (BMU); and the Topographic Error (TE) measures the average of data vectors, which first and second BMUs are not adjacent, i.e., an evaluation of the continuity of the map [55]. The type of normalization chosen will depend on the values of Quantization Error (QE) and Topographic Error (TE) obtained for each dataset, the one which yields the minimal QE and TE being applied. This will be studied for all the SOM analysis performed, but it turns out that, generally, the “range” normalization returns the lowest QE and TE values, so typically this normalisation will be employed. In this work, the heuristic formula of Vesanto et al. 2000 [56], m = 5√n (where m is the number of neurons or map units and n is the dimension of the data or the number of samples in the dataset) is selected to set the map size along with a minimal result of TE. This preserves the map topology, and uses a number of neurons more minor than the size of dataset, thus overfitting is avoided. Moreover, a hexagonal lattice is preferred because it is beneficial in terms of visualization [57], and the clustering of the map is performed with the k-means algorithm [58]. Finally, the representation of the maps in the results will be carried out with the k-means clustered map in the left side, along with the c-planes in the right side, simplifying the results interpretation obtained from the SOM. The SOM analysis in this work is implemented with the help of the SOM Toolbox 2.0, a public library developed by Alhoniemi et al. [59] that runs in Matlab, version R2014a.
3. Results and Discussion
3.1. Laboratory Pressed Clay Mixtures with WS-FSD Incorporation
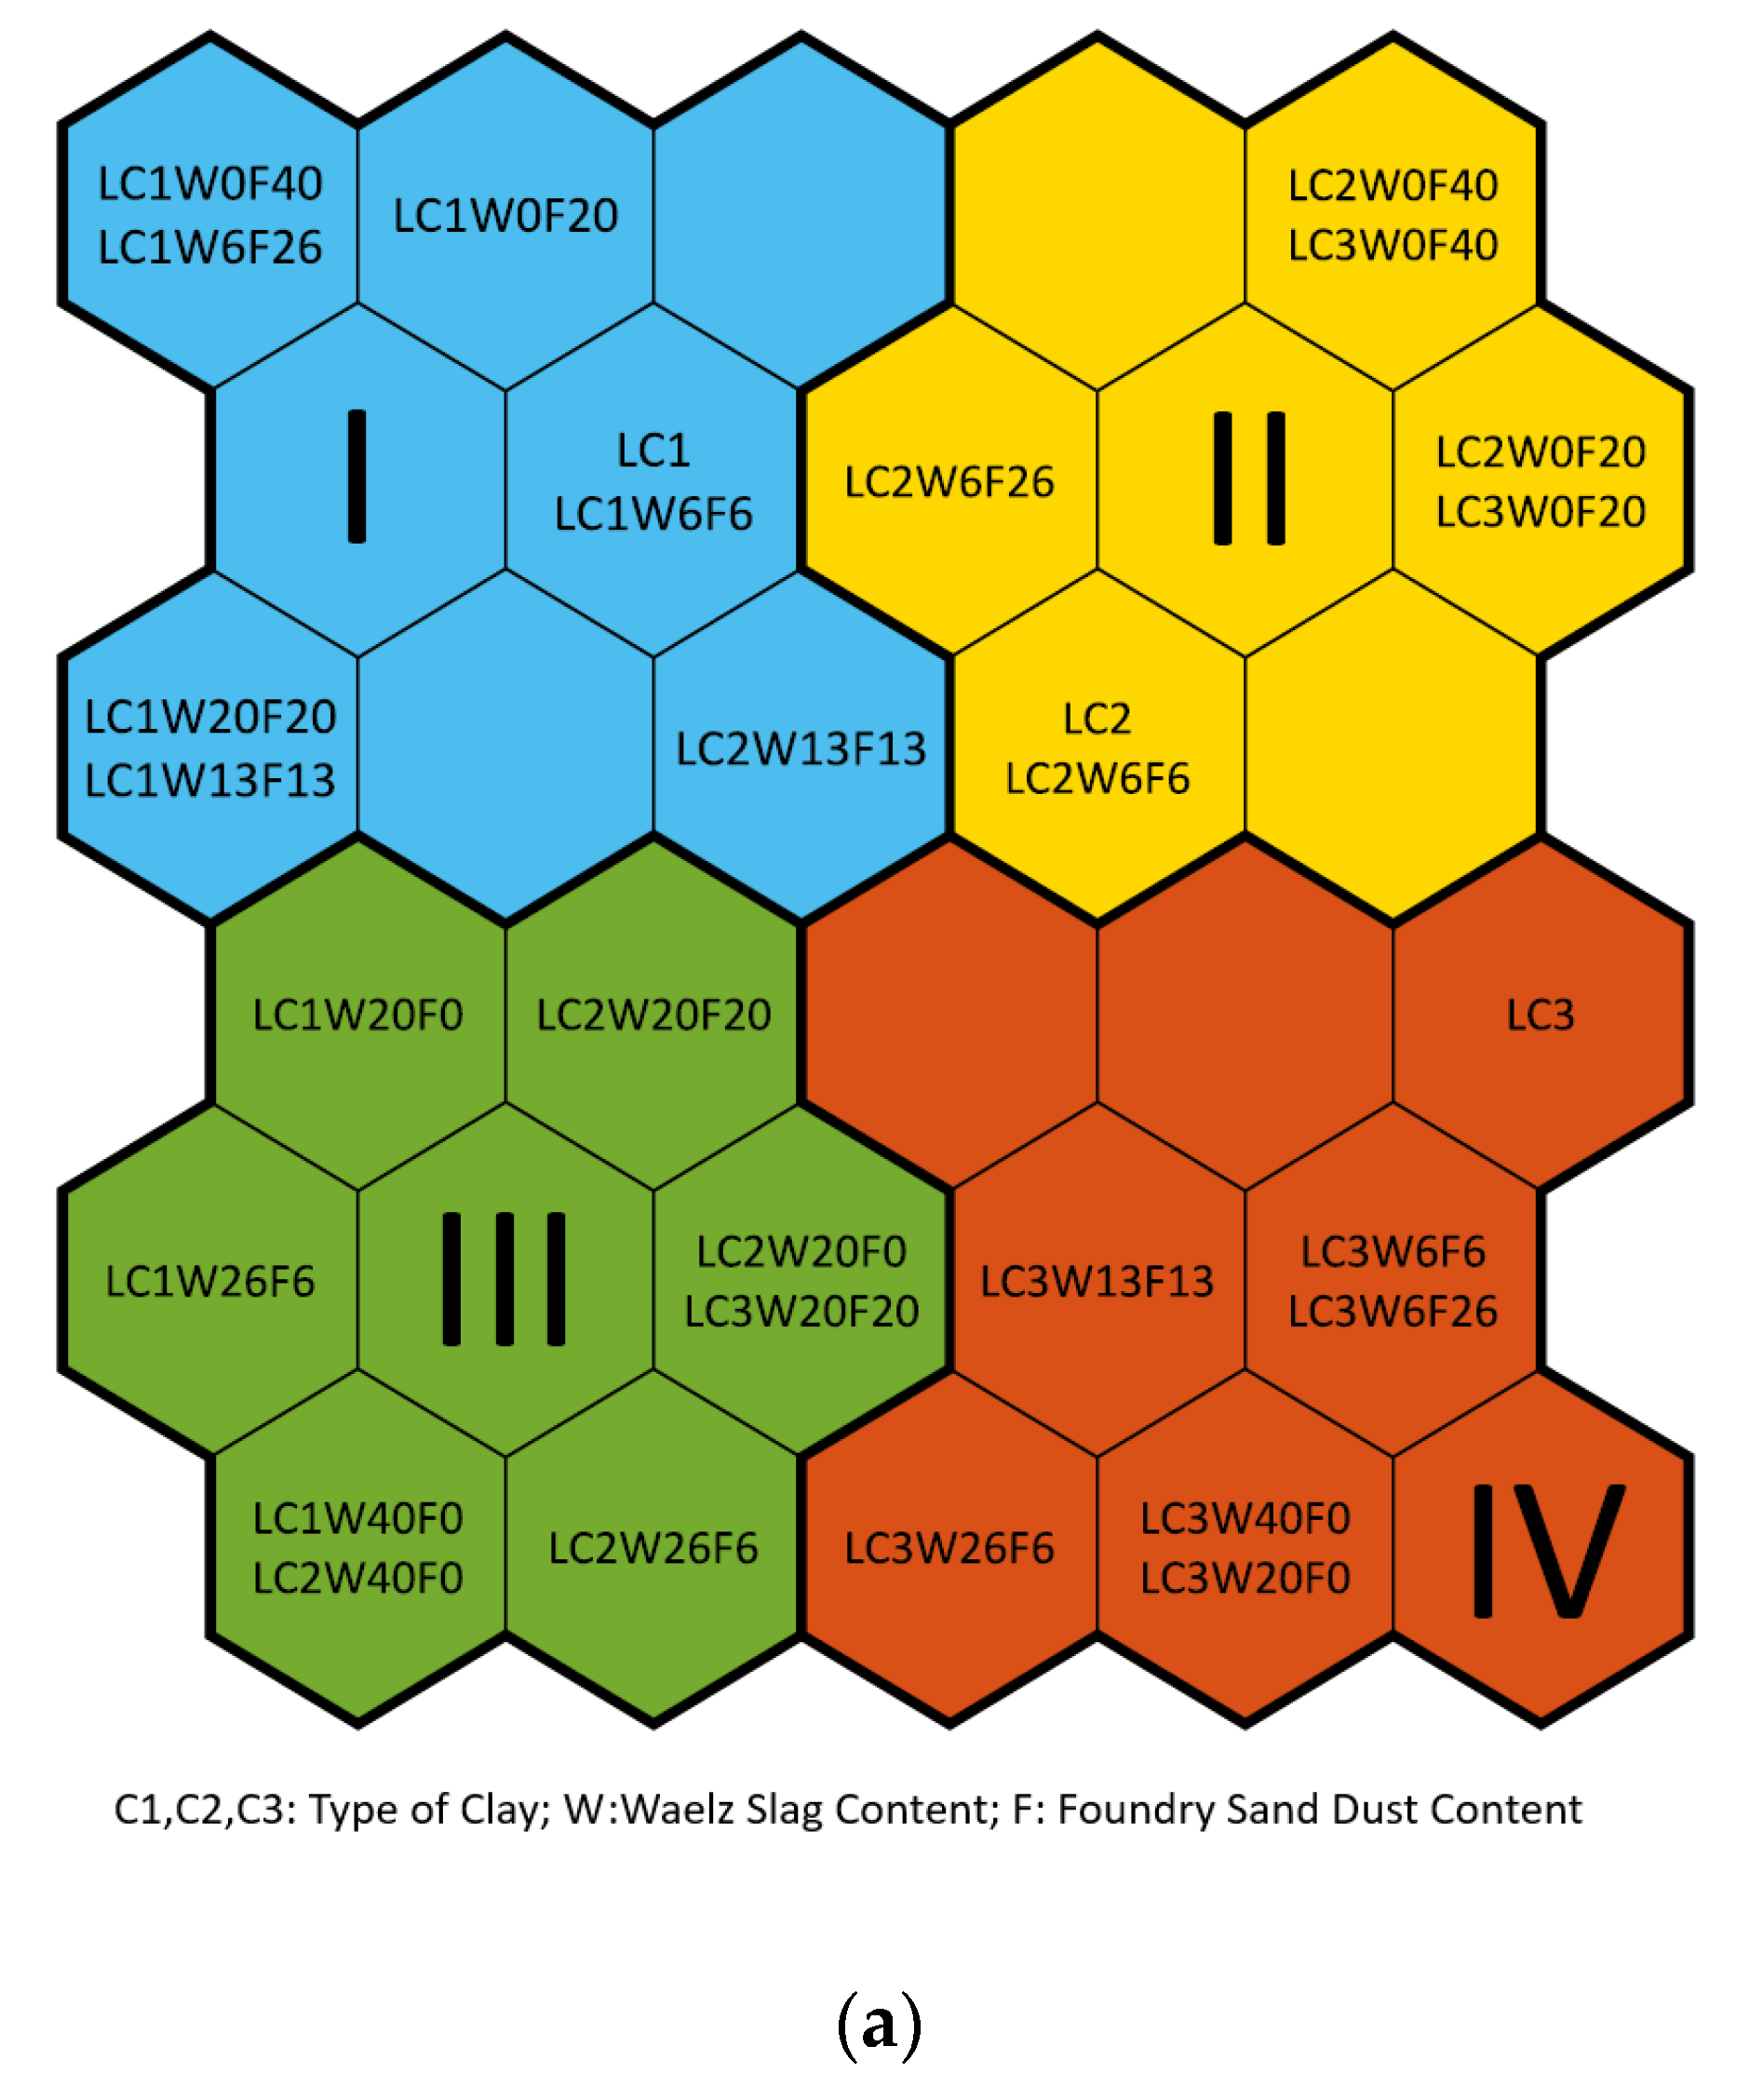
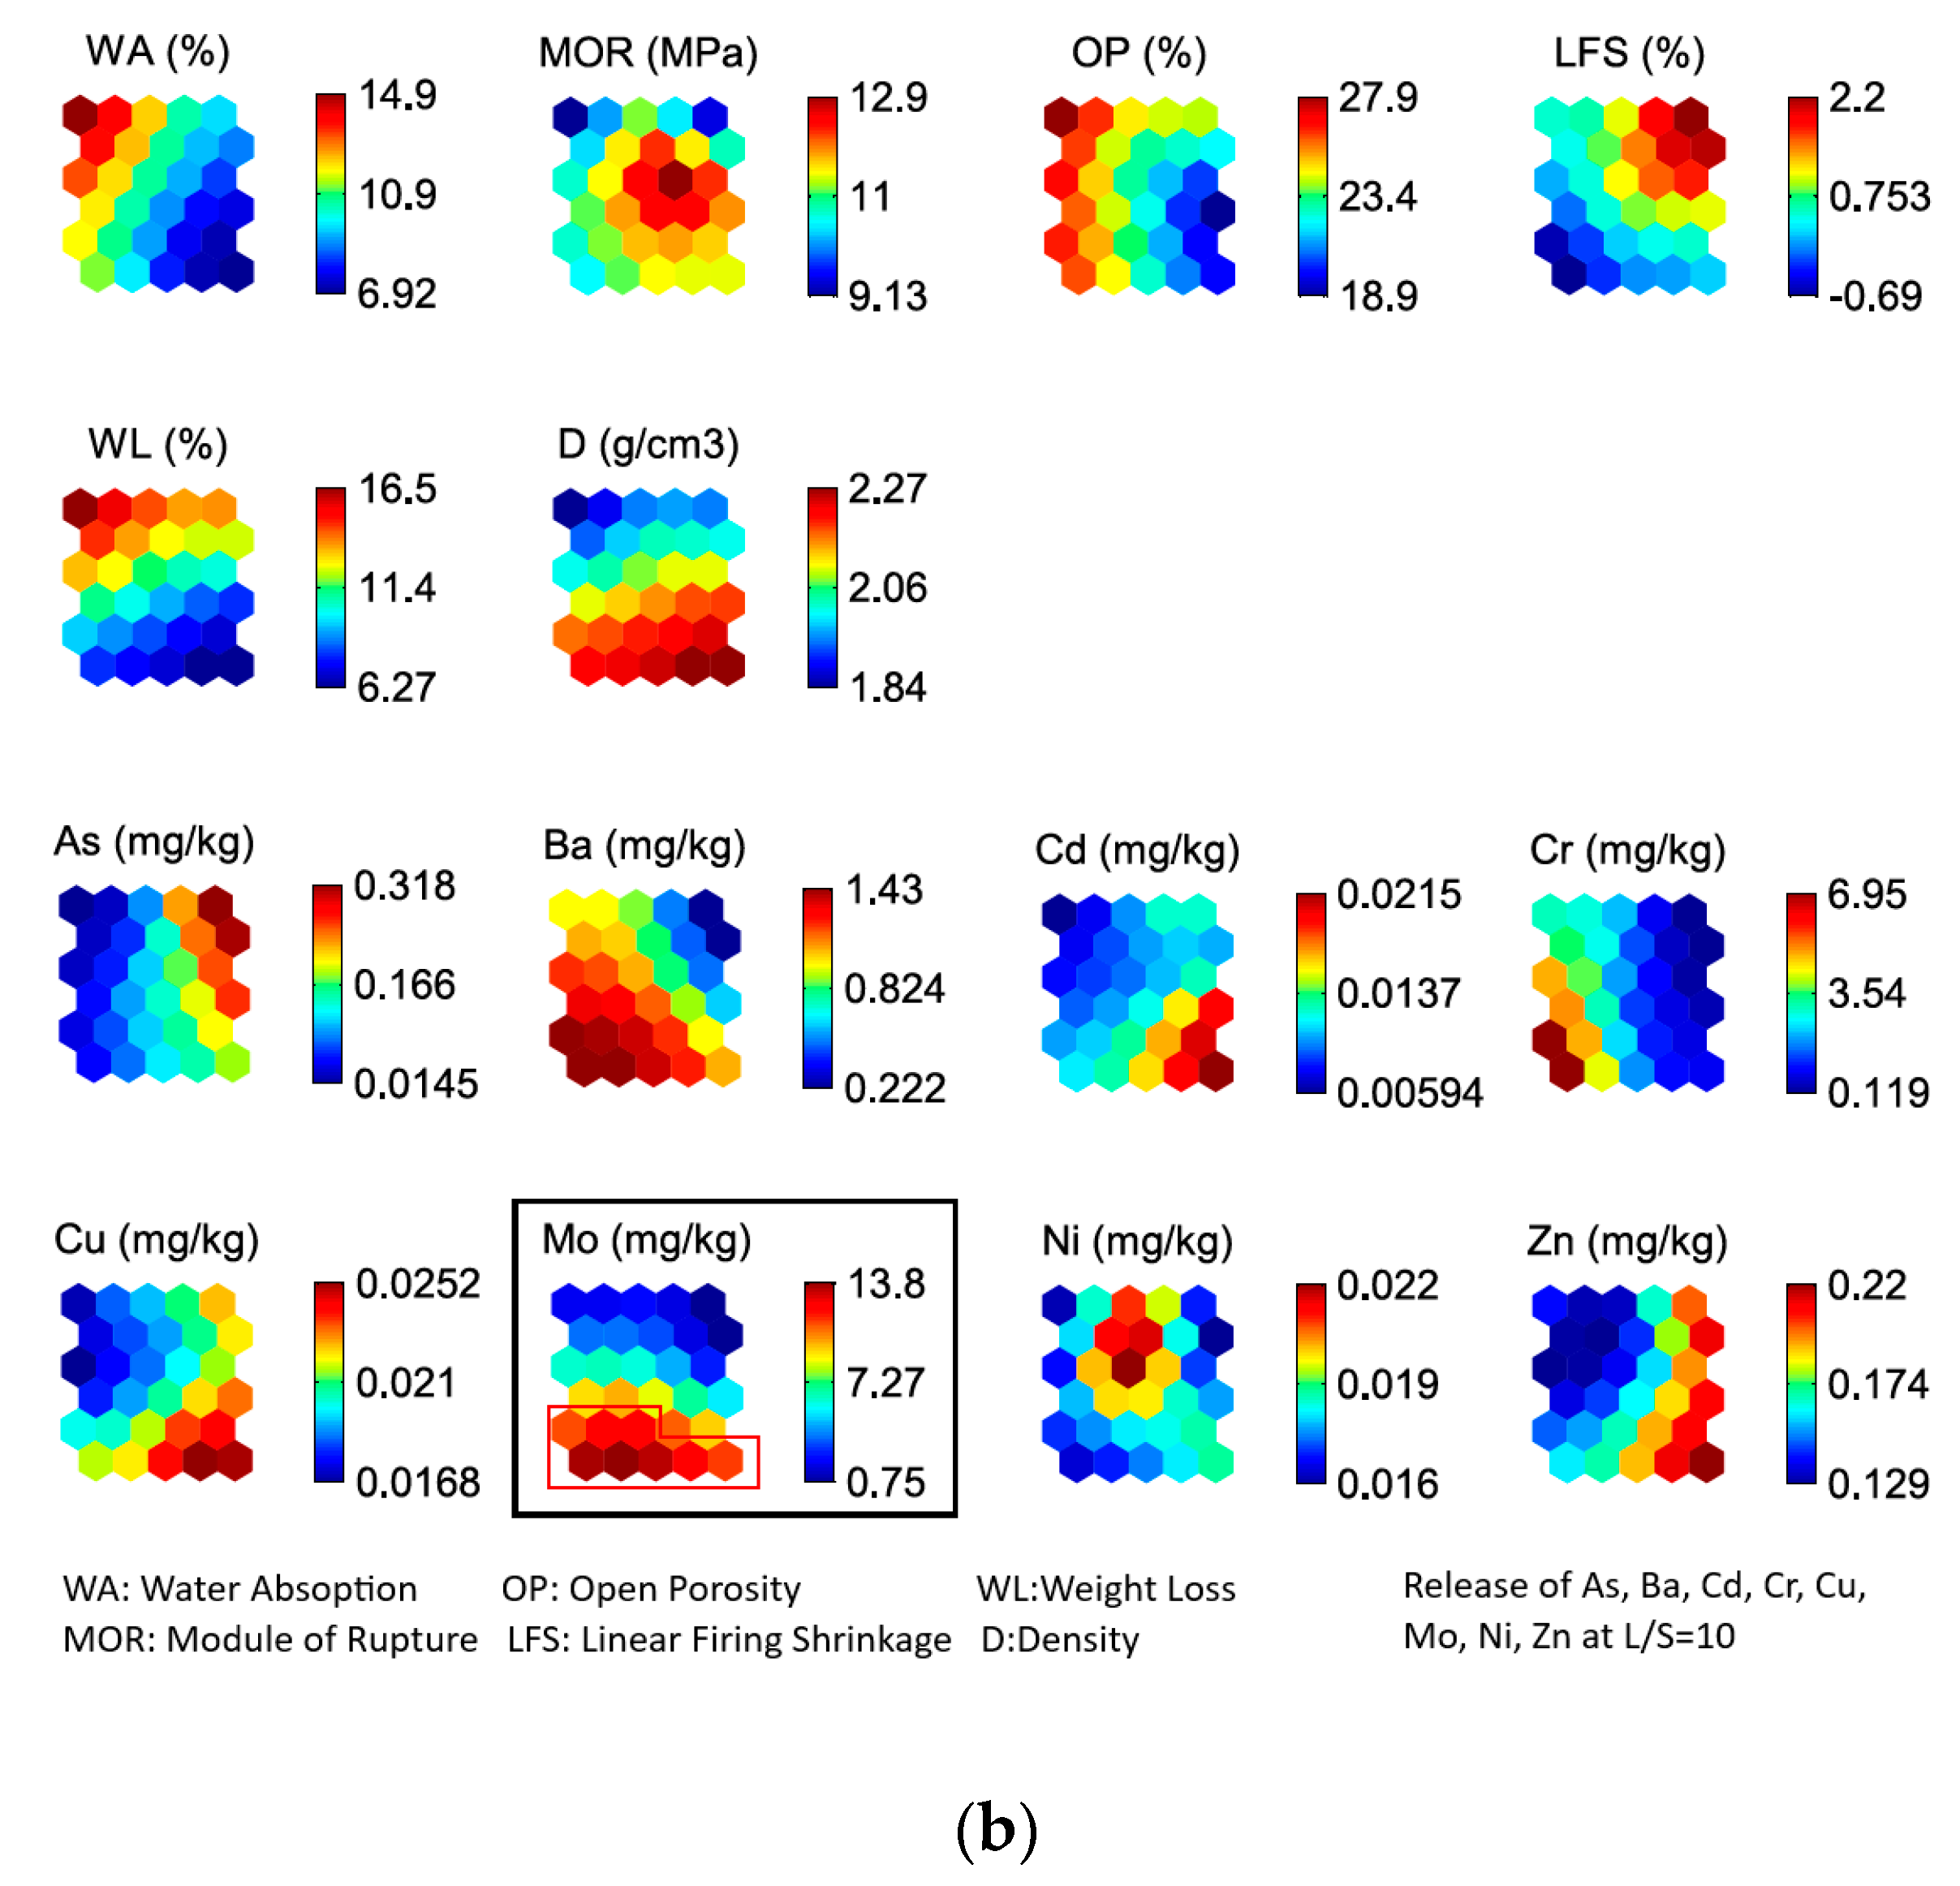
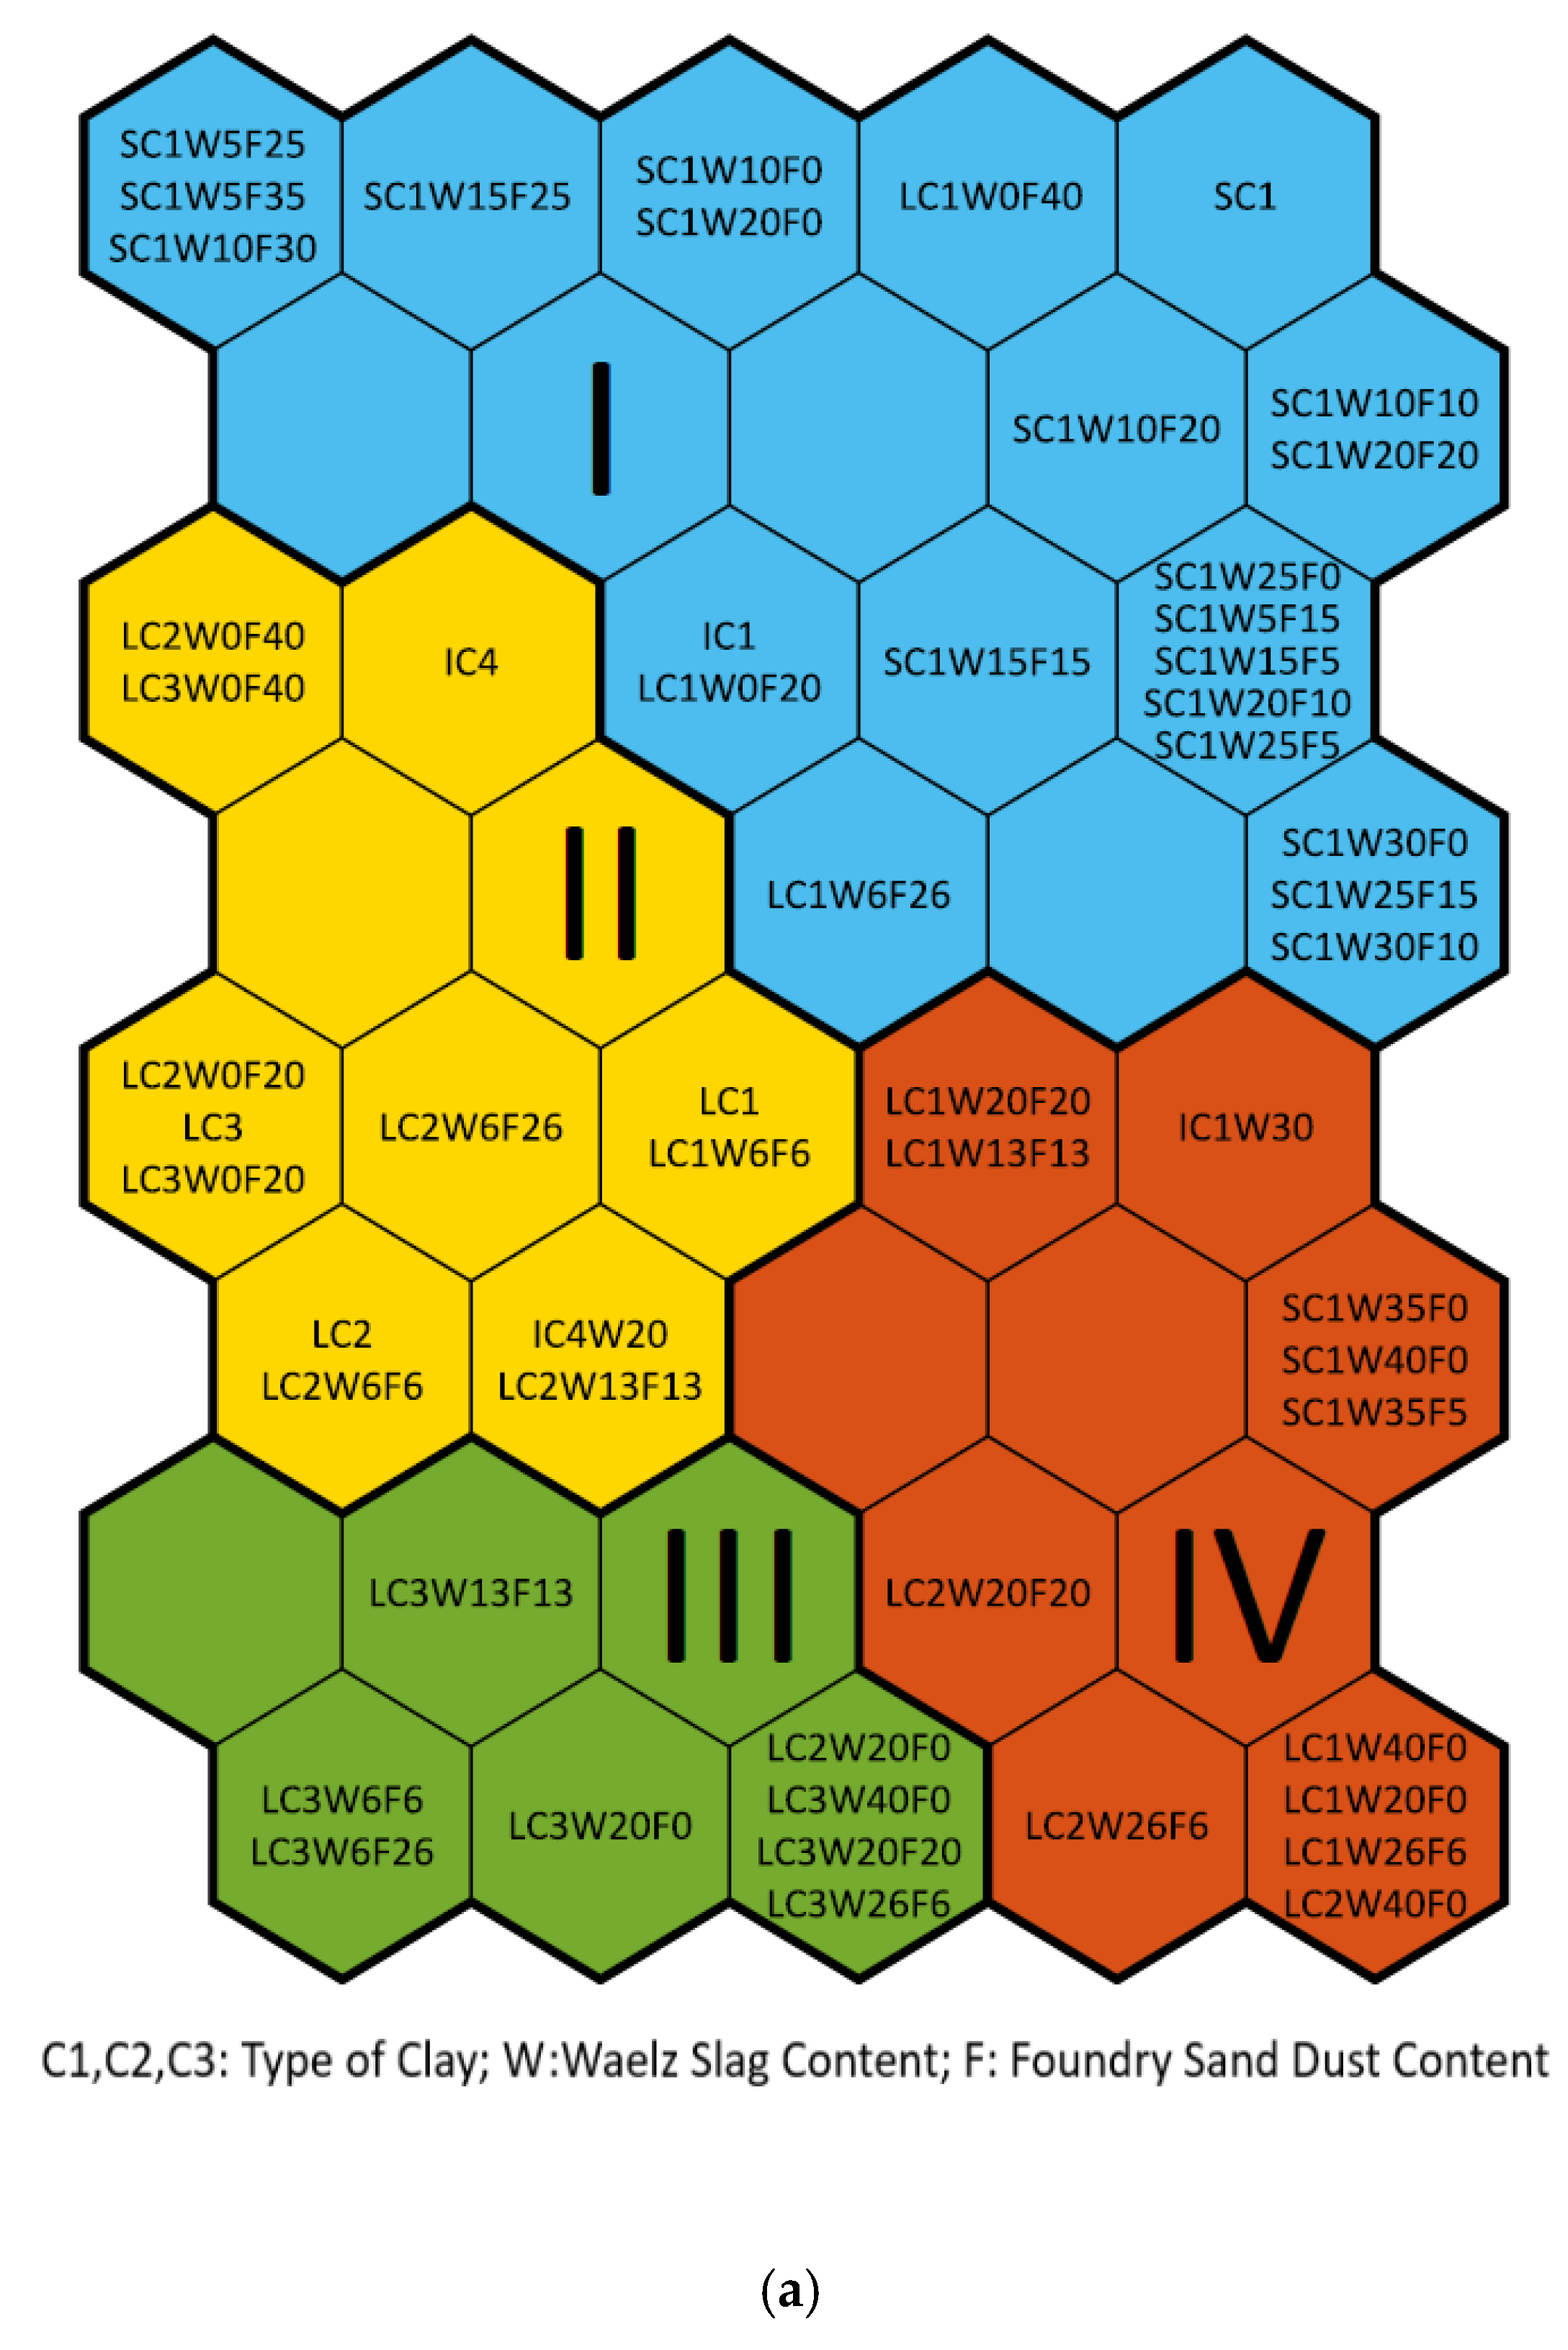
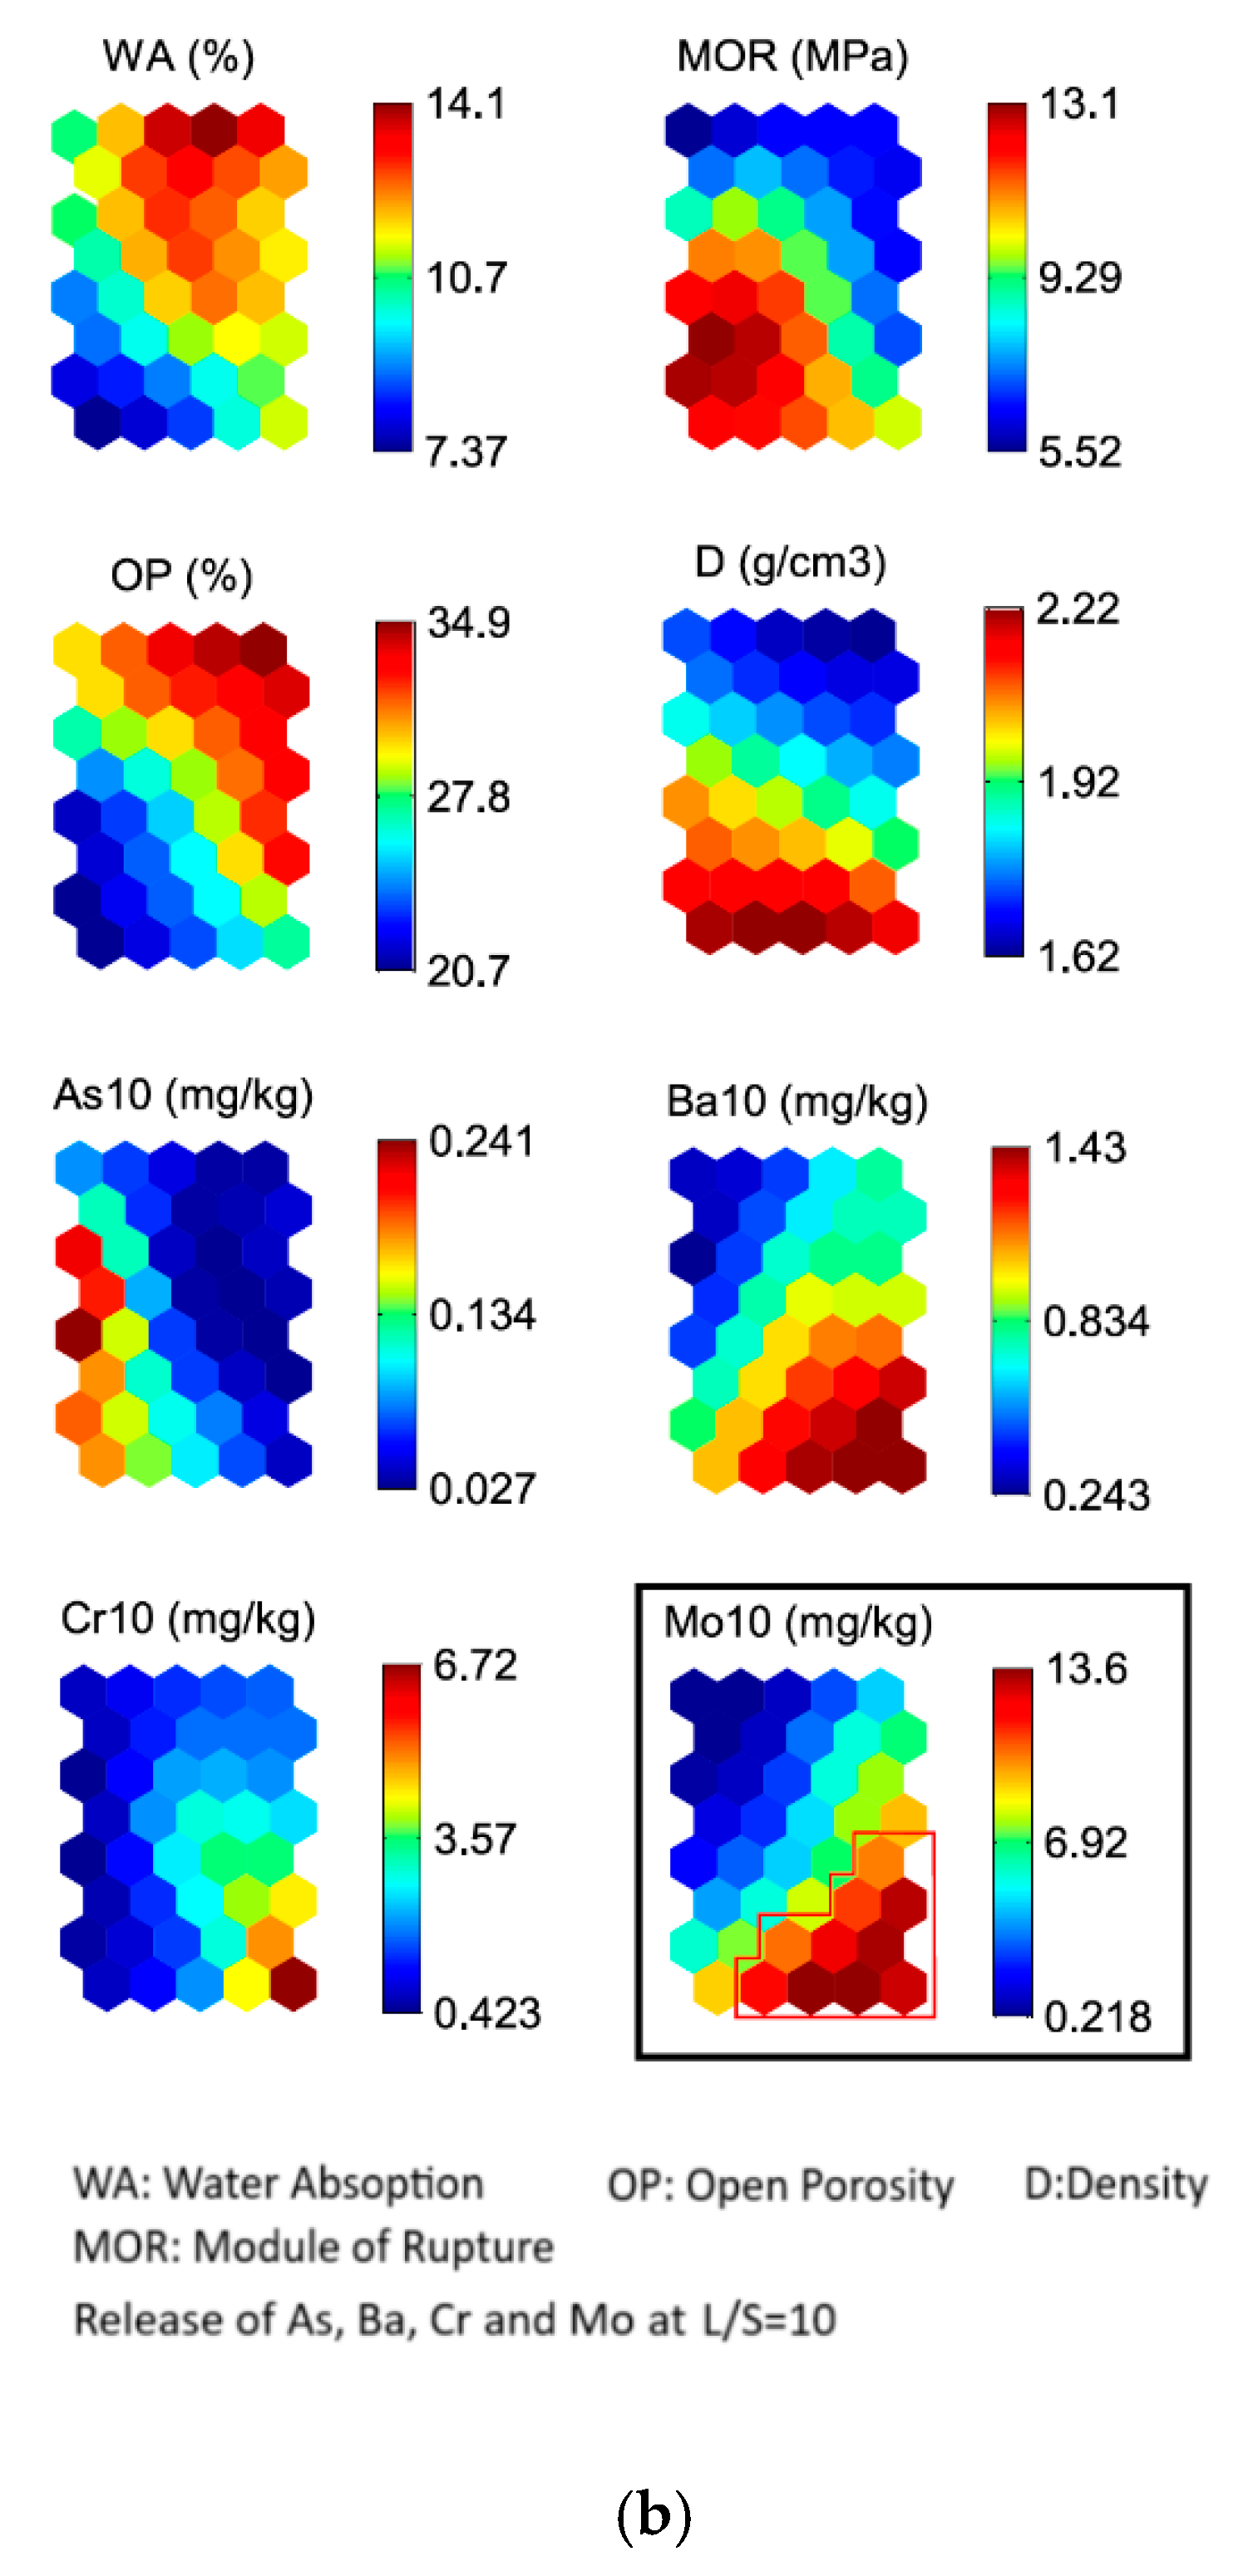
Laboratory ceramic pieces obtained by pressing at a wide range of raw materials composition and firing temperature (Figure 1) were analysed for their technological properties of bulk density (D), water absorption capacity (WA), open porosity (OP), flexural strength (MOR), linear firing shrinkage (LFS) and weight loss during firing (WL), as well as for As, Ba, Cd, Cr, Cu, Mo, Ni, and Zn in equilibrium leaching tests at L/S = 10 (Table S2) (Supplementary material). The data set results of the 14 variables obtained in the 30 samples of laboratory pieces can be grouped in a SOM trained map (Figure 3a) based on “range” data normalisation resulting in a 6 x 5 (30 neurons) map, similar to the size of the 27-unit map proposed by the algorithm [59], with QE = 0.519 and TE = 0. The application of the k-means algorithm to the trained map classifies the samples into four clusters (clusters I–IV). Figure 3b shows the component planes of the SOM for the 14 properties of the laboratory clay fired pieces.

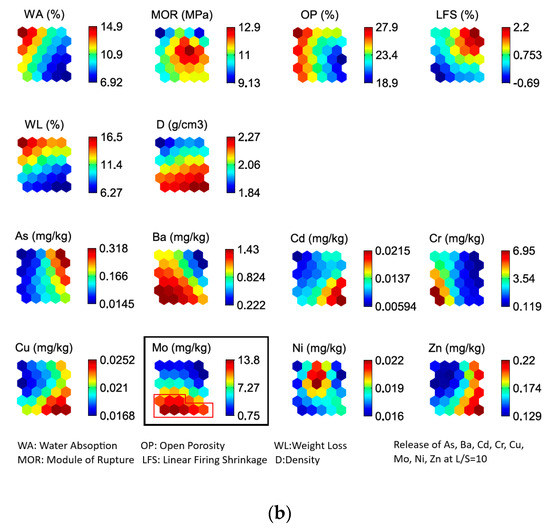
Figure 3.
(a) Clustered map with labels of the studied laboratory pressed clay mixtures with WS-FSD incorporation. The 4 clusters (I–IV) have been derived from the k-means algorithm applied to the trained SOM. The labels in the hexagons of the map show the BMU (Best Matching Unit) corresponding to each sample. (b) Component planes of the SOM for the 14 input variables with Mo highlighted along with neurons that exceed non-hazardous landfill limits. Each map corresponding to one variable (component) should be compared to the map representing the distribution of the laboratory pressed clay mixtures with WS-FSD incorporation presented in Figure 3a; hexagons in the same place on different component planes correspond to the same map unit. The colours indicate the value of the component in the weight vector of each unit of the map, according to the colour bars on the right.
Cluster I is characterised by mixtures without or with relatively low content of Waelz slag, while foundry sand dust contents vary from 6 to 40%. The predominant type of clay found in this cluster is the low firing temperature clay, C1. This cluster is characterised for the highest values of water absorption, open porosity and weight loss, and the lowest of the module of rupture and density, probably related to the high content in carbonates of clay C1 (Table 1) and their decomposition during firing. In terms of leaching behaviour, this cluster outperform the others as the element release is relatively low for all studied elements.
Cluster II is similar to the Cluster I in terms of mixtures composition with negligible Waelz slag and variable contents of foundry sand dust. C2 and C3-based clays, that means, mild and high firing temperature processes respectively, are mainly found in this cluster. Technological properties associated to this cluster are the relatively low values of water absorption (WA) and open porosity (OP), while the linear firing shrinkage (LFS) is the highest. The cluster exhibits also intermediate values of weight loss (WL) and density (D). Leaching behaviour is characterised by the highest value of As, relatively high values of Cu and Zn release, while Ba, Cr and Mo exhibit the lowest values.
Mixtures with high content of Waelz slag, higher than 20% and relatively low content of foundry sand dust are included in Cluster III. C1, C2 and C3-based clays are found in this cluster. Samples in this cluster show the lowest values of linear firing shrinkage (negatives) and low values of weight loss, with high values of density, due to the glassy phase formed by melted slag [27]. Ba, Cr and Mo release exhibit the highest values in this cluster. Mo component plane is highlighted because some values in neurons exceed non-hazardous landfill limits from the European Waste Landfill Council Decision (Table S2) (Supplementary material). Neurons that surpass those values are framed in the component plane (Figure 3b).
Mixtures grouped in cluster IV are C3-based products and therefore high firing temperature samples, with variable Waelz slag and low foundry sand dust content. As technical properties, these samples exhibit the highest values of density and the lowest of weight lost, water absorption and open porosity among the four clusters. Highest values of Cd, Cu and Zn release are characteristic of this cluster, intermediate values of Mo and low release values for the rest of the studied elements. Contrary to cluster III, Cr in cluster IV show low release due to the high firing temperature because of the inverse correlation between Cr release and firing temperature.
Samples with higher content of WS are located at the bottom side of the map (Figure 3a), and most of the C3-based samples (fired at high temperature) are located at the right side, C2-based samples fired at medium temperature at the centre, and C1-based samples fired at low temperature to the left side. The addition of Waelz slag reduced the sintering temperature because it adds network modifying species and improved the physico-chemical and technological characteristics of the laboratory pieces. However, the addition of WS in the mixtures causes a severe increase of Ba, Cr and Mo concentrations in leachate, which are also dependent of the type of clay that determine the firing cycle and the maximum temperature reached. The increased mobility of Cr and Mo observed in Waelz slag containing pieces has been previously described as consequence of the speciation change, from elemental form to more soluble molybdates and chromates during the firing process. These species are weakly retained on the sintered matrix of the final product, leading to high releases in products fired at low temperatures [40,60].
In relation to the product properties, the strong inverse correlation value obtained for the water absorption (WA) with the temperature can be interpreted along with the WA component plane in the SOM, as well as with the addition of waste [15]. Highest values of water absorption correspond to C1-based samples (low firing temperature clay), while the lowest are located in the right side of the map, where most of the C3-based samples are grouped. Open porosity (OP) evidences the same trend (Figure 3b) with highest values in C1 based samples. The highest values of bulk density (D) are shown by samples with high Waelz slag additions (bottom side) due to its high iron content. In contrast, the weight loss (WL) shows a mirror-like behaviour respect to the density. Linear firing shrinkage (LFS) displays the highest values in cluster II, where content of WS is relatively low or nonexistent, whereas the highest MOR values are in samples located in the centre of the map (Figure 3a) with relatively high FSD content.
An increased mobility of Cr and Mo has been observed from the laboratory pieces with Waelz slag incorporation. Arsenic, despite its low content in the raw materials, increases its mobility due to the thermal process, particularly in two of the three types of studied clays (C2 and C3), although it remains below the inert landfill limit. Barium mobility is high in Waelz slag [61], although the thermal process reduces its mobility considerably, below the inert landfill limit as a result of metal incorporation to the generated silica-based matrix. For these reasons, As, Ba, Cr and Mo are considered critical pollutants whose leaching behaviour needs to be further studied in the next semi-industrial and industrial phases.
Laboratory scale ceramic pieces show the feasibility of incorporating WS and FSD into fired ceramic materials. Industrial waste additions lead to analysed property values ranging above and below those obtained from the reference pieces (LC1, LC2, LC3), except for the open porosity, whose values are systematically 30% higher after the additions. By-products could adversely affect the sintering process, especially FSD that present a very high LOI. The OP is higher in the mixtures developed with C1 clay, due to the calcareous nature of the clay and the decomposition of carbonates with temperature produce a greater porosity [39]. Based on the laboratory results obtained and according to the scale-up objectives of the present study, a more common and reproducible solid brick prototype is going to be tested in the next stage of development at pilot-plant scale.
3.2. Semi-Industrial Extruded Clay Mixtures with WS-FSD Incorporation
In the development stage carried out in a pilot-plant, at a semi-industrial level, it was decided to develop a brick prototype, named common brick, corresponding to the family of “bricks and blocks to cover”, that have the highest marketable production in Spain [3]. In this pilot-plant trial, mixtures of the illitic-calcareous clay C1, WS (0–40%), FSD (0–35%) and a fixed amount of 8% wood pulp have been used. The moulding system of extrusion has been used as well as a firing cycle that is completed after drying, in an industrial furnace reaching required temperatures up to 850 °C (Figure 1) to obtain common bricks at semi-industrial level.
The same technological properties have been measured on the fired products obtained, and the critical pollutants that have been determined on the laboratory scale have been analysed in the leachates. Prototypes obtained in this semi-industrial phase were evaluated through two leaching protocols, UNE-EN 12457-1 and 2, using the liquid/solid ratio 2 and 10, which simulates closed and open landfill conditions, respectively.
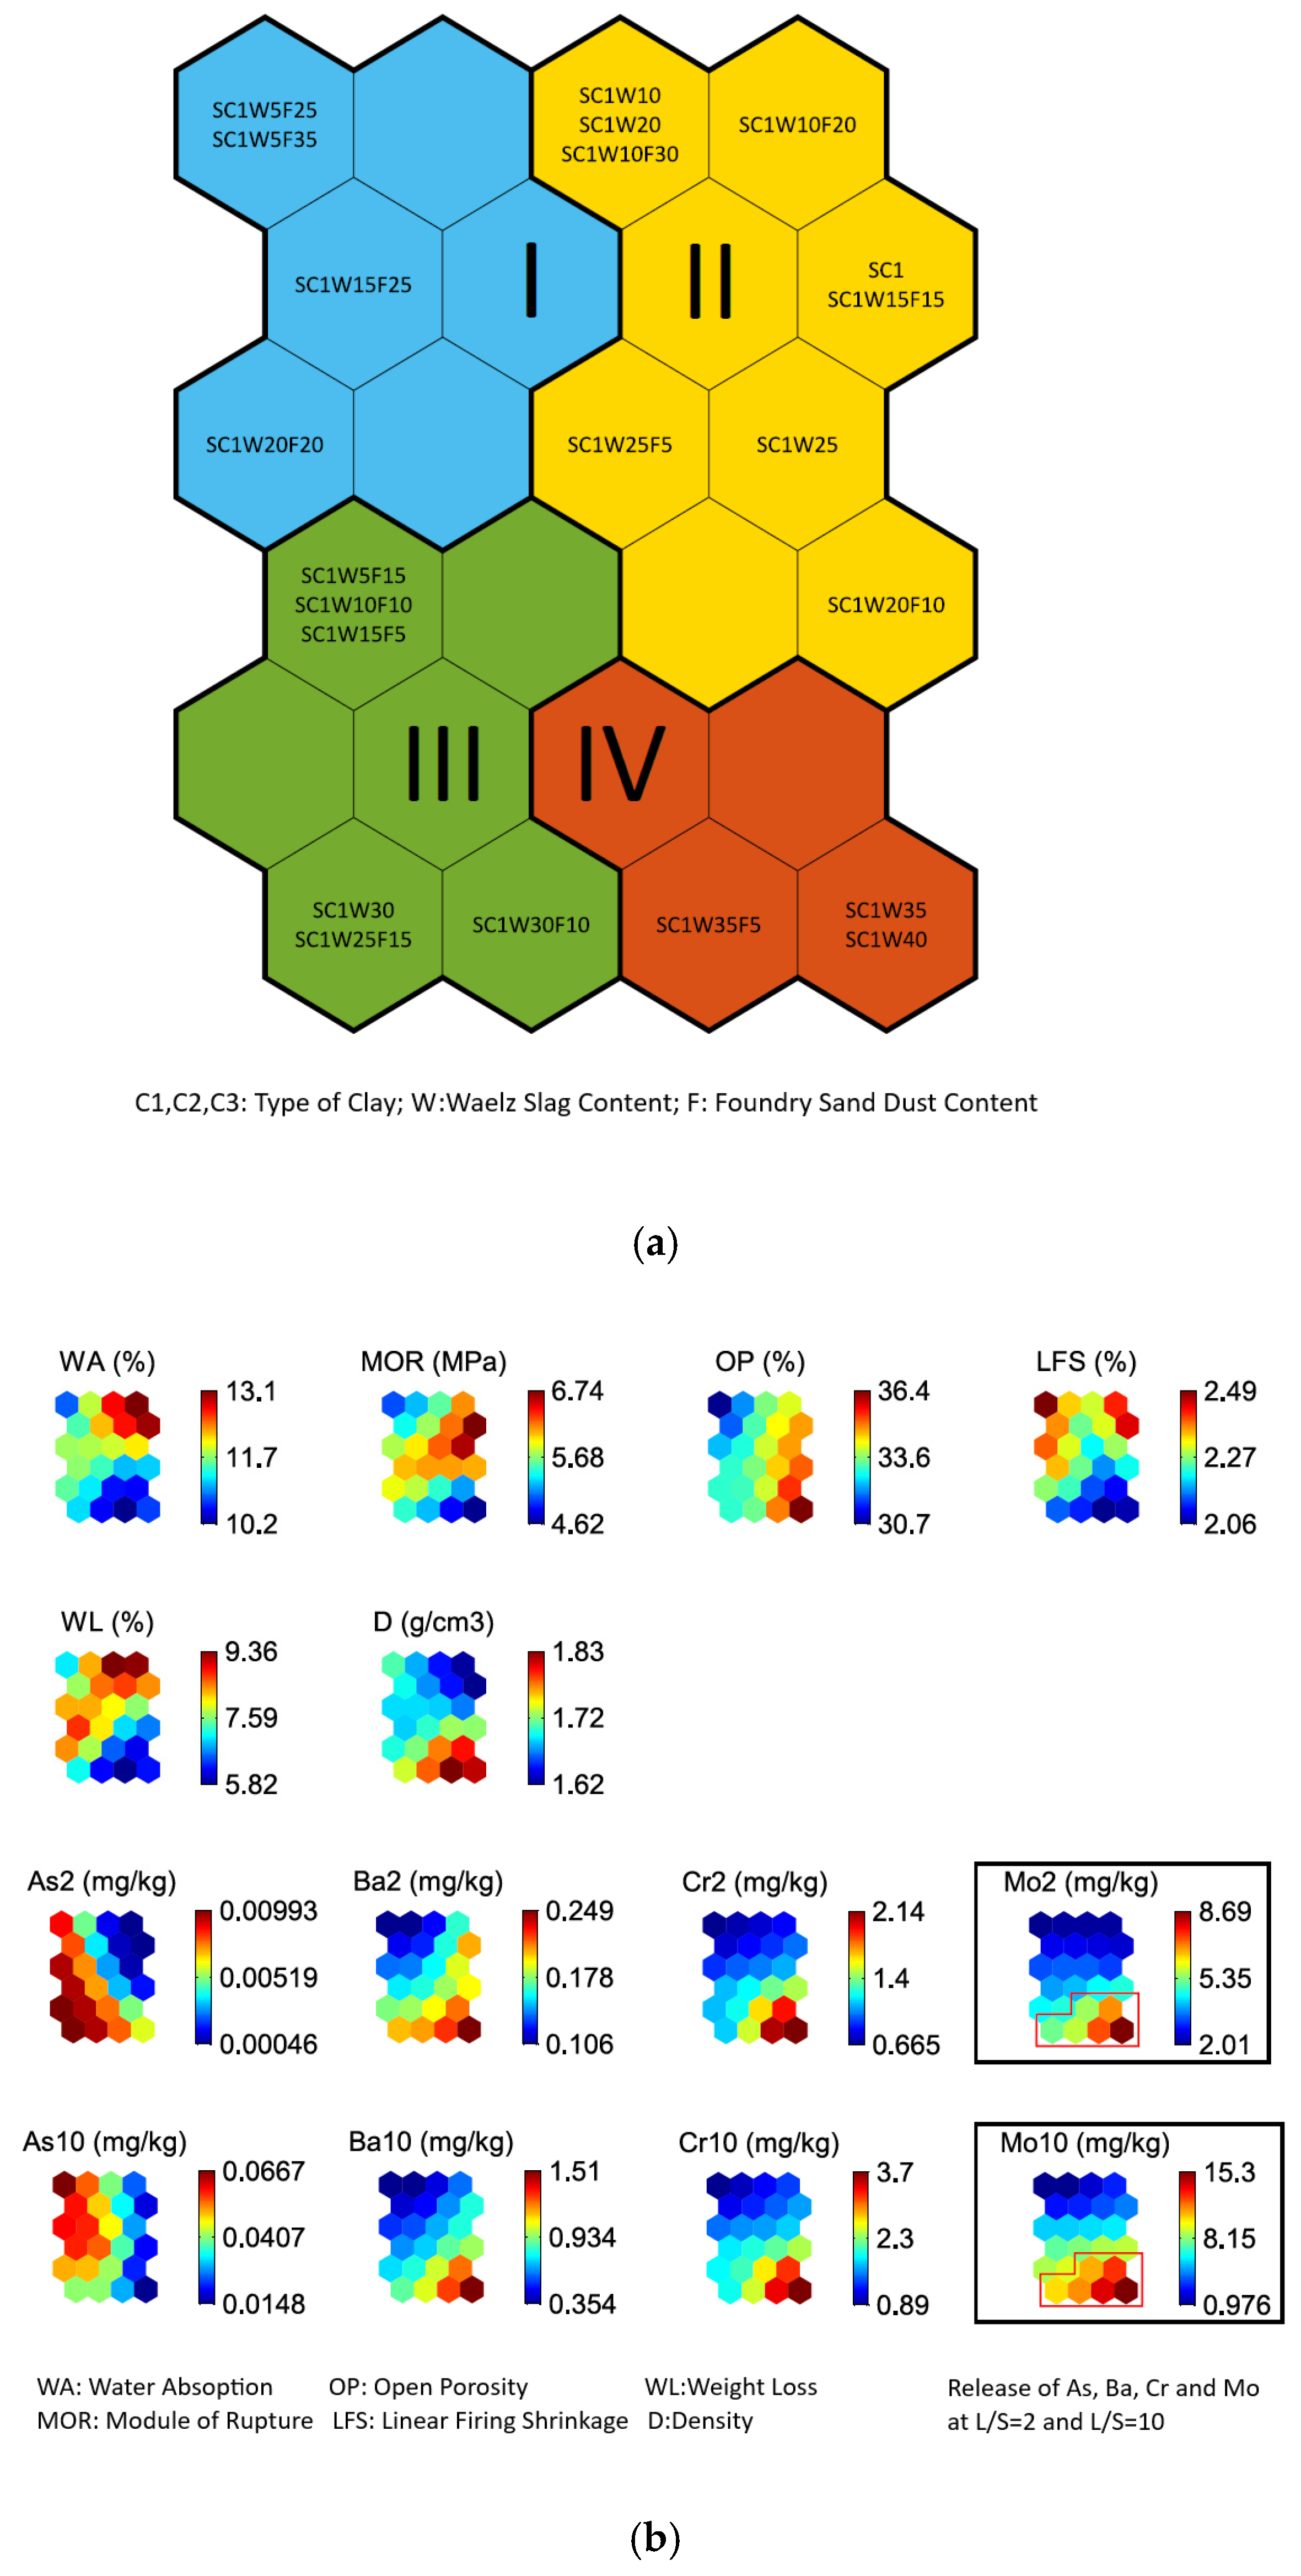
The data set results of the 14 variables obtained in the 22 semi-industrial prototypes shown in Table S3 (Supplementary material) can be grouped in an SOM trained map (Figure 4a) based onto “range” normalization of data, resulting in a 6 × 4 (24 neurons) map, similar to the size of the 23-unit map proposed by the algorithm [59] with QE = 0.548 and TE = 0. The application of the k-means algorithm to the trained map classifies the samples into four clusters (clusters I–IV). Figure 4b shows the component planes of the SOM for the 14 properties of the clay fired prototypes.

Figure 4.
(a) Clustered map with labels of the studied pilot-plant clay mixtures with WS-FSD incorporation. The four clusters (I–IV) have been derived from the k-means algorithm applied to the trained SOM. The labels in the hexagons of the map show the BMU corresponding to each sample. (b) Component planes of the SOM for the 14 input variables with Mo highlighted along with neurons that exceed non-hazardous landfill limits. Each map corresponding to one variable (component) should be compared to the map representing the distribution of the pilot-plant clay mixtures with WS-FSD incorporation presented in Figure 4a; hexagons in the same place on different component planes correspond to the same map unit. The colours indicate the value of the component in the weight vector of each unit of the map, according to the colour bars on the right.
Cluster I is characterised by ternary mixtures with low WS (5–20%) and high FSD (20–35%) content. Cluster I is defined by the lowest values of metals release, for both L/S = 2 and L/S = 10, except for As with high release values at L/S = 2 and the highest release values at L/S = 10. These samples showed low values of WA, OP, MOR and WL, high values of LFS and intermediate values of D. Cluster II grouped the higher number of mixtures (40% of the samples), including the reference: three binary mixtures with low values of WS content (0–25%) and five ternary mixtures with a broad range of both WS as well as FSD (5–30%) content. Cluster II, which groups samples with the lowest clay substitution rates (0–30%), shows low and intermediate values of metals release, with the lowest values of As at L/S = 2. These prototypes exhibit the highest values of WA, MOR, WL, intermediate values of OP and LFS and the lowest values of D. Cluster III groups only the ternary mixtures with a higher content of WS (5–30%) and a broad range of FSD (0–30%) and clay substitution rate (20–40%). The metals release of this sample is high to intermediate with high values of As releasing mainly at L/S = 2. The properties reach intermediate values. Cluster IV includes only three samples, with the highest content of WS (30–40%) in all of them. Here, the highest values of metal (Ba, Cr and Mo) release are found for both leaching tests. Mo component planes, Mo2 and Mo10, whose neurons surpassing the threshold values for non-hazardous landfill at L/S = 2 and L/S = 10, are highlighted in Figure 4b.
Values of WA, OP and LFS in prototypes with industrial wastes additions are 31%, 20% and 25% as average, lower than the reference values (SC1 located in Cluster II). The obtained values of LFS below 8% and WA below 16% classify the prototypes as high quality bricks [48,49]. Density (D) values increases 25% as average reaching values in the range 1.5 to 1.9 g/cm3 typical of good quality bricks [62]. Samples with the higher WS additions (Cluster IV) developed the higher density but the lower WA, MOR, WL and LFS. On the other hand, the higher relative additions of FSD (samples in cluster I) lead to intermediate values of technological properties. Metal release behaviour is similar in both of the leaching tests at L/S = 2 and L/S = 10 (Figure 4b). Cluster II shows the best combination of metals release and technological properties. Obtained results show the limitation of the WS incorporation to values of 25–30%, whereas the FSD incorporation does not appear to be a limiting due to the good results in both of the high and low FSD incorporations.
FSD does not provide improvement on the final product properties due to its role as a filler replacing a fraction of the clay. Due to the difficulty of handling ternary mixtures at an industrial level, only binary mixtures with WS and clay (and the corresponding additives) were processed.
3.3. Industrial Extruded Clay Mixtures with WS Incorporation
In this demonstration stage, at an industrial level, two types of hollow brick are manufactured according to the current market demand in Spain: large-format hollow brick (or lightweight brick) and perforated brick (or ceramic block). In these industrial trials, mixtures of illitic-calcareous clay C1, a fixed amount of 8% wood pulp and a sample with 30% WS (IC1W30) as well as a reference without WS (IC1) have been developed for lightweight brick. The second products, the ceramic blocks, have been manufactured with an illitic-calcareous clay C4 and 20% WS (IC4W20) as well as a reference without WS (IC4). The moulding system of extrusion has been used coupled to a drying and firing cycle in industrial furnaces reaching temperatures up to 850 °C and 930 °C adequate to obtain a batch of each product at industrial level at Cerabric (La Rioja, Spain) and Utzubar (Navarra, Spain) companies (Figure 1).
In the previous semi-industrial stage, the obtained prototypes showed linear firing shrinkage (LFS) and weight loss (WL) values well below the reference sample values (SC1) (Table S3) (Supplementary material). An undefined trend has been observed with the incorporation of slag, both in binary mixtures and in ternary mixtures. In addition, these properties are not required in the Declarations of Performance (technical specifications) for this type of products [44]. For this reason, these properties are not measured on the industrial tests.
The data set of values of the 12 analysed variables in the four industrial samples is shown in Table S4 (Supplementary material). The WS incorporation increases the modulus of rupture (MOR) and the density in the two types of industrial bricks tested. Additionally, IC4W20 decreases water absorption (WA) and maintains the open porosity (OP) constant respect to his reference IC4, while in contrast, IC1W30 increases WA and OP respect to the IC1 reference brick. Although the release of Zn, Ba and As are below the limits for the Inert landfill, experimental results showed that none of the commercial bricks (nor reference bricks nor bricks with waste) complied with the criteria established by the European Union for inert wastes (the most stringent), and being classified as a non-hazardous waste (due to Cr and Mo release). Incorporation of Waelz slag into the clay mix results in higher leaching of chromium (Cr) and molybdenum (Mo) from the fired ceramics. This is due primarily to the higher concentration of these elements in the slag but may also be affected by microstructural changes caused by the presence of these elements in the clay mix. The leaching of Cr and Mo from light bricks containing 30% Waelz slag (IC1W30) reached values close to the thresholds established for non-hazardous wastes (at L/S = 2 test). Lower release values were observed in the case of standard bricks containing Waelz slag (IC4W20), which may be attributed to the lower proportion of slag incorporated into the mix or to microstructural variations derived from the small differences in the firing conditions and raw materials. Due to the reducing conditions of the Waelz process, most of the Mo and Cr present in the slag are in their elemental form [63,64]. It should be expected that this state of oxidation changes during the brick firing process, resulting in formation of molybdates and chromates that release more readily from the final product.
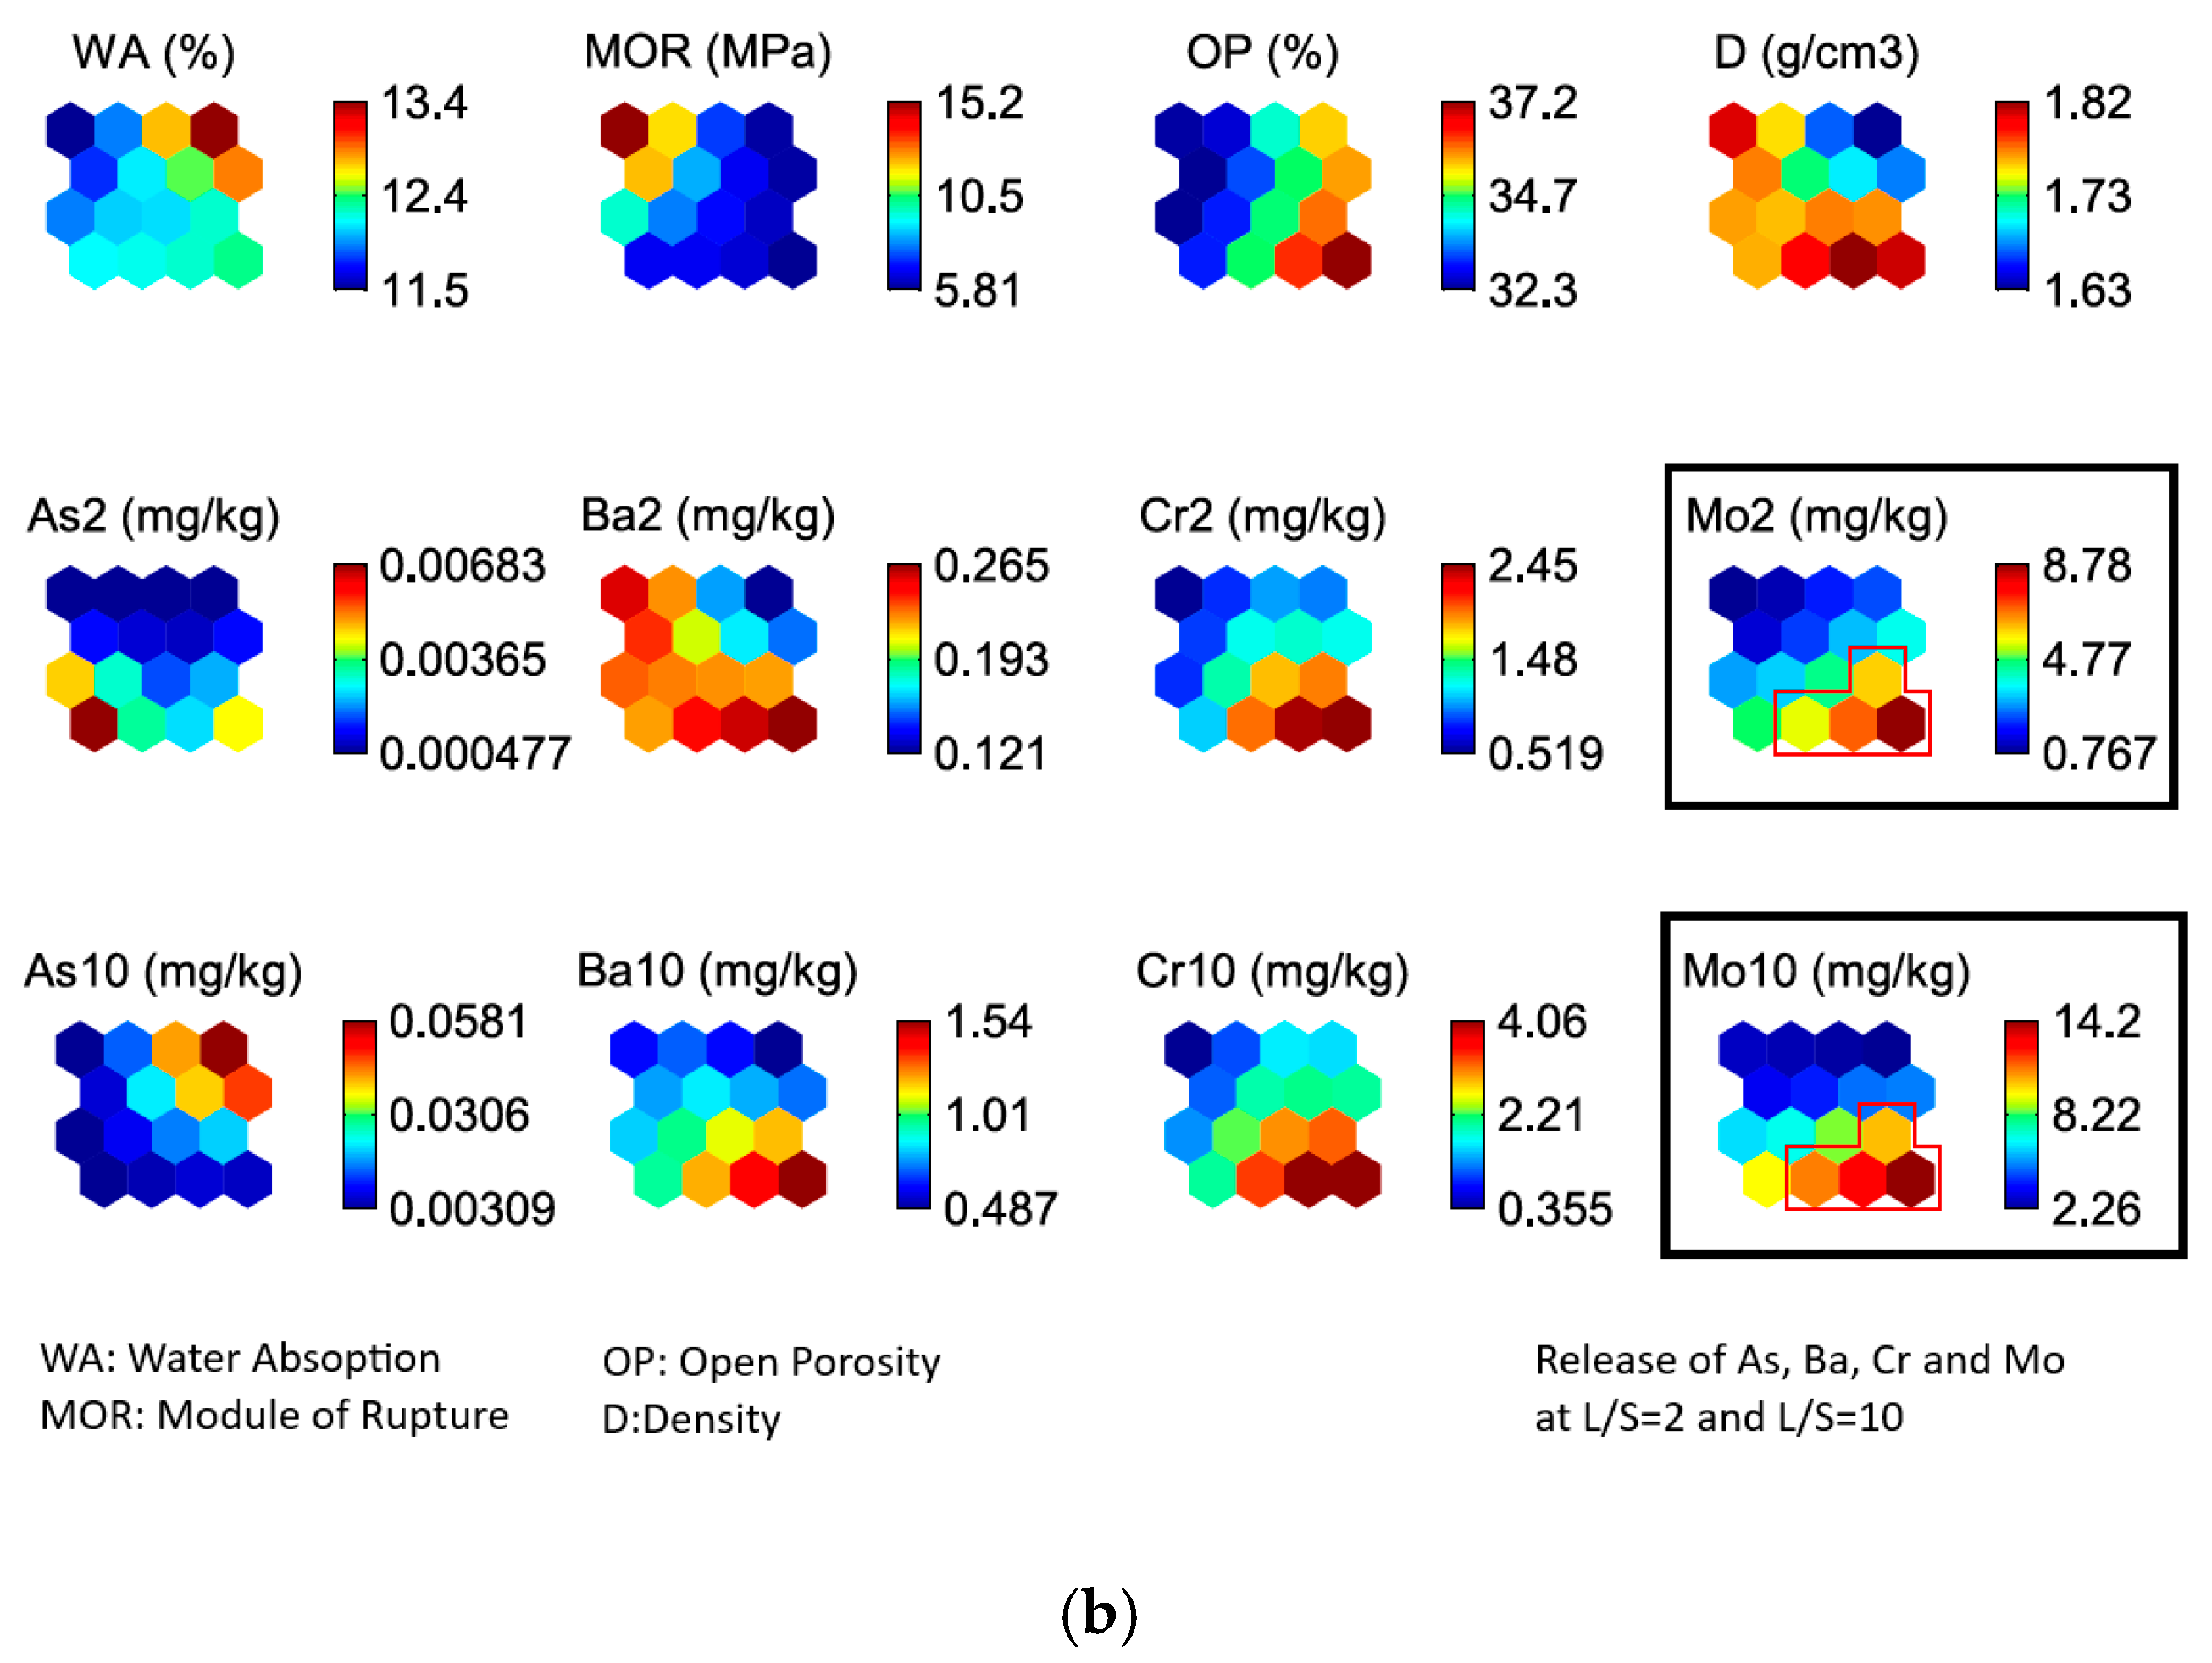
A SOM analysis has been made in order to compare the four industrial bricks that incorporates WS with the six semi-industrial prototypes with only WS addition enabling the detection of sample clusters. The data set results of the 12 variables of the semi-industrial prototypes and industrial bricks with only WS addition have been grouped in a SOM trained map (Figure 5a) based onto “range” normalization of data. The 4 x 4 (16 neurons) map, equal to the size of the 16-unit map proposed by the algorithm [59] result in the values of QE = 0.566 and TE = 0. Figure 5b shows the component planes of the SOM for the 12 properties of the tested samples.
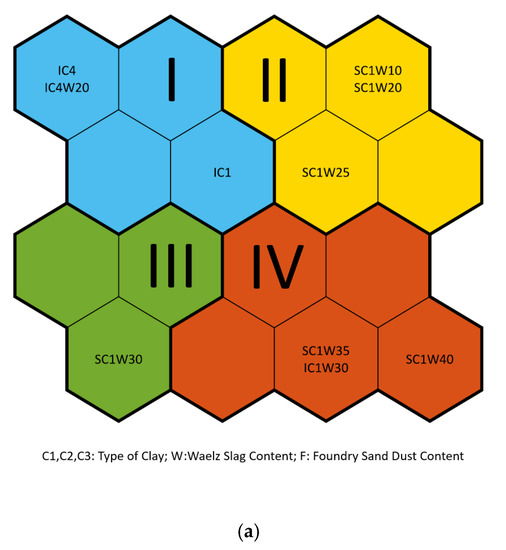
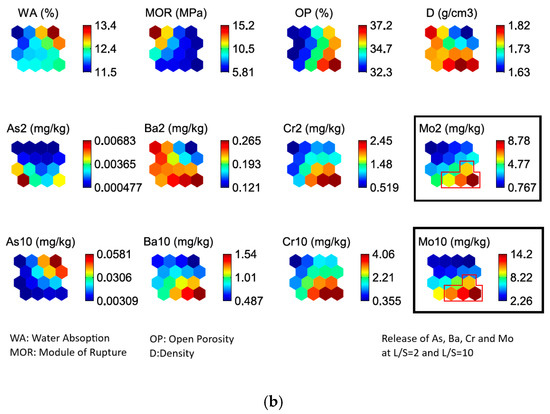
Figure 5.
(a) Clustered map with labels of the studied pilot-plant and industrial clay mixtures with WS incorporation. The 4 clusters (I–IV) have been derived from the k-means algorithm applied to the trained SOM. The labels in the hexagons of the map show the BMU corresponding to each sample. (b) Component planes of the SOM for the 12 input variables with Mo highlighted along with neurons that exceed non-hazardous landfill limits. Each map corresponding to one variable (component) should be compared to the map representing the distribution of the pilot-plant and industrial clay mixtures with WS incorporation presented in Figure 5a; hexagons in the same place on different component planes correspond to the same map unit. The colours indicate the value of the component in the weight vector of each unit of the map, according to the colour bars on the right.
Industrial bricks up to 20% of WS are grouped in the same luster I separately to the others. Inside this Cluster I, IC4 and IC4W20 are located in the same neuron, while IC1 is in a different neuron. All samples in this cluster show high density and MOR with low OP and WA values; in addition, show relatively low release values of the studied metals with the best results to the IC4 samples (Figure 5b). Cluster II, III and IV grouped samples with increasing amount of WS from 10% to 40%. The industrial sample IC1W30 is located in cluster IV, together with semi-industrial samples with higher WA content. It is in the same neuron of semi-industrial sample with a higher WS content (SC1W35), mainly due to the high release values of Cr and Mo, caused by the reducing conditions in the industrial oven [63,64]. Samples of clusters II, III and IV exhibit worse technical properties and higher Ba, Cr and Mo released as we go forward in the order cluster II to III and to IV.
Bricks incorporating up to 20% Waelz slag (IC4W20) show optimum technological properties and metals release behaviour, reducing the waste landfilled as well as the energy requirements involved in the firing process and therefore contributing to the circular economy. However, higher additions of WS (IC1W30) lead to worse properties in comparison to the same dosage on a semi-industrial scale (SC1W30).
3.4. Comparative Analysis of Clay Mixtures at Different Manufacturing Scales
The comparative analysis by SOM of the 56 studied samples at laboratory, pilot-plant and industrial scale lead to a trained map (Figure 6) based on “range” normalization of data of 8 x 5 (40 neurons), similar to the size of the 37-unit map proposed by the algorithm [59], with QE = 0.289 and TE = 0.

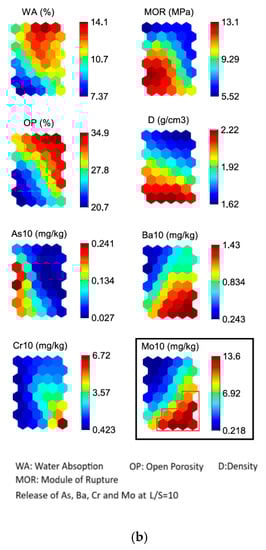
Figure 6.
(a) Clustered map with labels of the 56 studied samples from laboratory, pilot-plant and industrial clay mixtures with WS incorporation. (b) Component planes of the SOM for the eight input variables with Mo highlighted along with neurons that exceed non-hazardous landfill limits.
The shape of the four clustered maps in Figure 6a indicates that samples are effectively sorted by, firstly, the type of clay and therefore, firing temperature; secondly, by Waelz slag content, being independent of the foundry sand addition, and thirdly, by the type of processing (laboratory-pressing, semi-industrial extruder, industrial, extruder). Cluster I grouped Clay 1 based samples that includes all semi-industrial samples up to 30% of WS, and laboratory and industrial samples without Waelz slag. Samples in this cluster show the lowest values of D and MOR, but the highest values of WA and OP. The metal release shows good behaviour with low metal leached concentrations. Cluster II includes laboratory samples of all clays with almost no content of WS, as well as the industrial samples IC4, IC4W20 which means that up to 20%WS does not substantially modify the behaviour of the brick. This cluster is of remarkable importance because of its minimum metal leaching while preserving intermediate values of the technological properties. Cluster III includes C2 and mainly C3-based laboratory pieces with high content of WS. These pieces fired at the highest temperature, show the highest MOR values, as well as the lowest WA and OP, even those with high waste dosages. Mo release exhibit medium-high values, even, samples with the highest WS content exceed the threshold for non-hazardous landfill in the European Council Decision (Annex I). However, it is not just one cluster that surpasses those values. Some neurons of clusters III and IV surpass the values, as are highlighted in the Mo component plane (Figure 6b).
Samples with the highest content of WS, independent of being pressed or extruded, are grouped on cluster IV. C1-based mixtures with the highest amount of WS are located in this cluster, as well as some C2 based mixtures. The main characteristic of this cluster is the high release of metals Ba, Cr and Mo, along with a good performance on the technological properties (Figure 6b). The high values of water absorption (WA) and open porosity (OP) and low values of density (D) and flexural strength (MOR) in cluster I and IV are inverse correlated with the firing temperature (the lower in these clusters) and directly correlated with the addition of wood pulp in the semi-industrial mixtures (cluster I) used to improve product performances. In relation to the metal release, the increase of Ba, Cr and Mo concentrations in leachate are related to the addition of WS as well as the increase of D in the mixtures. Samples with higher content on WS, independent of the clay and manufacturing scale, will be located in cluster III and IV. Regarding the As release, samples with high firing temperature are associated with high release values in the SOM (cluster II and III), where C2 and C3-based laboratory pieces and the IC4 industrial mixtures are located. The Cr and Mo release are high for those samples with high WS additions and low firing temperature.
Regarding scale-up, it should be noted that the reference samples without slag obtained at semi-industrial (SC1) and industrial scale (IC1) are located in the same cluster, displaying similar properties. Samples that include 30% of WS (SC1W30, IC1W30) are found in different clusters, but in contiguous neurons, so their behaviour is also very similar, although it differs to the reference samples in a greater extent. However, differences have been found in respect to samples obtained at laboratory scale, so it is concluded that it is important to carry out an adequate scale-up of new products, especially if alternative raw materials are introduced to the manufacturing process that can interfere in the sintering step.
4. Conclusions
This paper used an SOM-based methodology for analysing and assessing industrial waste incorporation, as Waelz slag (WS) and foundry sand dust (FSD), in construction ceramic products obtained sequentially at laboratory, semi-industrial and industrial level. The quantity and type of clay and waste incorporated, and therefore the firing temperature, and the scale at which the samples were manufactured, that determined the moulding process of the mixture, are the characteristics that define the samples analysed. The technological properties and potential contaminant elements release are the input variables to the SOM tool.
The SOM classifies the ceramic samples according to the behaviour of the technological and environmental properties, into four clusters at all levels. The addition of WS and the type of clay used and therefore, the firing cycle applied to the mixtures have been highlighted as the key factors in the ceramic sample classification. Additionally, the component planes of the SOM evidenced that the incorporation of WS severely affects the leaching behaviour of the mixtures with increasing release of Cr and Mo (up to 5.6 and 10 mg/kg respectively at industrial scale), and produce an important increase of the density (1.69 to 1.96 g/cm3) and slightly their mechanical resistance (8.4 to 9.5 MPa).
Comparative analysis at different manufacturing scales shows that laboratory and semi-industrial samples have different behaviour because of the type of moulding applied and atmosphere of the used oven (electric vs. combustion). On the other hand, a good correlation between semi-industrial and industrial scale from global SOM analysis is obtained for ceramic products up to 20% of Waelz slag.
The results obtained in this work can be applied to processes of incorporation of industrial inorganic waste into fired clay cycles, where the use of this tool will be useful as it allows a simultaneous interpretation of results, clustering, correlating and classifying data, thereby upgrading the scale-up process.
Supplementary Materials
The following are available online at https://www.mdpi.com/article/10.3390/app112110010/s1, Table S1: Composition of the studied ceramic mixtures, Table S2: Results of the 14 analysed variables obtained in the 30 samples of laboratory pieces. The Inert landfill and the non-hazardous landfill limits from the European Waste Landfill Council Decision are included at the bottom, Table S3: Results of the 14 analysed variables obtained in the 22 samples of semi-industrial prototypes. The Inert landfill and the non-hazardous landfill limits from the European Waste Landfill Council Decision are included at the bottom, Table S4: Results of the 12 analysed variables obtained in the 4 samples of industrial products. The Inert landfill and the non-hazardous landfill limits from the European Waste Landfill Council Decision are included at the bottom.
Author Contributions
I.S., writing—Original Draft Preparation, methodology and investigation; E.C., methodology and investigation; A.A., writing—review & editing, project administration and funding acquisition; J.R.V., conceptualization, writing—review & editing. All authors have read and agreed to the published version of the manuscript.
Funding
This work has been partially supported by (a) the Spanish Ministry of Economy and Competitiveness and the European Regional Development Fund by means of the research project RTI2018-097612-B-C22; (b) the BEFESA STEEL R&D, S.L.U.C. Company at Asua, Vizcaya, Spain.
Institutional Review Board Statement
Not applicable.
Informed Consent Statement
Not applicable.
Conflicts of Interest
The authors declare no conflict of interest.
References
- Ceramic Industry Roadmap: Paving the Way to 2050. Cerame-Unie—The European Ceramic Industry Association. Available online: http://cerameunie.eu/topics/cerame-unie-sectors/cerame-unie/ceramic-industry-roadmap-paving-the-way-to-2050/ (accessed on 16 April 2021).
- European Clay Brick and Tile Industry Tiles & Bricks Europe. Available online: http://www.tiles-bricks.eu/ (accessed on 16 August 2020).
- Hispalyt Asociación Española de Fabricantes de Ladrillos y Tejas de Arcilla Cocida. Available online: https://www.hispalyt.es/es/hispalyt/que-es-hispalyt (accessed on 25 February 2020).
- Cerame-Unie. Circular Economy in the Ceramic Industry; Cerame-Unie: Brussels, Belgium, 2020. [Google Scholar]
- Zanelli, C.; Conte, S.; Molinari, C.; Soldati, R.; Dondi, M. Waste Recycling in Ceramic Tiles: A Technological Outlook. Resour. Conserv. Recycl. 2021, 168, 105289. [Google Scholar] [CrossRef]
- Dondi, M.; García-Ten, J.; Rambaldi, E.; Zanelli, C.; Vicent-Cabedo, M. Resource Efficiency versus Market Trends in the Ceramic Tile Industry: Effect on the Supply Chain in Italy and Spain. Resour. Conserv. Recycl. 2021, 168, 105271. [Google Scholar] [CrossRef]
- Boschi, G.; Masi, G.; Bonvicini, G.; Bignozzi, M.C. Sustainability in Italian Ceramic Tile Production: Evaluation of the Environmental Impact. Appl. Sci. 2020, 10, 9063. [Google Scholar] [CrossRef]
- Murmu, A.L.; Patel, A. Towards Sustainable Bricks Production: An Overview. Constr. Build. Mater. 2018, 165, 112–125. [Google Scholar] [CrossRef]
- Monteiro, S.N.; Vieira, C.M.F. On the Production of Fired Clay Bricks from Waste Materials: A Critical Update. Constr. Build. Mater. 2014, 68, 599–610. [Google Scholar] [CrossRef]
- Bories, C.; Borredon, M.E.; Vedrenne, E.; Vilarem, G. Development of Eco-Friendly Porous Fired Clay Bricks Using Pore-Forming Agents: A Review. J. Environ. Manag. 2014, 143, 186–196. [Google Scholar] [CrossRef]
- Zhang, L. Production of Bricks from Waste Materials—A Review. Constr. Build. Mater. 2013, 47, 643–655. [Google Scholar] [CrossRef]
- López-garcía, A.B.; Cotes-palomino, T.; Uceda-rodríguez, M.; Moreno-maroto, J.M.; Cobo-ceacero, C.J.; Fernanda Andreola, N.M.; Martínez-garcía, C. Application of Life Cycle Assessment in the Environmental Study of Sustainable Ceramic Bricks Made with ‘Alperujo’ (Olive Pomace). Appl. Sci. 2021, 11, 2278. [Google Scholar] [CrossRef]
- Suvorova, O.V.; Selivanova, E.A.; Mikhailova, J.A.; Masloboev, V.A.; Makarov, D.V. Ceramic Products from Mining and Metallurgical Waste. Appl. Sci. 2020, 10, 3515. [Google Scholar] [CrossRef]
- Adediran, A.; Lemougna, P.N.; Yliniemi, J.; Tanskanen, P.; Kinnunen, P.; Roning, J.; Illikainen, M. Recycling Glass Wool as a Fluxing Agent in the Production of Clay- and Waste-Based Ceramics. J. Clean. Prod. 2021, 289, 125673. [Google Scholar] [CrossRef]
- Jordán, M.M.; Montero, M.A.; Pardo-Fabregat, F. Technological Behaviour and Leaching Tests in Ceramic Tile Bodies Obtained by Recycling of Copper Slag and MSW Fly Ash Wastes. J. Mater. Cycles Waste Manag. 2021, 23, 707–716. [Google Scholar] [CrossRef]
- Rehman, M.U.; Ahmad, M.; Rashid, K. Influence of Fluxing Oxides from Waste on the Production and Physico-Mechanical Properties of Fired Clay Brick: A Review. J. Build. Eng. 2020, 27, 100965. [Google Scholar] [CrossRef]
- Muñoz, P.; Morales, M.P.; Letelier, V.; Mendivil, M.A. Fired Clay Bricks Made by Adding Wastes: Assessment of the Impact on Physical, Mechanical and Thermal Properties. Constr. Build. Mater. 2016, 125, 241–252. [Google Scholar] [CrossRef]
- Aydin, T.; Casin, E. Mixed Alkali and Mixed Alkaline-Earth Effect in Ceramic Sanitaryware Bodies Incorporated with Blast Furnace Slag. Waste Biomass Valorization 2021, 12, 2685–2702. [Google Scholar] [CrossRef]
- Coronado, M.; Andrés, A.; Cheeseman, C.R. Acid Gas Emissions from Structural Clay Products Containing Secondary Resources: Foundry Sand Dust and Waelz Slag. J. Clean. Prod. 2016, 115, 191–202. [Google Scholar] [CrossRef] [Green Version]
- Coronado, M.; Segadães, A.M.; Andrés, A. Using Mixture Design of Experiments to Assess the Environmental Impact of Clay-Based Structural Ceramics Containing Foundry Wastes. J. Hazard. Mater. 2015, 299, 529–539. [Google Scholar] [CrossRef] [PubMed]
- Quijorna, N.; Coz, A.; Andres, A.; Cheeseman, C. Recycling of Waelz Slag and Waste Foundry Sand in Red Clay Bricks. Resour. Conserv. Recycl. 2012, 65, 1–10. [Google Scholar] [CrossRef]
- Arsenović, M.; Radojević, Z.; Jakšić, Ž.; Pezo, L. Mathematical Approach to Application of Industrial Wastes in Clay Brick Production—Part I: Testing and Analysis. Ceram. Int. 2015, 41, 4890–4898. [Google Scholar] [CrossRef]
- Mendes, B.C.; Pedroti, L.G.; Fontes, M.P.F.; Ribeiro, J.C.L.; Vieira, C.M.F.; Pacheco, A.A.; Azevedo, A.R.G. de Technical and Environmental Assessment of the Incorporation of Iron Ore Tailings in Construction Clay Bricks. Constr. Build. Mater. 2019, 227, 116669. [Google Scholar] [CrossRef]
- Arsenović, M.; Stanković, S.; Pezo, L.; Mančić, L.; Radojević, Z. Optimization of the Production Process through Response Surface Method: Bricks Made of Loess. Ceram. Int. 2013, 39, 3065–3075. [Google Scholar] [CrossRef]
- Pezo, L.; Arsenović, M.; Radojević, Z. ANN Model of Brick Properties Using LPNORM Calculation of Minerals Content. Ceram. Int. 2014, 40, 9637–9645. [Google Scholar] [CrossRef]
- Magalhães, J.M.; Silva, J.E.; Castro, F.P.; Labrincha, J.A. Effect of Experimental Variables on the Inertization of Galvanic Sludges in Clay-Based Ceramics. J. Hazard. Mater. 2004, 106, 139–147. [Google Scholar] [CrossRef]
- Teo, P.T.; Zakaria, S.K.; Mohd Sharif, N.; Abu Seman, A.; Taib, M.A.A.; Mohamed, J.J.; Yusoff, M.; Yusoff, A.H.; Mohamad, M.; Ali, A.; et al. Application of General Full Factorial Statistical Experimental Design’s Approach for the Development of Sustainable Clay-Based Ceramics Incorporated with Malaysia’s Electric Arc Furnace Steel Slag Waste. Crystals 2021, 11, 442. [Google Scholar] [CrossRef]
- Tsakovski, S.; Kudlak, B.; Simeonov, V.; Wolska, L.; Namiesnik, J. Ecotoxicity and Chemical Sediment Data Classification by the Use of Self-Organising Maps. Anal. Chim. Acta 2009, 631, 142–152. [Google Scholar] [CrossRef] [PubMed]
- Kim, D.K.; Jo, H.; Han, I.; Kwak, I.S. Explicit Characterization of Spatial Heterogeneity Based on Water Quality, Sediment Contamination, and Ichthyofauna in a Riverine-to-Coastal Zone. Int. J. Environ. Res. Public Health 2019, 16, 409. [Google Scholar] [CrossRef] [PubMed] [Green Version]
- Veses, O.; Mosteo, R.; Ormad, M.P.; Ovelleiro, J.L. Classification of Sediments by Means of Self-Organizing Maps and Sediment Quality Guidelines in Sites of the Southern Spanish Coastline. Mediterr. Mar. Sci. 2014, 15, 37–44. [Google Scholar] [CrossRef]
- Alvarez-Guerra, M.; González-Piñuela, C.; Andrés, A.; Galán, B.; Viguri, J.R. Assessment of Self-Organizing Map Artificial Neural Networks for the Classification of Sediment Quality. Environ. Int. 2008, 34, 782–790. [Google Scholar] [CrossRef] [PubMed]
- Muñoz, I.; Martín-Torre, M.C.; Galán, B.; Viguri, J.R. Assessment by Self-Organizing Maps of Element Release from Sediments in Contact with Acidified Seawater in Laboratory Leaching Test Conditions. Environ. Monit. Assess. 2015, 187, 748. [Google Scholar] [CrossRef] [PubMed] [Green Version]
- Hadjisolomou, E.; Stefanidis, K.; Papatheodorou, G.; Papastergiadou, E. Assessment of the Eutrophication-Related Environmental Parameters in Two Mediterranean Lakes by Integrating Statistical Techniques and Self-Organizing Maps. Int. J. Environ. Res. Public Health 2018, 15, 547. [Google Scholar] [CrossRef] [PubMed] [Green Version]
- Ahn, J.M.; Jung, K.Y.; Yang, D.S.; Shin, D.S. Verification of Water Environment Monitoring Network Representativeness under Estuary Backwater Effects. Environ. Monit. Assess. 2018, 190, 463. [Google Scholar] [CrossRef]
- de Oliveira, R.H.; Carneiro, C.D.C.; de Almeida, F.G.V.; de Oliveira, B.M.; Nunes, E.H.M.; dos Santos, A.S. Multivariate Air Pollution Classification in Urban Areas Using Mobile Sensors and Self-Organizing Maps. Int. J. Environ. Sci. Technol. 2019, 16, 5475–5488. [Google Scholar] [CrossRef]
- Alvarez-Guerra, E.; Molina, A.; Viguri, J.R.; Alvarez-Guerra, M. A SOM-Based Methodology for Classifying Air Quality Monitoring Stations. Environ. Prog. Sustain. Energy 2011, 30, 424–438. [Google Scholar] [CrossRef]
- Abarca-Alvarez, F.J.; Navarro-Ligero, M.L.; Valenzuela-Montes, L.M.; Campos-Sánchez, F.S. European Strategies for Adaptation to Climate Change with the Mayors Adapt Initiative by Self-Organizing Maps. Appl. Sci. 2019, 9, 3859. [Google Scholar] [CrossRef] [Green Version]
- Coronado, M. Foundry Wastes as New Resources in Ceramic Processes. Ph.D. Thesis, Universidad de Cantabria, Cantabria, Spain, 2014. [Google Scholar]
- Coronado, M.; Segadães, A.M.; Andrés, A. Combining Mixture Design of Experiments with Phase Diagrams in the Evaluation of Structural Ceramics Containing Foundry By-Products. Appl. Clay Sci. 2014, 101, 390–400. [Google Scholar] [CrossRef]
- Quijorna, N.; Miguel, G.S.S.; Andrés, A. Incorporation of Waelz Slag into Commercial Ceramic Bricks: A Practical Example of Industrial Ecology. Ind. Eng. Chem. Res. 2011, 50, 5806–5814. [Google Scholar] [CrossRef]
- Quijorna, N.; San Miguel, G.; Andrés, A. Environmental Assessment of the Incorporation of Waelz Slag into Clay-Based Ceramic Construction Materials. In Proceedings of the International Conference on Environmental Science and Technology, Singapore, 26–28 February 2011. [Google Scholar]
- Quijorna, N.; San Miguel, G.; Andrés, A. Application of industrial ecology through the incorporation of Waelz Slag in brick production: An industrial-scale experiment. In Proceedings of the International Conference on Environmental Science and Technology, Chania, Greece, 3–5 September 2009. [Google Scholar]
- UNE-EN-771-1 Specification for Masonry Units—Part 1: Clay Masonry Units; UNE: Madrid, Spain, 2003; Volume 32, (Suppl. S8).
- ISO 10545-1 Ceramic Tiles. Sampling and Basis for Acceptance; ISO: Geneva, Switzerland, 2014. [Google Scholar]
- ISO 10545-3 Ceramic Tiles. Part 3. Determination of Water Absorption, Apparent Porosity, Apparent Relative Density and Bulk Density; ISO: Geneva, Switzerland, 2018. [Google Scholar]
- ISO 10545-4 Ceramic Tiles. Part 4. Determination of Modulus of Rupture and Bending Strength; ISO: Geneva, Switzerland, 2012. [Google Scholar]
- Romero, M.; Andrés, A.; Alonso, R.; Viguri, J.; Rincón, J.M.M. Sintering Behaviour of Ceramic Bodies from Contaminated Marine Sediments. Ceram. Int. 2008, 34, 1917–1924. [Google Scholar] [CrossRef] [Green Version]
- Shih, P.-H.; Wu, Z.-Z.; Chiang, H.-L. Characteristics of Bricks Made from Waste Steel Slag. Waste Manag. 2004, 24, 1043–1047. [Google Scholar] [CrossRef] [PubMed]
- Lin, K.L. Feasibility Study of Using Brick Made from Municipal Solid Waste Incinerator Fly Ash Slag. J. Hazard. Mater. 2006, 137, 1810–1816. [Google Scholar] [CrossRef]
- EN 12457-1 Characterization of Waste—Leaching—Compliance Test of Leaching Granular Waste Materials and Sludge—Part 1—One Stage Batch Test at a Liquid to Solid Ratio of 2 L/Kg with Particle Size below 4 mm (without or with Size Reduction); CEN: Brussels, Belgium, 2003.
- EN-12457-2 Characterization of Waste—Leaching—Compliance Test of Leaching Granular Waste Materials and Sludge—Part 2—One Stage Batch Test at a Liquid to Solid Ratio of 10 L/Kg with Particle Size below 4 mm (without or with Size Reduction); CEN: Brussels, Belgium, 2003.
- EU European Council Decision 2003/33/EC of 19 December 2002 Establishing Criteria and Procedures for the Acceptance of Waste at Landfills. Article 16 and Annexe II to Directive 1999/31/CE; European Council: Brussels, Belgium, 2003.
- Kohonen, T. Essentials of the Self-Organizing Map. Neural Netw. 2013, 37, 52–65. [Google Scholar] [CrossRef] [PubMed]
- Kohonen, T. The Self-Organizing Map. Neurocomputing 1998, 21, 1–6. [Google Scholar] [CrossRef]
- Kiviluoto, K. Topology Preservation in Self-Organizing Maps. In Proceedings of the IEEE International Conference on Neural Networks—Conference Proceedings, Washington, DC, USA, 3–6 June 1996; Volume 1. [Google Scholar]
- Vesanto, J.; Himberg, J.; Alhoniemi, E.; Parhankangas, J. SOM Toolbox for Matlab 5; Report A57; Helsinki University of Technology, Neural Networks Research Centre: Espoo, Finland, 2000. [Google Scholar]
- Li, M.; Du, W.; Qian, F.; Zhong, W. Total Plant Performance Evaluation Based on Big Data: Visualization Analysis of TE Process. Chin. J. Chem. Eng. 2018, 26, 1736–1749. [Google Scholar] [CrossRef]
- Zhang, M.; Muñoz-Mas, R.; Martínez-Capel, F.; Qu, X.; Zhang, H.; Peng, W.; Liu, X. Determining the Macroinvertebrate Community Indicators and Relevant Environmental Predictors of the Hun-Tai River Basin (Northeast China): A Study Based on Community Patterning. Sci. Total Environ. 2018, 634, 749–759. [Google Scholar] [CrossRef] [PubMed]
- Alhoniemi, E.; Himber, J.; Parhankangas, J.; Vesanto, J. SOM Toolbox: Create and Initialize a Topology Struct, SOM Toolbox Online Documentation. 2005. Available online: http://www.cis.hut.fi/somtoolbox/package/docs2/som_topol_struct.html (accessed on 17 April 2021).
- Verbinnen, B.; Billen, P.; Van Coninckxloo, M.; Vandecasteele, C. Heating Temperature Dependence of Cr(III) Oxidation in the Presence of Alkali and Alkaline Earth Salts and Subsequent Cr(VI) Leaching Behavior. Environ. Sci. Technol. 2013, 47, 5858–5863. [Google Scholar] [CrossRef] [PubMed]
- Coz, A.; Ruiz-Labrador, B.; Alonso-Santurde, R.; Coronado, M.; Andres, A. Leaching Behaviour Methodology as a Tool for Stabilised/Solidified Metallic Waste Characterisation. In Proceedings of the WASCON 2012 Conference Proceedings, Göteborg, Sweden, 30 May–1 June 2012. [Google Scholar]
- Singh, I.B.; Chaturvedi, K.; Morchhale, R.K.; Yegneswaran, A.H. Thermal Treatment of Toxic Metals of Industrial Hazardous Wastes with Fly Ash and Clay. J. Hazard. Mater. 2007, 141, 215–222. [Google Scholar] [CrossRef]
- Cornelis, G.; Johnson, C.A.; Gerven, T. Van Vandecasteele, C. Leaching Mechanisms of Oxyanionic Metalloid and Metal Species in Alkaline Solid Wastes: A Review. Appl. Geochem. 2008, 23, 955–976. [Google Scholar] [CrossRef]
- Sun, W.; Selim, H.M. Kinetic Modeling of PH-Dependent Molybdenum(VI) Adsorption and Desorption on Iron Oxide-Coated Sand. Soil Sci. Soc. Am. J. 2019, 83, 357–365. [Google Scholar] [CrossRef] [Green Version]

Publisher’s Note: MDPI stays neutral with regard to jurisdictional claims in published maps and institutional affiliations. |
© 2021 by the authors. Licensee MDPI, Basel, Switzerland. This article is an open access article distributed under the terms and conditions of the Creative Commons Attribution (CC BY) license (https://creativecommons.org/licenses/by/4.0/).