Article

The Quality and Composition of Fatty Acids in Adipose Tissue-Derived from Wild Animals; A Pilot Study

by
Jadwiga Hamulka
1,*,
Joanna Bryś
2,*,
Agata Górska
2,
Monika Janaszek-Mańkowska
3 and
Magdalena Górnicka
1
1
Department of Human Nutrition, Institute of Human Nutrition Sciences, Warsaw University of Life Sciences, Nowoursynowska St. 159c, 02-787 Warsaw, Poland
2
Department of Chemistry, Institute of Food Sciences, Warsaw University of Life Sciences, Nowoursynowska St. 159c, 02-787 Warsaw, Poland
3
Department of Fundamentals of Engineering and Energy, Institute of Mechanical Engineering, Warsaw University of Life Sciences, Nowoursynowska 164 St., 02-776 Warsaw, Poland
*
Authors to whom correspondence should be addressed.
Appl. Sci. 2021, 11(21), 10029; https://doi.org/10.3390/app112110029
Submission received: 2 September 2021 / Revised: 20 October 2021 / Accepted: 21 October 2021 / Published: 26 October 2021

Abstract

:
The aim of this work was to study the quality (oxidative stability), fatty acids (FAs) profile and their distribution in triacylglycerol (TAG) molecules of hunted game wild fat (HGWF) obtained from wild boar, badger, and wild goose. Health lipid indices were calculated. The determination of FAs composition was carried out by gas chromatographic analysis of fatty acid methyl esters (FAME). Enzymatic hydrolysis and thin layer chromatography were used to determine the positional distribution of FAs in the internal and external positions of triacylglycerols (the regiospecific structure of triacylglycerols) of the obtained HGWF. A pressure differential scanning calorimeter (PDSC) was used to determine the oxidative stability of tested HGWF. The lipid fraction isolated from subcutaneous adipose tissues was dominated by MUFA, on average 46–50% of total FAs, and by SFA, on average 32–36% of total FAs. Palmitic acid was located mainly in the internal position of TAGs of the analyzed HGWF, whereas external positions were occupied by unsaturated oleic acid. Such a structure is responsible for normal fat absorption from food and it prevents the formation of insoluble calcium salts. Considering FAs profile, quality and the oxidation stability among all tested fat samples, the boar fat seems to be the most favorable.

1. Introduction

Although the high nutritional value of game meat and its positive impact on human health and body functioning have been documented [1,2,3,4], a limited number of studies considering the unique features of wild animal fat are available in the literature. It is well known that the fatty acids (FAs) composition of muscle and adipose tissue mainly originates in the diet [1,5] which is not controlled in wild animals and depends on seasonal, interannual and regional discrepancies [4,6]. In addition, world literature provides scant information on characteristics of fats obtained from wild boar, badger, beaver, as well as wild birds [7], whereas the demand for badger fat is great, at least in Poland. Badger fat has been widely used as a salve for rheumatism by folk medicine practitioners, which may have some scientific basis since it contains corticosteroids [8,9]. The most important parameters for evaluating the nutritional value and healthiness of fats are the ratio of polyunsaturated fatty acids (PUFA) to saturated fatty acids (SFA) and PUFA n-6/n-3 ratio, as well as hypocholesterolemic and hypercholesterolemic FAs contents [10,11,12]. Among SFA, the palmitic (C 16:0) and stearic (C 18:0) acids occur naturally in all animal fat [13]. Despite previous reports that C18:0 acid (stearic acid) has a thrombogenic effect, the current results do not confirm that it is more thrombogenic compared to oleic and linoleic acids [12]. For preventing cardiovascular diseases (CVD), it is advantageous to consume a food including monounsaturated fatty acids (MUFA), as the oleic (C 18:1 n-9) and palmitoleic (C 16:1 n-7), which have proven favorable influences on the blood lipid profile [14]. Similarly, PUFAs of n-3 and n-6 series are beneficial for human health. PUFA n-6 and n-3 differ in their antithrombogenicity activity, which is most pronounced in the n-3 series, particularly eicosapentaenoic acid (EPA) and decosahexaenoic acid (DHA) [15,16]. The ratio of PUFA n-6/n-3 is particularly beneficial in meats from animals that have consumed grass, which contain high levels of α-linolenic acid (α C 18:3 n-3). In animals, α C 18:3 n-3 is converted to a series of longer chain PUFA of which the most important are C 20:5 n-3 (EPA) and C 22:6 n-3 (DHA) acids.
Lipid oxidation is a very important process occurring in fats. It determines the final quality and nutritional properties of the food products because it is the main reaction responsible for their degradation [17,18]. Pressure differential scanning calorimetry (PDSC) is becoming widely used in the study of food. This method is convenient, repeatable and fast. In addition, it is a non-chemical method that does not require time-consuming processing of tested samples and a small amount of sample is sufficient for analysis. The analysis of fat using this method allows the determination of its oxidative stability [19,20,21,22].
Wild animals are free-range, fed mainly with natural food (i.e., pasture) hence both their meat and fat are free from hormones, antibiotics, heavy metals, residues, and other products. Moreover, wild game species meet animal welfare ethical standards, and the rearing of the animals in the wild has a lower or almost null impact on the ecosystems when compared to farmed species [4,6]. However, it should be noted that due to the presence of environmental pollutants in the food chain of wild animals and the presence of parasites and infectious diseases, products obtained from these animals should be tested.
Wild animals food varies depending on the territory and season (accumulating fats for the winter) [4,6], and therefore the quality and nutritional value of fat may vary according to the species of animal. The aim of this work was to study the quality (oxidative stability), FAs profile and their distribution in triacylglycerol (TAG) molecules of fat obtained from the adipose tissue of wild boar, badger and wild goose. Additionally, health lipid indices such as PUFA/SFA and PUFA n-6/n-3 ratios, peroxidizability index (PI), as well as atherogenic (AI), thrombogenic (TI), and hypocholesterolemic/hypercholesterolemic (h/H) indices were calculated which could serve as predictors of cardiovascular risks.

2. Materials and Methods

2.1. Animals and Sampling

Fat samples for analysis were obtained from subcutaneous adipose tissue of boar, badger, and wild goose carcasses. Wild animals were obtained in accordance with national laws on game by hunters [23,24] and transferred for research free of charge. The animals were not sacrificed for the experiment but for human consumption. The animals had been hunted and shot at hunting districts in central Poland in the autumn–winter season 2019–2020. Immediately after the shooting, a sanitary inspection was performed on each animal by a veterinary inspector [23]. The veterinary inspector determined the age, sex and condition of the animals. Adults, males, and animals in good condition were selected for our research. Due to the limited possibilities of hunting badgers, we could only use four animals, so we also decided to use the material of four wild boars and four wild geese (all adults, males and in good condition).
The samples for chemical analysis were collected immediately after the shooting and gutting. The fat samples were extracted from deposit adipose tissues and subcutaneous tissue. The samples were stored frozen at temperature −20 °C until analysis in tightly closed packages.
To compare the fatty acid profile samples of carnivores (badgers), birds (wild goose), and pigs (wild boar) were analyzed. Each species was represented by four adult individuals of good/average body condition.
Extraction of lipids for FA analysis was performed with chloroform/methanol (2:1 v/v) as described by Folch et al. [25]. The extraction mixture contained 0.001% (w/v) of butylated hydroxytoluene as an antioxidant. The organic solvent was evaporated under a stream of nitrogen. The fats obtained were then analyzed for FA composition. The analyzes were performed in triplicate.

2.2. Chemical Analysis

2.2.1. Determination of Fatty Acid (FA) Composition

The determination of FA composition was carried out by gas chromatographic analysis of FAME. In order to generate volatile derivatives of FAs, the studied samples of fats were applied to esterification with methanol, in compliance with the PN-EN ISO 5509:2001 [26] standard, resulting in FAME. A YL6100 GC chromatograph equipped with a flame ionization detector (FID) and BPX70 capillary column of 0.25 mm i.d. × 60 m length and 0.25 μm film thickness was used. The FAME separation conditions were as follows: initial temperature of 60 °C was maintained for 5 min, the increment of temperature raise was 10 °C/min within the range from 60 °C to 180 °C, then the increment of temperature raise was 3 °C/min within the range from 180 °C to 230 °C, the end temperature of 230 °C was maintained for 15 min, and the temperatures of the detector and injector were 250 °C and 225 °C, respectively. Nitrogen was used as the carrier gas. FAs were identified based on retention time values compared with standard.

2.2.2. Determination of Distribution of FAs in Triacylglycerol (TAG)

The distribution of FAs in fats was determined with regards to their positions—internal or external of triacylglycerols. Positional distribution of FAs in sn-2 and sn-1,3 positions of TAGs was based on the ability of the pancreatic lipase to selectively hydrolyze ester bonds in sn-1,3 positions. Briefly, 20 mg of purified pancreatic lipase (porcine pancreatic lipase, crude type II), 1ml of Tris buffer (pH 8.0), 0.25 mL of bile salts (0.05%), and 0.1 mL of calcium chloride (2.2%) were added to 50 mL centrifuge tubes and vortexed with 0.1 g of fat sample. The mixture was incubated at 40 °C in a water bath for 5 min. Resulting products were extracted with diethyl ether (1 mL of 6 mol/l HCl and 1 mL of diethyl ether were added and the mixture was centrifuged). Diethyl ether layer was collected to test tubes and evaporated under nitrogen gas. Following that, the products of enzymatic deacylation of TAG, dissolved in ether, were separated with the use of preparative thin-layer chromatography. A 200 ul aliquot was loaded onto a silica gel TLC plate with fluorescent indicator at 254 nm and developed with hexane:diethyl ether:acetic acid (50:50:1, v:v:v). The 2-monoacylglycerol (2-MAG) band was visualized under UV light. Isolated sn-2 monoacylglycerols together with gel were taken from chromatoplates, followed by their elution with diethyl ether. Ether layer was collected and entirely evaporated under nitrogen, and then the sample was dissolved in n-hexane. Using the GC method, the composition of FAs, based on the generated sn-2 monoacylglycerols, was determined.

2.2.3. Determination of the Oxidative Induction Time

Differential scanning calorimetry (DSC) was used in order to define an oxidative stability of fats. A differential scanning calorimeter (DSC Q20 TA) coupled with a high-pressure cell was used. Fat samples (3–4 mg) were placed in small aluminium pans, in the oxygen atmosphere and under the pressure of 1.400 kPa. Measurements were performed at constant temperature of 100 °C, 110 °C, 120 °C, 130 °C and 140 °C. Obtained diagrams were analyzed using TA Universal Analysis 2000 software. For each sample, the output was automatically recalculated and presented as the amount of energy per 1 g. Oxidation induction time was determined from PDSC curves based on the maximum rate of heat flow.

2.3. Assessment of Nutritional and Healthy Quality of Fat

The fatty acid profile was used to determine several nutritional parameters of the adipose tissue-derived from wild animal. Healthy Lipid Indices were calculated according to the following equations [27,28,29,30]:
AI (Atherogenic Index) = (C 12:0 + 4 × C 14:0 + C 16:0)/Σ UFA.
TI (Thrombogenic Index) = (C 14:0 + C16:0 + C18:0)/[(0.5 × MUFA) + (0.5 × Σ n-6) + (3 × Σ n-3) + (Σ n-3/Σ n-6)].
h/H (hypocholesterolemic/Hypercholesterolemic index) = [(C 18:1 n-9 + C 18:1 n-7 + C 18:2 n-6 + C 18:3 n-6 + C 18:3 n-3 + C 20:3 n-6 + C 20:4 n-6 + C 20:5 n-3 + C 22:4 n-6 + C 22:5 n-3 + C 22:6 n-3)/(C 14:0 + C 16:0)].
PI (Peroxidizability Index) was calculated as: (monoenoic acid × 0.025) + (dienoic acid × 1) + (trienoic acid × 2) + (tetraenoic acid × 4) + (pentaenoic acid × 6) + (hexaenoic acid × 8).
In addition, the relative proportions of total saturated FAs and unsaturated n-6 and n-3 FAs were calculated.

2.4. Statistical Analysis

The statistical analysis was performed using the Statistica, version 13.3 software. Since data collected did not meet the assumptions for classical one-way ANOVA, a nonparametric Kruskal–Wallis H test was used instead. Differences were considered to be significant at a p-value ≤ 0.05, according to the Kruskal–Wallis multiple test. Data in tables are presented as mean ± standard deviation.

3. Results

3.1. Fatty Acid Composition

The results of the determination of FA composition of the analyzed fats are presented in Table 1. As indicated, MUFA prevailed in all the examined fats. Their content ranged from 46.05% to 49.93%. The predominant MUFA in boar fat were oleic acid (37.98%) and palmitoleic acid (10.20%). Goose fat and badger fat contained less palmitoleic acid (2.27% and 2.69%, respectively) and more oleic acid (42.54% and 43.98%, respectively) than boar fat. The analyzed fats were also a rich source of SFA. The HGWF contained from 31.75% to 36.05% of the SFA. The predominant SFA in all analyzed fats were palmitic acid and stearic acid. Goose fat and badger fat contain more palmitic acid (21.03% and 21.49% respectively) and stearic acid (12.19% and 12.48% respectively) than boar fat (19.23% of palmitic acid and 6.95% of stearic acid). The analyzed fats contained also PUFA. In the case of goose fat the highest amount of PUFA (about 17.65%) was observed, while badger fat contained the lowest amount (about 15.16%). In the group of PUFAs linoleic acid (11.80% to 14.76%) and α-linolenic acid (1.17% to 2.03%) were the dominant fatty acids found in the studied samples. The major long chain polyunsaturated fatty acids (LCPUFA) from the n-6 family found in analyzed samples of fats were dihomo-γ-linolenic acid (about 0.19–0.47%) and arachidonic acid (about 0–0.28%).

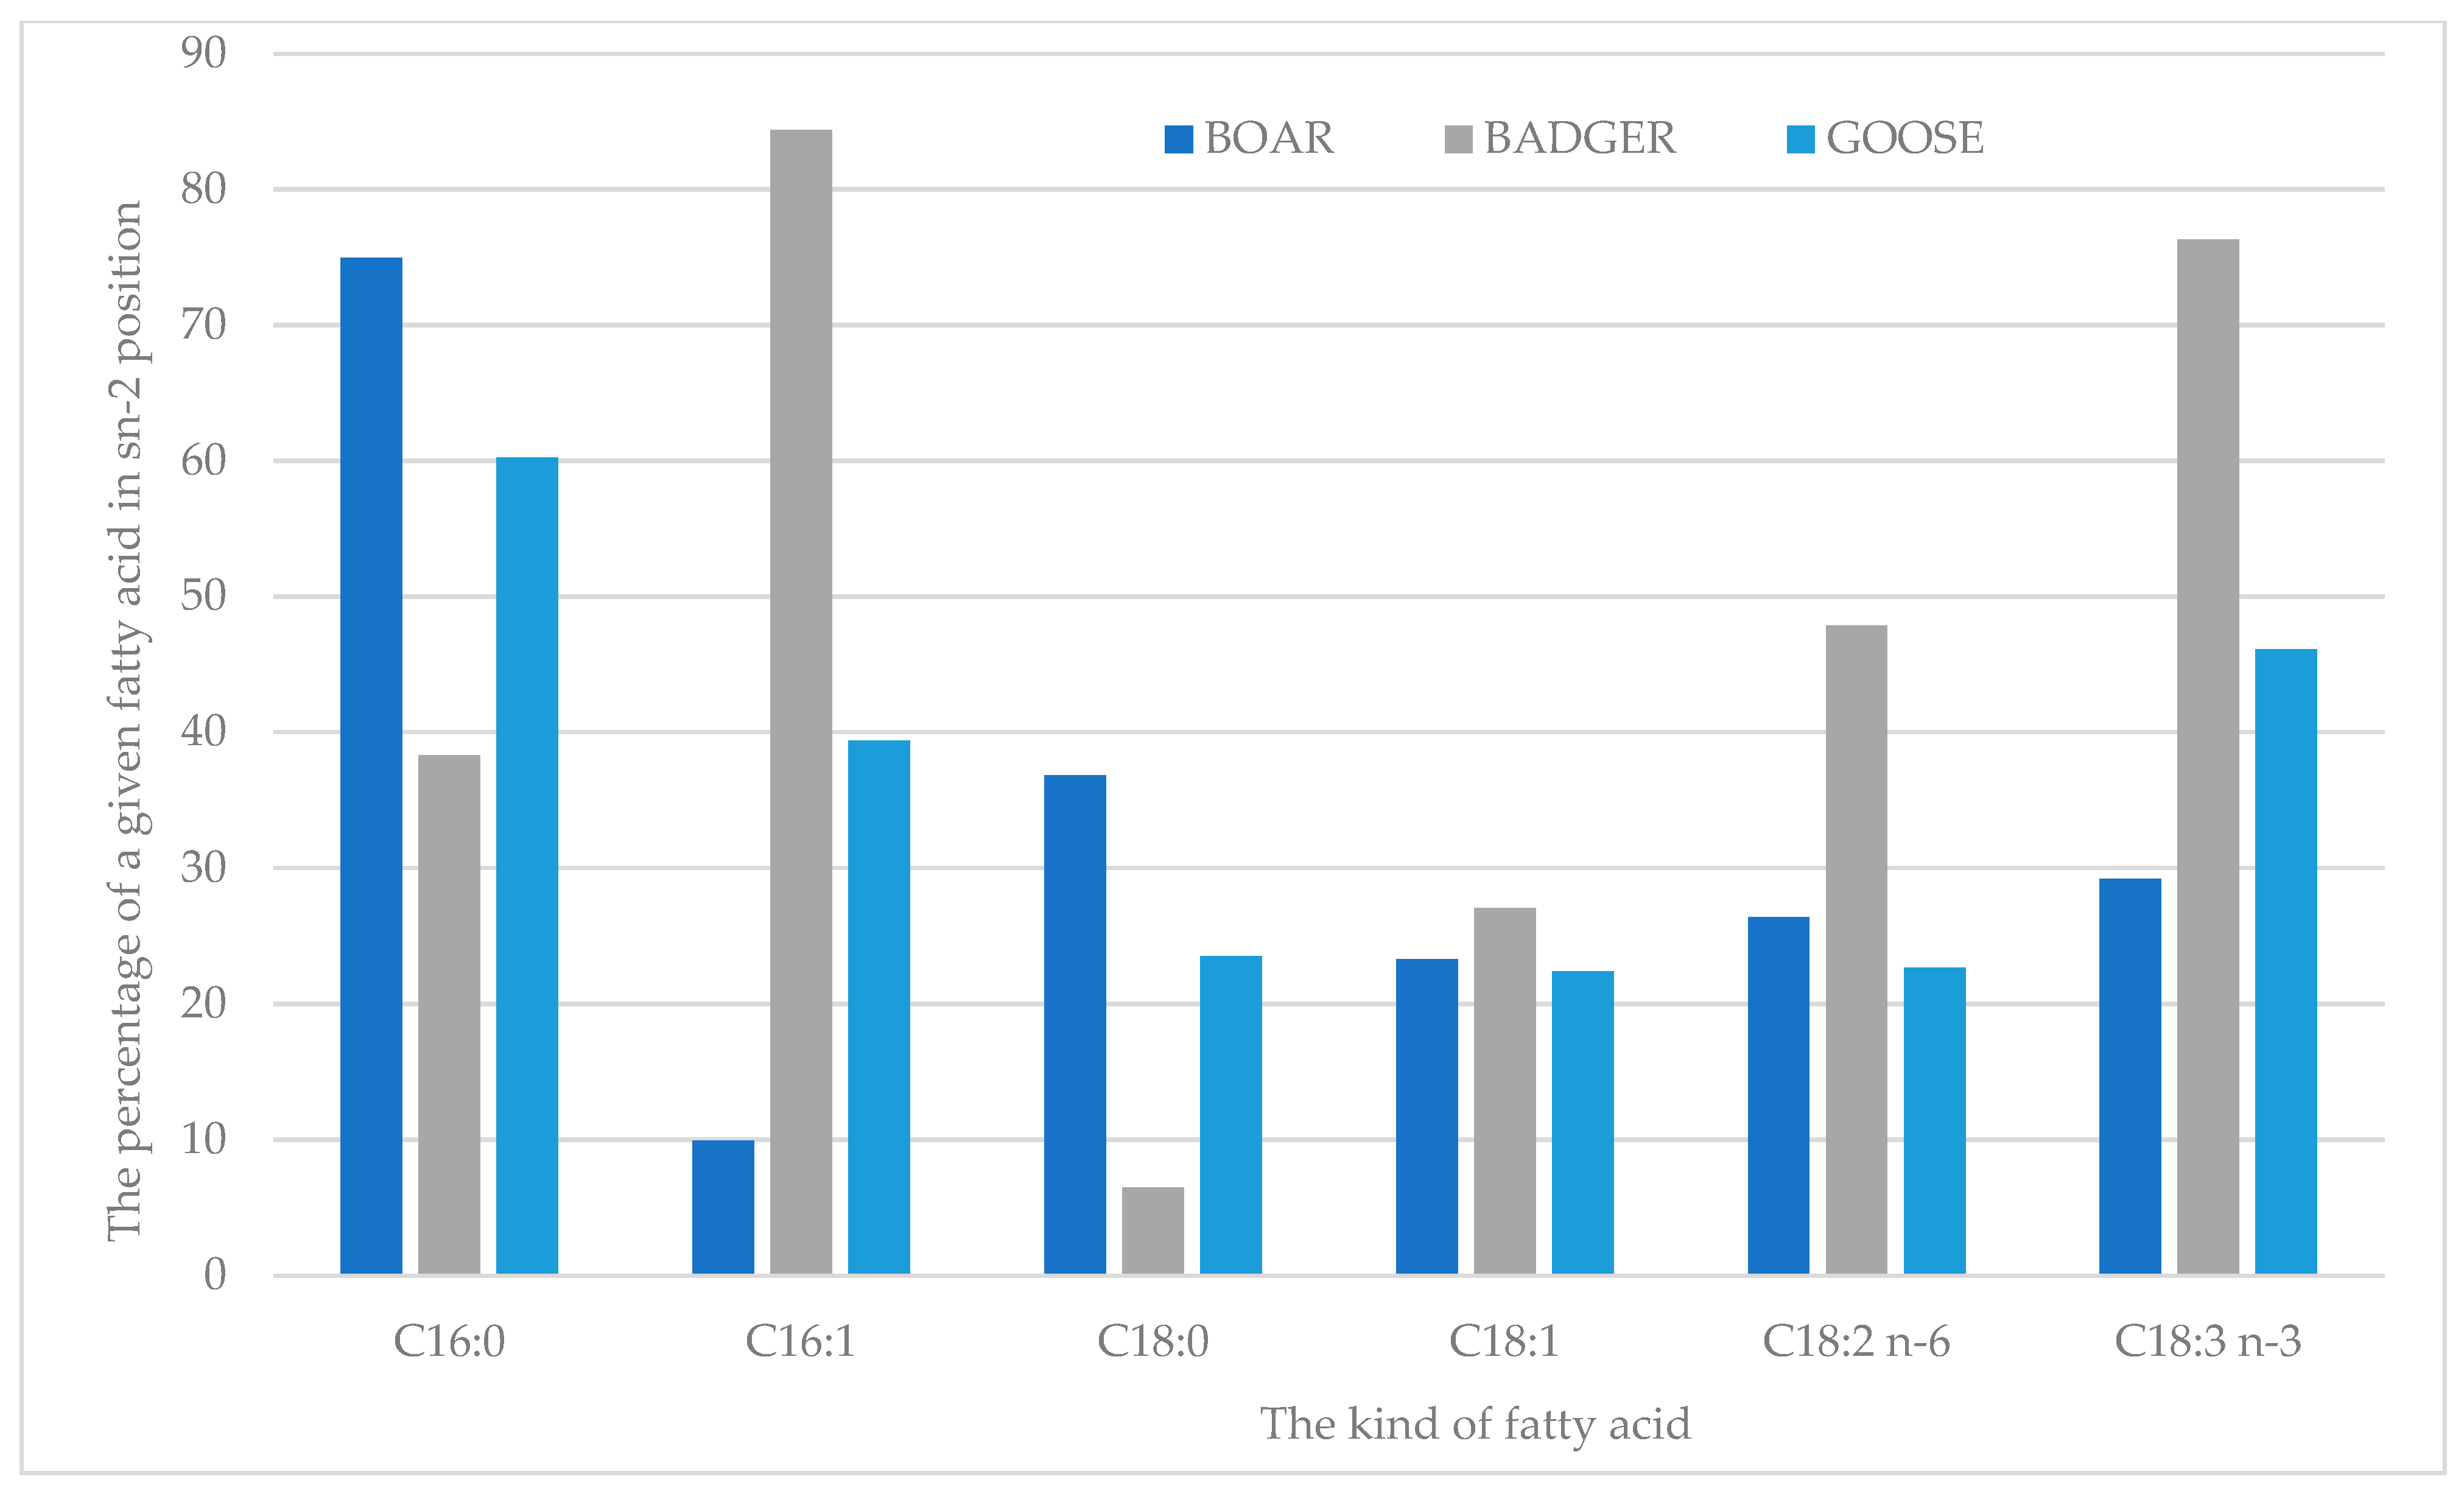
3.2. Fatty Acids Distribution in TAG

Results regarding FA composition in the internal and external positions of TAGs of the adipose tissue of boar, badger and wild goose are presented in Table 2. The percentage of selected FAs esterified at internal position of TAGs of fats are presented in Figure 1. Considering the composition of the FAs in sn-2 positions of TAGs it can be concluded that in boar and goose fats palmitic acid prevailed. Its content in the internal position of TAGs ranged from 43.24% for boar fat to 38.85% for goose fat. Badger fat contained less palmitic acid in sn-2 position of TAGs (24.17%) and more oleic and linoleic acids (34.50% and 21.19%, respectively) than boar and goose fat. Palmitic acid was located at sn-2 position in 74.97% TAGs from boar fat, in 60.25% TAGs from goose fat and in 38.31% TAGs from badger fat. Oleic acid at sn-2 position was detected in 23.30% of TAGs extracted from boar fat, in 27.40% of TAGs extracted from badger fat, and in 22.40% of TAGs extracted from goose fat. This means that oleic acid was mainly located in the external positions of these fats, as linoleic acid in the fat of the boar and goose in sn-2 position of TAGs (26.37% and 22.65% respectively). Stearic acid was mainly located in the external positions of TAGs in badger and goose fat, while in the case of wild boar fat it was mainly in the middle position of TAGs. On the other hand, linolenic acid was located mainly in the sn-2 position of TAGs of badger and goose fat, while in the case of wild boar fat it was mainly in the sn-1,3 positions of the TAGs.

3.3. Oxidative Stability

The results of PDSC measurements are shown in Table 3. The PDSC tests for boar, badger and wild goose fats were performed at constant temperature of 100 °C, 110 °C, 120 °C, 130 °C and 140 °C. Generally, samples with higher induction times are more stable than those for which the induction time obtained at the same temperature is lower. Analyzing the results obtained, it can be concluded that boar fat was the most oxidatively stable, as it was characterized by the longest induction time at all temperatures (~118 min at 100 °C, ~55 min at 110 °C, ~26 min at 120 °C, ~12 min at 130 °C and ~6 min at 140 °C). Badger fat was slightly less stable. The determined induction times for badger fat ranged from ~4 min. at the temperature of 140 °C to ~99 min at the temperature of 100 °C. The least oxidatively stable of the analysed fats was goose fat, because its induction time was the shortest at each temperature (~57 min in 100 °C, ~30 min in 110 °C, ~16 min in 120 °C, ~8 min in 130 °C and ~4 min in 140 °C).

3.4. Mutritional and Healthy Quality of Fat

Table 4 shows values of healthy lipids indices for tested samples. Taking into account the ratio of PUFA to SFA, it can be concluded that boar and badger fats are more beneficial compared to that of goose. The ratio of n-6 to n-3 is the nearest to the recommended values in wild boar fat. AI for all samples is in accordance with the recommended value, but TI are over the recommendation. The h/H values indicate a higher proportion of hypocholesterolemic fatty acids. The PI value was the lowest in badger adipose tissue.

4. Discussion

In the present study, the lipid FAs profile and nutritional as well as healthy characteristics of the adipose tissue derived from boar, badger and wild goose were evaluated. Due to the fact that the existing literature focuses primarily on game meat lipid FAs, our findings broaden this area concerning the amount of FAs and their distribution in the TAG molecules, the oxidative stability of HGWF and their health implication. The lipids isolated from subcutaneous adipose tissues were dominated by MUFA, on average 46–50% of total FAs, and by SFA, on average 32–36% of total FAs. PUFA had the lowest content, on average 15–18% of total FAs. Boar, badger and wild goose adipose tissue contained 50%, 32% and 16% vs. 48%, 36% and 15% vs. 46%, 35% and 18% of MUFA, SFA and PUFA, respectively.
The differences in the proportions of particular FA groups could be possibly attributed to the diet. The wild boar is an omnivore and eats a wide range of food items. In the autumn and winter seasons, despite the availability of attractive natural foods (acorns, beechnuts), this animal prefers farmland food as sugar beets and grain [32]. The diet is dominated by plant food, but also invertebrates and small rodents are present. Similarly badgers consume invertebrates (earthworms, mollusks, insects, beetle, and wasp larvae), small mammals (mice, rabbits, rats, voles, shrews, moles, hedgehogs), ground-nesting birds and eggs, small reptiles, frogs, plant matter (acorns, nuts, berries, fruits, seeds, cereal grains, tubers, roots, bulbs) and some mushrooms [9]. It should be mentioned that due to the fact that rodents are known to play a key role in the life cycle of Trichinella spp., and earthworms are intermediate hosts of nematodes that infect the lungs of wild boar, fat and meat must be microbiologically tested before use [33,34]. Wild geese are only fed with plants: seaweed, grass, grains, peas, tartare, and winter crops. Geese obtain food both in the fields and on the banks of the water or in clumps of trees.
Regarding the FA composition of subcutaneous adipose tissue of boar, badger, and wild goose, among SFA, palmitic (C16:0), and stearic (C18:0) acids were found to be dominant in fat samples. However, a higher content of stearic acids was observed in badger and wild goose. Razmaite et al. [35] also showed in the intramuscular and subcutaneous fat samples from wild boar that C16:0 and C18:0 were present in the highest amount among SFA. The C14:0 and C16:0 FAs are well known to have an atherogenic effect [36]. The C18:0 seems to be biologically neutral [37], especially with respect to atherogenicity, but it can show thrombogenic activity [12]. Additionally, previous results indicate an association between palmitic acid (but not stearic acid) and increased mortality, especially cardiovascular disease mortality [38].
It was observed that among MUFA, the oleic acid (C18:1) reached the highest content, reaching 38–44% of total FA. Similar results were reported by other authors [9,35,39,40] which underlined that in subcutaneous adipose tissues of wild animals adapted to low environmental temperatures, C18:1 is a dominant FA. The C18:1n-9 cis increases the activity of low-density lipoprotein receptors and decreases serum cholesterol concentration, so is associated with positive health effects [37].
Among PUFA, the linoleic acid (C18:2 n-6) reached the highest content, averaging 12–15% of total FA. A significantly higher C18:2 n-6 amount was observed in wild goose fat in comparison to boar and badger fat. Between intake of C18:2 n-6 and cardiovascular diseases inverse correlation has already been shown [38,41]. However it is known that the linoleic acid is converted to dihomo-γ-linoleic and arachidonic acids. These acids are precursors of prostaglandins and leukotrienes, which are involved in inflammation. On the other hand, anti-inflammatory lipoxins can also be synthesized from arachidonic acid [38]. In spite of the numerous studies of linoleic acid metabolism, current data are insufficient to allow unequivocally determine its effects on the development of atherosclerosis [42].
In subcutaneous and abdominal fat, C18:1 n-9, C16:0, and C18:2 n-6 were the predominant MUFA, SFA, and PUFA, respectively. These FAs accounted from 70% (for boar) to 80% (for badger and wild goose) of the total FAs. Similar results were observed in previous studies on domestic geese [31,43,44], or wild boar [35].
In addition to determination of FAs profile of the fat from adipose tissue-derived from wild animals their distribution in the TAG molecules has also been identified. TAGs are the main ingredient in most dietary fats and oils. The identification and quantification of the TAG composition is the first step to assess the quality of fats when considering their nutritional effects, therefore the distribution of FAs in TAGs between the external (sn-1 and sn-3) and internal (sn-2) positions was additionally determined [45]. The distribution of FAs in TAG molecules is important especially in the process of their digestion and absorption in the gastrointestinal tract. The FAs at the external positions of TAG are preferentially hydrolyzed to leave 2-monoacylglycerol. The rate of hydrolysis in the internal TAG position is very slow, and the FAs in this position remain intact as 2-monoacylglycerols during digestion and absorption [46]. The type of FA and its location in the TAG molecule affect the physical properties of a given fat and the way it is digested and absorbed [47]. The structure of TAG is responsible for the proper absorption of fat and micronutrients such as calcium and magnesium from food. Palmitic acid in the form of 2-monoacylglycerol is better absorbed than free palmitic acid, because free palmitic acid can bind calcium and magnesium ions, e.g., with the formation of insoluble soaps that are excreted in the feces [22,48,49]. Distribution of selected FAs in TAG was analyzed, and it can be noted that in all HGWFs, palmitic acid occupies the internal position of TAGs. The palmitic acid in sn-2 position of TAG will be efficiently absorbed in the digestive tract because it will not cleave off and will not react with free calcium ions, therefore it will not cause both calcium and FA losses in the feces. Oleic acid was occupied mainly in external positions of TAGs in all analyzed HGWF, therefore it will also subsequently be easily absorbed, because it does not form insoluble calcium soap.
To assess the potential nutritional and healthy value of tested fats, among 10 commonly used indices [50], PUFA/SFA ratio, n-6/n-3 ratio and AI, TI, PI and the h/H ratio were calculated. The recommendation for the PUFA/SFA ratio is >0.40, and for the n-6/n-3 ratio it is <4.0 [51]. The tested fat samples were characterized by the beneficial PUFA/SFA ratio, but did not meet the criterion for n-6/n-3 ratio. In the diet the n-6/n-3 ratio lower than 4.0 proves the proper composition of fatty acids in the context of reducing the risk of cardiovascular diseases [12,28]. Based on the obtained results, it can be stated that boar fat was the nearest to this recommendation.
A healthy animal product can be characterized by low atherogenic index (AI) and thrombogenic index (TI) and high hypocholesterolemic/hypercholesterolemic (h/H) index. The AI and TI values for tested fat samples were <1, as recommended, and the h/H ratio was at a favorable value of >2.5 for badger and goose fat. The consumption of products with a lower AI is associated with reduction of human plasma total cholesterol and low-density cholesterol (LDL) [52]. In turn, the consumption of product with a lower TI and higher h/H ratio can be beneficial in the prevention of cardiovascular heart diseases [50].
Comparing values of the peroxidizability index (PI), which is used to assess the stability of PUFA and susceptibility to oxidation [31], the lower value was found for badger fat. This indicates a lower potential for the peroxidation of this fat and it is associated with lower PUFA content. In the present study, results obtained allow us to state that the wild goose fat was characterized by the lowest stability (the highest PUFA content). The total PI for a particular lipid can reach from 2 for coconut oil, 5 for tallow (low potential for peroxidation) or over 10 for palm oil, olive or lard to higher than 100 for flaxseed oil or algae oil (high potential for peroxidation) [53]. Taking into account the PI values, the fats from the tested samples were characterized by average stability. However the results of PDSC measurements allowed us to conclude that boar fat was the most oxidatively stable, and goose fat was the least oxidatively stable of the analyzed fats.
Comparing FA profiles and nutritional and healthy quality of tested samples with other sources of animal fat such as lard or tallow [53], it should be emphasized that the fat of wild animals, despite a similar FAs composition, comprises more other long chain PUFA. As a result fats from wild animals may be valuable fat source in diet.
This study had limitations. In the present study we did not analyze the effect of sex, age as well as seasonal variations on quality and fatty acids composition of studied samples. However, as reported by Razmaite et al. [35], weight or sex had no effect on the FA composition and lipid quality indexes either in the intramuscular or in the subcutaneous fat from wild boar. The same authors highlighted that significantly lower AI and TI indices and higher, more favorable h/H ratio were observed in the intramuscular fat of wild boar hunted in January compared with June [54]. Quality and FAs profile of game wild meat largely depend upon factors such as habitat conditions, including access to a different food. In addition, the quality of meat, as well as the FA profile in adipose tissue, is influenced by regional differences, living conditions—agricultural land (fields, meadows, fruit orchards), natural habitats (forests, pastures, wastelands), as well as the season of the year (in autumn greater fat deposition before in winter, both in the form of subcutaneous layers and tallow).

5. Conclusions

The findings of this study indicated that fats from boar, badger, and wild goose can be a valuable food product, however, further research, including microbiological tests are needed to deeply define their potential application in nutrition.
Based on the obtained results, it can be stated that fat from adipose tissues of boar, badger, and wild goose is a source of preferable unsaturated fatty acids, including polyunsaturated fatty acids from n-3 and n-6 series. In the diet, the n-6/n-3 ratio is of high importance and should meet certain recommendations. Among the studied samples, boar fat appeared preferable in this regard. Considering the fatty acids distribution in triacylglycerol structure, it can be concluded that palmitic acid was located mainly in the internal position of TAGs of the analyzed HGWF, whereas external positions were occupied by unsaturated oleic acid. Such a structure is responsible for beneficial fat absorption from food and it prevents the formation of insoluble calcium salts. Summarizing the results obtained, it can be stated that boar fat with the longest induction time was the most oxidatively stable. Considering profile, quality and the oxidation stability among all tested fat samples, the boar fat seems potentially to be the most favorable in food industry applications.

Author Contributions

Conceptualization, J.H., J.B. and M.G.; methodology, J.B. and A.G.; formal analysis, J.B. and M.J.-M.; data curation, J.B., M.G., J.H. and A.G.; writing—original draft preparation, M.G., J.B. and J.H.; writing—review and editing, J.H. and A.G. All authors have read and agreed to the published version of the manuscript.

Funding

The study was financially supported by sources of the Polish Ministry of Sciences and Higher Education within funds of the Institute of Food Sciences and the Institute of Human Nutrition Sciences, Warsaw University of Life Sciences (WULS), for scientific research.

Institutional Review Board Statement

The approval of the Ethics Committee was not required, as all samples were taken postmortem. The animals were hunted and shot by licensed hunters in accordance with the relevant guidelines and national game regulations [23,24].

Informed Consent Statement

Not applicable.

Data Availability Statement

Not applicable.

Acknowledgments

We would like to thank the hunters for samples to our study.

Conflicts of Interest

The authors declare no conflict of interest.

References

  1. Tarricone, S.; Colonna, M.A.; Cosentino, C.; Giannico, F.; Ragni, M. Meat quality and lipid fatty acid profile from wild thrush (Turdus philomelos), woodcock (Scolopax rusticola) and starling (Sturnus vulgaris): A preliminary comparative study. Lipids Health Dis. 2020, 19, 119. [Google Scholar] [CrossRef] [PubMed]
  2. Strazdina, V.; Jemeljanovs, A.; Sterna, V. Nutrition value of wild animal meat. Proc. Latv. Acad. Sci. Sect. B 2013, 67, 373–377. [Google Scholar] [CrossRef] [Green Version]
  3. Kudrnáčová, E.; Bartoň, L.; Bureš, D.; Hoffman, L.C. Carcass and meat characteristics from farm-raised and wild fallow deer (Dama dama) and red deer (Cervus elaphus): A review. Meat Sci. 2018, 141, 9–27. [Google Scholar] [CrossRef]
  4. Soriano, A.; Sánchez-García, C. Nutritional Composition of Game Meat from Wild Species Harvested in Europe; Meat and Nutrition, Chhabi Lal Ranabhat IntechOpen: London, UK, 2021. [Google Scholar] [CrossRef]
  5. Cordain, L.; Watkins, B.A.; Florant, G.L.; Kelher, M.; Rogers, L.; Li, Y. Fatty acid analysis of wild ruminant tissues: Evolutionary implications for reducing diet-related chronic disease. Eur. J. Clin. Nutr. 2002, 56, 181–191. [Google Scholar] [CrossRef] [PubMed] [Green Version]
  6. Schley, L.; Roper, T.J. Diet of wild boar Sus scrofa in Western Europe, with particular reference to consumption of agricultural crops. Mammal Rev. 2003, 33, 43–56. [Google Scholar] [CrossRef] [Green Version]
  7. Käkel, Ä.R.; Hy Värinen, H. Site-specific fatty acids composition in adipose tissue of several northern aquatic and terrestrial mammals. Comp. Biochem. Physiol. 1996, 115, 501–514. [Google Scholar] [CrossRef]
  8. Hancox, M. Badger research and human medicine. Lancet 1992, 339, 371–372. [Google Scholar] [CrossRef]
  9. Zalewski, K.; Martysiak-Żurowska, D.; Iwaniuk, M.; Nitkiewicz, B.; Stołyhwo, A. Characterization of fatty acid composition in Eurasian badger (Meles meles). Pol. J. Environ. Stud. 2007, 16, 645–650. [Google Scholar]
  10. Yang, X.; Zhang, B.; Guo, Y.; Jiao, P.; Long, F. Effects of dietary lipids and clostridium butyricum on fat deposition and meat quality of broiler chicken. Poult. Sci. 2010, 89, 254–260. [Google Scholar] [CrossRef] [PubMed]
  11. Mapiye, C.; Chimonyo, M.; Dzama, K.; Hugo, A.; Strydom, P.E.; Muchenje, V. Fatty acid composition of beef from Nguni Steers supplemented with Acacia karroo leaf-meal. J. Food Compos. Anal. 2011, 24, 523–528. [Google Scholar] [CrossRef]
  12. Thijssen, M.A.; Hornstra, G.; Mensink, R.P. Stearic, oleic, and linoleic acids have comparable effects on markers of thrombotic tendency in healthy human subjects. J. Nutr. 2005, 135, 2805–2811. [Google Scholar] [CrossRef] [Green Version]
  13. Karapanagiotidis, I.T.; Yakupitiyage, A.; Little, D.; Bell, M.V.; Mente, E. The nutritional value of lipids in various tropical aquatic animals from rice-fish farming systems in northeast Thailand. J. Food Compos. Anal. 2010, 23, 1–8. [Google Scholar] [CrossRef]
  14. Kien, C.L.; Bunn, J.Y.; Stevens, R.; Bain, J.; Ikayeva, O.; Crain, K.; Koves, T.R.; Muoio, D.M. Dietary intake of palmitate and oleate has broad impact on systemic and tissue lipid profiles in humans. Am. J. Clin. Nutr. 2014, 99, 436–445. [Google Scholar] [CrossRef] [PubMed] [Green Version]
  15. Simopoulos, A.P. The importance of the omega-6/omega-3 fatty acids ratio in cardiovascular disease and other chronic diseases. Exp. Biol. Med. 2008, 233, 674–688. [Google Scholar] [CrossRef] [PubMed]
  16. Djuricic, I.; Calder, P.C. Beneficial outcomes of omega-6 and omega-3 polyunsaturated fatty acids on human health: An update for 2021. Nutrients 2021, 13, 2421. [Google Scholar] [CrossRef] [PubMed]
  17. Saldaña, M.D.A.; Martínez-Monteagudo, S.I. Oxidative stability of fats and oils measured by differential scanning calorimetry for food and industrial applications. In Applications of Calorimetry in a Wide Context—Differential Scanning Calorimetry, Isothermal Titration Calorimetry and Microcalorimetry; Elkordy, A.A., Ed.; IntechOpen: London, UK, 2013. [Google Scholar]
  18. Wąsowicz, E.; Gramza, A.; Hęś, M.; Jeleń, H.H.; Korczak, J.; Małecka, M.; Mildner-Szkudlarz, S.; Rudzińska, M.; Samotyja, U.; Zawirska-Wojtasiak, R. Oxidation of lipids in food. Polish J. Food Nutr. Sci. 2004, 13, 87–100. [Google Scholar]
  19. Ostrowska-Ligęza, E.; Bekas, W.; Kowalska, D.; Łobacz, M.; Wroniak, M.; Kowalski, B. Kinetics of commercial olive oil oxidation: Dynamic differential scanning calorimetry and Rancimat studies. Eur. J. Lipid Sci. Technol. 2010, 112, 268–274. [Google Scholar] [CrossRef]
  20. Bryś, J.; Wirkowska, M.; Górska, A.; Ostrowska-Ligęza, E.; Bryś, A. Application of the calorimetric and spectroscopic methods in analytical evaluation of the human milk fat substitutes. J. Therm. Anal. Calorim. 2014, 118, 841–848. [Google Scholar] [CrossRef] [Green Version]
  21. Ciemniewska-Żytkiewicz, H.; Ratusz, K.; Bryś, J.; Reder, M.; Koczoń, P. Determination of the oxidative stability of hazelnut oils by PDSC and rancimat methods. J. Therm. Anal. Calorim. 2014, 118, 875–881. [Google Scholar] [CrossRef] [Green Version]
  22. Bryś, J.; Górska, A.; Ostrowska-Ligęza, E.; Wirkowska-Wojdyła, M.; Bryś, A.; Brzezińska, R.; Dolatowska-Żebrowska, K.; Ziarno, M.; Obranović, M.; Škevin, D. Study of the properties of human milk fat substitutes using DSC and GC methods. Appl. Sci. 2021, 11, 319. [Google Scholar] [CrossRef]
  23. Official Journal of the Republic of Poland, Dz.U. 2019 poz. 1782. 10 September 2019. Available online: http://isap.sejm.gov.pl/isap.nsf/DocDetails.xsp?id=WDU20190001782 (accessed on 2 September 2021).
  24. Official Journal of the Republic of Poland, Dz.U. 2014 poz. 1900. 17 December 2014. Available online: http://isap.sejm.gov.pl/isap.nsf/DocDetails.xsp?id=WDU20140001900 (accessed on 2 September 2021).
  25. Folch, J.; Lees, M.; Sloane Stanley, G.H. A simple method for the isolation and purification of total lipids from animal tissues. J. Biol. Chem. 1957, 226, 497–509. [Google Scholar] [CrossRef]
  26. EN ISO 5509. Animal and Vegetable Fats and Oils—Preparation of Methyl Esters of Fatty Acids (ISO 5509:2000); ISO: Geneva, Switzerland, 2000. [Google Scholar]
  27. Ulbricht, T.L.; Southgate, D.A. Coronary heart disease: Seven dietary factors. Lancet 1991, 338, 985–992. [Google Scholar] [CrossRef]
  28. Fernandes, C.E.; Vasconcelos, M.A.; Ribeiro Mde, A.; Sarubbo, L.A.; Andrade, S.A.; Filho, A.B. Nutritional and lipid profiles in marine fish species from Brazil. Food Chem. 2014, 160, 67–71. [Google Scholar] [CrossRef] [PubMed]
  29. Erickson, M.C. Variation of lipid and tocopherol composition in three strains of channel catfish (Ictalurus punctatus). J. Sci. Food Agric. 1992, 59, 529–536. [Google Scholar] [CrossRef]
  30. Du, C.; Sato, A.; Watanabe, S.; Wu, C.Z.; Ikemoto, A.; Ando, K.; Kikugawa, K.; Fujii, Y.; Okuyama, H. Cholesterol synthesis in mice is suppressed but lipofuscin formation is not affected by long-term feeding of n-3 fatty acid-enriched oils compared with lard and n-6 fatty acid-enriched oils. Biol. Pharm. Bull. 2003, 26, 766–770. [Google Scholar] [CrossRef] [PubMed] [Green Version]
  31. Wołoszyn, J.; Haraf, G.; Okruszek, A.; Wereńska, M.; Goluch, Z.; Teleszko, M. Fatty acid profiles and health lipid indices in the breast muscles of local Polish goose varieties. Poult. Sci. 2020, 99, 1216–1224. [Google Scholar] [CrossRef] [PubMed]
  32. Wlazełko, M.; Łabudzki, L.; Górecki, G.; Skubis, J. Seasonal pattern of wild boar’s diet in Western Poland–research in the zielonka game investigation centre. Acta Sci. Pol. Silv. Colendar. Rat. Ind. Lignar. 2009, 8, 55–70. [Google Scholar]
  33. Meyer, H.H.; Rowell, A.; Streich, W.J.; Stoffel, B.; Hofmann, R.R. Accumulation of polyunsaturated fatty acids by concentrate selecting ruminants. Comp. Biochem. Physiol. A Mol. Integr. Physiol. 1998, 120, 263–268. [Google Scholar] [CrossRef]
  34. Lee, S.; Lee, E. Diet of the wild boar (Sus scrofa): Implications for management in forest-agricultural and urban environments in South Korea. PeerJ 2019, 7, e7835. [Google Scholar] [CrossRef] [PubMed] [Green Version]
  35. Razmaite, V.; Švirmickas, G.J.; Šiukščius, A. Effect of weight, sex and hunting period on fatty acid composition of intramuscular and subcutaneous fat from wild boar. Ital. J. Anim. Sci. 2012, 11, 174–179. [Google Scholar] [CrossRef]
  36. Popa, C.D.; Arts, E.; Fransen, J.; van Riel, P.L. Atherogenic index and high-density lipoprotein cholesterol as cardiovascular risk determinants in rheumatoid arthritis: The impact of therapy with biologicals. Mediat. Inflamm. 2012, 2012, 1–9. [Google Scholar] [CrossRef]
  37. Dietschy, J.M. Dietary fatty acids and the regulation of plasma low density lipoprotein cholesterol concentrations. J. Nutr. 1998, 128, 444–448. [Google Scholar] [CrossRef] [PubMed] [Green Version]
  38. Warensjö, E.; Sundström, J.; Vessby, B.; Cederholm, T.; Risérus, U. Markers of dietary fat quality and fatty acid desaturation as predictors of total and cardiovascular mortality: A population-based prospective study. Am. J. Clin. Nutr. 2008, 88, 203–209. [Google Scholar] [CrossRef] [PubMed]
  39. Alves, S.P.; Raundrup, K.; Cabo, Â.; Bessa, R.J.B.; Almeida, A.M. Fatty acid composition of muscle, adipose tissue and liver from muskoxen (Ovibos moschatus) living in West Greenland. PLoS ONE 2015, 10, e0145241. [Google Scholar] [CrossRef] [PubMed]
  40. Garton, G.A.; Duncan, W.R.H. Fatty acid composition and intramolecular structure of triglycerides from adipose tissue of red deer and reindeer. J. Sci. Food Agric. 1971, 22, 29–33. [Google Scholar] [CrossRef]
  41. Marangoni, F.; Agostoni, C.; Borghi, C.; Catapano, A.L.; Cena, H.; Ghiselli, A.; La Vecchia, C.; Lercker, G.; Manzato, E.; Pirillo, A.; et al. Dietary linoleic acid and human health: Focus on cardiovascular and cardiometabolic effects. Atherosclerosis 2020, 292, 90–98. [Google Scholar] [CrossRef] [PubMed] [Green Version]
  42. Jandacek, R.J. Linoleic acid: A nutritional quandary. Healthcare 2017, 5, 25. [Google Scholar] [CrossRef] [Green Version]
  43. Janicki, B.; Rosinski, A.; Elminowska-Wenda, G.; Bielinska, H.; Gronek, P. Effect of Feeding System (Intensive versus Semi-intensive) on yield and fatty acid composition of abdominal fat in white Italian geese. J. Appl. Anim. Res. 2000, 17, 279–284. [Google Scholar] [CrossRef] [Green Version]
  44. Okruszek, A. Fatty acid composition of muscle and adipose tissue of indigenous polish geese breeds. Arch. Anim. Breed. 2012, 55, 294–302. [Google Scholar] [CrossRef]
  45. Mu, H.; Høy, C.E. The digestion of dietary triacylglycerols. Progr. Lipid Res. 2004, 43, 105–133. [Google Scholar] [CrossRef]
  46. Kubow, S. The influence of positional distribution of fatty acids in native, interesterified and structure-specific lipids on lipoprotein metabolism and atherogenesis. J. Nutr. Biochem. 1996, 7, 530–541. [Google Scholar] [CrossRef]
  47. Small, D.M. The effects of glyceride structure on adsorption and metabolism. Annu. Rev. Nutr. 1991, 11, 413–434. [Google Scholar] [CrossRef] [PubMed]
  48. López-López, A.; Castellote-Bargalló, A.I.; Campoy-Folgoso, C.; Rivero-Urgel, M.; Tormo-Carnicé, R.; Infante-Pinad, D.; López-Sabatera, M.C. The influence of dietary palmitic acid triacylglyceride position on the fatty acid, calcium and magnesium contents of at term newborn faeces. Early Hum. Dev. 2001, 65 (Suppl. S2), 83–94. [Google Scholar] [CrossRef]
  49. Bryś, J.; Wirkowska, M.; Górska, A.; Ostrowska-Ligęza, E.; Bryś, A.; Koczoń, P. The use of DSC and FT-IR spectroscopy for evaluation of oxidative stability of interesterified fats. J. Therm. Anal. Calorim. 2013, 112, 481–487. [Google Scholar] [CrossRef] [Green Version]
  50. Chen, J.; Liu, H. Nutritional indices for assessing fatty acids: A mini-review. Int. J. Mol. Sci. 2020, 21, 5695. [Google Scholar] [CrossRef]
  51. Smith, S.B.; Lunt, D.K.; Smith, D.R.; Walzem, R.L. Producing high-oleic acid beef and the impact of ground beef consumption on risk factors for cardiovascular disease: A review. Meat Sci. 2020, 163, 108076. [Google Scholar] [CrossRef]
  52. Yurchenko, S.; Sats, A.; Tatar, V.; Kaart, T.; Mootse, H.; Jõudu, I. Fatty acid profile of milk from Saanen and Swedish Landrace goats. Food Chem. 2018, 254, 326–332. [Google Scholar] [CrossRef]
  53. Kerr, B.J.; Kellner, T.A.; Shurson, G.C. Characteristics of lipids and their feeding value in swine diets. J. Anim. Sci. Biotechnol. 2015, 6, 30. [Google Scholar] [CrossRef] [PubMed] [Green Version]
  54. Razmaitė, V.; Šiukščius, A. Seasonal variation in fatty acid composition of wild boar in Lithuania. Ital. J. Anim. Sci. 2019, 18, 350–354. [Google Scholar] [CrossRef] [Green Version]
Figure 1. The percentage of a given fatty acid in internal position of boar, badger and wild goose fats, expressed as the relative fatty acid [(sn-2 fatty acid × 100%)/(3 × total fatty acid in TAGs)].
Applsci 11 10029 g001
Table 1. The fatty acid profile of the adipose tissue-derived from wild animals (% of total fatty acids).
Fatty AcidsBoarBadgerGooseH
Mean ± SDMean ± SDMean ± SD
C12:00.26 ± 0.007 b0.09 ± 0.007 a0.10 ± 0.007 ab9.221 **
C14:03.84 ± 0.042 b1.37 ± 0.007 a1.31 ± 0.049 a10.057 **
C15:00.21 ± 0.007 b0.05 ± 0.007 a0.05 ± 0.007 a8.000 *
C16:019.23 ± 0.021 a21.49 ± 0.085 b21.03 ± 0.410 ab10.057 **
C17:00.41 ± 0.007 b0.31 ± 0.007 a0.32 ± 0.007 ab9.221 **
C18:06.95 ± 0.141 a12.48 ± 0.035 b12.19 ± 0.156 ab10.057 **
C20:00.42 ± 0.382 a0.27 ± 0.007 a0.24 ± 0.021 a2.514 NS
C23:00.45 ± 0.049not detectednot detected
Σ SFA31.75 ± 0.156 a36.05 ± 0.049 b35.22 ± 0.283 ab10.057 **
C14:10.74 ± 0.014 b0.02 ± 0.007 a0.02 ± 0.007 a8.000 *
C15:10.18 ± 0.007 b0.03 ± 0.007 a0.04 ± 0.014 a9.221 **
C16:110.20 ± 0.014 b2.69 ± 0.021 ab2.24 ± 0.042 a10.057 **
C17:10.47 ± 0.014 b0.25 ± 0.014 a0.25 ± 0.007 a7.926 *
C18:137.98 ± 0.269 a43.98 ± 0.042 b42.54 ± 0.262 ab10.057 **
C20:10.37 ± 0.007 a1.05 ± 0.007 b0.97 ± 0.028 ab10.353 **
Σ MUFA49.93 ± 0.297 b48.01 ± 0.014 ab46.05 ± 0.240 a10.057 **
C18:2 n-611.80 ± 0.120 a12.53 ± 0.021 ab14.76 ± 0.064 b10.057 **
C20:2 n-60.49 ± 0.035 a0.75 ± 0.007 ab0.85 ± 0.021 b10.057 **
C20:3 n-60.47 ± 0.021 b0.19 ± 0.021 a0.23 ± 0.028 ab10.057 **
C20:4 n-6trace0.26 ± 0.000 a0.28 ± 0.028 a0.000 NS
Σ n-612.75 ± 0.177 a13.72 ± 0.049 ab16.11 ± 0.028 b10.057 **
C18:3 n-32.03 ± 0.035 b1.18 ± 0.007 a1.30 ± 0.014 ab10.057 **
C20:3 n-31.12 ± 0.014 b0.27 ± 0.007 a0.24 ± 0.000 a10.057 **
C20:5 n-3tracetracetrace
C22:6 n-3tracetracetrace
Σ n-33.15 ± 0.049 b1.44 ± 0.000 a1.54 ± 0.014 a10.057 **
Σ PUFA15.89 ± 0.226 ab15.16 ± 0.049 a17.65 ± 0.042 b10.057 **
C18:1 transtracetrace0.39 ± 0.001
C18:2 trans0.41 ± 0.007 b0.24 ± 0.007 a0.23 ± 0.007 a9.221 **
Σ trans fatty acids0.41 ± 0.007 ab0.24 ± 0.007 a0.62 ± 0.007 b10.057 **
Σ total other fatty acids2.03 ± 0.382 b0.57 ± 0.007 a0.46 ± 0.014 a10.057 **
SFA—saturated fatty acids; MUFA—monounsaturated fatty acids; PUFA—polyunsaturated fatty acids; SD—standard deviation. a,b The different lower-case letters in the same row indicate significantly different values (p ≤ 0.05). H—Kruskal-Wallis statistics. *—significant at level 0.05, **—significant at level 0.01, NS—not significant.
Table 2. Fatty acid composition in the internal and external positions of triacylglycerols (TAGs) of of boar, badger and wild goose fats.
Positions of TAGsFatFatty Acid (wt%)
C16:0C16:1C18:0C18:1C18:2 n-6C18:3 n-3
sn-2boar43.24 ± 0.085 b3.03 ± 0.141 a7.68 ± 0.049 b26.55 ± 0.191 a9.33 ± 0.099 a1.78 ± 0.021 ab
badger24.17 ± 0.445 a5.67 ± 0.297 a2.36 ± 0.014 a34.50 ± 0.212 b21.19 ± 0.064 b2.98 ± 0.021 b
goose38.85 ± 0.163 ab3.17 ± 0.368 a8.80 ± 0.007 b29.56 ± 0.474 ab8.51 ± 0.099 a1.63 ± 0.078 a
H10.057 **7.543 NS10.057 **10.057 **10.057 **10.057 **
sn-1,3boar7.22 ± 0.042 a13.79 ± 0.071 b6.59 ± 0.025 a43.70 ± 0.095 a13.03 ± 0.049 ab2.15 ± 0.011 b
badger19.46 ± 0.223 b0.53 ± 0.148 a17.11 ± 0.007 b46.55 ± 0.106 ab11.54 ± 0.032 a0.46 ± 0.011 a
goose12.81 ± 0.081 ab2.44 ± 0.184 a14.32 ± 0.004 b51.19 ± 0.237 b14.53 ± 0.049 b0.95 ± 0.039 ab
H10.057 **10.057 **10.057 **10.057 **10.057 **10.057 **
Data expressed as means ± SD. a,b The different lower case letters in the same column (for the position sn-2 and sn-1,3 separately) indicate significantly different values (p ≤ 0.05). H—Kruskal-Wallis statistics. **—significant at level 0.01, NS—not significant.
Table 3. Induction time of the boar, badger and wild goose fats (measuring temperature 100 °C, 110 °C, 120 °C, 130 °C, and 140 °C).
TemperatureInduction Time of the Fats [min]H
BoarBadgerGoose
100 °C118.44 ± 2.411 b98.95 ± 1.994 ab56.70 ± 2.227 a10.057 **
110 °C54.78 ± 0.361 b41.32 ± 0.877 ab29.54 ± 1.082 a10.057 **
120 °C25.84 ± 0.665 b21.78 ± 0.622 ab15.66 ± 0.134 a10.057 **
130 °C12.38 ± 0.311 b10.07 ± 0.559 ab7.76 ± 0.735 a10.057 **
140 °C6.26 ± 0.834 b4.33 ± 0.078 ab3.67 ± 0.141 a10.057 **
Data expressed as means ± SD. a,b The different lower case letters in the same column indicate significantly different values (p ≤ 0.05). H—Kruskal-Wallis statistics. **—significant at level 0.01.
Table 4. Nutritional and healthy quality of the adipose tissue-derived from wild animal (mean values ± standard deviation).
Healthy Lipids IndicesBoarBadgerGooseRecommendation
PUFA/SFA0.50 ± 0.0100.42 ± 0.0020.50 ± 0.005>0.4 [4]
PUFA n-6/n-34.05 ± 0.0089.52 ± 0.03410.46 ± 0.078<4.0 [4]
AI0.24 ± 0.0010.089 ± 0.0000.084 ± 0.004<1.0 [28]
TI0.73 ± 0.0031.00 ± 0.0020.96 ± 0.013<0.5 [28]
h/H2.27 ± 0.0172.54 ± 0.0142.65 ± 0.067the higher more beneficial for human health [31]
PI (%)20.75 ± 0.30418.76 ± 0.07121.41 ± 0.051the lower it is, the more resistant to oxidation; the higher it is, the more PUFA included
PUFA, polyunsaturated fatty acids; SFA, saturated fatty acids; AI, atherogenic index; TI, thrombogenic index; h/H, hypocholesterolaemic/hypercholesteraemic index; PI, peroxidizability index.
Publisher’s Note: MDPI stays neutral with regard to jurisdictional claims in published maps and institutional affiliations.

