1. Introduction
The deterioration of concrete affects the structural integrity of concrete structures and reduces their serviceability. One of the most common types of damage in concrete structures is delamination at the interface between the concrete cover and the embedded steel rebars. The oxide layer around corroded steel rebars produces expansive stresses that initiate cracks with their planes parallel to the rebars (i.e., delamination). In addition, the delamination-like damage usually occurs at bridge deck overlays which include the interface between the topping material layer and structural member. The extent of delamination damage increases over time unless it is appropriately repaired. Delamination damage needs to be detected and characterized at an early development stage to reduce the maintenance cost and improve the serviceability of concrete structures.
Studies have demonstrated the potential of nondestructive inspection techniques based on mechanical vibration and elastic wave propagation phenomena to detect damage from concrete structures and further characterize their material properties. The techniques include impact-echo (IE), spectral analysis of surface waves (SASW), and multichannel analysis of surface waves (MASW) [
1,
2,
3,
4,
5,
6,
7,
8,
9,
10]. In the IE method, a mechanical impact is applied to excite guided waves and low-frequency vibration modes, and the corresponding responses are collected using a vibration sensor (e.g., an accelerometer or microphone). Then, a specific frequency that corresponds to the zero-group-velocity (ZGV) Lamb wave mode is extracted from the frequency-domain spectrum of the measured response to compute the thickness of concrete pavements and the delamination depth. The SASW computes the phase velocity of Rayleigh waves over a range of frequencies (or wavelengths) using vibration responses collected using two sensors. Furthermore, a shear wave velocity profile over the depth of a layered medium is obtained through an inversion process. The MASW technique uses a multichannel vibration sensor array that enables the spatial sampling of multimodal guided wave responses. The collected array data are processed to obtain experimental phase velocity dispersion curves, where individual wave modes are identified to characterize the material properties. However, it is difficult to estimate the depth of near-surface shallow delamination using these techniques despite their potential. This is partly because these techniques use a mechanical impact source that generates low-frequency (below 20 kHz) resonant vibration modes over the shallow delamination region, and these vibration modes are not favorable for estimating the depth of delamination.
In recent years, an air-coupled ultrasonic approach has been demonstrated to be an effective tool for the nondestructive inspection of concrete structures [
11,
12,
13,
14]. Lamb waves (plate guided waves) that are favorable for estimating the depth of delamination can be generated by employing ultrasonic frequencies (above 20 kHz). In addition, the noncontact nature of the air-coupled ultrasonic approach facilitates the rapid collection of ultrasonic data over a large inspection area. Recent advances in the micro-electromechanical system (MEMS) technology have enabled the development of a low-cost, high-resolution sensor array system [
14]. Air-coupled ultrasonic approaches have been applied to detect and characterize various types of concrete damage, such as internal voids [
12], alkali-silica reaction damage [
13], and distributed cracks [
15].
In this article, we present a method to estimate the depth of near-surface shallow delamination in concrete using a noncontact (air-coupled) MEMS ultrasonic sensor array and an optimization-based data processing approach. The noncontact ultrasonic sensor array system consists of an array of 64 MEMS ultrasonic microphones and a signal-amplifying circuit. The proposed ultrasonic data processing approach estimates the delamination depth by solving two optimization problems: the first problem is to minimize the objective function derived from the Rayleigh characteristic equation and the second problem is to minimize the discrepancy between the analytical and experimental Lamb wave dispersion curves. The proposed approach is evaluated using numerical simulations and laboratory-scale experiments. It offers several advantages in the nondestructive inspection of concrete structures over the abovementioned approaches: (1) it uses a 64-channel noncontact MEMS ultrasonic sensor array that enables the rapid collection of linear ultrasonic scanning data; (2) it enables the accurate estimation of the depth of shallow delamination in concrete; and (3) it effectively uses multiple Lamb wave modes.
2. Theoretical Background on Rayleigh and Lamb Waves
In this study, we assume that within an appropriate frequency region, Rayleigh (surface) waves are generated in a full-depth pristine concrete region, whereas Lamb (plate) waves are generated in a delaminated region. The behaviors and characteristics of Rayleigh and Lamb waves are summarized in this section.
Rayleigh waves propagate along the surface of a semi-infinite half-space of an elastic medium. The characteristic equation for the Rayleigh wave velocity is given by [
16]:
where
,
, and
are the longitudinal (primary or P-), transverse (secondary or S-), and Rayleigh wave velocities, respectively. The particle motion of a Rayleigh wave is elliptic, and its amplitude exponentially decays with depth. Hence, most of its wave energy is limited to a depth of approximately one wavelength. For homogeneous and isotropic media, the Rayleigh wave velocity does not vary with the frequency (i.e., nondispersive).
Lamb waves are generated and propagated in isotropic, elastic plate-like structures where traction-free boundary conditions are imposed at the top and bottom surfaces. Lamb waves are multimodal and dispersive: each wave mode propagates with a different velocity that varies with the frequency. Depending on the symmetry of the wave motion, Lamb wave modes are divided into symmetric and antisymmetric families. The modal solutions (wavenumbers) of Lamb waves can be obtained by numerically solving the Rayleigh–Lamb equations given by [
17]:
where
d is the plate thickness,
k is the wavenumber, and the superscripts +1 and −1 represent symmetric and antisymmetric Lamb wave modes, respectively, and
where
ω is the angular frequency. Once the wavenumber solutions are obtained, the phase velocity (
) of each Lamb wave mode at a frequency
ω is computed by
ω/k.
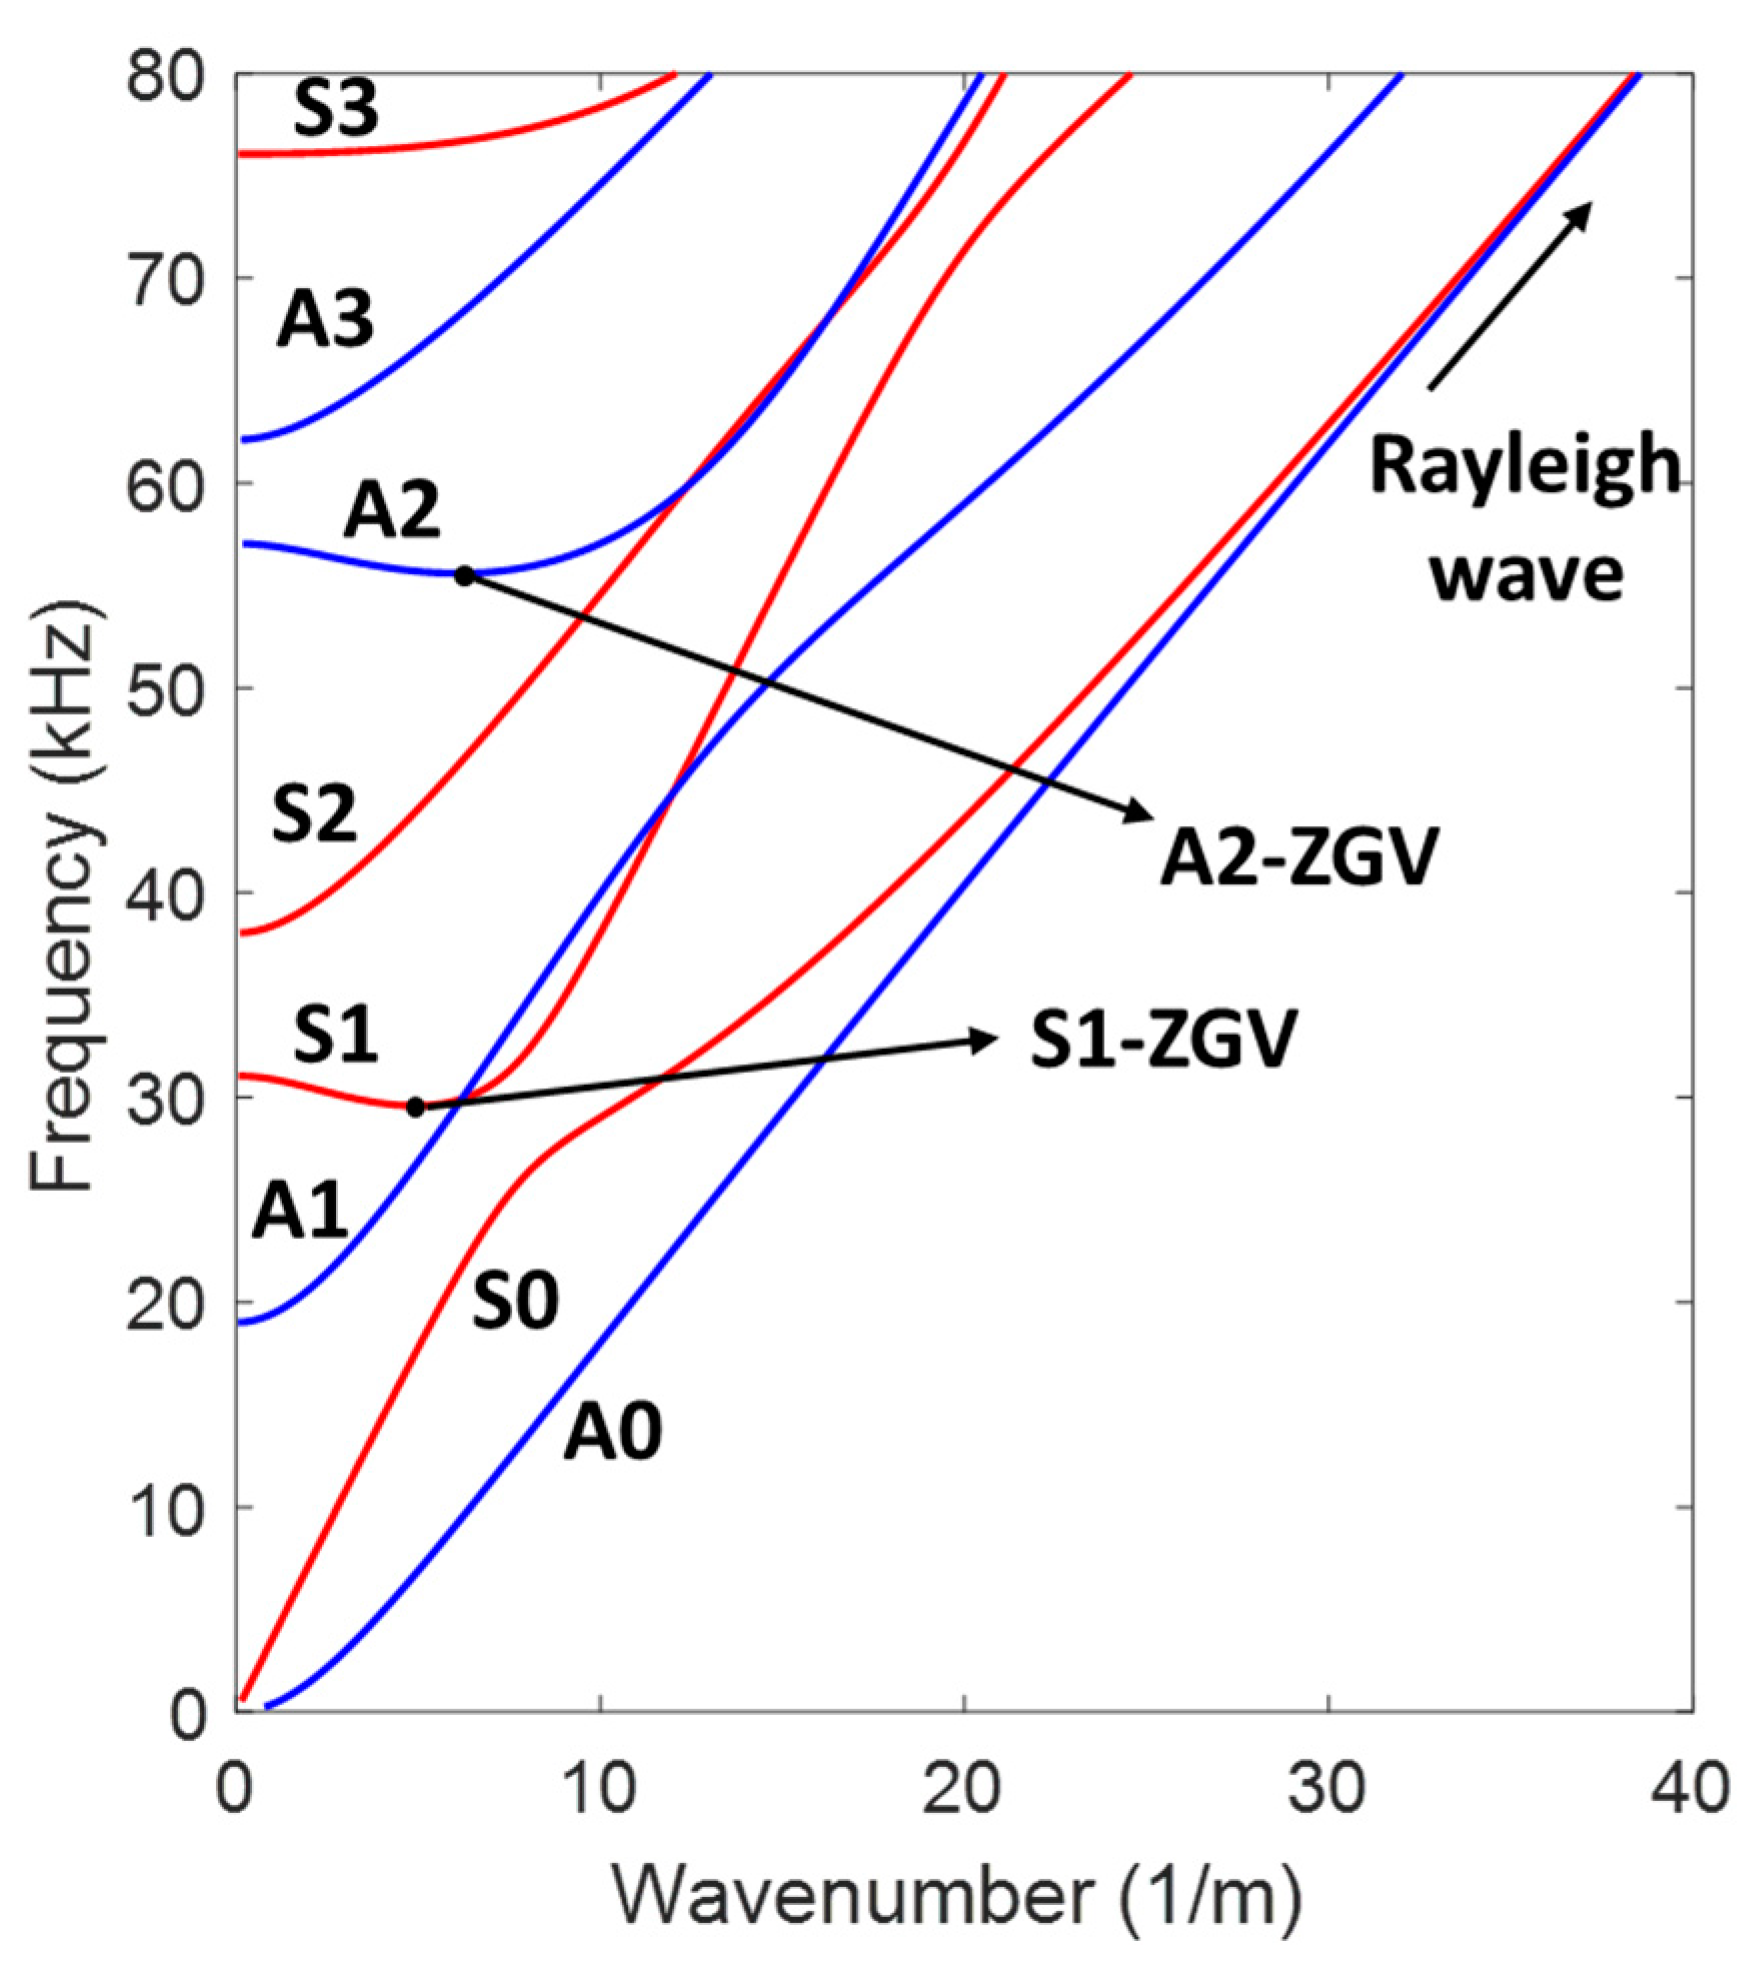
Example wavenumber solutions (dispersion curves) for Lamb waves in a concrete plate are displayed in
Figure 1. In the plot, the red and blue curves indicate the symmetric and antisymmetric Lamb wave modes, respectively. In the low-frequency region (below 19 kHz in
Figure 1), only two fundamental modes—fundamental symmetric (S0) and anti-symmetric (A0) modes—exist. The higher-order modes appear as the frequency increases. At higher frequencies (above 60 kHz in
Figure 1), the wavenumbers of the S0 and A0 modes approach those of Rayleigh waves. The frequencies of several Lamb wave-based nondestructive inspection techniques are limited to the low-frequency region where only the S0 and A0 modes exist, to avoid the complexity in the analysis of the higher-order modes. However, the higher-order modes at certain frequencies (S1-ZGV and A2-ZGV in
Figure 1) are also employed owing to their unique properties with ZGVs. At these ZGV frequencies, most of the wave energy does not propagate, but it is localized near an excitation source. In particular, the IE method utilizes the S1-ZGV mode to estimate the thickness of a plate
d:
where
is the ZGV frequency of the S1 mode and
β is an empirical parameter that depends on the Poisson’s ratio of the material [
18].
3. Materials and Methods
In this section, the numerical simulations and experiments conducted to generate ultrasonic scanning data from pristine and delaminated concrete cases are described. Then, an ultrasonic data processing method is proposed to estimate the delamination depth of concrete.
3.1. Numerical Simulations
Two-dimensional (2-D) elastic wave propagation in concrete was simulated to generate ultrasonic scanning data and evaluate the proposed data processing approach. Two concrete models—pristine (full depth) and delaminated (shallow depth) concrete models—were simulated. A MATLAB-based finite-difference time-domain (FDTD) acoustic wave simulation toolbox
k-wave was used in this study [
19]. A laptop computer with a 6-core processor (Intel Core i7-8750H) and 16 GB RAM was used for the FDTD simulations. The total computation time was 23 min for the pristine concrete model and 12 min for the delamination model.
Figure 2 illustrates the overall structure of the simulated concrete models, and the numerical simulation parameters are summarized in
Table 1. The simulated pristine concrete model contains 1024 mm × 250 mm concrete between two air layers. The delaminated concrete model has a concrete layer with a reduced thickness (60 mm). In both models, a concrete and two air layers are surrounded by perfectly matched layers (PMLs) [
20] to eliminate unwanted boundary reflections, as shown in
Figure 2a. An out-of-plane excitation force with an excitation signal, as shown in
Figure 2b (three-cycle tone burst centered at 30 kHz), was applied at the top surface of the concrete. The corresponding out-of-plane velocity responses were collected across 900 sensing points with a spacing of 1 mm, as shown in
Figure 2a. Note that the generated wave responses across the sensing points represent ultrasonic scanning measurement data across a one-dimensional scanning measurement grid.
3.2. Experimental Setup and Procedures
3.2.1. Concrete Specimen
A reinforced concrete slab specimen with dimensions of 2000 × 1500 × 250 mm
3 (length × width × thickness) was produced.
Table 2 summarizes the mixture design proportions used to produce the concrete specimen. An acrylic panel (400 × 400 × 2 mm
3) was inserted at a depth of 60 mm on the top of the rebar when the specimen was cast, to simulate a delamination defect. The cross-sectional dimensions of the concrete specimen are illustrated in
Figure 3. The concrete specimen was cured for 28 days, and the measured 28-day compressive strength was 31.8 MPa.
3.2.2. Ultrasonic Scanning Data Collection
In this study, a fully noncontact ultrasonic test setup was used to generate and measure ultrasonic waves from the concrete specimen, as shown in
Figure 4. An air-coupled transducer (NCG50-D50, Ultran) generated ultrasonic waves in the concrete sample with a center frequency of 32 kHz. The lift-off distance and incident angle for the transducer were set to 40 mm and 5°, respectively. The corresponding ultrasonic responses were collected using the noncontact ultrasonic sensor array system (NUSAS) designed by the authors (see
Figure 4) with a lift-off distance of 10 mm. The NUSAS consists of a linear array of 64 MEMS ultrasonic microphones (SPU0410LR5H-QB, Knowles Acoustics) with a spacing of 5 mm and a 64-channel amplifying circuit to improve the signal-to-noise ratio (SNR). The amplifying circuit removes DC offsets, suppresses the low-frequency environmental noises from the obtained signals, and amplifies the filtered signals 2000 times (60 dB). Sixteen ultrasonic responses were collected at a time, and the sequential data collection throughout the 64 channels was controlled using a switch multiplexer (TB-2630B, National Instruments). The collected signals were digitized using a digital oscilloscope (PXIe-5105, National Instruments), and the digitized signal data were saved to a laptop computer. The sampling rate was set to 2 MS/s, and the signals were time-averaged over 50 repetitions.
3.3. Ultrasonic Data Processing Approach to Estimate Delamination Depth
An overview of the proposed ultrasonic data processing approach to estimate the concrete delamination depth is illustrated in
Figure 5. The proposed approach is an optimization approach to obtain an optimal estimation of delamination depth by minimizing specific objective functions derived from Rayleigh and Rayleigh–Lamb equations. The data processing procedure is described below.
As a preprocessing step, the Rayleigh wave velocity (
) of the tested concrete specimen was obtained using ultrasonic scanning data from a pristine region,
. To obtain
,
is converted to the frequency–wavenumber (
f–
k) domain using a 2-D Fourier transform, given by
where
is the converted
f–
k domain ultrasonic data from a pristine concrete region. Then,
computed by
where
and
are the peak frequency and wavenumber in the magnitude spectrum
.
In Step 1, the P- and S-wave velocities (
and
) of the tested concrete specimen are updated by solving the following optimization problem:
where
and
are the lower and upper bounds of
, respectively, and
is the first objective function in the proposed approach, given by
The
,
,
, and
values used in this study are 3200 m/s, 4000 m/s, 1700 m/s, and 2400 m/s, respectively. The ranges of
and
set by the lower and upper bounds are the typical wave velocity ranges of normal-strength concrete. The optimal solution of this optimization problem is obtained using the interior-point technique [
21] implemented in a MATLAB function “fmincon.”
In Step 2, the optimal delamination depth is obtained by solving the second optimization problem:
where
and
are the lower and upper bounds of the delamination depth, respectively.
is the second objective function given by
where
and
are the total numbers of fundamental symmetric and antisymmetric Lamb wave modes from the ultrasonic scanning data, respectively.
and
are the S0 and A0 mode wavenumbers, respectively, identified in the dispersion curves obtained using the ultrasonic scanning data at the frequency
, while
and
are the analytically computed wavenumbers for the S0 and A0 modes at the frequency
. Here,
and
are obtained by taking the local maxima in the
f–k domain magnitude spectrum of the ultrasonic scanning data for delaminated concrete.
4. Results
In this section, the ultrasonic scanning measurement data generated from the numerical simulations and experiments are presented. Subsequently, the results of the estimation of the delamination depth obtained using the proposed approach are presented.
4.1. Ultrasonic Scanning Data for Pristine and Delamination Cases
The ultrasonic scanning data for the pristine and delamination cases generated using the numerical simulations are shown in
Figure 6a,b, respectively. The pristine concrete case shown in
Figure 6a reveals that the dominant wave components in the full-depth concrete (250 mm thick) are Rayleigh waves. No other wave modes are observed. However, the delamination case (
Figure 6b) shows that Lamb waves are generated owing to the reduced concrete depth (60 mm thick). In particular, the fundamental symmetric (S0) and anti-symmetric modes are observed in the delamination case.
The ultrasonic scanning data for the pristine and delamination cases obtained using the noncontact sensor array shown in
Figure 4 from the tested concrete sample are displayed in
Figure 6c,d, respectively. The experimental data show more complicated responses than the numerical simulation data: each wave component is mixed in the time–space (
t–x) domain, and individual wave components are not clearly separated. In addition, direct acoustic waves are observed in the experimental data owing to the fully air-coupled excitation and sensing setup. Rayleigh and Lamb waves are presumably present in the pristine and delamination cases, respectively. However, the experimental data in the frequency–wavenumber (
f–k) domain need to be analyzed further to verify this assumption.
The
f–k domain magnitude spectra for the data obtained from the numerical simulations and experiments are shown in
Figure 7. In each case, the Lamb wave dispersion curves obtained via theoretical analysis are overlaid on the
f–k domain magnitude spectrum to identify individual wave components. For the pristine concrete case from the numerical simulation (
Figure 7a), it is apparent that the Rayleigh wave is the dominant wave component. However, the delamination case from the numerical simulation (
Figure 7b) shows both symmetric and anti-symmetric Lamb wave modes. The experimental data for the pristine and delamination cases (
Figure 7c,d, respectively) demonstrate observations similar to the numerical simulation data. The simulation and experimental data shown in
Figure 5 and
Figure 6 demonstrate that concrete delamination generates multimodal Lamb waves, whereas only Rayleigh waves are observed in the full-depth pristine concrete.
4.2. Delamination Depth Estimation Results
In this subsection, the results of estimation of the delamination depth obtained using the proposed approach are presented. The results from both the numerical simulations and experiments are summarized in
Table 3.
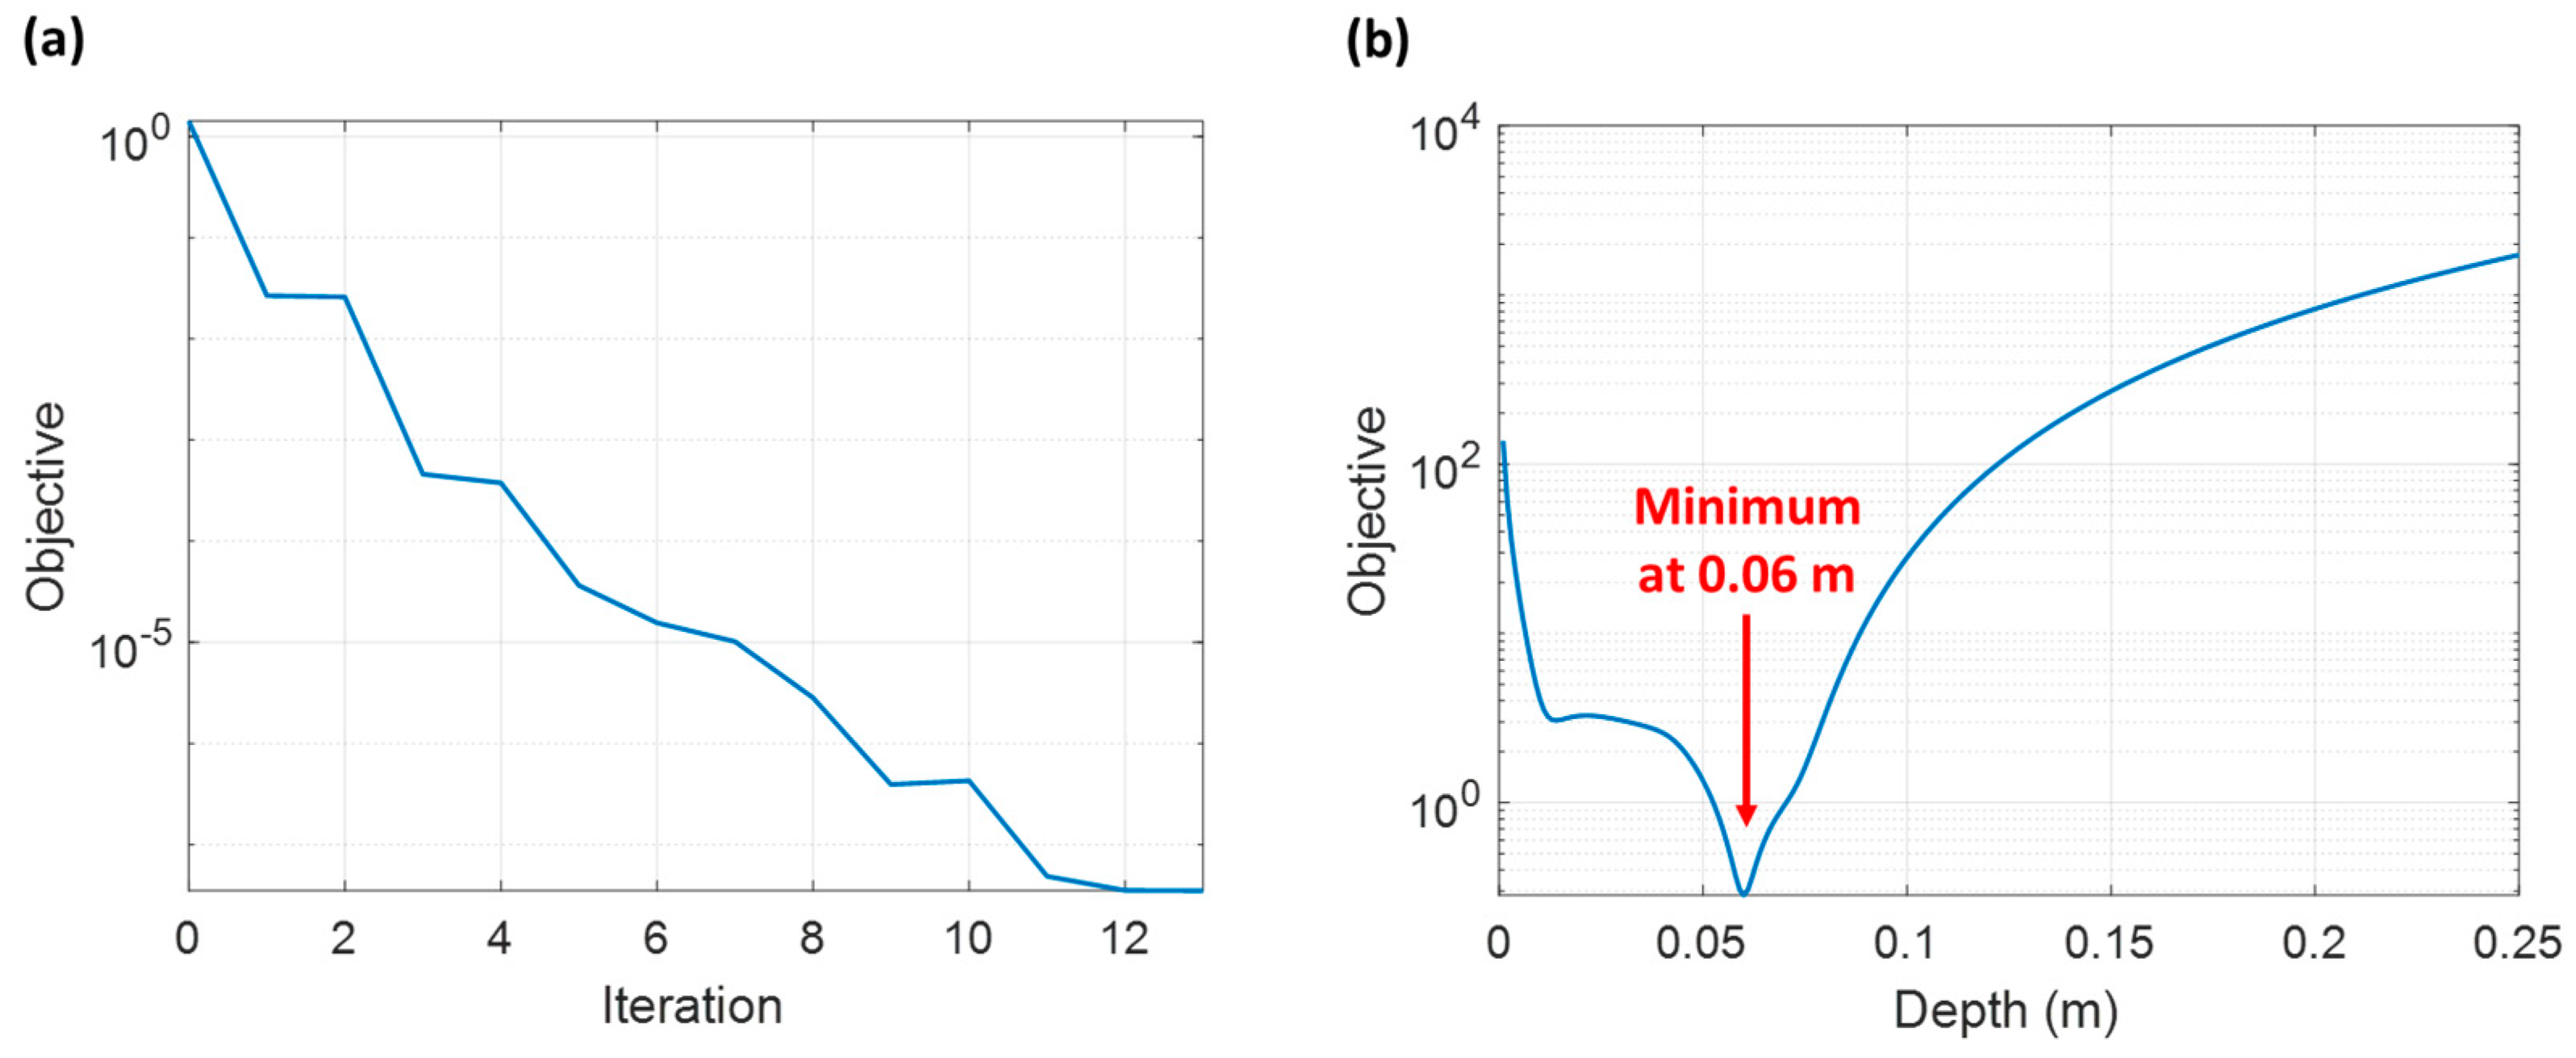
Figure 8a shows the history of the objective function value over iterations for Step 1 (P- and S-wave velocity updates) processed with the numerical simulation data. The figure indicates that the optimal P- and S-wave velocities were obtained at 13 iterations, providing the updated P- and S-wave velocities of 3739.2 m/s and 2270.9 m/s, respectively. The updated wave velocities are close to the actual P- and S-wave velocities of 3727 m/s and 2282 m/s, respectively. The objective function over the search space (possible delamination depth) for Step 2 (delamination depth estimation) processed with the numerical simulation data is presented in
Figure 8b. In the figure, a global minimum is observed at a depth of 0.06 m, and the estimated delamination depth at the global minimum exactly matches the actual delamination depth.
The dispersion curves extracted from the numerical simulation data (
Figure 7b) and those theoretically computed with the estimated delamination depth are compared in
Figure 9. The dispersion curves for the two cases show good consistency with each other.
Subsequently, the history of the objective function value over iterations for Step 1 processed with the experimental data is presented in
Figure 10a. Similar to the numerical simulation results shown in
Figure 8a, the optimal P- and S-wave velocities were obtained at 13 iterations. The updated P- and S-wave velocities are 3580.6 m/s and 2157.1 m/s, respectively.
Figure 10b shows the objective function over possible delamination depth values for Step 2 processed with the experimental data. A global minimum is observed at a depth of 0.0506 m, providing a good estimation of the delamination depth close to the actual delamination depth (0.06 m). The absolute error in the estimation of the delamination depth was 0.0094 m (15.7% error). The presented numerical simulation and experimental results demonstrate the feasibility and good performance of the proposed ultrasonic data processing approach in the quantitative estimation of concrete delamination.
5. Discussion
The main objective of the proposed ultrasonic data processing approach is to estimate the depth of shallow delamination in concrete. Additionally, the proposed approach characterizes material properties (bulk wave velocities) by solving an optimization problem (Equation (7)). Bulk wave velocities are directly related to the elastic properties of the tested material. The dynamic Poisson’s ratio (
ν) can be computed using the obtained bulk wave velocities as
If the mass density (
ρ) of the material is known, the dynamic Young’s modulus (
E) can be computed by
Obtaining bulk wave velocities is particularly important for concrete, considering the high variability and uncertainty of its material properties.
Although the proposed ultrasonic data processing approach accurately estimates the concrete delamination depth from numerical simulation data, it reveals a nontrivial error (15.7%) for the case of experimental data. A possible source of the estimation error is the variability in the material properties of the tested concrete specimen. To be specific, the elastic/shear modulus (or P- and S-wave velocity) of concrete affects the dispersion relation in a plate-guided wave. While the applied mechanical wave approach has an advantage of a direct relation to the mechanical properties of concrete, unmeasured velocities from the specimen affect the accuracy of the estimation in the proposed method. In Step 1 of the proposed approach, bulk wave velocities are obtained from the reference ultrasonic scanning data, which correspond to a full-depth pristine region of the concrete specimen. The obtained wave velocities represent the material properties of the full-depth region of the tested concrete specimen, but they may be slightly different from those for the delamination region. This discrepancy can be a source of error in Step 2 of the data processing approach.
Lamb waves need to be generated and propagated within the delamination region of concrete for a successful implementation of the proposed approach. In addition, the length of delamination needs to be several wavelengths of the S0 and A0 modes to support Lamb wave propagation. The mode separation within the applied frequencies is required for the proposed approach. The applicable range of delamination depth is around 0.03–0.08 m with respect to applied frequencies (30–60 kHz) in this study. This condition imposes a limitation on the proposed approach in that early-stage delamination damage to a small extent may not be effectively evaluated.
6. Conclusions
This article proposed a method for the estimation of the depth of shallow delamination in concrete structures using a noncontact MEMS ultrasonic sensor array and an optimization-based ultrasonic array data processing technique. The performance of the proposed technique was evaluated using numerical simulations and experiments. Based on the results, the following conclusions were drawn:
- (1)
Within an appropriate frequency region, Rayleigh waves are generated in a full-depth concrete region, whereas Lamb waves are generated above a delamination (shallow-depth) region.
- (2)
The proposed ultrasonic data processing approach updates the P- and S-wave velocities of the tested concrete element using the measured Rayleigh wave velocity.
- (3)
The proposed data processing approach estimates the thickness of shallow delamination in concrete with an acceptable accuracy.
Author Contributions
H.S. and H.C. designed the study. H.S. and J.H. performed the numerical simulations and laboratory experiments, analyzed the collected data, and drafted the manuscript. H.C. and J.M. supervised the study, and reviewed and revised the manuscript draft. J.M. acquired the funding. All authors have read and agreed to the published version of the manuscript.
Funding
This work was supported by the Technology Innovation Program (Drone Application Service Market Creation Support, No. 20011780) funded by the Ministry of Trade, Industry & Energy (MOTIE, Korea).
Institutional Review Board Statement
Not applicable.
Informed Consent Statement
Not applicable.
Data Availability Statement
The data presented in this study are available on request from the corresponding author.
Conflicts of Interest
The authors declare no conflict of interest. The funders had no role in the design of the study; in the collection, analyses, or interpretation of data; in the writing of the manuscript, or in the decision to publish the results.
References
- Zhu, J.; Popovics, J.S. Imaging Concrete Structures Using Air-Coupled Impact-Echo. J. Eng. Mech. 2007, 133, 628–640. [Google Scholar] [CrossRef]
- Kee, S.-H.; Oh, T.; Popovics, J.S.; Arndt, R.W.; Zhu, J. Nondestructive Bridge Deck Testing with Air-Coupled Impact-Echo and Infrared Thermography. J. Bridg. Eng. 2012, 17, 928–939. [Google Scholar] [CrossRef]
- Oh, T.; Popovics, J.S.; Ham, S.; Shin, S.W. Practical finite element based simulations of nondestructive evaluation methods for concrete. Comput. Struct. 2012, 98–99, 55–65. [Google Scholar] [CrossRef]
- Groschup, R.; Grosse, C.U. MEMS microphone array sensor for air-coupled impact-echo. Sensors 2015, 15, 14932–14945. [Google Scholar] [CrossRef]
- Cho, Y.S. Non-destructive testing of high strength concrete using spectral analysis of surface waves. NDT E Int. 2003, 36, 229–235. [Google Scholar] [CrossRef]
- Kim, D.S.; Seo, W.S.; Lee, K.M. IE–SASW method for nondestructive evaluation of concrete structure. NDT E Int. 2006, 39, 143–154. [Google Scholar] [CrossRef]
- Ryden, N.; Park, C.B.; Ulriksen, P.; Miller, R.D. Multimodal Approach to Seismic Pavement Testing. J. Geotech. Geoenviron. Eng. 2004, 130, 636–645. [Google Scholar] [CrossRef]
- Ryden, N.; Lowe, M.J.S. Guided wave propagation in three-layer pavement structures. J. Acoust. Soc. Am. 2004, 116, 2902. [Google Scholar] [CrossRef]
- Lee, Y.H.; Oh, T. The simple Lamb wave analysis to characterize concrete wide beams by the practical MASW test. Materials 2016, 9, 437. [Google Scholar] [CrossRef] [PubMed]
- Baggens, O.; Ryden, N. Lamb wave plate parameters from combined impact-echo and surface wave measurement. In Proceedings of the International Symposium NDT in Civil Engineering, Berlin, Germany, 15–17 September 2015; Volume 1517. [Google Scholar]
- Abraham, O.; Piwakowski, B.; Villain, G.; Durand, O. Non-contact, automated surface wave measurements for the mechanical characterisation of concrete. Constr. Build. Mater. 2012, 37, 904–915. [Google Scholar] [CrossRef]
- Choi, H.; Popovics, J.S. NDE application of ultrasonic tomography to a full-scale concrete structure. IEEE Trans. Ultrason. Ferroelectr. Freq. Control 2015, 62, 1076–1085. [Google Scholar] [CrossRef] [PubMed]
- Kim, G.; Giannini, E.; Klenke, N.; Kim, J.Y.; Kurtis, K.E.; Jacobs, L.J. Measuring Alkali-Silica Reaction (ASR) Microscale Damage in Large-Scale Concrete Slabs Using Nonlinear Rayleigh Surface Waves. J. Nondestruct. Eval. 2017, 36, 1–6. [Google Scholar] [CrossRef]
- Song, H.; Park, J.; Popovics, J.S. Development of a MEMS ultrasonic microphone array system and its application to compressed wavefield imaging of concrete. Smart Mater. Struct. 2020, 29, 105011. [Google Scholar] [CrossRef]
- Song, H.; Popovics, J.S. Extracting non-propagating oscillatory fields in concrete to detect distributed cracking. J. Acoust. Soc. Am. 2019, 146, 2655–2670. [Google Scholar] [CrossRef] [PubMed]
- Achenbach, J.D. Wave Propagation in Elastic Solids; Elsevier: New York, NY, USA, 1973. [Google Scholar]
- Graff, K.F. Wave Motion in Elastic Solids; Dover Publications Inc.: New York, NY, USA, 1975; ISBN 0486667456. [Google Scholar]
- Gibson, A.; Popovics, J.S. Lamb Wave Basis for Impact-Echo Method Analysis. J. Eng. Mech. 2005, 131, 438–443. [Google Scholar] [CrossRef]
- Treeby, B.E.; Jaros, J.; Rohrbach, D.; Cox, B.T. Modelling elastic wave propagation using the k-Wave MATLAB Toolbox. In Proceedings of the 2014 IEEE International Ultrasonics Symposium, Chicago, IL, USA, 3–6 September 2014; pp. 146–149. [Google Scholar]
- Berenger, J.P. A Perfectly Matched Layer for the Absorption of Electromagnetic Waves. J. Comput. Phys. 1994, 114, 185–200. [Google Scholar] [CrossRef]
- Byrd, R.H.; Gilbert, J.C.; Nocedal, J. A trust region method based on interior point techniques for nonlinear programming. Math. Program. 2000, 89, 149–185. [Google Scholar] [CrossRef]
Figure 1.
Example dispersion curves for Lamb waves in a linear, isotropic plate. The assumed , , and d values are 3730 m/s, 2280 m/s, and 0.06 m, respectively.
Figure 1.
Example dispersion curves for Lamb waves in a linear, isotropic plate. The assumed , , and d values are 3730 m/s, 2280 m/s, and 0.06 m, respectively.
Figure 2.
(a) Overall structure of the numerical simulation model and (b) the excitation signal. The pristine and delaminated concrete cases were modeled as concrete with thicknesses of 250 mm and 60 mm, respectively. In both cases, a concrete and two air layers are surrounded by perfectly matched layers (PMLs) to eliminate boundary reflections.
Figure 3.
Cross-sectional dimensions of the tested concrete specimen. The unit is in mm.
Figure 3.
Cross-sectional dimensions of the tested concrete specimen. The unit is in mm.
Figure 4.
Illustration of the contactless ultrasonic sensor array system to collect scanning data from concrete samples. CN board is a connector board that makes the connection between the output ends of the amplification board and the digital oscilloscope.
Figure 4.
Illustration of the contactless ultrasonic sensor array system to collect scanning data from concrete samples. CN board is a connector board that makes the connection between the output ends of the amplification board and the digital oscilloscope.
Figure 5.
Overview of the proposed ultrasonic data processing approach to estimate the delamination depth of concrete.
Figure 5.
Overview of the proposed ultrasonic data processing approach to estimate the delamination depth of concrete.
Figure 6.
Ultrasonic scanning data: (a) pristine concrete case (numerical simulation), (b) delamination case (numerical simulation), (c) pristine concrete case (experiments), and (d) delamination case (experiments).
Figure 6.
Ultrasonic scanning data: (a) pristine concrete case (numerical simulation), (b) delamination case (numerical simulation), (c) pristine concrete case (experiments), and (d) delamination case (experiments).
Figure 7.
Frequency–wavenumber domain magnitude spectra: (a) pristine concrete case (numerical simulation), (b) delamination case (numerical simulation), (c) pristine concrete case (experiments), and (d) delamination case (experiments). Lamb wave dispersion curves are overlaid on the magnitude spectra, where the red and blue lines indicate symmetric and anti-symmetric Lamb wave modes, respectively.
Figure 8.
Objective history for numerical simulation results: (a) objective history for Step 1 in the data processing approach and (b) objective function for Step 2 over the search space. The actual delamination depth is 0.06 m.
Figure 8.
Objective history for numerical simulation results: (a) objective history for Step 1 in the data processing approach and (b) objective function for Step 2 over the search space. The actual delamination depth is 0.06 m.
Figure 9.
Comparison between dispersion curves extracted from the numerical simulation data (
Figure 7b) and those theoretically computed with the estimated delamination depth.
Figure 9.
Comparison between dispersion curves extracted from the numerical simulation data (
Figure 7b) and those theoretically computed with the estimated delamination depth.
Figure 10.
Objective history for experimental results: (a) objective history for Step 1 in the data processing approach and (b) objective function for Step 2 over the search space. The actual delamination depth is 0.06 m.
Figure 10.
Objective history for experimental results: (a) objective history for Step 1 in the data processing approach and (b) objective function for Step 2 over the search space. The actual delamination depth is 0.06 m.
Table 1.
Summary of the numerical simulation parameters for the pristine and delaminated concrete models. An increased mass density was used for the air layer to improve the simulation stability.
Table 1.
Summary of the numerical simulation parameters for the pristine and delaminated concrete models. An increased mass density was used for the air layer to improve the simulation stability.
| Material Properties |
|---|
| | P-wave speed (m/s) | S-wave speed (m/s) | Mass density (kg/m3) |
| Concrete | 3727 | 2282 | 2400 |
| Air | 343 | | 240 |
| Simulation Parameters |
| Grid spacing (dx and dy) | 1 mm |
| Time step (dt) | 0.0268 μs |
| Time duration (T) | 1 ms |
| Number of sensing points | 900 |
| Sensor spacing | 1 mm |
Table 2.
Mixture design proportions for the concrete specimen.
Table 2.
Mixture design proportions for the concrete specimen.
| Designed Compressive Strength (MPa) | Maximum Aggregate Size (mm) | Water-to-Cement Ratio | Unit Weight (kg/m3) |
|---|
| Water | Cement | Fine Aggregate | Coarse Aggregate | Super-Plasticizer |
|---|
| 30 | 15 | 0.43 | 169 | 392 | 825 | 952 | 3.528 |
Table 3.
Summary of results for the update of bulk wave velocities ( and ) and estimation of the depth of concrete delamination.
Table 3.
Summary of results for the update of bulk wave velocities ( and ) and estimation of the depth of concrete delamination.
| | Numerical Simulations | Experiments |
|---|
| | Update of the P- and S-wave velocities |
| | | | | |
| Initial guess (m/s) | 4000 | 2000 | 4000 | 2000 |
| Updated velocity (m/s) | 3739.2 | 2270.9 | 3580.6 | 2157.1 |
| Actual velocity (m/s) | 3727 | 2282 | | |
| | Delamination depth estimation |
| Estimated depth (m) | 0.06 | 0.0506 |
| Actual depth (m) | 0.06 | 0.06 |
| Publisher’s Note: MDPI stays neutral with regard to jurisdictional claims in published maps and institutional affiliations. |
© 2021 by the authors. Licensee MDPI, Basel, Switzerland. This article is an open access article distributed under the terms and conditions of the Creative Commons Attribution (CC BY) license (http://creativecommons.org/licenses/by/4.0/).


