Article

Accuracy Verification of an Anatomical Model Manufactured Using Low-Cost Additive Production

Department of Biomedical Engineering and Measurement, Faculty of Mechanical Engineering, Technical University of Košice, Letná 9, 042 00 Košice, Slovakia
*
Author to whom correspondence should be addressed.
Appl. Sci. 2021, 11(2), 594; https://doi.org/10.3390/app11020594
Submission received: 12 November 2020 / Revised: 30 December 2020 / Accepted: 7 January 2021 / Published: 9 January 2021

Abstract

:
The paper deals with the separation of the third cervical vertebra using the software VGStudio MAX, Mimics, and inVesalius. During the separation, various parameters of the threshold were used to determine the effect. The comparison of models from Mimics and inVesalius to VGStudio MAX showed that the cumulative variance distribution for 95% surface coverage is less than 0.935 mm. When comparing medically oriented software, Mimics and inVesalius, the deviation was less than 0.356 mm. The model was made of polylactic acid (PLA) material on a low-cost 3D printer, Prusa i3 MK2.5 MMU1. The printed model was scanned by four scanners: Artec Eva, 3Shape D700, Steinbichler Comet L3D, and Creaform EXAscan. The outputs from the scanners were compared to the reference model (standard tessellation language (STL) model for 3D printing) as well as to the scanner with the best accuracy (3Shape). Compared to the publications below, the analysis of deviations was evaluated on the entire surface of the model and not on selected dimensions. The cumulative variance distribution for comparing the output from the 3D scanner with the reference model, as well as comparing the scanners, shows that the deviation for 95% of the surface coverage is at the level of 0.300 mm. Since the model of the vertebra is planned for education and training, the used software and technologies are suitable for use in the design and the production process.

1. Introduction

The study of anatomy is an important part of medical education [1,2,3]. In the past, the visualization of the patient’s anatomy was limited to using flat screens and radiographs [4]. Visual inspection and direct manipulation of handheld models are made possible using 3D printing [5]. Tactility is the element, which makes the experience more realistic for the surgeon [6]. Vaishya et al. [7] mapped the publication trends and knowledge in 3D printing in orthopedics in PubMed and Scopus, where the number of publications after 2013 began to grow rapidly. 3D printed models allow interactive studying of the morphological features of anatomical objects, teaching, and learning of high-risk operations that are challenging to teach. Anatomical models have been used in different fields of medicine, including orthopedics, maxillofacial surgery, cardiology, and forensic medicine. By using these models, it is possible to see detailed anatomy in advance. Advantages of using 3D printed models in research also include the usage of patient-specific computed tomography (CT)/magnetic resonance imaging (MRI) data, accurate morphology, avoiding ethical problems of using cadaveric specimens, overcoming a limited number of cadaveric specimens, lack of odor and sanitary precautions, no requirement for a special condition for storage, and an acceptable price [8].
Haleem et al. [9] analysed the benefits of design and development of an orthopedic model using additive manufacturing based on CT and MRI scans. Zadpoor et al. [10] investigated the use of different technologies for the production of biomaterials, tissues, and organs. Skrzat et al. [11], Clifton et al. [12], and others dealt with the design and 3D printing of hard and soft tissues [13,14,15]. Ganguli et al. [16], Salmi et al. [17], and Anderson [18] discussed the possibility of using models for preoperative and surgical planning and teaching [2,5,19,20]. They also offer a potentially new medium for improving doctor-patient communication and understanding. Bernhard et al. [21], Biglino et al. [22], and others used a printed model for patient education [23,24,25]. Simulation-based surgery training with anatomical models reduces operating room time, risks of surgical interventions, and healthcare costs [26,27]. George et al. [28], Hedelin et al. [19], and others analyzed the suitability of 3D printing for anatomical model production and surgical planning in terms of the accuracy of 3D printing [1,15,29].
Additive manufacturing (AM) is the process of joining materials to make objects from three-dimensional (3D) model data, layer by layer, as opposed to subtractive manufacturing methodologies, which have many advantages over traditional manufacturing processes [30,31,32]. Although AM has been popular since the 1980s, it has recently received much attention because advances in the technology have made it possible to produce almost anything. The application of 3D printing in medicine has grown exponentially in the last decade because of the decreased cost, computer engineering, and ever-growing applications [33]. 3D printers make it feasible to fabricate anatomical models from CT and magnetic resonance (MR) images [34]. The international standard format for these imaging files is Digital Imaging and Communications in Medicine (DICOM) [35]. The ability to rapidly progress from DICOM images to 3D printing using low-cost printers and materials has opened the use of 3D printing for medical applications [18,36]. The data segmentation is performed to isolate the anatomical area(s) of interest and to generate a “surface mesh” of that area (e.g., a single target vertebra). The standard tessellation language (STL) file is then transferred to a 3D printer for production [30]. A variety of techniques can be used to print these models, including fused filament fabrication (FFF), selective laser melting (SLM), selective laser sintering (SLS), and stereolithography (SLA). There is a variety of materials with different properties, costs, and colors suitable for specific 3D printing techniques [1,37]. The technique often used for this purpose is fused filament fabrication, which uses thermoplastic materials (e.g., polylactic acid (PLA) and acrylonitrile butadiene styrene (ABS)) for model production [1,28]. The accuracy of 3D printed models is affected by each step involved in the design process in computer-aided design (CAD) software. Anatomic or geometric defects can also occur during STL model printing and postprocessing [29]. To declare that a 3D printed replica of a human organ is morphologically and anatomically correct, research involving different types of scanning technologies and measurement techniques need to be applied.
One of the aims was to create a simple methodology for vertebra segmentation using medical, mechanical, and open-source CAD software. One vertebra model was then selected for fabrication using a low-cost desktop FFF 3D printer. Finally, the geometric accuracy of the printed vertebra was verified using different types of scanning technologies and measurement software.

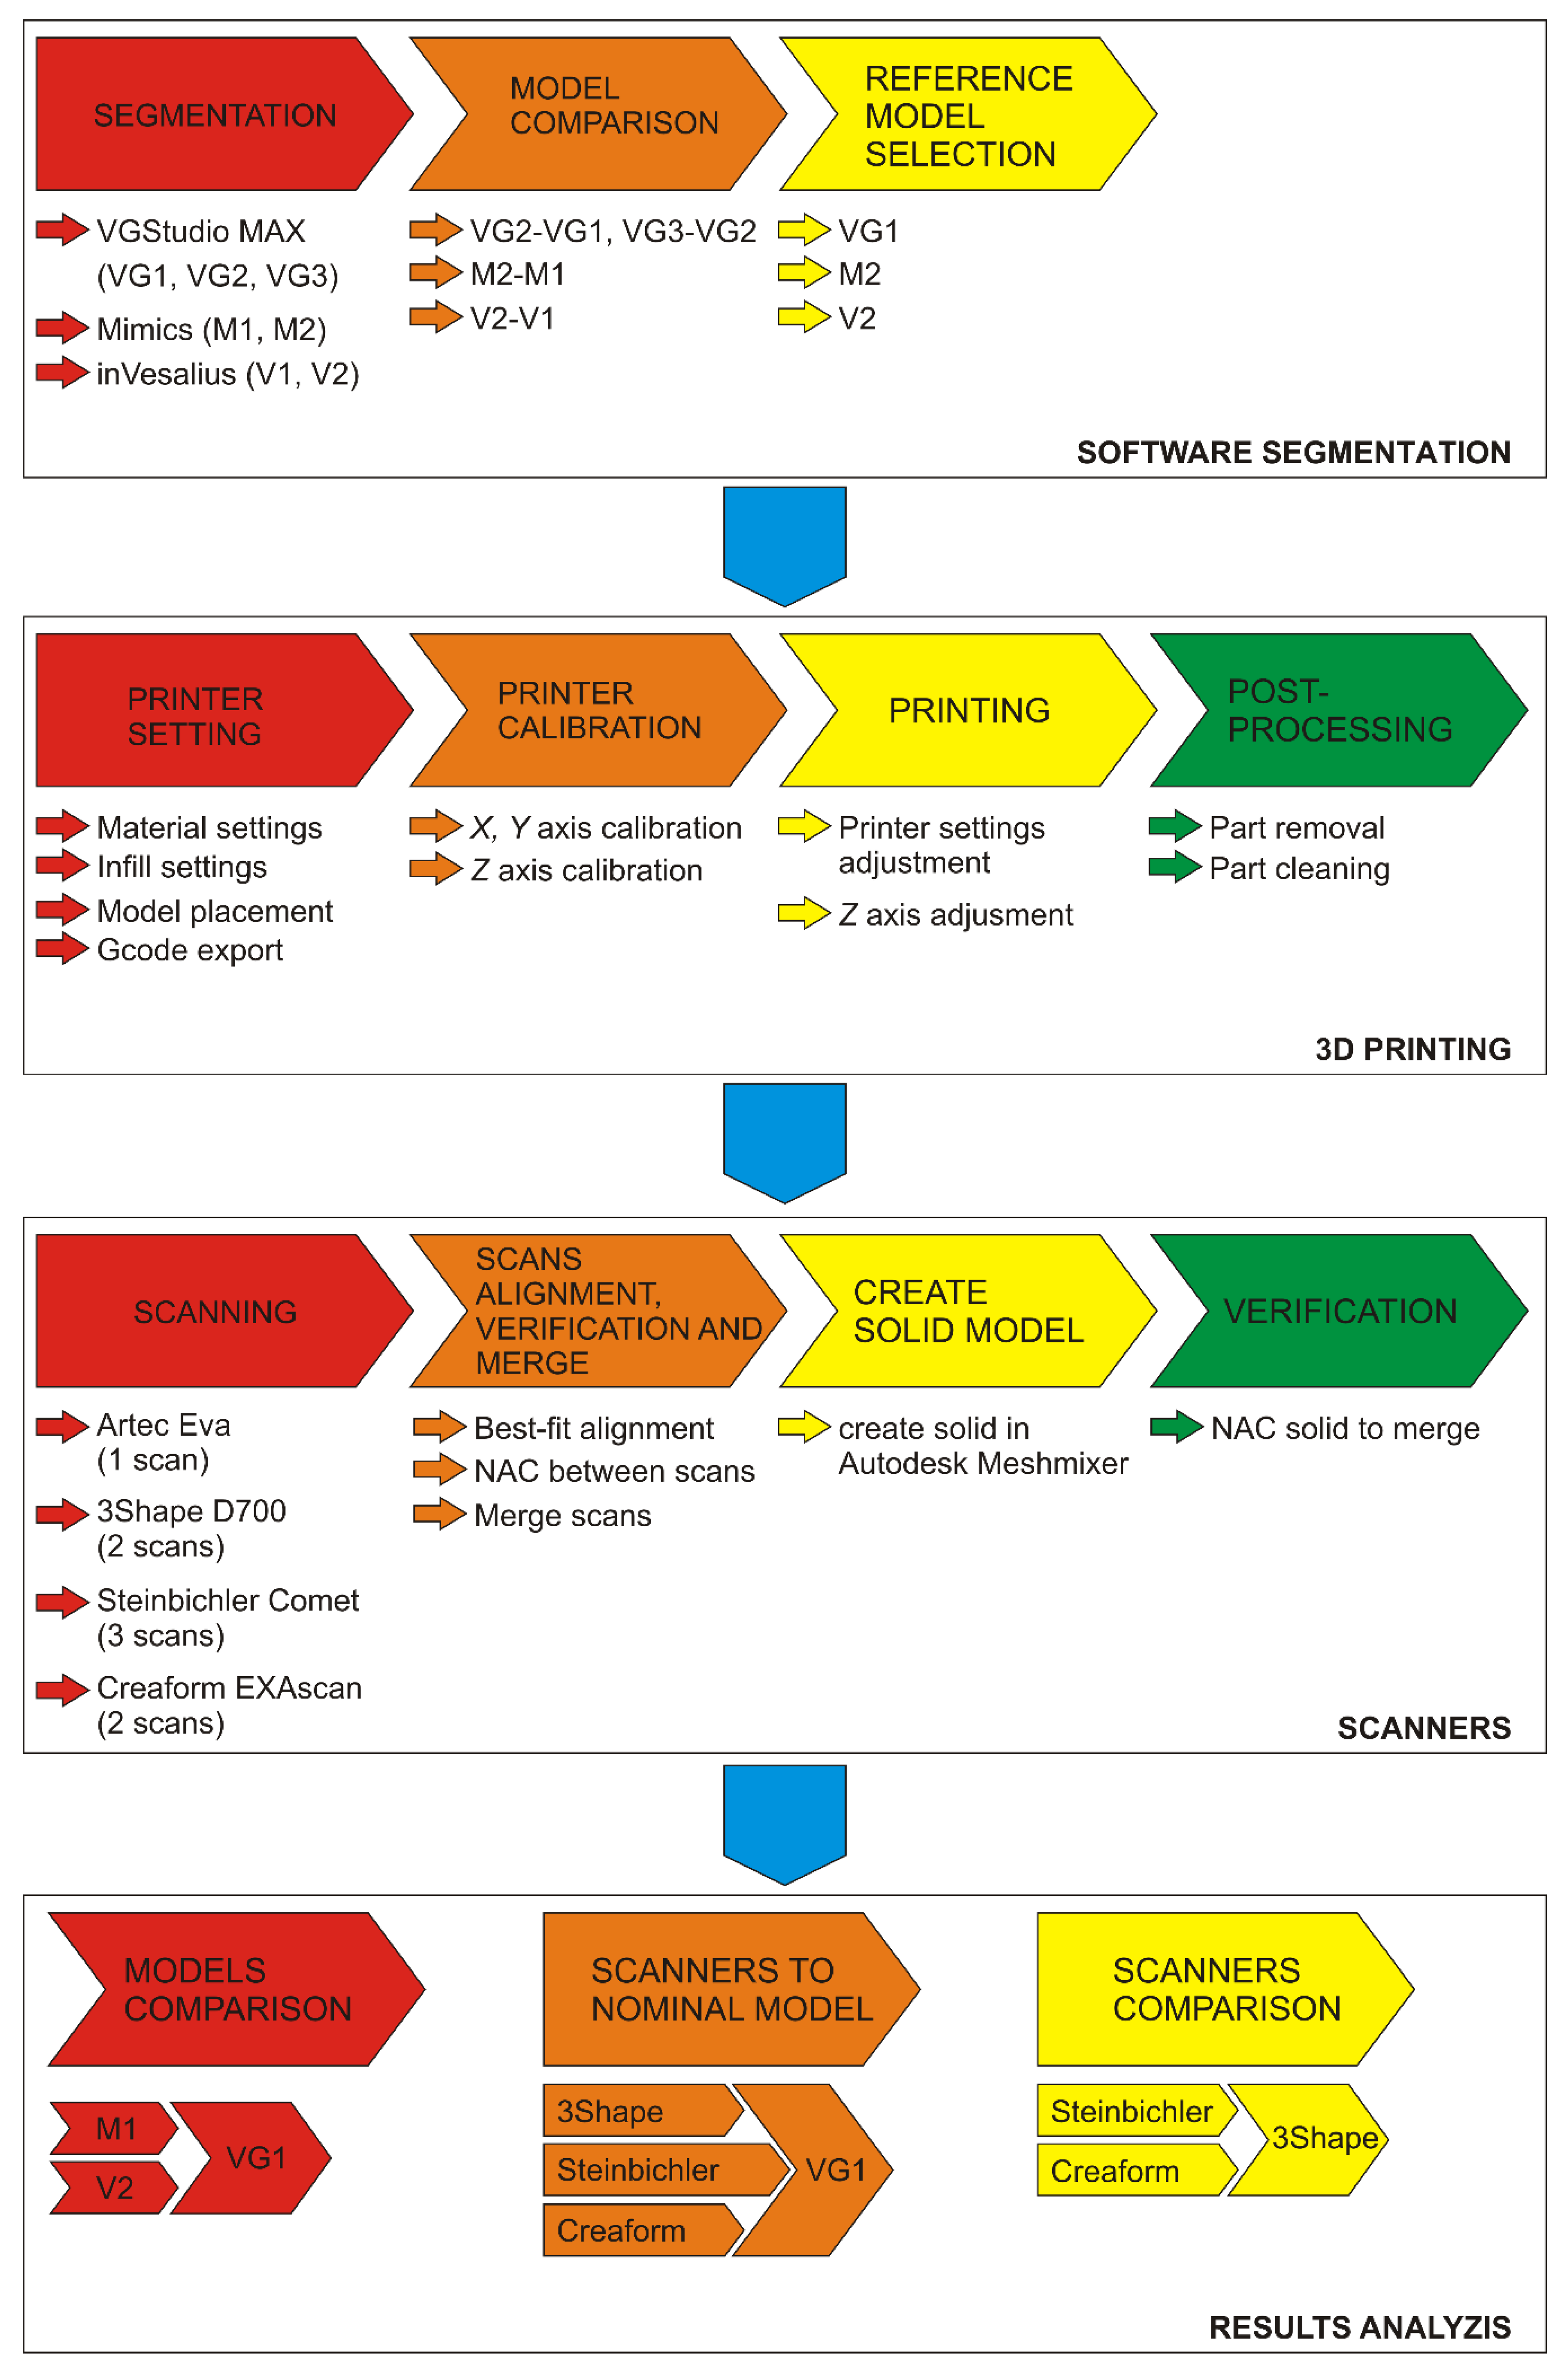
2. Materials and Methods

Given that the study deals with several aspects of model creation, sensing, and evaluation of results, it can be divided into four basic parts:
  • CT data processing and analysis of results
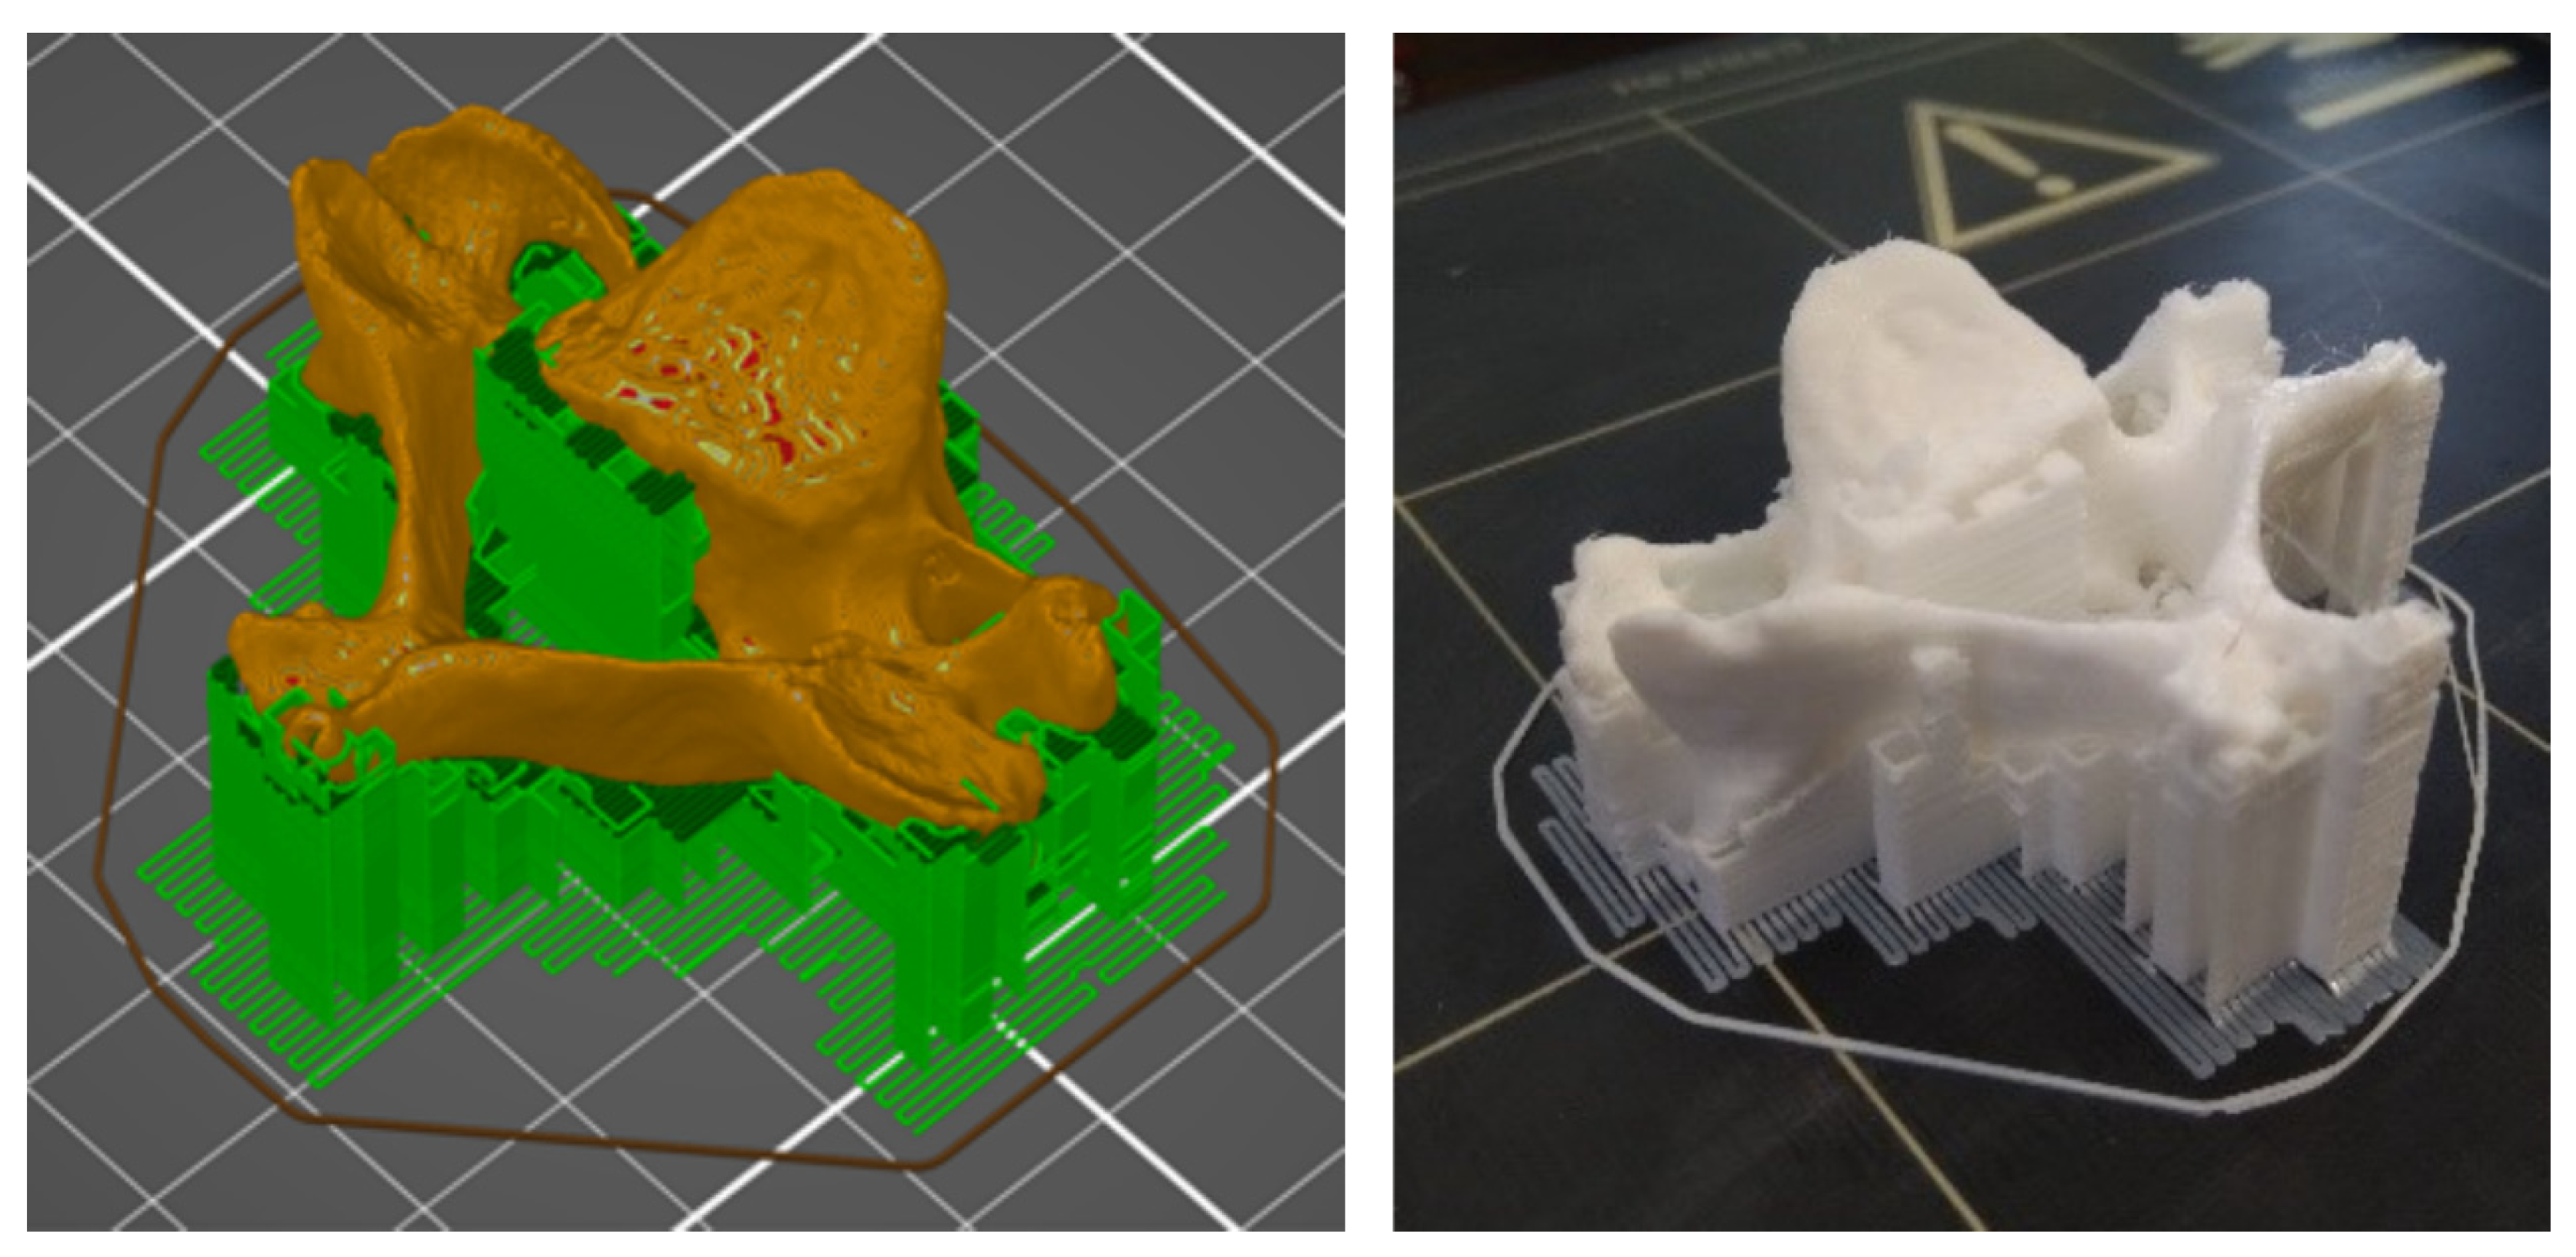
  • Model production using additive manufacturing on a low-cost FFF 3D printer
  • Scanning with 3D scanners and processing of acquired data
  • Analysis of the obtained results
The procedure is shown in (Figure 1), wherein the individual operations and their content are color-coded.
The “Software segmentation” section describes the procedure for vertebra segmentation for each software. For VGStudio MAX (Volume Graphics, Heidelberg, Germany), three types of threshold settings, VG1, VG2, and VG3, were used for differences evaluation comparisons between VG2 to VG1 and VG3 to VG2 models. For each of Mimics (Materialise, Leuven, Belgium) and inVesalius (Center for Information Technology Renato Archer (CTI), Campinas - São Paulo, Brazil), two threshold settings were used (M1 and M2 and V1 and V2), the first based on the pre-set value for bone and the second based on data from VGStudio MAX. The results of the comparisons are reference models for each software. The section “3D printing” shows the procedure of production and postprocessing of the vertebra model. The “Scanners” section describes the procedure for scanning the model with each scanner, processing individual scans and verification. The section “Result analysis” describes the process of data analyses.

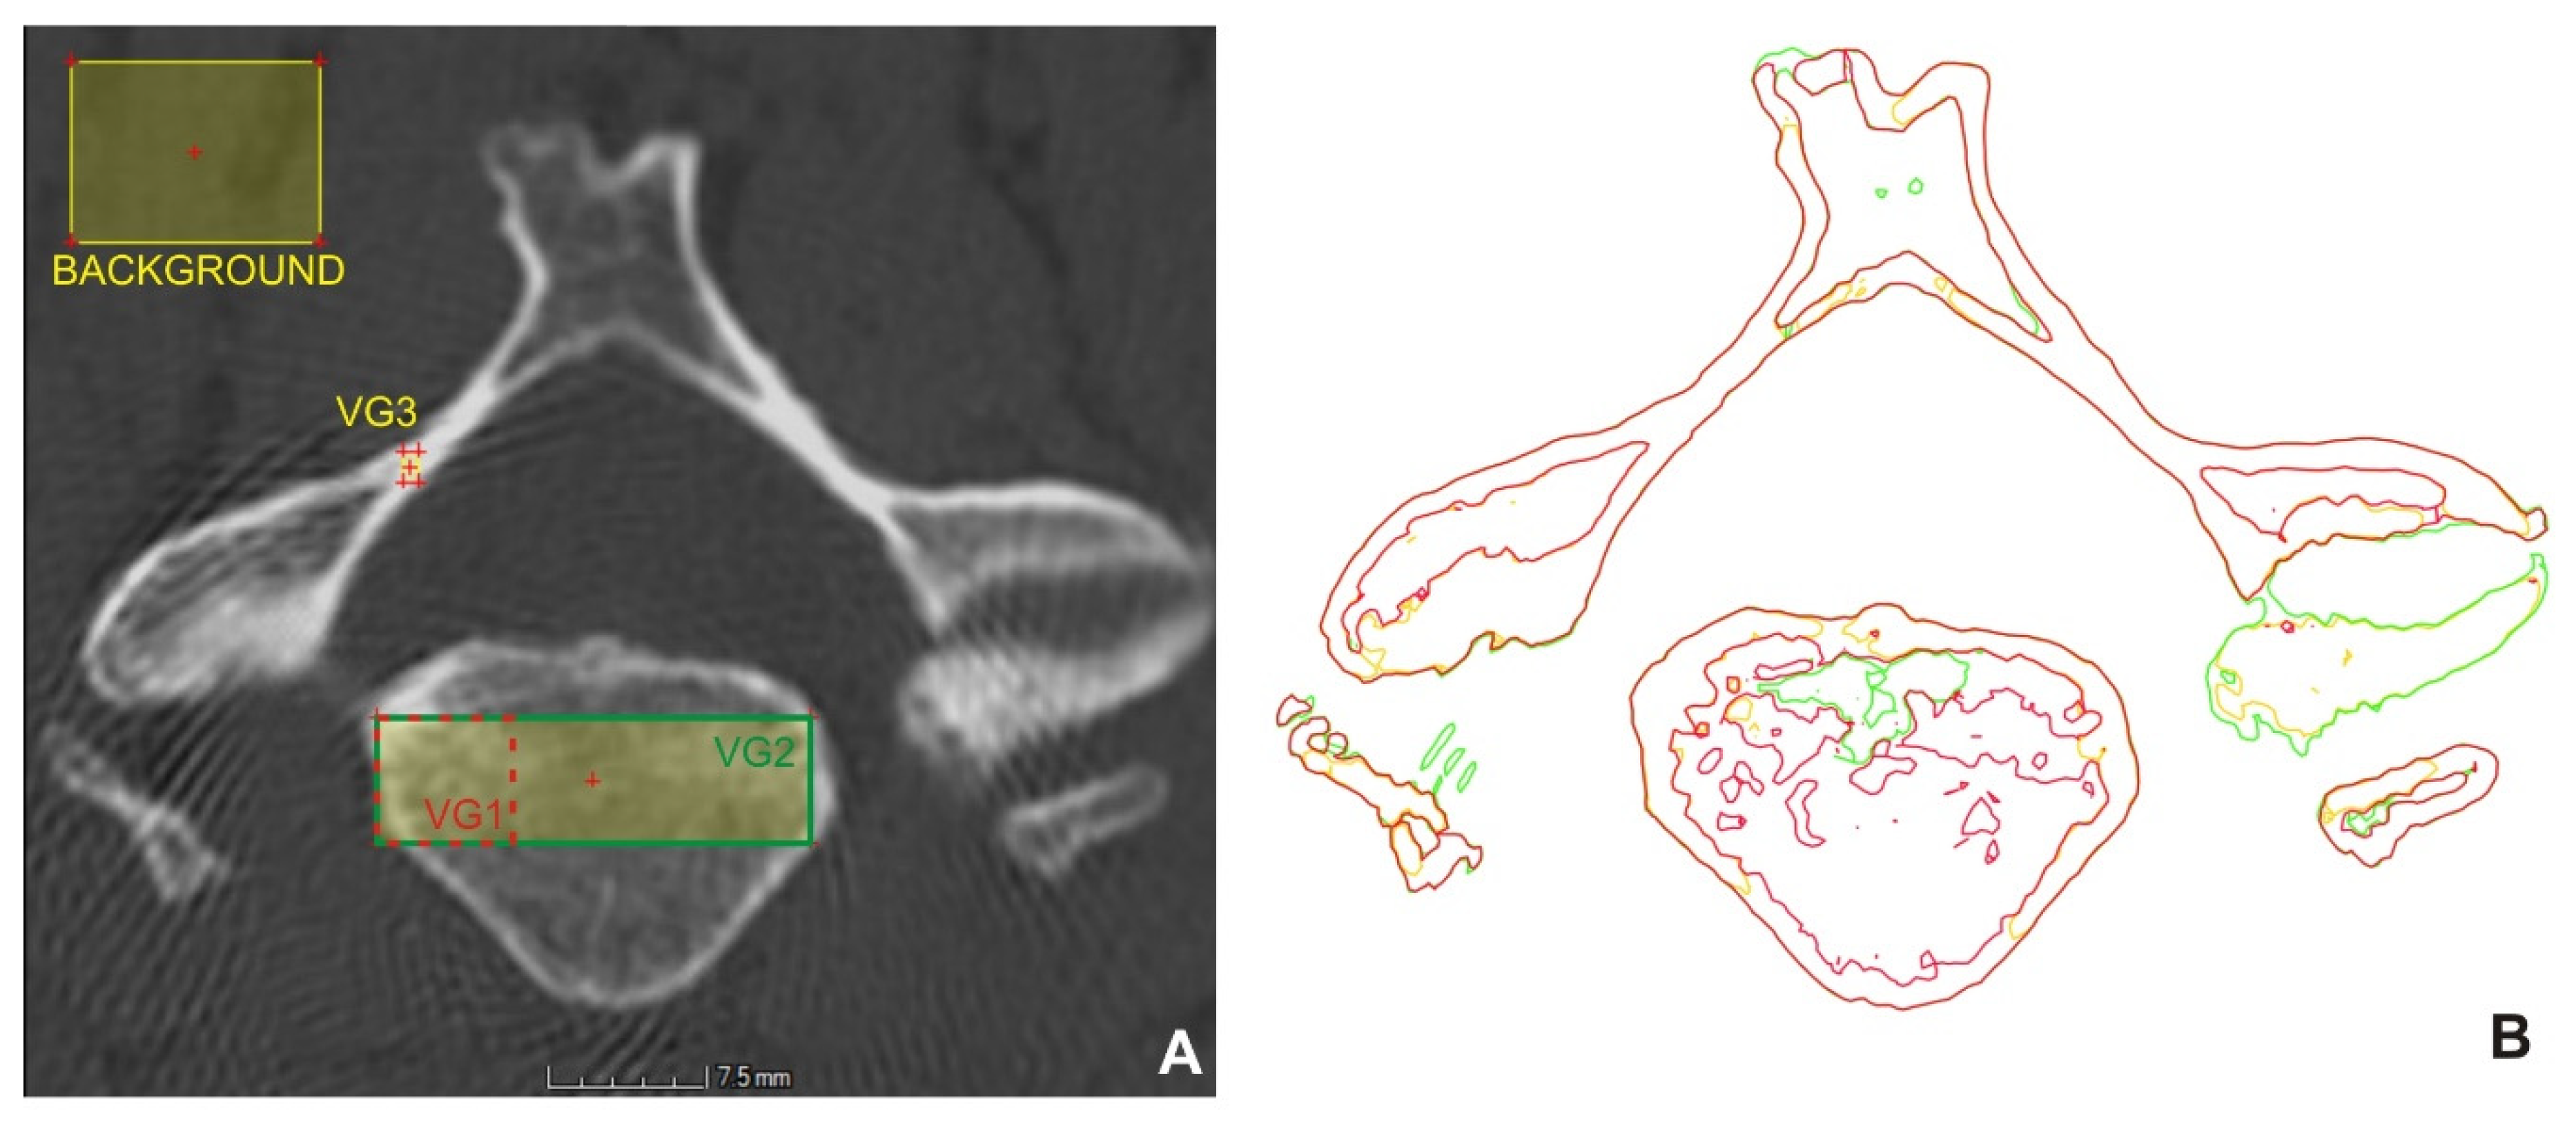
2.1. Processing of CT Data and Results Analysis

CT scan from the cervical area of the spine in the DICOM format with a resolution of 0.287 × 0.287 × 0.625 mm and a scanned volume of 147 × 147 × 194.375 mm were used as the input data. Used CT scan does not include any type of personal data. The data were processed in Mimics (Materialise, Leuven, Belgium), VGStudio MAX (Volume Graphics, Heidelberg, Germany), and inVesalius (Center for Information Technology Renato Archer (CTI), Campinas - São Paulo, Brazil). Mimics is designed for data processing of medical tomographs and MRI devices, VGStudio MAX for data processing of industrial computed tomographs, and inVesalius is a freely available medical data processing software. The aim is to determine the impact of the software used on the resulting model, as well as to analyze the differences between the individual software in terms of the complexity of segmentation and modification of the 3D model of the selected vertebra.

2.1.1. Data Processing Methodology in VGStudio MAX

The methodology of basic data processing for surface obtaining of the selected vertebra can be divided into three points:
  • Creation a region of interest for the selected vertebra
  • Determination of the surface of the bone structures
  • Extraction of the selected vertebra
Data is imported into VGStudio MAX in DICOM format. For ease of data processing, an extracted region of interest (ROI) was created containing a third cervical vertebra and parts of adjacent vertebra. In VGStudio MAX, it is not possible to determine the surface of the sample based on predefined values for tissues (standard in medically oriented software); therefore, the only way is to use the histogram or a manual setting of the background and material. For objects where the density is not constant, or it consists of several materials, it is necessary to determine the isosurface manually.
Thresholding is necessary for generating a region for the extraction of the selected vertebra. Setting the parameters for the surface has a significant effect on the resulting surface of the object and its accuracy.
Within the extracted ROI, the surface was determined manually by setting the background and material and using the “Advanced option” with the search distance of 2 mm and starting the contour healing option with “Remove particles and all voids” selection. Within the surface creation, three settings of the background and material parameters were tested. Figure 2A shows the regions for determining the surface (VG1 red, VG2 green, and VG3 yellow), and in Figure 2B, colored lines show the boundaries for determining the surface for each setting. If only one of the lines is visible, the lines overlap.
In the setting of VG1, the material was focused on the cortical part and the denser area of cancellous tissue. In the setting of VG2, the selection was set on both the cortical and cancellous part of the bone, and in VG3, only the cortical bone (Figure 2A). The background was created in all settings in approximately the same place. The values are given in Table 1.
Based on the boundary of the bone structures (Figure 2B), it could be stated that the setting of VG1 differs from the setting of VG2 mainly in the number of details of the internal structures of the vertebra and in the lower level of noise.
Errors on the desired vertebra and internal structures were removed, as they are not needed for 3D printing. The created region was used as the starting contour to determine the final surface of the selected vertebra. The resulting vertebra was exported to the STL file format by the super-precise setting, with a tolerance of 0.072 mm, and without simplification. It took approximately 30 min to create the model.

2.1.2. Methodology of Data Processing in Mimics

The procedure in Mimics consisted of the import of DICOM data, where the first step was to set the range of threshold values for the bones in the coronal section. It had a value of 226 to 3071 HU, while the given area was marked in green to simplify segmentation. To refine the segmentation of the cervical vertebra, the region growing tool was used, and unnecessary parts were removed, and the selected vertebra was marked in purple. After marking, a finished 3D model of the vertebra was created, from which the STL file was subsequently exported for surface comparison. The model at these parameters was designated as M1. The vertebral model creation time was approximately 45 min. The same procedure was used to create the M2 model based on the data from VGStudio MAX for setting VG1 (394; 3071). The output from VGStudio MAX was used due to the wide range of threshold settings. The aim was to determine the effect of the threshold value on the resulting model.

2.1.3. Methodology of inVesalius Data Processing

Initially, it was necessary to import DICOM data and select a set of images. Subsequently, thresholding was performed on the “bone” selection with the value (226; 3071) HU marked as V1 and based on the data from VGStudio MAX (394; 3071) Hounsfield units (HU) marked as V2.
The vertebra model was created in two methods, without affecting the surface of the selected vertebra. In the V1 model, the unnecessary segments were removed in inVesalius. The next step was to create a surface using the “Create surface” function and export it using the “Export 3D surface” function. In the second method on the V2 model, a surface was created from the entire CT scan and exported. Unnecessary parts of the model were removed in Meshmixer (Autodesk, San Rafael, California, USA). The aim of the two different approaches was to determine the time required to process the CT image. In the first method, the model creation time was approximately 45 min, and in the second, the data export time was 5 min, and the software processing approximately 20 min. To find out the differences between the V1 setting and the V2 setting, their mutual comparison was performed in VGStudio MAX, where the V1 setting was used as nominal and V2 as actual.

2.2. Additive Manufacturing of a Vertebra Model

The vertebra model was produced from white polylactic acid (PLA) filament, using a Prusa i3 MK2.5 MMU1 (Prusa, Prague, CZ) FFF 3D printer, and the settings were generated in PrusaSlicer (Prusa, Prague, CZ). The thickness of the filament used was 1.75 mm, the nozzle diameter was 0.4 mm, and the nozzle temperature was set at 220 °C. The printer resolution was 0.050 mm to 0.350 mm, and the layer thickness was 0.150 mm. Printing accuracy is approximately 0.25 mm. The layer thickness (resolution in the Z-axis) of the CT scan was 0.625 mm, so the selected thickness of the printing layer was sufficient. The printing bed temperature was 65 °C, and the print speed was reduced to 65% of the original settings to prevent the model from detaching from the print bed. The fill density of the model was set to 50% with a hexagonal fill pattern. The estimated printing time was about 2.5 h, but in real-time it was 3 h. Approximately 0.015 kg of 4.55 m long material was used during printing. (Figure 3) shows the placement of the model on the printing bed and the printed vertebra model.

2.3. Methodology of Scanning with 3D Scanners

Different types of scanners were used for scanning—an Artec EVA optical handheld scanner, a 3Shape D700 dental scanner, a Steinbichler Comet L3D 2M stationary optical scanner, and a Creaform EXAscan laser handheld scanner. The aim was to find out the suitability of using individual scanners to digitize the vertebra model we produced.

2.3.1. Artec Eva scanner

Artec Eva is a handheld optical 3D scanner, and it was chosen for its practicality and accuracy. During scanning, the highest scanning frequency of 16 fps (frames per second) was chosen, and the model was scanned on a white surface. The scanning process took approximately 2 min and ran successfully without any complications. The scanned model was insufficient, as the obtained 3D model clearly shows deformities. Therefore, it was not used further in the experiment.

2.3.2. 3Shape D700 Scanner

Further scanning was performed on a 3Shape D700 dental 3D scanner (3Shape A/S, Copenhagen, Denmark). The scanning accuracy value is in the range from 0.010 to 0.012 mm. The scanning process took approximately 5 min. The models were scanned in two positions. The models were exported to STL files and imported into VGStudio MAX, where they were aligned with each other using the “Best-fit” function and combined into one part using the “Merge” function.

2.3.3. Steinbichler Comet L3D 2M system

The Steinbichler Comet L3D 2M scanner (Carl Zeiss Optotechnik, Oberkochen, Germany) is a 3D scanner using the principle of structured light. The type used was equipped with two-megapixel sensors and optics with a field of view (FOV) of 400 mm. A rotary table was used to scan the vertebra model. The resolution for the given specification was a point-to-point distance of 0.250 mm and a sphere spacing error of 0.025 mm. Scanning was performed in three positions, with 20 rotations for each scan to capture the entire vertebral surface. Unnecessary parts of the scan were removed, and an STL file was generated. The total scanning and postprocessing time was 40 min. The scans were then imported into VGStudio MAX, where they were aligned using the “Best-fit” feature and combined into one part using the “Merge” function.

2.3.4. Creaform EXAscan system

EXAscan (Creaform, Lévis, Québec, Canada) is a portable laser 3D scanner with a volumetric accuracy of ±0.055 mm according to the calibration protocol. The model was scanned in two positions with a point-to-point resolution of 0.200 mm. The noise was removed after each scan. Scanning and editing of scans took about 60 min, while software processing and postprocessing took about two-thirds of the time. The scans were imported into VGStudio MAX, aligned with each other using “Best-fit”, and combined into one part using “Merge”.

3. Results

The results were divided into three parts; the first one deals with the results of data processing in all software, the second part deals with the evaluation of the processing of 3D scans and the accuracy of the conversion of the scan to a solid model. The third part deals with the accuracy of production on a low-cost 3D printer and the accuracy of scanning.

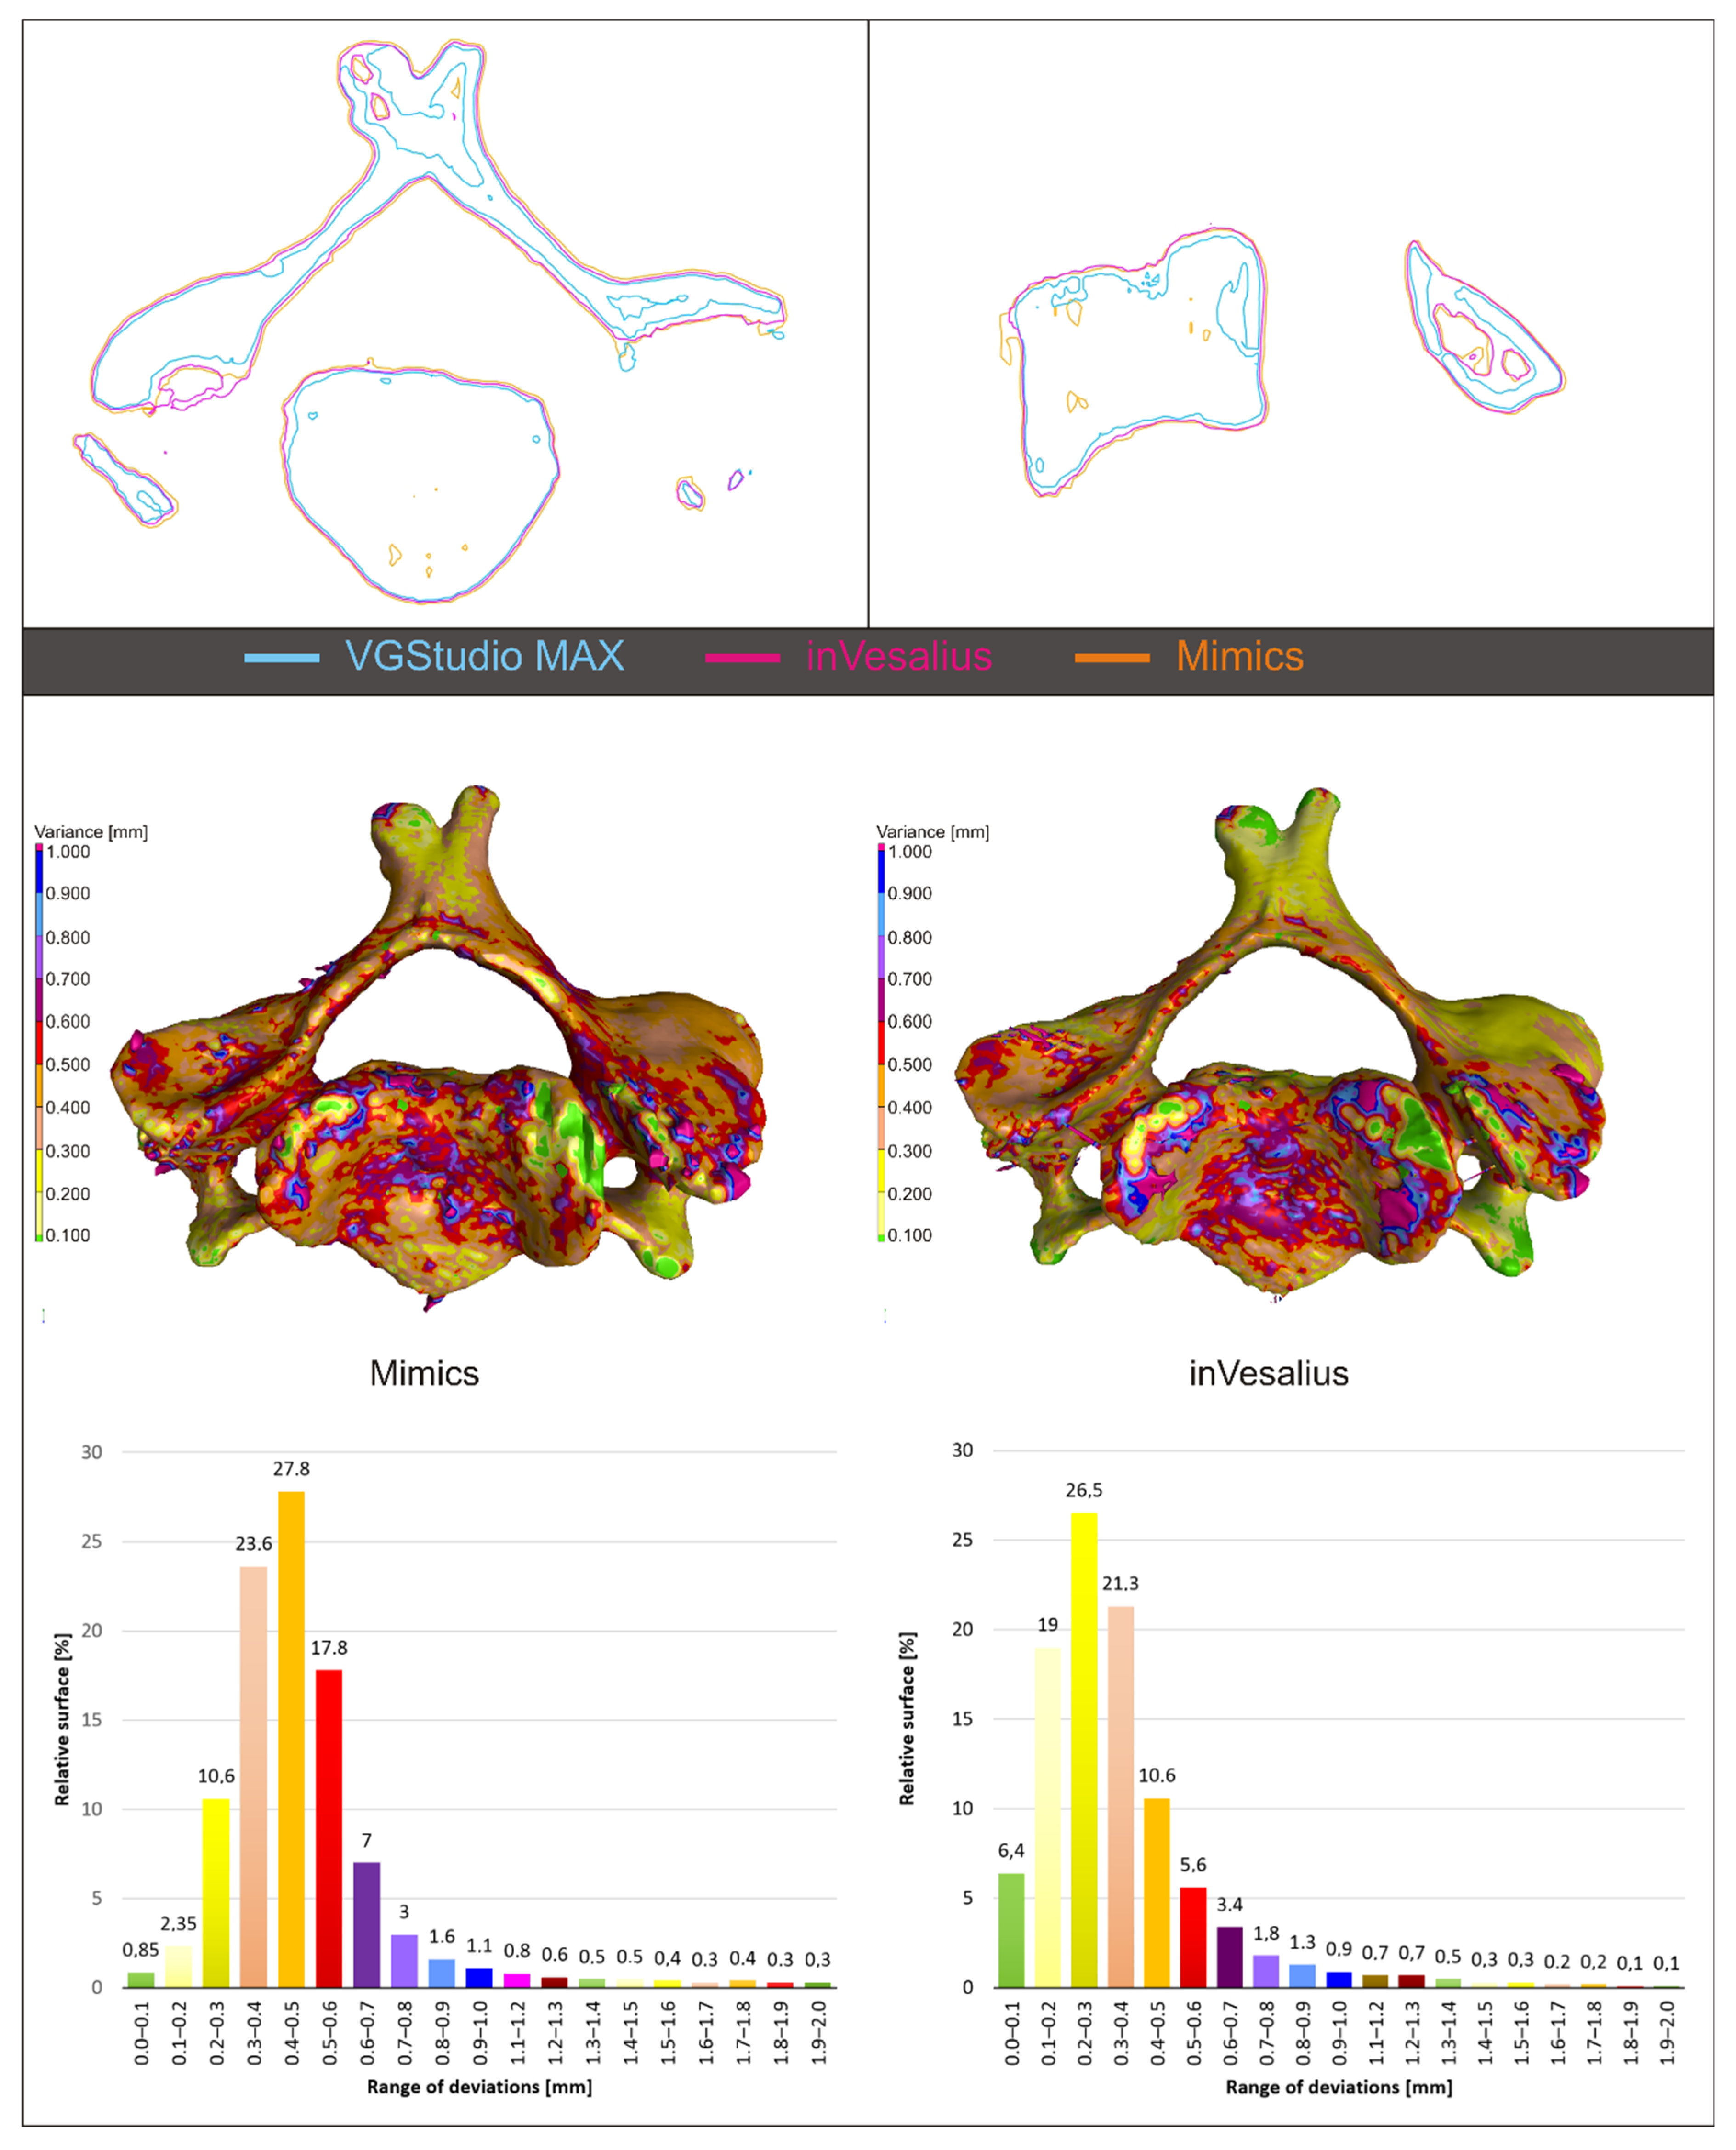
3.1. Results of Thresholding Comparison

3.1.1. VGStudioMAX

Figure 4A,B show the deviations between VG1 (actual) and VG2 (nominal) and the deviation histogram of Figure 3C. The models showed significant deviations only locally. The cumulative histogram shows that 84.79% of the surface has a deviation of less than 0.050 mm, and the histogram of the distribution of deviations shows that the average value for the interval ±0.050 mm was −0.0082 mm and the whole comparison interval ±0.200 mm was −0.031 mm. The VG3 setting, compared to the previous settings (VG2 to VG1), delimited unambiguous bone structures, but if the structure was a lower thickness or a lower density, the software did not identify it as a bone.
Figure 4D shows the comparison of VG3 (actual) to VG2 (nominal), where the cumulative histogram showed that 72.42% of the surface had a deviation of less than 0.050 mm, and that the histogram of the distribution of deviations showed that the average value for ±0.050 mm was −0.011 mm and for the whole comparison interval ±0.200 mm was −0.074 mm. The models showed more significant deviations only locally due to missing structures (Figure 4D, pink color).
In Figure 4, the green border represents deviations less than ±0.050 mm, pink greater than +0.050 mm, and purple greater than −0.050 mm. The comparison was performed in VGStudio MAX’s “New actual/nominal comparisons module” with a maximum search distance of 0.200 mm.

3.1.2. Mimics

The comparison was performed in VGStudio MAX where the M1 setting was used as nominal and M2 as actual. The cumulative histogram shows that 93.79% of the surface between M2 (actual) and M1 (nominal) had a deviation of less than 0.050 mm and the histogram of the distribution of deviations show that the average value for ±50 mm was −0.009 mm and the whole comparison interval ±0.200 mm was −0.013 mm. There was no significant differences between the models.

3.1.3. inVesalius

The cumulative histogram shows that, for the comparison of V2 (actual) to V1 (nominal), 93.13% of the surface had a deviation of less than 0.050 mm, and the histogram of the distribution of deviations show that the average value for ±50 mm was 0.00011 mm and the whole comparison the interval ±0.200 mm was −0.0013 mm. There were no significant differences between the models.

3.1.4. Comparing Outputs from VGStudio Max, Mimics and inVesalius

The first step in comparing objects is their alignment based on a coordinate system or other methods (3-2-1, RPS – Reference Positioning System, Bestfit, …). The position of the vertebra did not change during their processing; it was not necessary to create a coordinate system in VGStudio MAX and Mimics or to align them with each other. inVesalius creates its own coordinate system when exporting, so it was necessary to align it to the nominal model. Due to differences between models, alignment was performed using the “Best-fit method”, with only the translation model allowed.
Figure 5 shows the mutual alignment of the output from VGStudio MAX (white line), Mimics (orange line), and inVesalius (purple line) in the selected section, with a clear offset between the surfaces being visible. The resulting STL models of vertebra were compared in the “New actual/nominal comparison module” of VGStudio MAX. Since the external surfaces of the models did not differ significantly within the individual software, VGStudio was selected as the reference model for the VG1 settings, from Mimics (M2) and from inVesalius (V2). The output from VGStudio MAX and the actual output from Mimics or inVesalius. The maximum search distance was set to 2 mm. The map of deviations is shown for 3D models in Figure 5, in the middle. To visualize the result, a histogram was created, where on the X-axis were intervals with a step of 0.1 mm representing the deviation and on the Y-axis is the relative surface for the given interval (Figure 5, at the bottom). The deviation histogram for the model from Mimics had the shape of a Gaussian curve, with the largest percentage surface for the 0.4–0.5 mm interval. For the model from inVesalius, it had the same trend, but there were visibly smaller deviations. The largest percentage surface had a deviation interval of 0.2–0.3 mm.

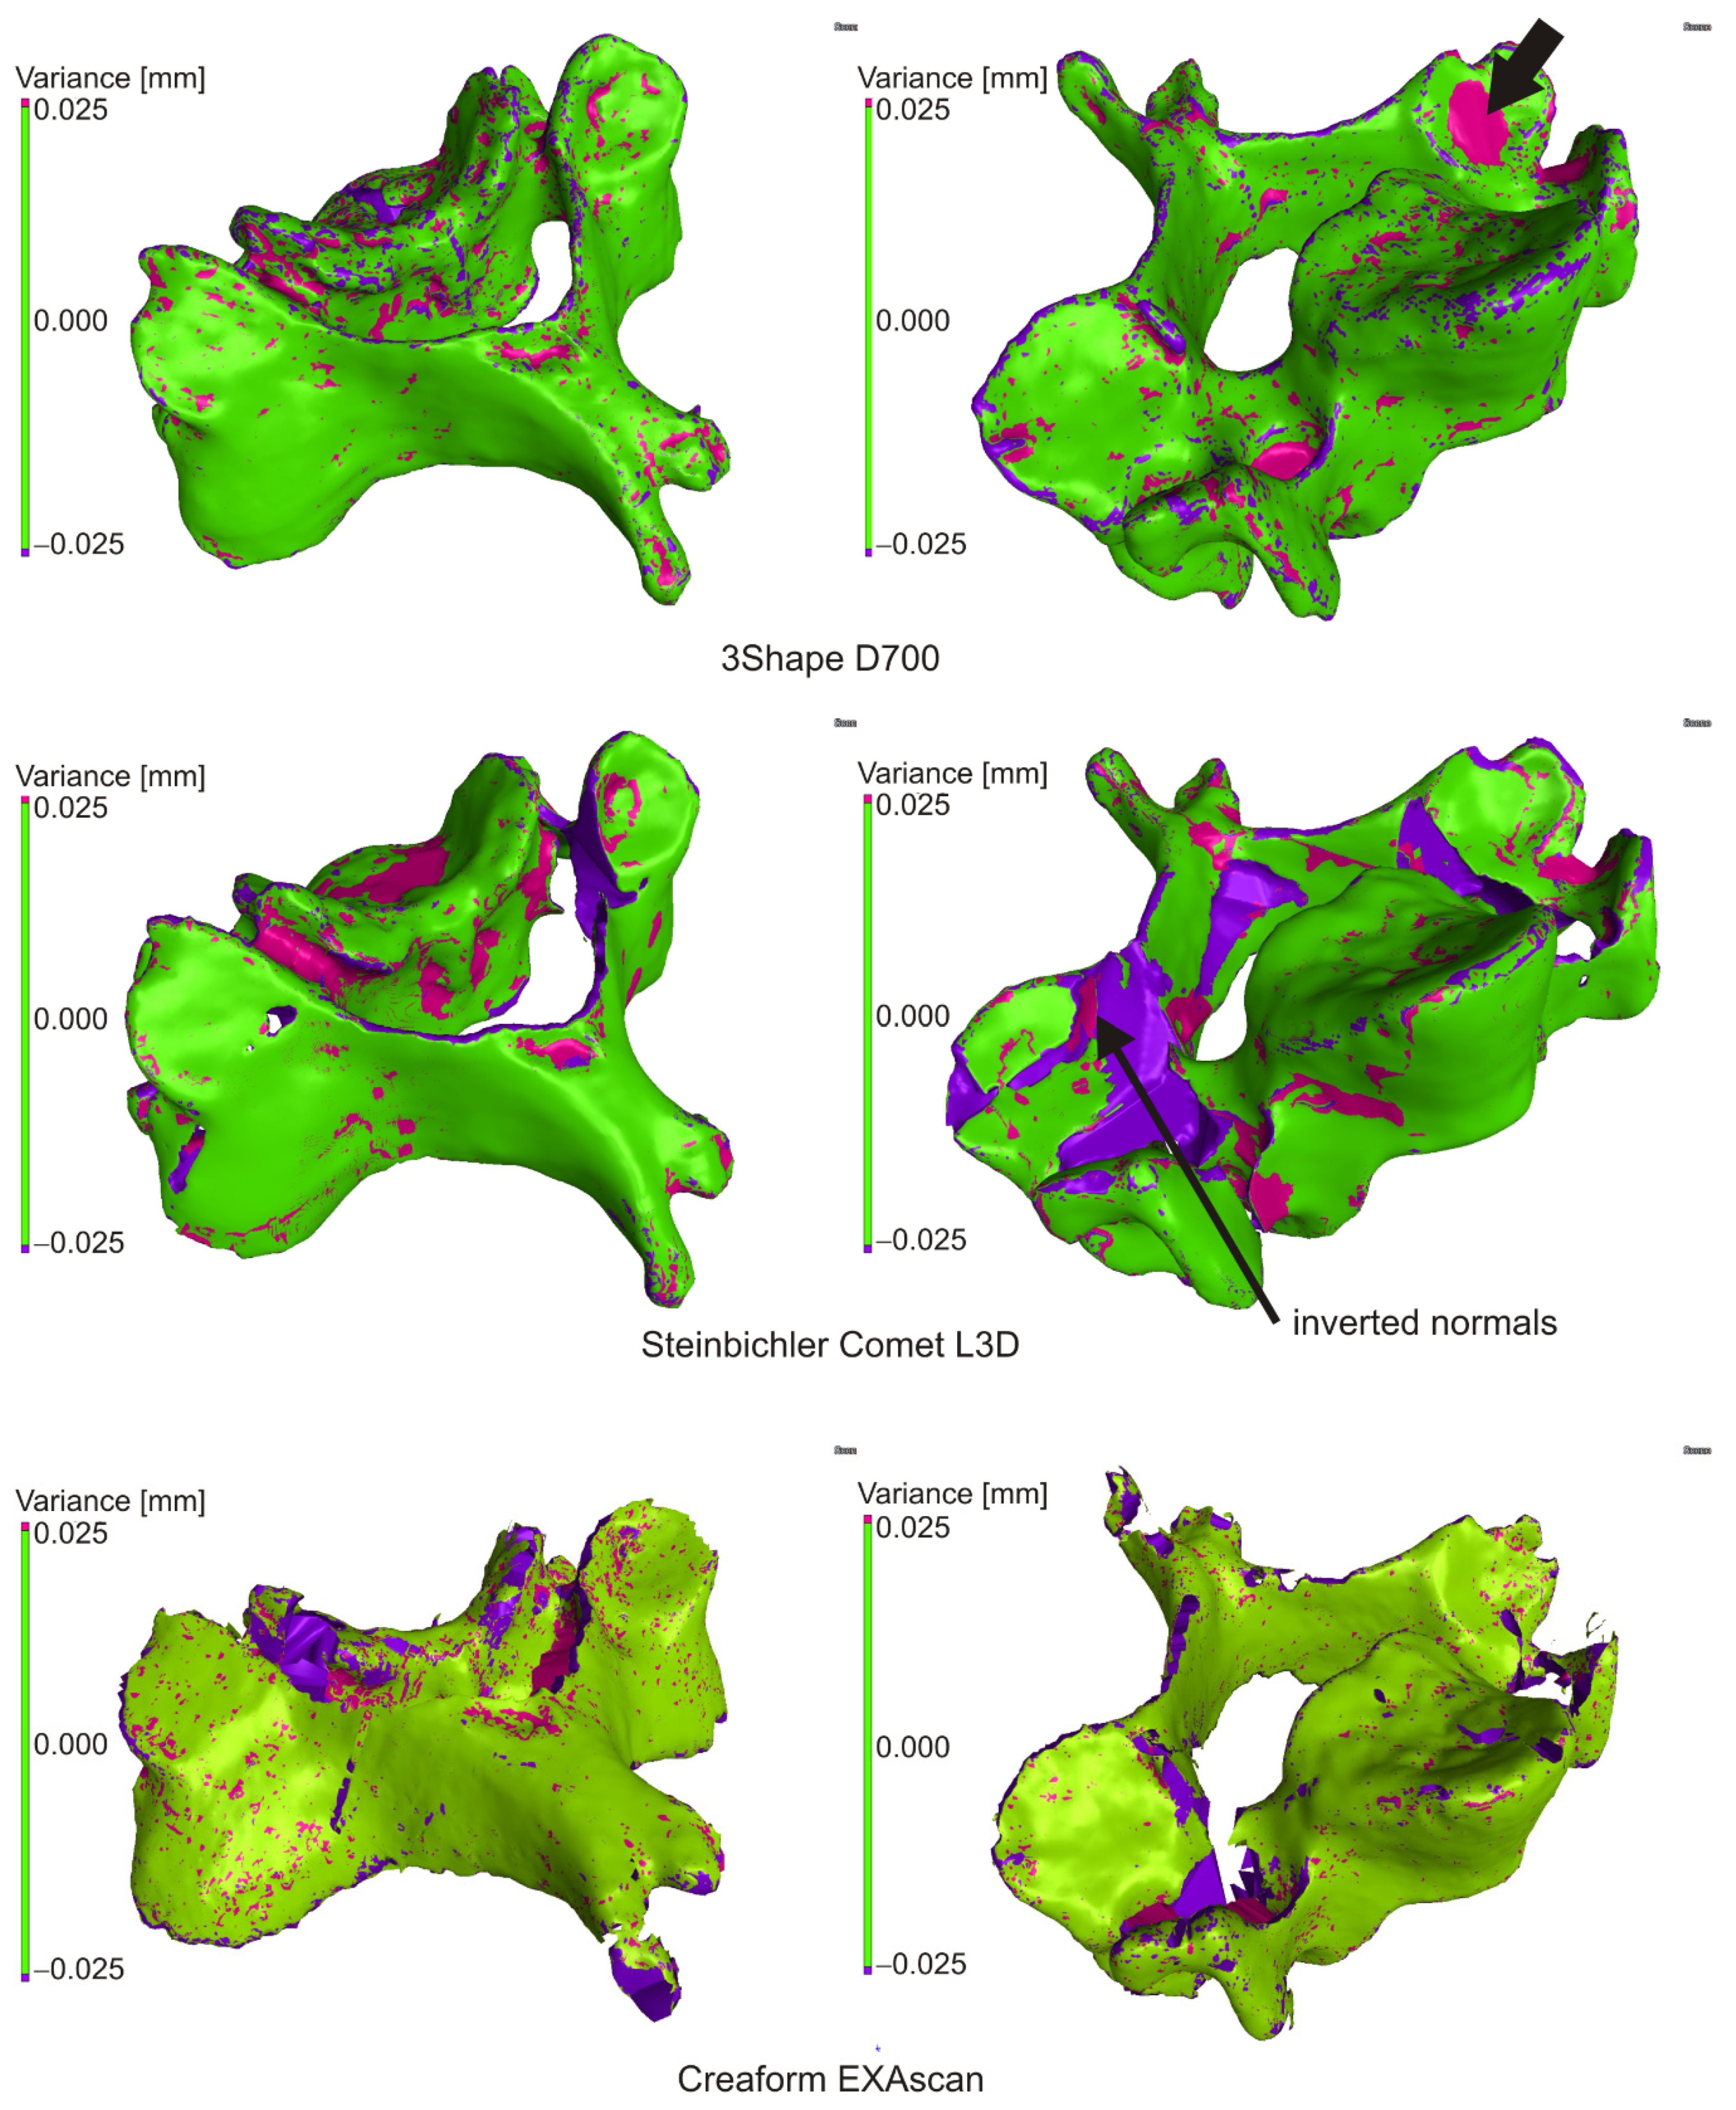
3.2. Checking the Creation of the Solid Model

The “Nominal/Actual comparison module” was used to check the result of the mutual alignment of individual scans in VGStudio MAX, with the deviation being set to the level of ±0.025 mm. The scans were combined into one scan using the “Merge” function. The created scan contains overlapping areas, which have been adjusted to one average in Meshmixer using “Make solid” with default settings. The resulting solid model was compared with the original “Merge model” in VGStudio MAX without the need for alignment. Due to scanning imperfections in Steinbichler Comet and Creaform EXAscan, errors occurred during the creation of the solid model. They could be identified due to large deviations from the original model.

3.2.1. 3Shape D700

The result of the comparison between the merge (nominal) and solid (actual) models are shown in Figure 6. Areas with a deviation of less than 0.025 mm are shown in green, with 82% of the entire surface having this value and 95% of the surface having a deviation less than or equal to 0.074 mm. The black arrow indicates an error that occurred when creating a solid model.

3.2.2. Steinbichler Comet L3D 2M

The result of the comparison of the mesh model and the generated solid model is shown in (Figure 6). The cumulative variance distribution implies that a deviation of less than or equal to 0.025 mm has 78.030% of the total surface, and 95% of the surface has a deviation of less than or equal to 0.248 mm. Significant deviations were in places, where creating a solid object, the software closed holes in the surface (edges, inaccessible places, etc.). The arrow shows the area with inverted normals and the error in generating the STL file.

3.2.3. Creaform EXAscan

Figure 6 shows a comparison of a mesh file and a created solid object from a scan generated by a Creaform EXAscan scanner at ±0.025 mm. Cumulative variance distribution implied that a deviation less than or equal to 0.025 mm had 69.030% of the total surface area, and 95% of the surface had a deviation less than or equal to 0.343 mm. Significant deviations were in places where, when creating a solid object, the software closed the holes in the surface and in some places where there was an incorrect closing of the holes and formation of beams.

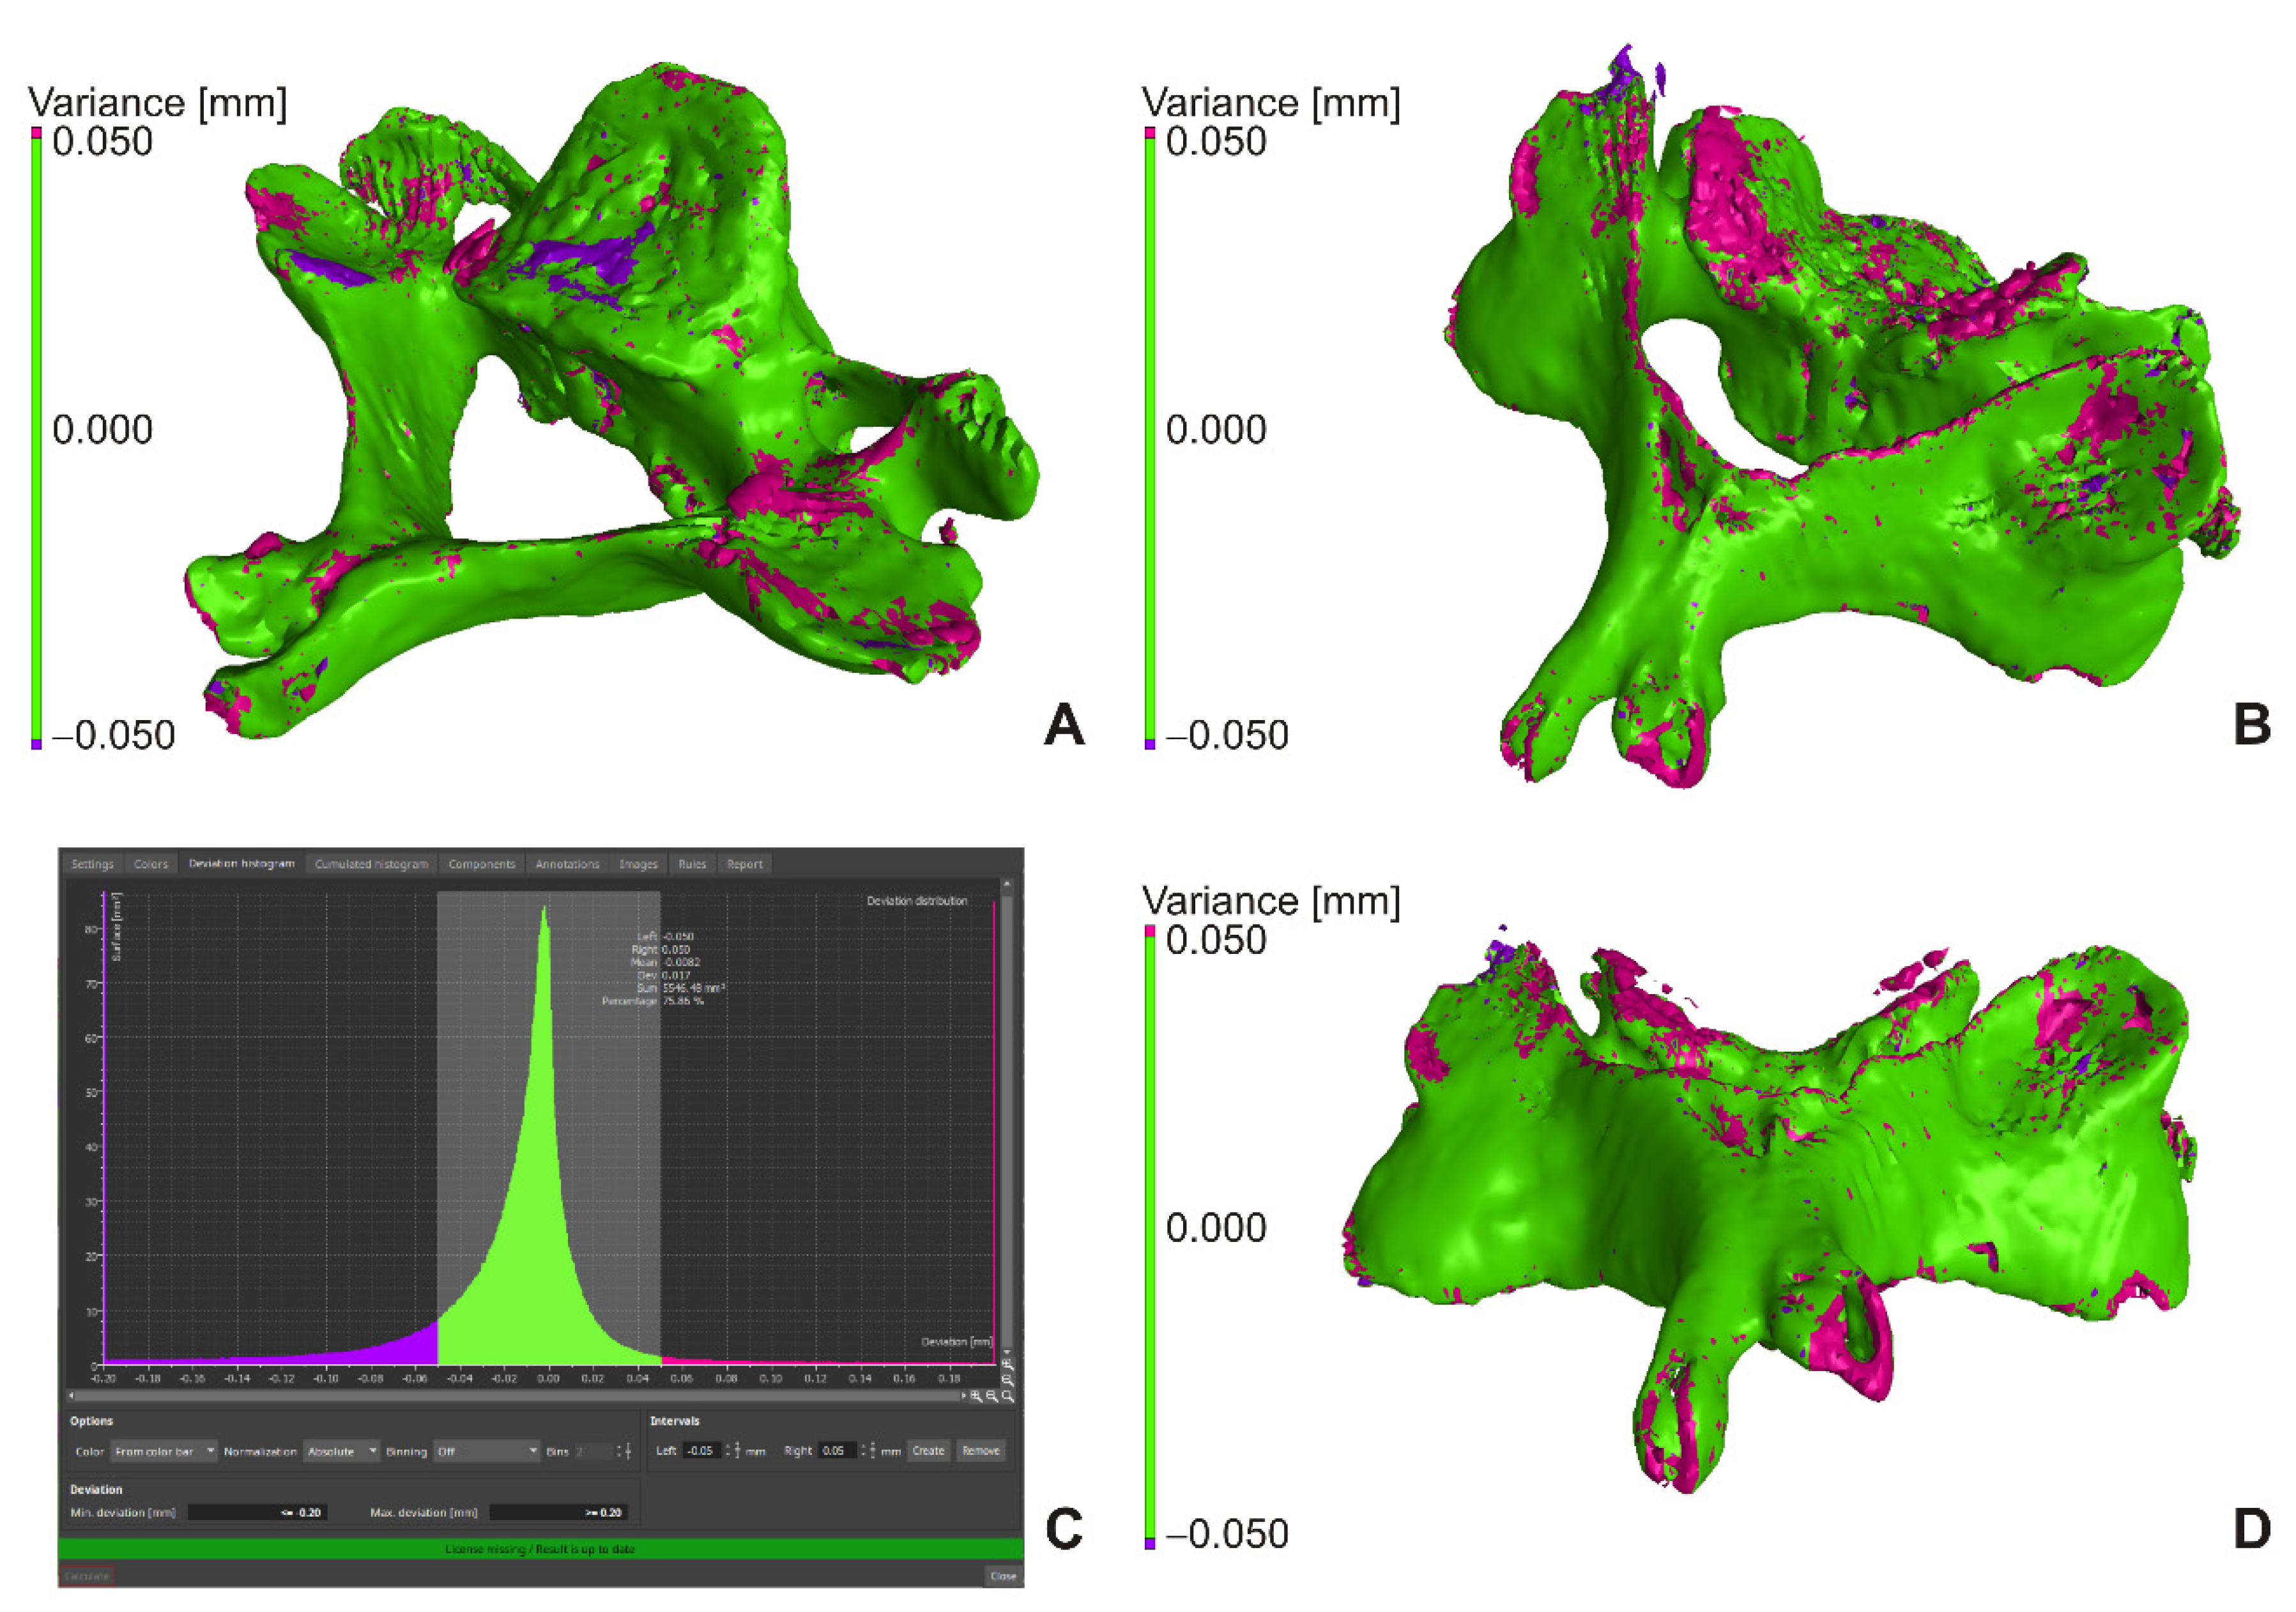
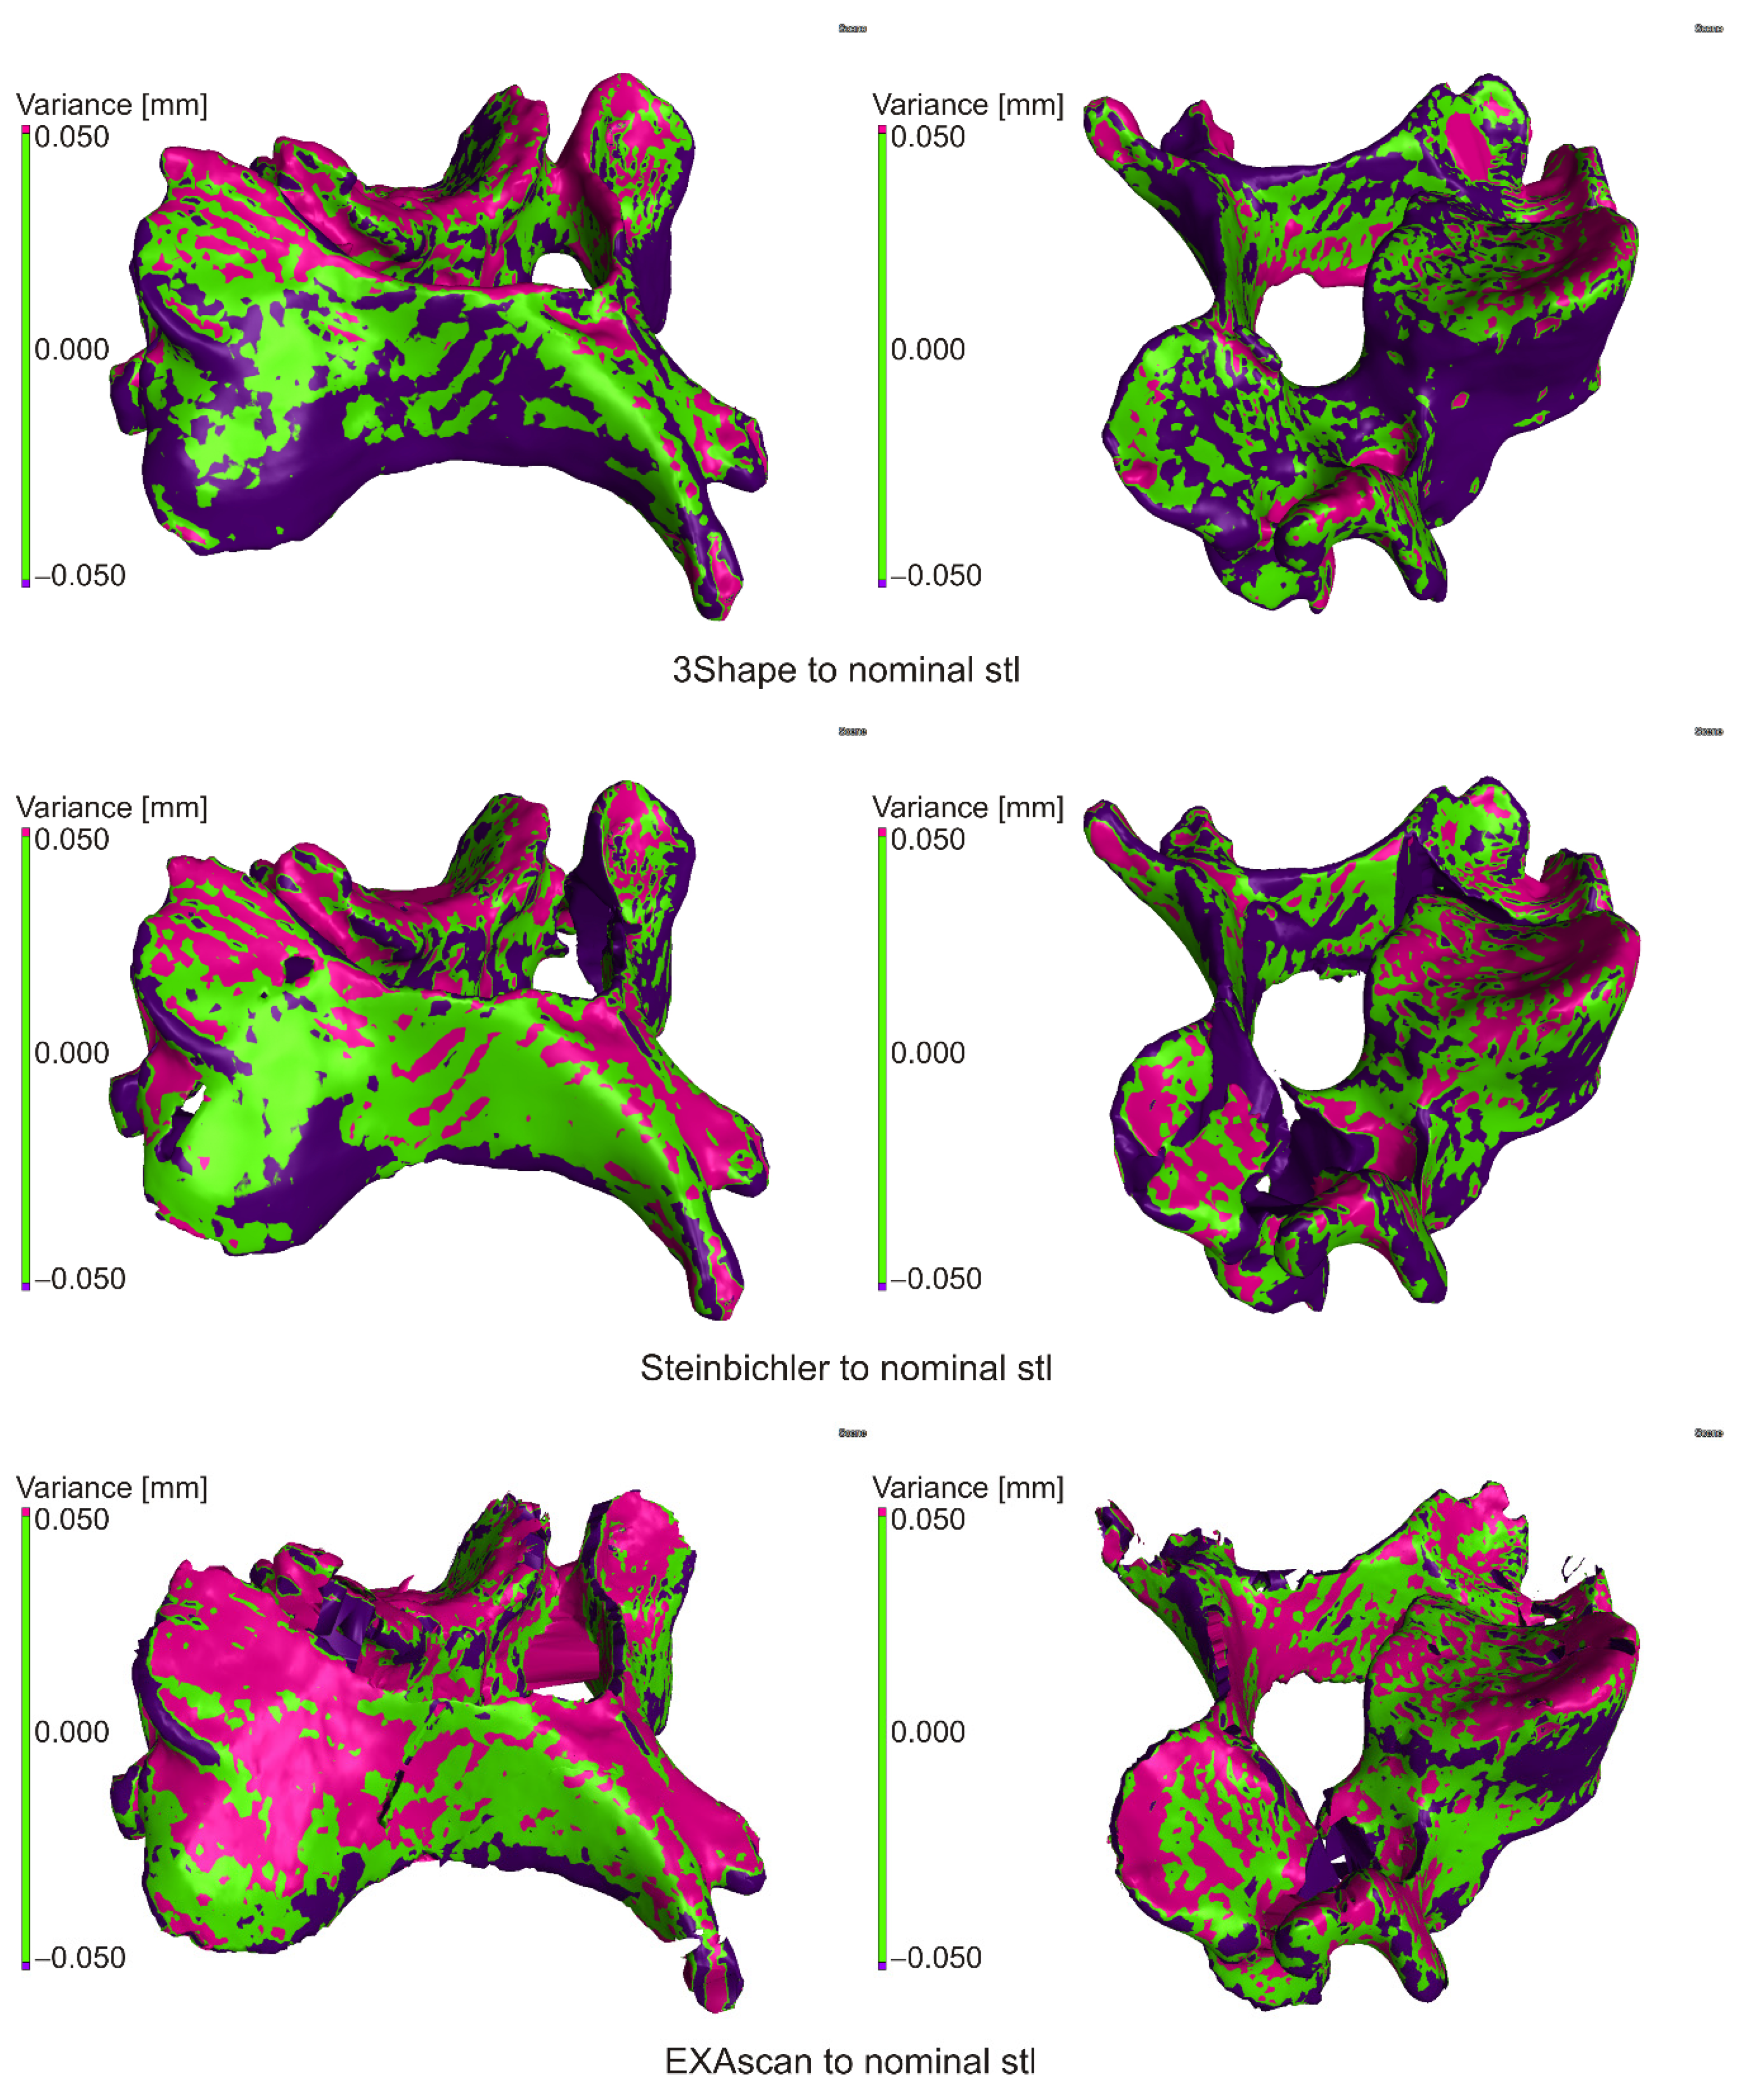
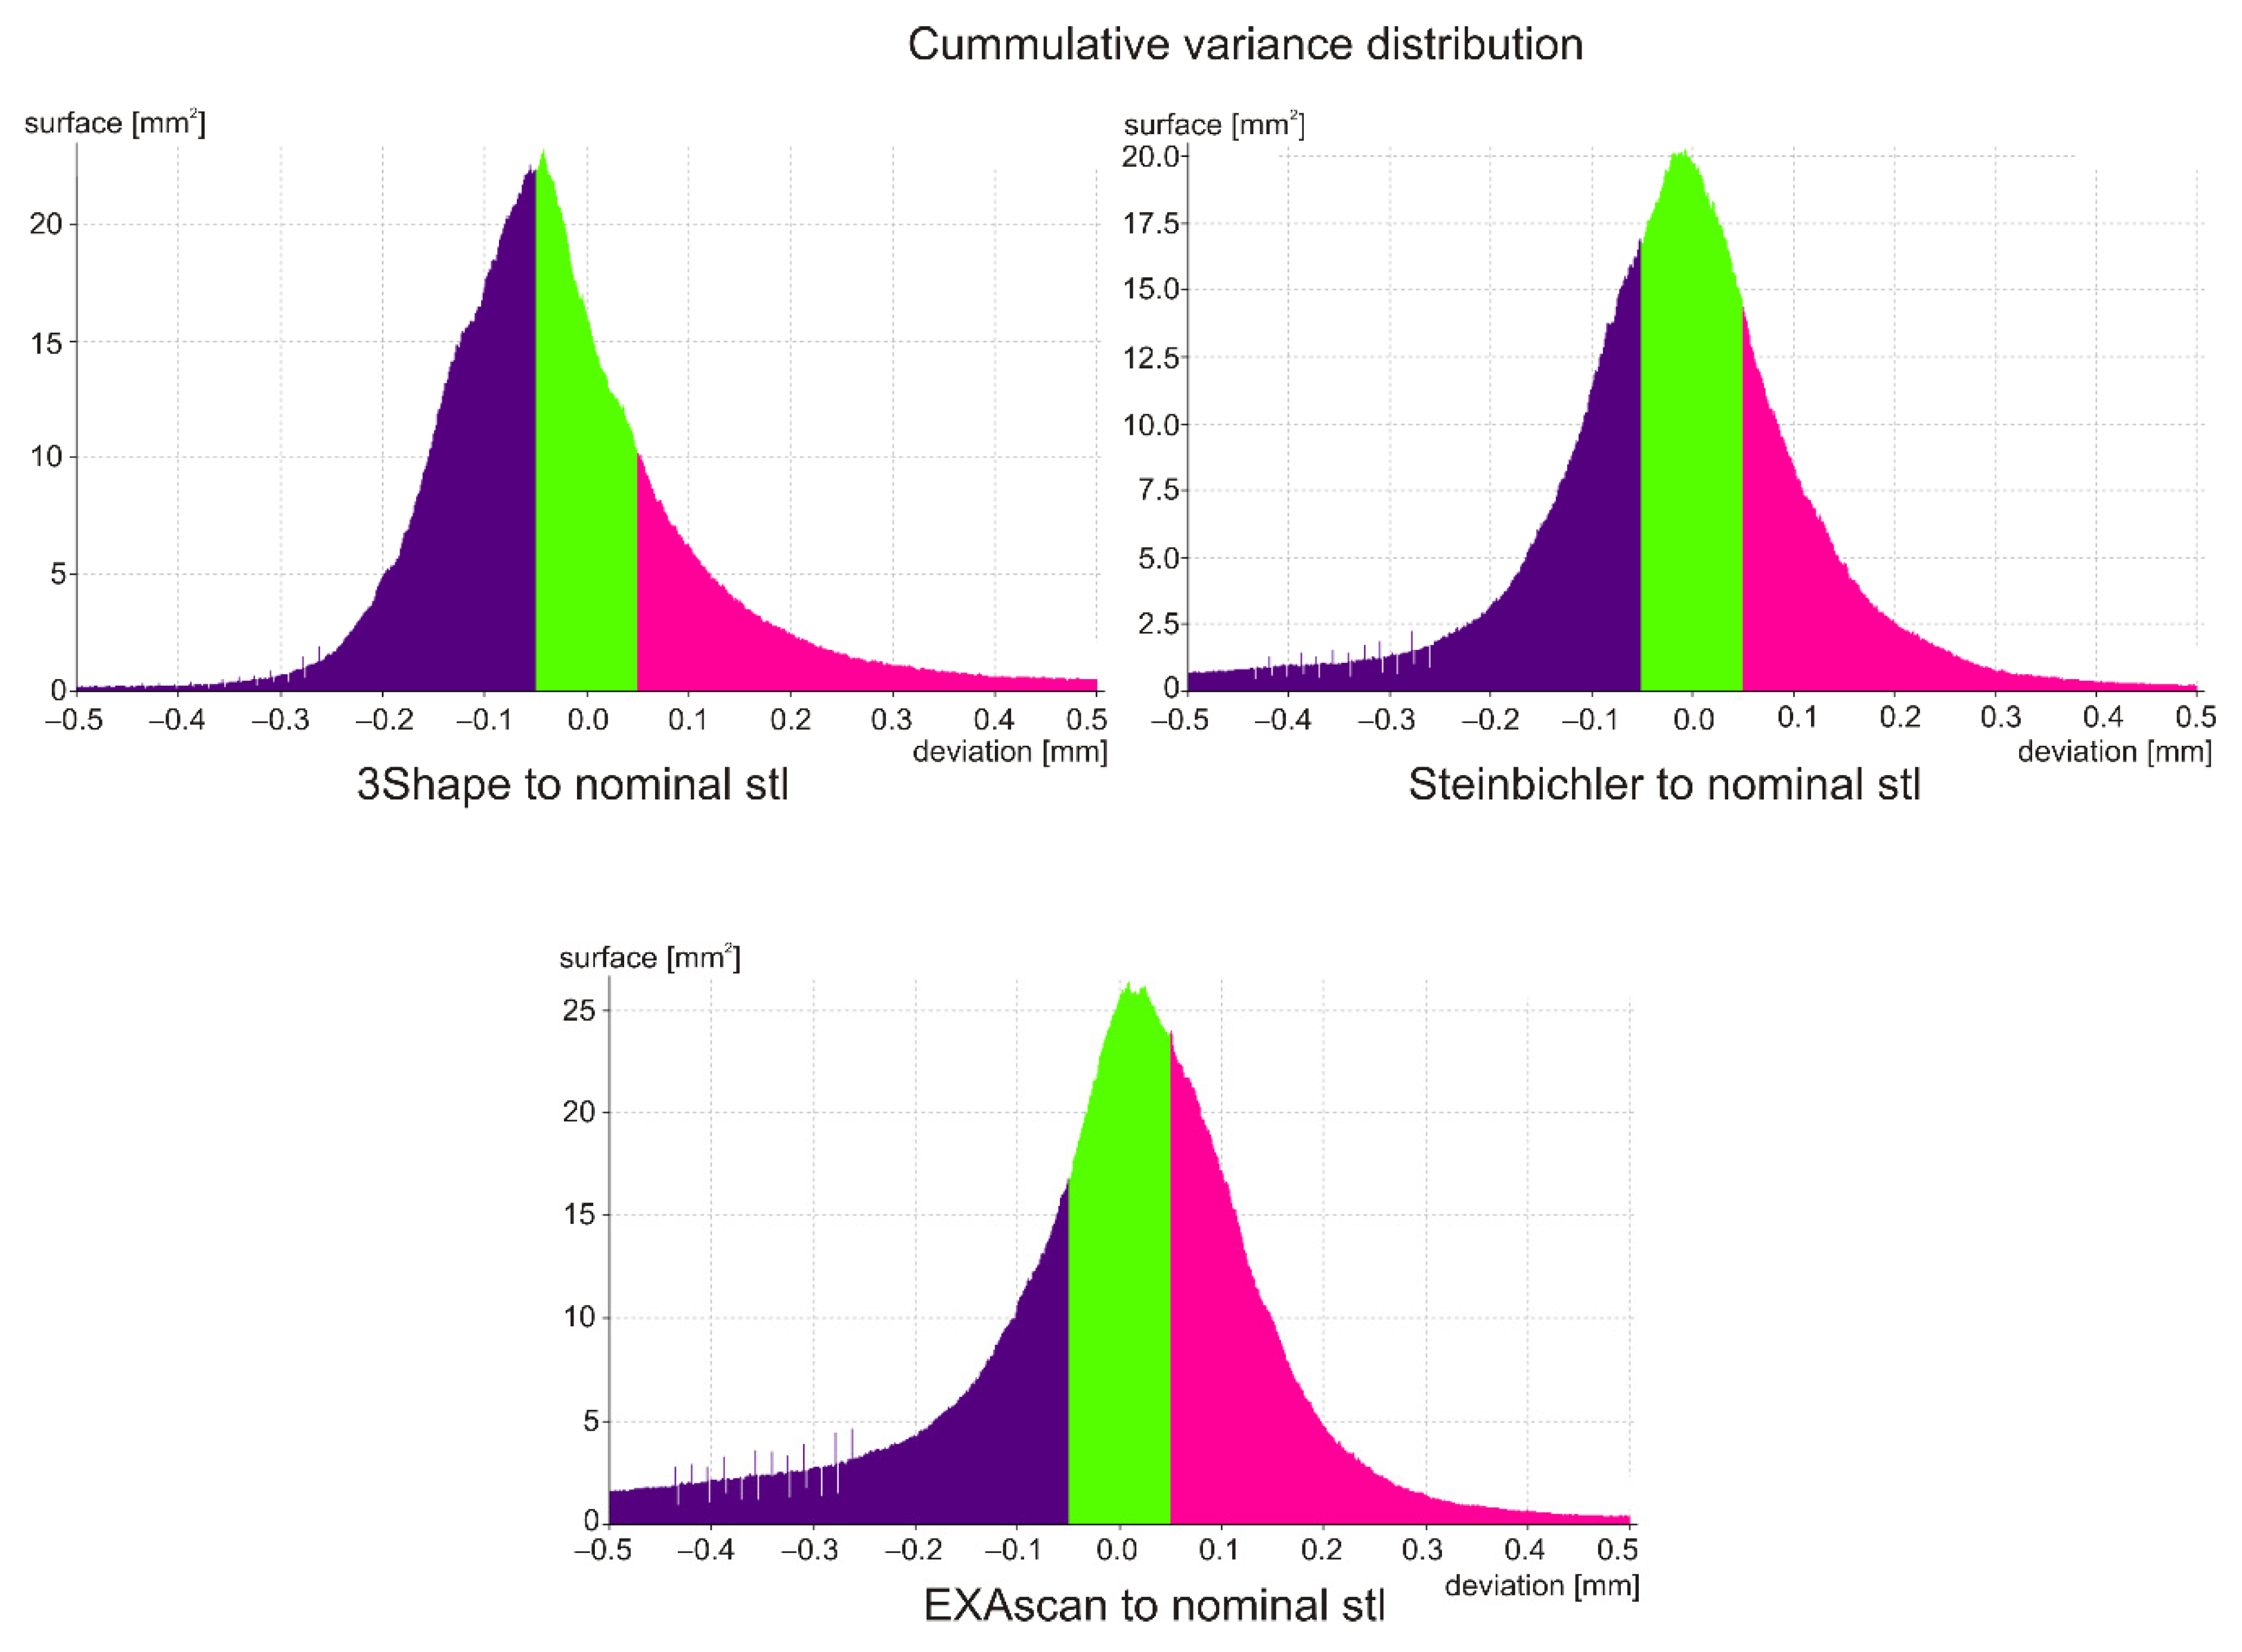
3.3. Evaluation of Production and Scanning Accuracy

After scanning the reference model by all scanners and subsequent processing (mutual alignment of scans, creation of a solid model), the evaluation was divided into two levels in VGStudio MAX. The first level was the comparison of scans to the nominal table of the model used for 3D printing and the second comparison of scans to the selected nominal scan. The nominal scan was selected based on the accuracy of each scanner, with 3Shape D700 scanner having the best manufacturer-specified accuracy. When evaluating, it was not possible to separate the accuracy of production on a 3D printer as it is not available and depends on several factors (material, environment, printing parameters, printer mechanics, etc.). It is possible to rely only on the data of certificates, and in respect to the case of a printer, the user experience. An experiment that was not part of this research would be needed to verify the accuracy of the print itself.

3.3.1. Comparison of Scans with Nominal STL File

Deviations at the level of ±0.500 mm were evaluated, while a value of ±0.050 mm (green color) was set as a suitable tolerance band. For a given deviation, the percentage match with the nominal model was subtracted from the cumulative variance distribution, and the deviation value for the 95% match between the current and nominal model was also determined. In the case of cumulative variance distribution, the absolute values of the obtained surfaces are taken.
The scan from the 3Shape scanner was smaller than the nominal STL file in more than 50% of the surface, so it was assumed that due to the accuracy of the scanner, the reference model was smaller than the nominal STL from which it was made; visible on large burgundy surfaces (Figure 7) and on the deviation histogram (Figure 8).
In the case of the Steinbichler Comet scanner, the deviations were distributed almost evenly (Figure 7), which was visible on the Gaussian curve (Figure 8).
In the case of the Creaform EXAscan scanner (Figure 7), in the range of ±0.200 mm, the frequency of positive deviations was higher than negative ones, which was visible on the histogram (Figure 8); outside this interval, the frequency of negative deviations was higher.
The results are summarized in Table 2, where the percentage match was 0.050 mm (DEV50), and the deviation value was for a 95% match (PER95).

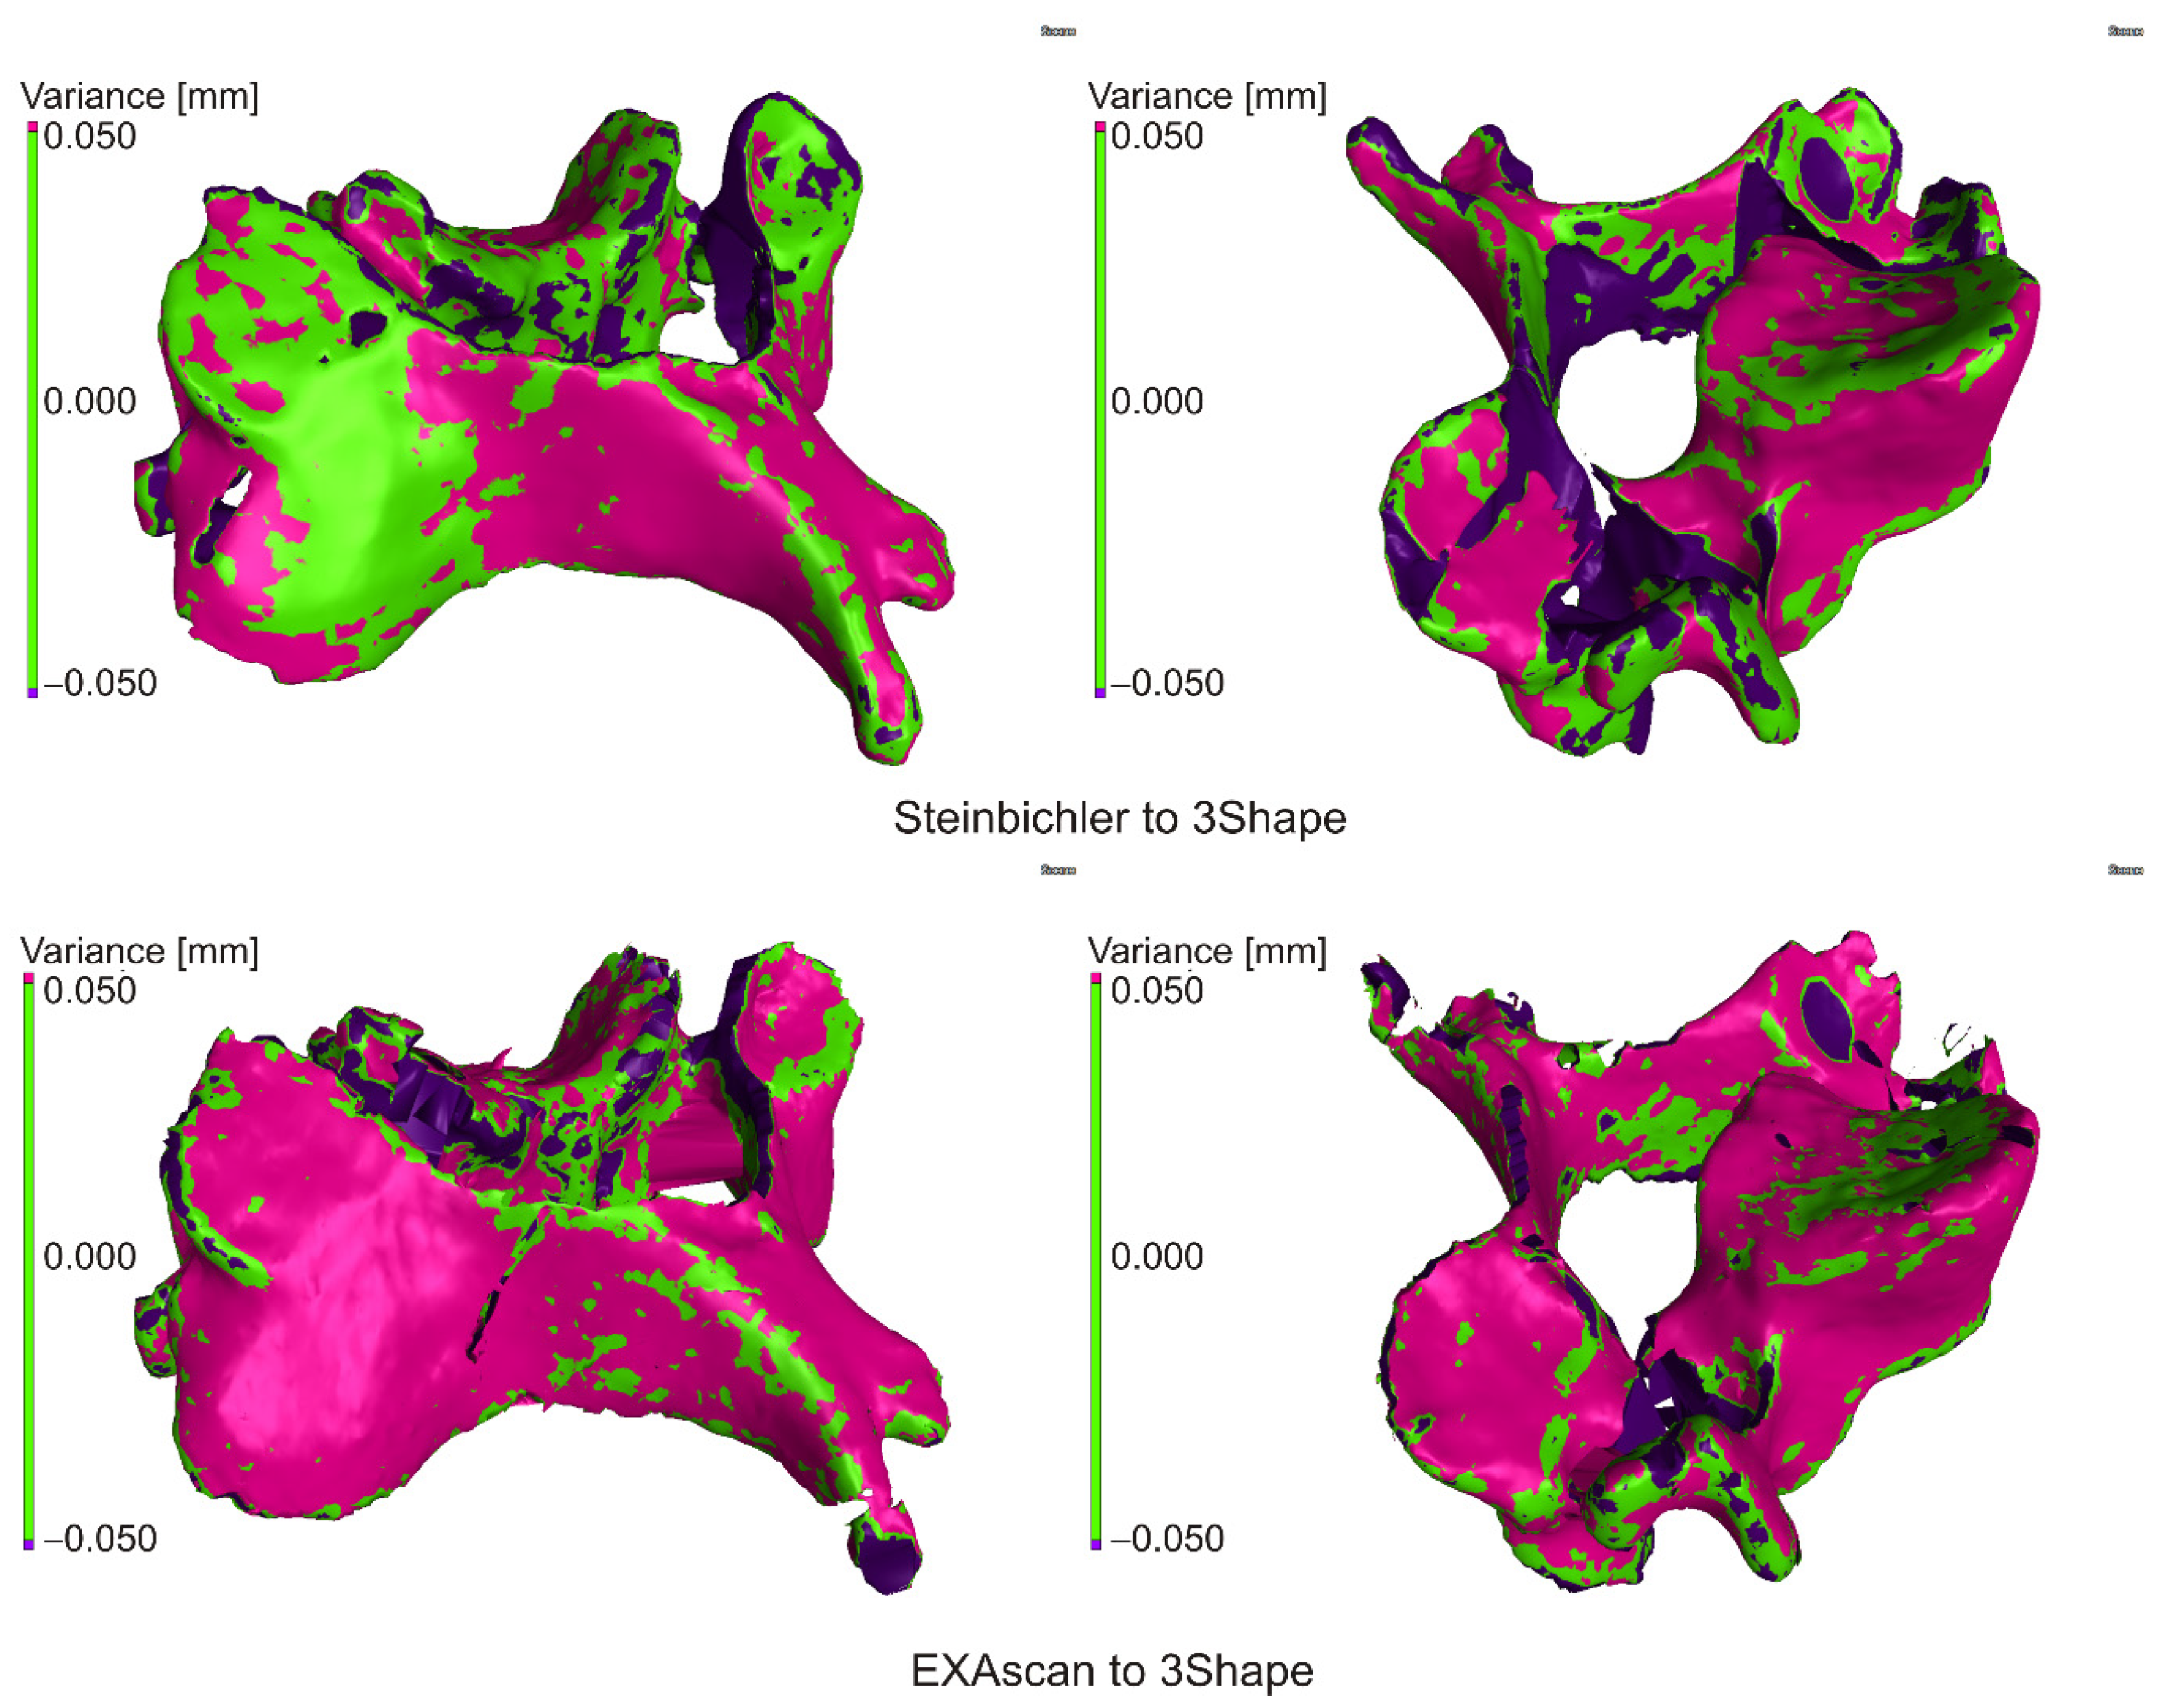
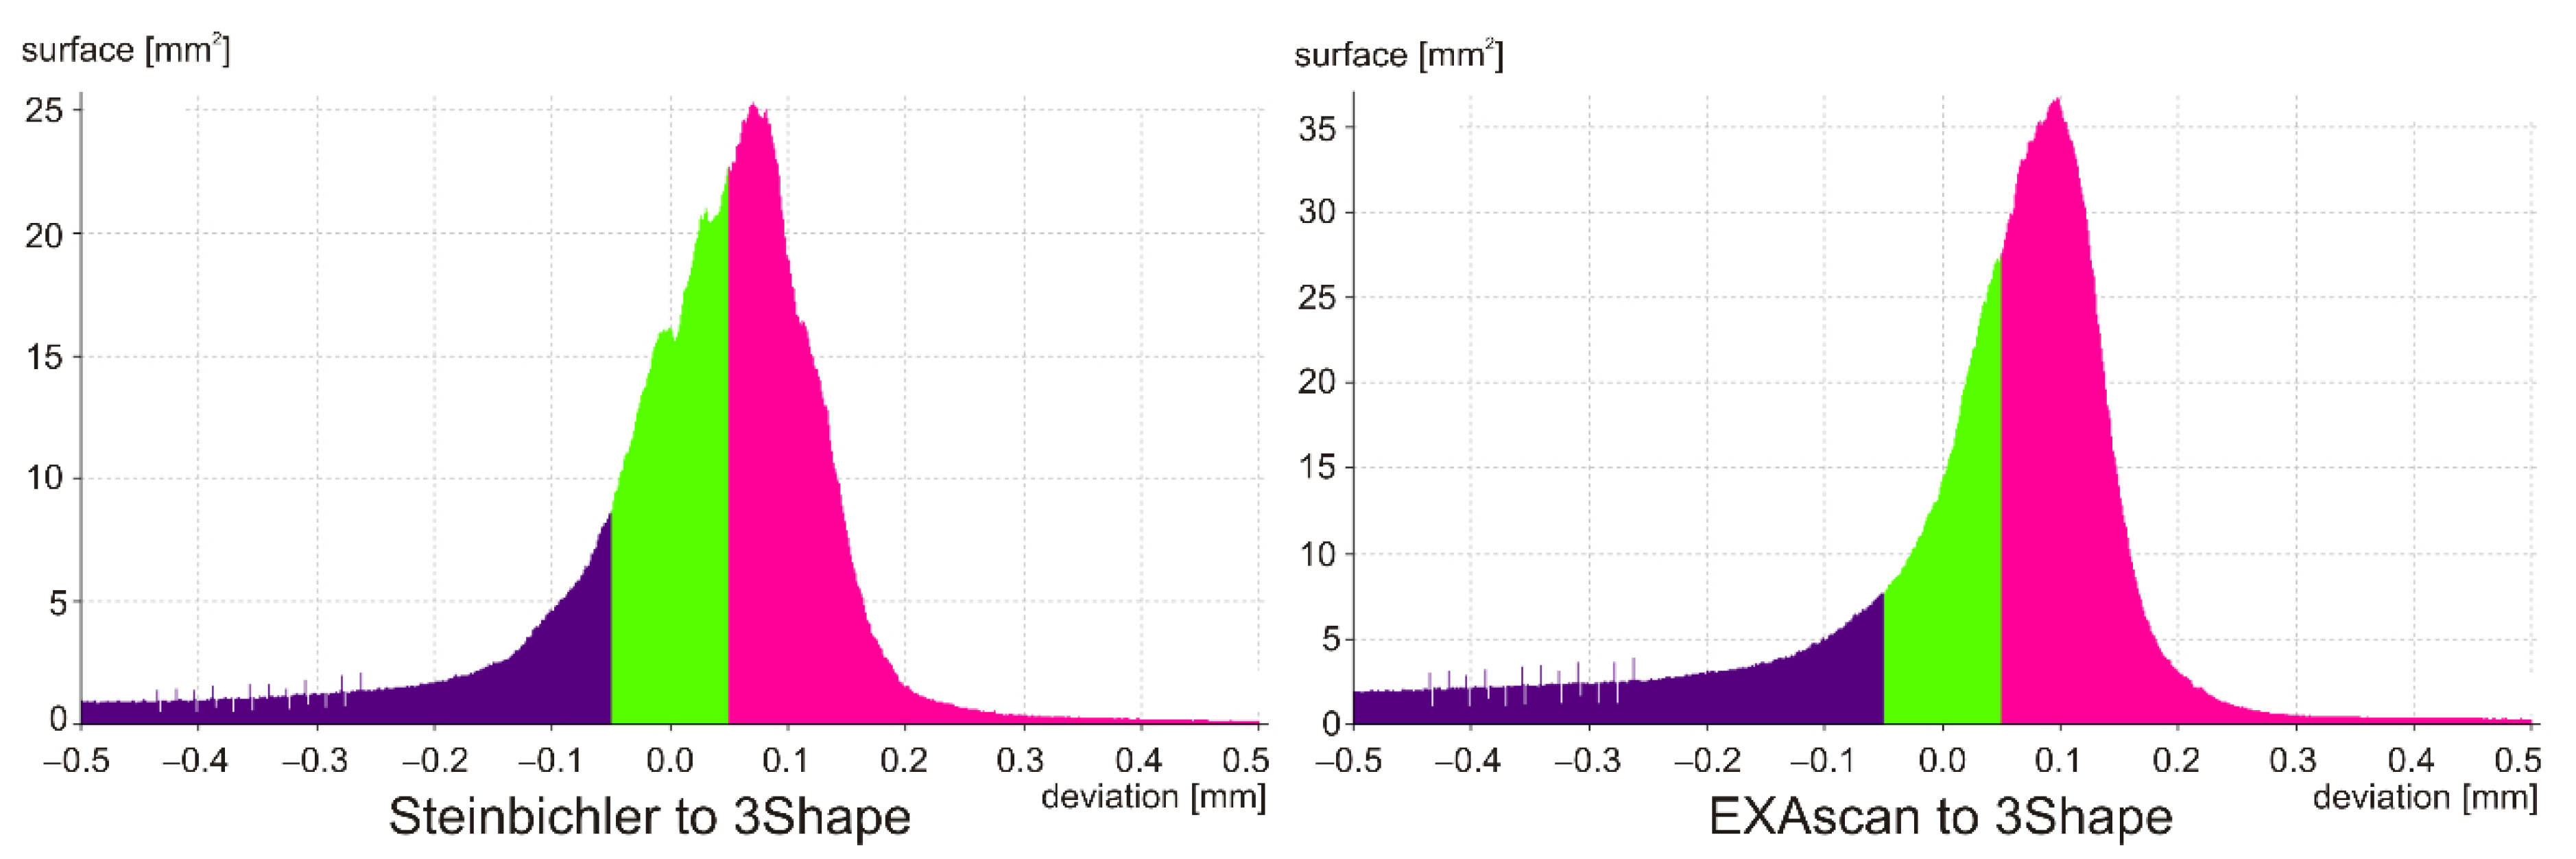
3.3.2. Comparison of Scans

When comparing results, the 3Shape D700 scanner was determined as the reference to the other scanners. Before the actual to nominal comparison itself, it was necessary to align the scans to the model from the dental scanner using the “Best-fit” method.
When comparing the scan from the Steibichler Comet, the deviations from the nominal surface were largely positive, i.e., the scan was larger (Figure 9), also visible in the attached histogram (Figure 10). On the contrary, from the deviation of 0.200 mm, there was a greater number of negative deviations, which was mainly due to errors at the edges of the model and missing parts of the scan.
In the case of the Creaform EXAscan scanner, the histogram is similar, but the frequency around zero deviation is significantly higher, which is also visible in the distribution of deviations.
The results are summarized in Table 3, where the percentage match was 0.050 mm (DEV50), and the deviation value was for a 95% match (PER95).

4. Discussion

The article was focused on the comparison of software applications for DICOM data processing, model creation, and its printing on a low-cost 3D printer and subsequent digitization using 3D scanners to determine the impact of printing and verify the use of these technologies.
A CT scan with a resolution of 0.287 × 0.287 × 0.625 mm was used for the production of our anatomical model, while the articles [11,13,14,34] show that the most commonly used image slice thickness is in the range of 0.4–1mm and for long bones 2 mm.
A comparison of the software packages shows that, with respect to the VGStudio MAX model, the maximum deviation at 95% surface coverage was 0.935 mm for Mimics and 0.825 mm for inVesalius. When comparing medically oriented software (Mimics, inVesalius), the maximum deviation was 0.356 mm.
The review of the literature shows that in the case of evaluating the accuracy of the production of anatomical models, the authors dealt with the evaluation and mutual comparison of selected length dimensions between the CT scan and the printed model. Anderson et al. [38] report accuracy for models larger than 10mm at 1.5% of the observed dimension, Wu et al. [1] wrote that interclass correlation coefficient was in the range of R = 0.799–0.977, Hedelin et al. [19] stated that the correlation coefficient between actual and nominal image was R = 0.99 and Bücking et al. [15] that the percentage difference depending on the monitored body was 0.78–2.53%. The presented paper deals with deviations in 3D space, so it is possible to determine the differences between the reference model printed by the anatomical model at each point of the model and, if necessary, adjust the parameters of 3D printing in order to increase accuracy. Globally, the deviation of our anatomical model ranges from 0.272–0.361 mm (per side) depending on the scanner used (Table 2), which represents a difference of 1.088–1.440% at 50 mm. This is the maximum deviation, as the deviation at the measured points may be smaller. In the case of comparing the outputs from the scanners to the reference model, it can be stated that there were no significant differences between them, as 95% coverage was in the range of 0.100 mm (Table 2). This also applies to the mutual comparison of scanners, where the difference is at the level of 0.06 mm (Table 3).
The cost of producing models using stereolithography by Wilcox et al. [39] ranges from $20–400 for spinal surgical guides and $300–3000 for spinal surgery planning with a delivery time of 16 h–7 d for spinal surgical guides and up to 2 d for spinal surgery planning. In our case, the price of the material was less than $1, the time required to separate the model from the CT data was 25 min, and to print, 3 h. From a time and financial point of view, the use of inVesalius in combination with Meshmixer was optimal for generating output from CT data and GOM Inspect for data control, as it is freeware. The result shows that a low-cost FFF printer with low acquisition costs and operation is also suitable for the creation of anatomical models. Hardware costs ranged from $700 per PC, $1000 per 3D printer as freeware programs.
In the experiment, three software with different focus and functions were compared. VGStudio MAX is primarily intended for data processing from industrial computed tomographs and measurements. Mimics and inVesalius are primarily designed to work with data from medical CT devices and therefore have an optimized and predefined environment. Mimics is a medical software with ISO 13485:2016 certification, and InVesalius is a freeware enabling surface generation to a STL file. Compared to other software, its disadvantage is the lengthy segmentation.
In the specific case, only the function of generating the surface from DICOM data is important, so Mimics and inVesalius showed significant deviations from VGStudio MAX. The analysis shows that this is due to the setting of the threshold and the subsequent processing of data. In contrast, VGStudio MAX uses several tools to influence and achieve an optimal threshold.
For VGStudio MAX and Mimics, you need to consider what the software will be used for, in addition to creating surfaces. The disadvantage of each software is availability. As they are complicated, professional software, so their price on the market is relatively high. Working with the software also requires some knowledge and skill, so it is recommended to have training in the software. It follows that if the software is only to be used to create surfaces from DICOM data without a medical certificate, it is recommended to use inVesalius. If the goal is to generate surfaces and then apply various measurement processes, VGStudio MAX is recommended. And if the software is to be used to create surfaces and generate various biological structures, Mimics is recommended.
When 3D printing the model, it is necessary to pay attention to the correct placement of the model on the printer’s work surface, the layout of support structures, temperature and flow of extruded material, work pad temperature, and the speed of nozzle movement and its pressure on the work surface. In the case of a vertebra, it is recommended to position the model so that the layers form in the transverse plane and that the model is turned with the cranial side down. In this case, the printed model has a detailed, smooth surface, and the generated support structure is easier to remove from the work surface. The temperature of the printed material has predefined parameters in the machine settings, but when a faint trace is created, it can be adjusted manually in the print settings. The percentage of material flow can also be adjusted. Care must be taken to ensure that the temperature of the work surface is high enough so that the first layer of applied material does not peel off. We can also influence this step by changing the pressure of the nozzle against the work surface (Z-axis). To prevent the model from detaching from the work surface, it is important to correct the nozzle speed. At high speeds, the machine tends to swing with the model (especially if they are small models such as vertebra), which causes the base of the support material to peel off from the work surface, resulting in the model being detached from the surface. This will invalidate the model and may be considered a defect. Following these procedures, the production of an educational anatomical model of a vertebra on a low-cost 3D printer has proven to be simple and fast. The overall accuracy of printing depends on the above parameters, the accuracy of the printer, the accuracy of software, or other minor influences (ambient temperature, humidity, etc.). The results of the comparison of 3D scanners show that the easiest to work with was the 3Shape D700 scanner. However, it is intended for scanning small objects (the manufacturer does not specify the scanning volume), and it is necessary to pay attention to closing the holes during postprocessing. The Creaform EXAscan has minimal restrictions on the size of the scanned object, and its design allows the scanning of complex objects. The disadvantage was the older software, which disproportionately stretched the total scanning time. With newer software, it would be possible to reduce the time by about half. The Steinbichler Comet is limited by the need to replace lenses with different FOV depending on the object’s size, but it is easier to work with it than the Creaform EXAscan.

5. Conclusions

The paper deals with the separation of the third cervical vertebra in a medical, industrial, and freely available CT data processing software. Results have shown that all these software are adequate for anatomical model generating, VGStudio MAX being the most precise. It has also been proved that a low-cost, desktop FFF 3D printer is suitable for anatomical model manufacturing and that the whole production process is not difficult, time-consuming, or costly. The presented methodology could therefore be used in medical practice for educational, planning, and training purposes.
In the future, the plan is to manufacture a series of different types of spinal anatomical models by applying the proposed CAD/computer-aided manufacturing (CAM) methodology and collect feedback from medical professionals, which are using these models. A comparison of output models from different low-cost FFF 3D printers will also be evaluated.

Author Contributions

Conceptualization—T.T., P.V., B.Š., L.B., and M.S.; funding acquisition—R.H. and J.Ž.; investigation—T.T., P.V., and B.Š.; methodology—T.T., P.V., B.Š., L.B., and M.S.; project administration—T.T., R.H., and J.Ž.; resources—R.H. and J.Ž.; supervision—T.T., R.H., and J.Ž.; validation—T.T., P.V., and B.Š.; visualization—T.T., P.V., and B.Š.; writing—original draft—T.T., P.V., and B.Š.; writing—review and editing—T.T., P.V., B.Š., L.B., M.S., R.H., and J.Ž. All authors have read and agreed to the published version of the manuscript.

Funding

This research was funded by The Ministry of Education, Science, Research and Sport of the Slovak Republic, grant number KEGA 041TUKE-4/2019, KEGA 203TUKE-4/2020, VEGA 1/0316/18, VEGA 1/0179/19, APVV-19-0290 and Stimulus for research and development 12/2018—12/2021.

Institutional Review Board Statement

Not applicable.

Informed Consent Statement

Not applicable.

Data Availability Statement

The data presented in this study are available on request from the corresponding author. The data are not publicly available due to internal regulation.

Conflicts of Interest

The authors declare no conflict of interest. The funders had no role in the design of the study; in the collection, analyses, interpretation of data; in the writing of the manuscript, or in the decision to publish the results.

References

  1. Wu, A.-M.; Shao, Z.-X.; Wang, J.-S.; Yang, X.-D.; Weng, W.-Q.; Wang, X.-Y.; Xu, H.-Z.; Chi, Y.-L.; Lin, Z.-K. The Accuracy of a Method for Printing Three-Dimensional Spinal Models. PLoS ONE 2015, 10, e0124291. [Google Scholar] [CrossRef] [PubMed] [Green Version]
  2. Ford, S.; Minshall, T. Invited Review Article: Where and How 3D Printing Is Used in Teaching and Education. Addit. Manuf. 2019, 25, 131–150. [Google Scholar] [CrossRef]
  3. Cheung, C.L.; Saber, N.R. Bioengineering for Surgery—1st Edition. In Bioengineering for Surgery; Farhat, W., Drake, J., Eds.; Elsevier B.V.: Amsterdam, The Netherland, 2015; pp. 151–166. ISBN 9780081001301. [Google Scholar]
  4. Rengier, F.; Mehndiratta, A.; Von Tengg-Kobligk, H.; Zechmann, C.M.; Unterhinninghofen, R.; Kauczor, H.U.; Giesel, F.L. 3D Printing Based on Imaging Data: Review of Medical Applications. Int. J. Comput. Assist. Radiol. Surg. 2010, 5, 335–341. [Google Scholar] [CrossRef] [PubMed]
  5. Khanesar, M.A. Medical Applications of 3D Printing|Iris Publishers. Available online: https://irispublishers.com/abeb/fulltext/medical-applications-of-3d-printing.ID.000531.php (accessed on 11 August 2020).
  6. Witowski, J.; Sitkowski, M.; Hołda, M.K.; Pędziwiatr, M. 9783110667219-005. Available online: https://www.degruyter.com/view/book/9783110667219/10.1515/9783110667219-005.xml (accessed on 14 October 2020).
  7. Vaishya, R.; Patralekh, M.K.; Vaish, A.; Agarwal, A.K.; Vijay, V. Publication Trends and Knowledge Mapping in 3D Printing in Orthopaedics. J. Clin. Orthop. Trauma 2018, 9, 194–201. [Google Scholar] [CrossRef] [PubMed]
  8. Wu, A.M.; Lin, J.L.; Kwan, K.Y.H.; Wang, X.Y.; Zhao, J. 3D-Printing Techniques in Spine Surgery: The Future Prospects and Current Challenges. Expert Rev. Med. Devices 2018, 15, 399–401. [Google Scholar] [CrossRef] [PubMed]
  9. Haleem, A.; Javaid, M. Role of CT and MRI in the Design and Development of Orthopaedic Model Using Additive Manufacturing. J. Clin. Orthop. Trauma 2018, 9, 213–217. [Google Scholar] [CrossRef]
  10. Zadpoor, A.A.; Malda, J. Additive Manufacturing of Biomaterials, Tissues, and Organs. Ann. Biomed. Eng. 2017, 45, 1–11. [Google Scholar] [CrossRef]
  11. Skrzat, J.; Zdilla, M.J.; Brzegowy, P.; Hołda, M. 3D Printed Replica of the Human Temporal Bone Intended for Teaching Gross Anatomy. Folia Med. Cracov. 2019, 59, 23–30. [Google Scholar] [CrossRef]
  12. Clifton, W.; Damon, A.; Valero-Moreno, F.; Nottmeier, E.; Pichelmann, M. The SpineBox: A Freely Available, Open-Access, 3D-Printed Simulator Design for Lumbar Pedicle Screw Placement. Cureus 2020, 12. [Google Scholar] [CrossRef] [Green Version]
  13. Hasan, O.; Atif, M.; Jessar, M.M.; Hashmi, P. Application of 3D Printing in Orthopaedic Surgery. A New Affordable Horizon for Cost-Conscious Care—PubMed. Available online: https://pubmed.ncbi.nlm.nih.gov/30697019/ (accessed on 11 August 2020).
  14. Marro, A.; Bandukwala, T.; Mak, W. Three-Dimensional Printing and Medical Imaging: A Review of the Methods and Applications. Curr. Probl. Diagn. Radiol. 2016, 45, 2–9. [Google Scholar] [CrossRef]
  15. Bücking, T.M.; Hill, E.R.; Robertson, J.L.; Maneas, E.; Plumb, A.A.; Nikitichev, D.I. From Medical Imaging Data to 3D Printed Anatomical Models. PLoS ONE 2017, 12. [Google Scholar] [CrossRef] [PubMed] [Green Version]
  16. Ganguli, A.; Pagan-Diaz, G.J.; Grant, L.; Cvetkovic, C.; Bramlet, M.; Vozenilek, J.; Kesavadas, T.; Bashir, R. 3D Printing for Preoperative Planning and Surgical Training: A Review. Biomed. Microdevices 2018, 20, 1–24. [Google Scholar] [CrossRef] [PubMed]
  17. Salmi, M. Possibilities of Preoperative Medical Models Made by 3D Printing or Additive Manufacturing. J. Med. Eng. 2016, 2016, 1–6. [Google Scholar] [CrossRef] [PubMed] [Green Version]
  18. Anderson, P.A. 3D Printing for Education and Surgical Planning in Orthopedic Surgery. In 3D Printing in Orthopaedic Surgery; Elsevier: Amsterdam, The Netherland, 2019; pp. 55–63. [Google Scholar]
  19. Hedelin, H.; Swinkels, C.S.; Laine, T.; Mack, K.; Lagerstrand, K. Using a 3D Printed Model as a Preoperative Tool for Pelvic Triple Osteotomy in Children. JAAOS Glob. Res. Rev. 2019, 3, e074. [Google Scholar] [CrossRef]
  20. Lee, H.; Nguyen, N.H.; Hwang, S.I.L.; Lee, H.J.; Hong, S.K.; Byun, S.S. Personalized 3D Kidney Model Produced by Rapid Prototyping Method and Its Usefulness in Clinical Applications. Int. Braz. J. Urol. 2018, 44, 952–957. [Google Scholar] [CrossRef]
  21. Bernhard, J.C.; Isotani, S.; Matsugasumi, T.; Duddalwar, V.; Hung, A.J.; Suer, E.; Baco, E.; Satkunasivam, R.; Djaladat, H.; Metcalfe, C.; et al. Personalized 3D Printed Model of Kidney and Tumor Anatomy: A Useful Tool for Patient Education. World J. Urol. 2016, 34, 337–345. [Google Scholar] [CrossRef]
  22. Biglino, G.; Capelli, C.; Wray, J.; Schievano, S.; Leaver, L.K.; Khambadkone, S.; Giardini, A.; Derrick, G.; Jones, A.; Taylor, A.M. 3D-Manufactured Patient-Specific Models of Congenital Heart Defects for Communication in Clinical Practice: Feasibility and Acceptability. BMJ Open 2015, 5, e007165. [Google Scholar] [CrossRef]
  23. Garcia, J.; Yang, Z.L.; Mongrain, R.; Leask, R.L.; Lachapelle, K. 3D Printing Materials and Their Use in Medical Education: A Review of Current Technology and Trends for the Future. BMJ Simul. Technol. Enhanc. Learn. 2018, 4, 27–40. [Google Scholar] [CrossRef]
  24. Wake, N.; Rosenkrantz, A.B.; Huang, R.; Park, K.U.; Wysock, J.S.; Taneja, S.S.; Huang, W.C.; Sodickson, D.K.; Chandarana, H. Patient-Specific 3D Printed and Augmented Reality Kidney and Prostate Cancer Models: Impact on Patient Education. 3D Print. Med. 2019, 5, 4. [Google Scholar] [CrossRef] [Green Version]
  25. van de Belt, T.H.; Nijmeijer, H.; Grim, D.; Engelen, L.J.L.P.G.; Vreeken, R.; van Gelder, M.M.H.J.; Ter Laan, M. Patient-Specific Actual-Size Three-Dimensional Printed Models for Patient Education in Glioma Treatment: First Experiences. World Neurosurg. 2018, 117, e99–e105. [Google Scholar] [CrossRef]
  26. Prinold, J.A.I.; Mazzà, C.; Di Marco, R.; Hannah, I.; Malattia, C.; Magni-Manzoni, S.; Petrarca, M.; Ronchetti, A.B.; Tanturri de Horatio, L.; van Dijkhuizen, E.H.P.; et al. A Patient-Specific Foot Model for the Estimate of Ankle Joint Forces in Patients with Juvenile Idiopathic Arthritis. Ann. Biomed. Eng. 2016, 44, 247–257. [Google Scholar] [CrossRef] [PubMed] [Green Version]
  27. Lashkarinia, S.S.; Piskin, S.; Bozkaya, T.A.; Salihoglu, E.; Yerebakan, C.; Pekkan, K. Computational Pre-Surgical Planning of Arterial Patch Reconstruction: Parametric Limits and In Vitro Validation. Ann. Biomed. Eng. 2018, 46, 1292–1308. [Google Scholar] [CrossRef] [PubMed] [Green Version]
  28. George, E.; Liacouras, P.; Rybicki, F.J.; Mitsouras, D. Measuring and Establishing the Accuracy and Reproducibility of 3D Printed Medical Models. Radiographics 2017, 37, 1424–1450. [Google Scholar] [CrossRef] [PubMed]
  29. Mcmenamin, P.G.; Quayle, M.R.; Mchenry, C.R.; Adams, J.W. The Production of Anatomical Teaching Resources Using Three-Dimensional (3D) Printing Technology. Anat. Sci. Educ. 2014, 7, 479–486. [Google Scholar] [CrossRef]
  30. Tong, Y.; Kaplan, D.J.; Spivak, J.M.; Bendo, J.A. Three-Dimensional Printing in Spine Surgery: A Review of Current Applications. Spine J. 2020, 20, 833–846. [Google Scholar] [CrossRef]
  31. Abate, K.M.; Nazir, A.; Yeh, Y.P.; Chen, J.E.; Jeng, J.Y. Design, Optimization, and Validation of Mechanical Properties of Different Cellular Structures for Biomedical Application. Int. J. Adv. Manuf. Technol. 2020, 106, 1253–1265. [Google Scholar] [CrossRef]
  32. Nazir, A.; Jeng, J.-Y. A High-Speed Additive Manufacturing Approach for Achieving High Printing Speed and Accuracy. Proc. Inst. Mech. Eng. Part C J. Mech. Eng. Sci. 2020, 234, 2741–2749. [Google Scholar] [CrossRef]
  33. Gadia, A.; Shah, K.; Nene, A. Emergence of Three-Dimensional Printing Technology and Its Utility in Spine Surgery. Asian Spine J. 2018, 12, 365–371. [Google Scholar] [CrossRef]
  34. Liew, Y.; Beveridge, E.; Demetriades, A.K.; Hughes, M.A. 3D Printing of Patient-Specific Anatomy: A Tool to Improve Patient Consent and Enhance Imaging Interpretation by Trainees. Br. J. Neurosurg. 2015, 29, 712–714. [Google Scholar] [CrossRef]
  35. Chepelev, L.; Wake, N.; Ryan, J.; Althobaity, W.; Gupta, A.; Arribas, E.; Santiago, L.; Ballard, D.H.; Wang, K.C.; Weadock, W.; et al. Radiological Society of North America (RSNA) 3D Printing Special Interest Group (SIG): Guidelines for Medical 3D Printing and Appropriateness for Clinical Scenarios. 3D Print. Med. 2018, 4, 1–38. [Google Scholar] [CrossRef]
  36. Mitsouras, D.; Liacouras, P.; Imanzadeh, A.; Giannopoulos, A.A.; Cai, T.; Kumamaru, K.K.; George, E.; Wake, N.; Caterson, E.J.; Pomahac, B.; et al. Medical 3D Printing for the Radiologist. Radiographics 2015, 35, 1965–1988. [Google Scholar] [CrossRef] [PubMed]
  37. Šljivić, M.; Mirjanić, D.; Šljivić, N.; Fragassa, C.; Pavlović, A. 3D Printing and 3D Bioprinting to Use for Medical Applications. Contemp. Mater. 2019, 82–92. [Google Scholar] [CrossRef]
  38. Goff, R.P.; Spencer, J.H.; Iaizzo, P.A. MRI Reconstructions of Human Phrenic Nerve Anatomy and Computational Modeling of Cryoballoon Ablative Therapy. Ann. Biomed. Eng. 2016, 44, 1097–1106. [Google Scholar] [CrossRef] [PubMed] [Green Version]
  39. Wilcox, B.; Mobbs, R.J.; Wu, A.-M.; Phan, K. Systematic Review of 3D Printing in Spinal Surgery: The Current State of Play. J. Spine Surg. 2017, 3, 433–443. [Google Scholar] [CrossRef] [PubMed] [Green Version]
Figure 1. Design and evaluation methodology. VGStudio MAX different threshold models: VG1, VG2, and VG3; Mimics different threshold models: M1 and M2; inVesalius different threshold models: V1 and V2. Each represent models with different thresholds in the selected software.
Applsci 11 00594 g001
Figure 2. Areas for surface determination (A), obtained surfaces (B).
Applsci 11 00594 g002
Figure 3. Model generated in PrusaSlicer (left) and printed model of the vertebra (right).
Applsci 11 00594 g003
Figure 4. VG2 to VG1 comparison (A,B), histogram for VG2 to VG1 comparison (C), VG3 to VG2 comparison (D).
Applsci 11 00594 g004
Figure 5. Model alignment and software output comparison.
Applsci 11 00594 g005
Figure 6. Comparison of mesh and solid model.
Applsci 11 00594 g006
Figure 7. Comparison of scanner outputs with the reference model.
Applsci 11 00594 g007
Figure 8. Histogram of the distribution of deviations.
Applsci 11 00594 g008
Figure 9. Comparison of scanner outputs.
Applsci 11 00594 g009
Figure 10. Histogram of the distribution of deviations.
Applsci 11 00594 g010
Table 1. Values for surface determination in Hounsfield units (HU).
Surface DeterminationVG1VG2VG3
Background321829
Material7435451746
Isosurface388282887
Table 2. Comparison with the nominal STL model.
NOMINAL3Shape D700Steinbichler CometCreaform EXAscan
DEV50 (%)32.10037.50033.900
PER95 (mm)0.2720.3120.361
Table 3. Comparison with the reference scan of the model.
3Shape D700Steinbichler CometCreaform EXAscan
DEV50 (%)34.30024.500
PER95 (mm)0.3050.363
Publisher’s Note: MDPI stays neutral with regard to jurisdictional claims in published maps and institutional affiliations.

