Featured Application
The proposed methods can accelerate labeling and training processes by mitigating malicious effects of noisy labels.
Abstract
Deep learning demands a large amount of annotated data, and the annotation task is often crowdsourced for economic efficiency. When the annotation task is delegated to non-experts, the dataset may contain data with inaccurate labels. Noisy labels not only yield classification models with sub-optimal performance, but may also impede their optimization dynamics. In this work, we propose exploiting the pattern recognition capacity of deep convolutional neural networks to filter out supposedly mislabeled cases while training. We suggest a training method that references softmax outputs to judge the correctness of the given labels. This approach achieved outstanding performance compared to the existing methods in various noise settings on a large-scale dataset (Kaggle 2015 Diabetic Retinopathy). Furthermore, we demonstrate a method mining positive cases from a pool of unlabeled images by exploiting the generalization ability. With this method, we won first place on the offsite validation dataset in pathological myopia classification challenge (PALM), achieving the AUROC of 0.9993 in the final submission. Source codes are publicly available.
1. Introduction
Deep learning (DL) has been applied to solving various tasks in manufacturing [1,2], surveillance [3,4], and healthcare [5,6,7]. Training deep neural networks (DNNs) requires a large amount of annotated data to achieve reliable performance [8,9]. Most of the cost in constructing such datasets lies in the labor-intensive annotation process. In an attempt to reduce this cost, annotations are often crowdsourced or delegated to non-experts with limited supervision, not to mention human errors or systematic bias [10]. Both issues are prevalent in medical data [11,12], where experts may hold conflicting opinions on identical images [13].
DNNs learn to recognize visual patterns in images once the disparity between annotations and predictions is reduced [14]. However, incorrect annotations impede training, enforcing the networks’ predictions to coincide with wrong annotations and consequently resulting in undesirable forgetting of meaningful patterns. Such issues can be remedied using regularization techniques designed to prevent overfitting or analyzing the structure underlying systemic noise [15,16,17,18]. Curriculum learning [19] has also been shown to be helpful in handling noisy labels by ignoring suspicious labels during the training [20,21,22,23].
Recent studies have revealed a generalization ability of DNNs, where networks were shown to learn meaningful patterns underlying the dataset before learning random noise [24,25]. Several approaches explicitly take advantage of the generalization ability of CNNs to tackle label noises. In co-teaching [26], two networks are used to select data with small losses to train the other network. This idea was motivated by the fact that data with small losses are likely to be correct. However, ordering data based on their resulting loss overlooks difficult cases that may be correctly labeled but simply hard to train. A network trained using co-teaching may ultimately fail to perform reliably on hard examples and human intervention may be necessary to separate hard examples from those with incorrect labels [27]. Another approach optimizes network weights and replaces labels with the predictions intermittently [28]. The method exploits the generalization ability of the network and performs reliably in highly noisy data. However, this method also does not differentiate correctly labeled hard examples from incorrectly labeled data.
In this paper, we discuss two methods that utilize the generalization ability of CNNs to mitigate the problem of inconsistency or scarcity of medical data annotation. First, we suggest a method to filter incorrectly labeled data based on discrepancies between the network’s logits and given labels. We applied this approach to the classification of referable diabetic retinopathy from color fundus photographs and showed that the proposed algorithm outperforms state-of-the-art methods. Secondly, we introduce an active learning algorithm to mine rare positive cases from a set of unlabeled images. A model trained using this method ranked first on the offsite validation dataset as part of the PALM challenge, achieving an AUROC of 0.9993 in the final submission (ranking and performance of individual teams can be seen in i-Challenge PM tab at http://ai.baidu.com/broad/leaderboard). Source codes are available at https://bitbucket.org/woalsdnd/codes_and_data.
2. Materials and Methods
We introduce two approaches built upon the generalization ability of CNNs. The first method filters out suspicious data by detecting mislabeled samples and masking the loss function computed over such samples. This noise filtration scheme was used to train a deep CNN in classifying referable diabetic retinopathy. The second method exploits the generalization capacity of deep CNNs to retrieve unlabeled samples and query for manual annotation that would help detect rare positive cases upon usage as training samples. This method was used in the PALM competition [29] to classify pathologic myopia using very few labeled data.
2.1. Classification of Referable Diabetic Retinopathy
Diabetic retinopathy (DR) is the leading cause of avoidable blindness across the world, mainly due to the lack of accessibility to the screening exams. The International Clinical Diabetic Retinopathy Severity Scale (ICDRDSS) provides guidelines for assessing the severity of diabetic retinopathy in the scale of 0–4 [30]. A scale equal to or above 2 is called referable DR, indicating that the patient is encouraged to visit an ophthalmologist for closer monitoring of the progress (Figure 1). Therefore, it is important to triage patients in screening centers and refer them to ophthalmologists for efficient and timely treatments. In this work, we focused on binary classification to differentiate between referable and non-referable DR in color fundus photographs.
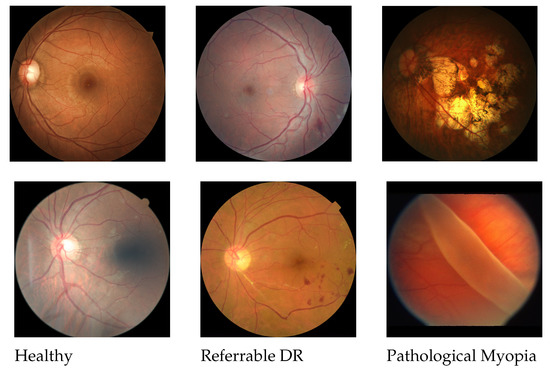
Figure 1.
Fundus images of healthy (left); referable diabetic retinopathy (middle); and pathologic myopia (right). The referable fundus shows hemorrhage and white cotton-like patches (better view in the electronic version). Fundus with PM shows large patches of chorioretinal atrophy spread over the retinal fundus in many cases (top-left) or retina detachment may occur in severe cases (bottom-right).
2.1.1. Dataset
We used the Kaggle 2015 dataset with 35,126 images (17,563 eyes) for training and 53,576 images (26,788 eyes) for testing. The datasets were labeled on a categorical scale from 0 to 4 representing the severity of DR in order of no-DR, mild, moderate, severe, or proliferative DR according to ICDRDSS [30]. The number of images for each grade amounts to 65,343 for no-DR, 6205 for mild, 13,153 for moderate, 2087 for severe, and 1914 for proliferative DR. After screening ungradable images, the entire dataset was randomly split into development set (80%) and test set (20%). Then, the development set was randomly split into 90% and 10% for training and validation. Referring to non-referable DR and referable DR as and , respectively, the training/validation sets contained non-referable and referable DR. To address the aforementioned noisy label issue prevalent in practice, we corrupted the training set by randomly flipping referable DR to non-referable and vice versa with probabilities .
2.1.2. Filtering Suspicious Data
To compensate for the severe class-imbalance in the training set, we propose a method that filters data with positive labels. The filtration networks introduced examine the training set with positive labels only.
Given the uncorrupted validation dataset and a classification network , which takes values on the probability simplex over classes , a noise filtration network was trained to minimize the logistic regression loss over validation data . This ‘optimization’ is not to be regarded as a traditional ‘training’ procedure in that the filtration network does not contribute to the test accuracy and only serves to detect mislabeled cases in the training set. Because the filtration network was trained on data with clean labels, a well-trained filtration network would identify clean positive data by predicting high values on positive images with clean labels and predicting low values for suspiciously negative images.
The filtration network is trained at each validation step (one training epoch) and is used to mask the loss values whenever noise is detected. Specifically, the gradient descent step for the classification network is computed as
with learning rate on training samples and a threshold . The loss function can be any loss function that aims to classify objects (e.g., cross entropy). Our approach of data filtration by examining the classifier’s confidence reduces negative effects caused by incorrect annotations, outperforming curriculum learning-based strategies [28]. Note how the time required to train the filtration network is negligible compared to that required for the classifiers f, as both the input and parameter dimensions are substantially smaller for .
2.2. Classification of Pathological Myopia
Pathologic myopia (PM) complicates the macula, peripheral retina, and optic nerve, and it is the main cause of visual impairments and visual loss [31]. High myopia could develop into pathologic myopia unless treated properly, and it must be diagnosed early-on with regular follow-up screenings for intervention. We leveraged the generalization capacity of CNNs to identify scarce patterns in the annotated dataset and efficiently crawled cases with such patterns from the web.
2.2.1. Dataset
Twenty-six images of high myopia, 213 images of pathologic myopia, and 161 images free of myopia, thereby for a total of 400 fundus images of the left eye from distinct individuals, were released to the public as part of the PALM competition [29]. The reference standard used to determine the presence of PM considers various factors including health records, optical coherence tomography (OCT), visual test, and fundus images. All the images were acquired from one fundus camera (Zeiss Visucam 500). Exemplar fundus images for PM are shown in Figure 1.
We supplemented this small labeled set with unlabeled fundus images acquired from publicly available datasets: Kaggle [32], Messidor [33], IDRiD [34], REFUGE [35], and RIGA [36]. The total number of unlabeled fundus images was 91,509.
2.2.2. Reducing Annotation Cost with Active Learning
In contrast to standard DL datasets with millions of annotated samples, the PALM dataset is far smaller with only 400 data and consists of even far fewer positive cases. To compensate for the lack of data, we made use of publicly available unlabeled fundus images as follows. Assuming the number of normal cases outnumber the number of PM cases as typical across the general population with 0.9–3.1% among Asian ethnicities and 1.2% among Australian ethnicities [37], we first assigned ‘normal’ pseudo-labels to all unlabeled images and combined these images with the labeled dataset. This pseudo-labeling procedure is analogous to datasets with noisy labels of which most images do not contain PM and those with PM are incorrectly labeled as normal. The usage of pseudo-labels was inspired by the excellent generalization capabilities of CNNs [24,25] that learn meaningful patterns before overfitting to noise (e.g., incorrectly labeled data). After training a classification network on this aggregated dataset for 10 epochs, we manually inspected fundus images in which the network predicted PM class with confidence amounting to 1229 images. Actively querying images with high confidence of PM cases significantly reduced the number of images to inspect by 98.7% of the entire training set of 91,509 images.
After screening positive cases selected using the above procedure, fundus images in the public datasets were assigned 1 for possible PM cases and 0 for others. The CNN was then trained from scratch using this annotated public dataset and validated using labeled data from the PALM competition.
2.2.3. Collection of Scarce Data
The model trained with the newly annotated data yielded relatively high performance (0.9930), but false negative cases contained clear patterns of retinal detachment underrepresented in the training data. To supplement cases of retinal detachment, we crawled related fundus images from two sources: retinal image bank [38] and Google image search with keywords Retinal Detachment and Retinoschisis. Forty-five cases were collected in total and added to positive cases for PM. A network trained with the labeled public datasets was fine-tuned by training with the additional 45 images with a learning rate of 1 . This model achieved an AUROC of 0.9974 on the competition dataset, which is a 0.44%p improvement over the initial model. More importantly, the model achieved 1.0 sensitivity at threshold 0.5, classifying all cases of retinal detachment up to a rounding of the least significant digit. We also experimented with test-time augmentation, averaging over predictions on 10 random perturbations (color perturbation and affine transform) on each image. However, the AUROC improved by only 0.02%p, suggesting that the model had already been trained to make robust predictions on input variations.
2.2.4. Final Submission
We fine-tuned the network that achieved the AUROC of 0.9974 on the labeled competition dataset using all available data, i.e. pseudo-labeled public data and the newly added rare cases. Thus far, the labeled competition dataset was not used in training and solely used for validating the model. However, the labeled competition dataset was included to the training dataset for the final submissions. The network was trained with a learning rate of 3 until the AUROC on the labeled competition dataset reached 1.0. Snapshots of the models at each epoch were saved to generate multiple submissions later. The model was, of course, prone to overfitting to the labeled competition dataset. However, such overfitting can help achieve high metric scores on the test data in the competition, especially when the training and test data are sampled from similar or identical distributions. We submitted two files each day as specified by the daily quota for submissions.
2.3. Image Preprocessing
For both tasks, we cropped and resized original fundus images into to reduce memory usage when training. The resolution of was chosen to be a power of 2 that was shown to maintain the performance of fundus analyses [39]. For each image, the ocular area of a fundus image was spotted by first detecting the largest blob at the center. The blob was defined as a group of connected pixels with intensities above 20 in the red channel. For blob detection, measure module in skimage package in Python was used. If there exists no blob in the center, the image was excluded from further processing. The resized image was saved in an 8-bit color format. Finally, we normalized the pixel intensities to a scale between 0 and 1 and neither used standardize per-instance statistics to preserve color information nor w e standardized the images with population statistics as they do not affect the true data distribution.
2.4. Training Details
For both tasks, we used a CNN architecture dedicated to analyses of fundus images [6], which won the second place on the task of DR grading in IDRiD challenge [34] and the first place on the glaucoma classification task in REFUGE challenge [35]. We used L2 loss for the DR task and binary-cross entropy for the PM task. We did not use the guidance loss in [6] that was designed to suppress activation outside the desired regions as specific region masks did not exist for the classification of PM.
We maintained the same hyperparameters for training except for the learning rate and the number of epochs. During training, the resized images were augmented by affine transformation (flip, scaling, rotation, and translation) and random re-scaling of the intensity for color transform. Weights and biases were initialized with Xavier initialization. We used ADAM with a learning rate of 1 for the DR task and SGD with learning rate of 1 and Nesterov momentum of 0.9 for the PM task. We oversampled the positive images so that a minibatch maintains roughly the ratio of 1:1 for positive and negative images. Batch sizes were set as 28 for the DR task and 32 for the PM task. No weight decay was used.
3. Results
3.1. Classification of Referable Diabetic Retinopathy
We compare our method with state-of-the-art methods in Table 1 with respect to AUROC on the test set under various noise ratios p. The same hyperparameters were used for S-model [18] and Bootstrap [40] as given in their original papers. For Joint-learning [28], prior regularization was excluded and the entropy regularization coefficient was set as 0.2 to balance the scale with a loss. Our model achieved the best results when using and , and no significant improvements were observed when and for all methods.

Table 1.
Comparison of test performance with various methods for handling noisy labels in referable DR classification task. The final AUROC is shown. Bold digits are best results with margins greater than 1%p.
Baseline models were trained using the same hyperparameters on the train (Baseline) and validation (Baseline, val) sets without injecting synthetic noise (noise level ), and their AUROCs on the test set are shown for reference. While the baseline model trained on the training set without any label noise () achieved the highest accuracy on the test set, this model’s performance degraded rapidly with increasing noise levels p. In contrast, our method achieved nearly the same test performance as this baseline model trained on clean annotations even in the presence of relatively large noise levels. On the other hand, while the validation set was assumed to contain no noise, the baseline (val) model achieved low performance due to the small number of data.
3.2. Classification of Pathological Myopia
3.2.1. Positive Case Mining
Out of 1229 supposedly PM cases, we screened positive cases that include tigroid patterns, which are often observed in the eyes of myopic patients, and patches of chorioretinal atrophy larger than the optic disc. There were 574 mined images in total, achieving the yield of 46.7%. Examples of mined PM cases are shown in Figure 2.
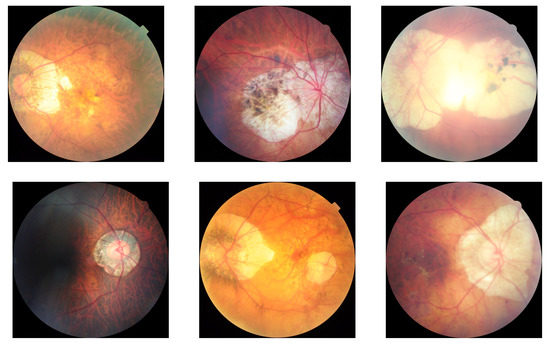
Figure 2.
Examples of mined images for PM. Tigroid patterns are noticeable in the field of view of the image and patches of chorioretinal atrohpy are prevalent near the optic disc.
We found that the augmentation of images plays vital roles for the network to impose high prediction values onto PM cases. Otherwise, the network memorized labels for individual images and meaningful stratification did not happen in the prediction values.
3.2.2. Model Trained with Mined Labels and Supplemented Data
The network yielded the AUROC of 0.9930 on the labeled competition dataset, which was reserved for validation. When the prediction outputs were rounded, there existed nine false-negative cases. All of them were fundus images of the retinal tear with the unclear visibility of chorioretinal atrophy in the background, which were largely neglected in the mined PM cases (Figure 3).
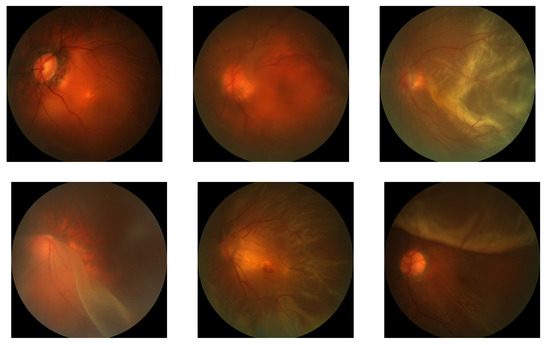
Figure 3.
False-negative PM cases of a model trained with publicly available fundus images labeled in an active learning manner. Images with retinal detachment were mis-classified to non-PM as they were not included enough in the mined labels.
When trained after supplementing retina tear cases, the model improved AUROC to 0.9974 on the labeled competition dataset. Even though the improvement was minor (0.44%p), all false negative cases in the previous model were correctly classified as PM, achieving sensitivity of 1.
3.2.3. Model Performance
Among several submissions, the best result was the AUROC of 0.9993 on the offsite validation set with the AUROC of 1.0 on the labeled competition dataset. ROC curves on the labeled competition dataset, or the training dataset by the competition, are shown in Figure 4 for the three models, which were trained with: (1) mined labels; (2) mined labels + additional data for retinal detachment crawled from the web; and (3) all available data including the labeled competition dataset. The final model achieved the best AUROC on the offsite validation set and ranked first place in the competition.
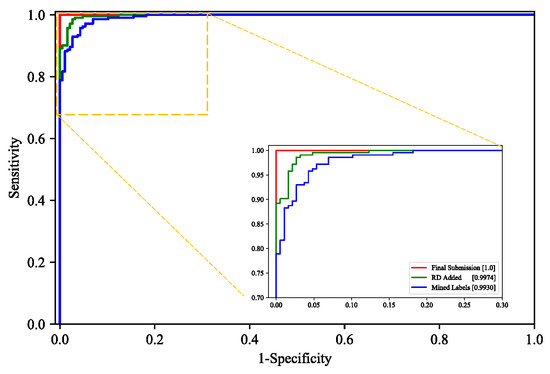
Figure 4.
ROC curves on the labeled competition dataset. The initial model was trained with mined labels. The second model was fined-tuned from the initial model by adding cases for retinal detachment to training data. The final model was improved from the second model by adding the labeled competition dataset to training data. The final model achieved the best AUROC of 0.9993 on the offsite validation set. AUROC is shown in brackets.
4. Conclusions
We present a method for filtering noisy labels based on the classifier’s confidence and an active learning approach based on pseudo-labels to use publicly-available unlabeled data. Our noisy label filtration method enhanced the CNN’s performance of classifying referable DR, outperforming existing methods in the presence of noisy data. Furthermore, the model trained in the presence of label noise using our filtration method performed comparably to when no synthetic noise was injected under various settings. By utilizing a newly designed active learning scheme inspired by pseudo-labeling to efficiently discover rare positive cases of PM, the model was able to efficiently discover unfamiliar patterns present in the original small training set. After enlarging the original training set with publicly available data and labeling those discovered using our algorithm, the model was re-trained on the newly constructed dataset to attain an AUROC of 0.9993 on the PALM competition, ranking first on the off-site validation set.
Our approach is applicable to practical clinical settings, where the development of deep learning systems usually demand a large volume of labeled data. Retrieving a large volume of labeled data may result in inaccurate annotations; efficient filtration and correction of suspicious cases help improve the performance of CNNs. Moreover, unprocessed medical data available on the web or electronic archives in hospitals can be collected and annotated efficiently when negative cases substantially outnumber positive cases. Finally, our experiments validate that adding a few positive cases can improve a CNN’s classification performance considerably. Future work includes validating the robustness of our algorithms on other data modalities, perhaps in problems with continuous labels, under real-world environments.
Author Contributions
Conceptualization, J.S., J.K. and S.T.K.; Formal Analysis, J.S. and J.K.; Methodology, J.S., J.K., S.T.K. and K.-H.J.; Writing—Original draft, J.S., J.K. and S.T.K.; Writing—Review & Editing, J.S. and K.-H.J.; Supervision, K.-H.J. All authors have read and agreed to the published version of the manuscript.
Funding
No funding provided for the study.
Institutional Review Board Statement
No IRB required due to the nature of the study.
Informed Consent Statement
No informed consent needed due to the nature of the study.
Data Availability Statement
All datasets used in the paper are publicly available and source codes are open to reproduce.
Conflicts of Interest
J.S., S.T.K.: Employee of VUNO Inc., J.K.: No conflicts of interest, K.-H.J.: Shareholder of VUNO Inc.
Abbreviations
The following abbreviations are used in this manuscript:
| CNN | Convolutional Neural Network |
| DR | Diabetic Retinopathy |
| PM | Pathologic Myopia |
| ROC | Receiver Operating Characteristics |
| AUROC | Area Under the Receiver Operating Characteristics curve |
References
- Chou, P.B.; Rao, A.R.; Sturzenbecker, M.C.; Wu, F.Y.; Brecher, V.H. Automatic defect classification for semiconductor manufacturing. Mach. Vis. Appl. 1997, 9, 201–214. [Google Scholar] [CrossRef]
- Wang, G.; Liao, T.W. Automatic identification of different types of welding defects in radiographic images. Ndt E Int. 2002, 35, 519–528. [Google Scholar] [CrossRef]
- Javed, O.; Shah, M. Tracking and object classification for automated surveillance. In Proceedings of the European Conference on Computer Vision, Copenhagen, Denmark, 28–31 May 2002; pp. 343–357. [Google Scholar]
- Hsieh, J.W.; Yu, S.H.; Chen, Y.S.; Hu, W.F. Automatic traffic surveillance system for vehicle tracking and classification. IEEE Trans. Intell. Transp. Syst. 2006, 7, 175–187. [Google Scholar] [CrossRef]
- Gulshan, V.; Peng, L.; Coram, M.; Stumpe, M.C.; Wu, D.; Narayanaswamy, A.; Venugopalan, S.; Widner, K.; Madams, T.; Cuadros, J.; et al. Development and validation of a deep learning algorithm for detection of diabetic retinopathy in retinal fundus photographs. JAMA 2016, 316, 2402–2410. [Google Scholar] [CrossRef] [PubMed]
- Son, J.; Bae, W.; Kim, S.; Park, S.J.; Jung, K.H. Classification of Findings with Localized Lesions in Fundoscopic Images Using a Regionally Guided CNN. In Computational Pathology and Ophthalmic Medical Image Analysis; Springer: Berlin/Heidelberg, Germany, 2018; pp. 176–184. [Google Scholar]
- Jung, K.H.; Park, H.; Hwang, W. Deep learning for medical image analysis: Applications to computed tomography and magnetic resonance imaging. Hanyang Med. Rev. 2017, 37, 61–70. [Google Scholar] [CrossRef]
- LeCun, Y.; Cortes, C. MNIST Handwritten Digit (Database). Available online: http://yann.lecun.com/exdb/mnist/ (accessed on 30 November 2020).
- Deng, J.; Dong, W.; Socher, R.; Li, L.J.; Li, K.; Fei-Fei, L. Imagenet: A large-scale hierarchical image database. In Proceedings of the 2009 IEEE Conference on Computer Vision and Pattern Recognition, Miami, FL, USA, 20–25 June 2009. [Google Scholar]
- Li, H.; Yu, B.; Zhou, D. Error rate analysis of labeling by crowdsourcing. In ICML Workshop: Machine Learning Meets Crowdsourcing; Citeseer: Atalanta, GA, USA, 2013. [Google Scholar]
- Fiorino, C.; Reni, M.; Bolognesi, A.; Cattaneo, G.M.; Calandrino, R. Intra-and inter-observer variability in contouring prostate and seminal vesicles: Implications for conformal treatment planning. Radiother. Oncol. 1998, 47, 285–292. [Google Scholar] [CrossRef]
- Nielsen, P.; Stigsby, B.; Nickelsen, C.; Nim, J. Intra-and inter-observer variability in the assessment of intrapartum cardiotocograms. Acta Obstet. Gynecol. Scand. 1987, 66, 421–424. [Google Scholar] [CrossRef]
- Park, S.J.; Shin, J.Y.; Kim, S.; Son, J.; Jung, K.H.; Park, K.H. A Novel Fundus Image Reading Tool for Efficient Generation of a Multi-dimensional Categorical Image Database for Machine Learning Algorithm Training. J. Korean Med. Sci. 2018, 33, e239. [Google Scholar] [CrossRef]
- LeCun, Y.; Bengio, Y.; Hinton, G. Deep learning. Nature 2015, 521, 436. [Google Scholar] [CrossRef]
- Patrini, G.; Rozza, A.; Krishna Menon, A.; Nock, R.; Qu, L. Making deep neural networks robust to label noise: A loss correction approach. In Proceedings of the IEEE Conference on Computer Vision and Pattern Recognition, Honolulu, HI, USA, 21–26 July 2017; pp. 1944–1952. [Google Scholar]
- Sukhbaatar, S.; Bruna, J.; Paluri, M.; Bourdev, L.; Fergus, R. Training convolutional networks with noisy labels. arXiv 2014, arXiv:1406.2080. [Google Scholar]
- Bekker, A.J.; Goldberger, J. Training deep neural-networks based on unreliable labels. In Proceedings of the 2016 IEEE International Conference on Acoustics, Speech and Signal Processing (ICASSP), Shanghai, China, 20–25 March 2016; pp. 2682–2686. [Google Scholar]
- Goldberger, J.; Ben-Reuven, E. Training deep neural-networks using a noise adaptation layer. In Proceedings of the ICLR, Toulon, France, 24–26 April 2017. [Google Scholar]
- Bengio, Y.; Louradour, J.; Collobert, R.; Weston, J. Curriculum learning. In Proceedings of the 26th Annual International Conference on Machine Learning, Montreal, QC, Canada, 14–18 June 2009; pp. 41–48. [Google Scholar]
- Jiang, L.; Zhou, Z.; Leung, T.; Li, L.J.; Fei-Fei, L. Mentornet: Learning data-driven curriculum for very deep neural networks on corrupted labels. arXiv 2017, arXiv:1712.05055. [Google Scholar]
- Dehghani, M.; Mehrjou, A.; Gouws, S.; Kamps, J.; Schölkopf, B. Fidelity-weighted learning. arXiv 2017, arXiv:1711.02799. [Google Scholar]
- Hinton, G.; Vinyals, O.; Dean, J. Distilling the knowledge in a neural network. arXiv 2015, arXiv:1503.02531. [Google Scholar]
- Ren, M.; Zeng, W.; Yang, B.; Urtasun, R. Learning to Reweight Examples for Robust Deep Learning. arXiv 2018, arXiv:1803.09050. [Google Scholar]
- Arpit, D.; Jastrzębski, S.; Ballas, N.; Krueger, D.; Bengio, E.; Kanwal, M.S.; Maharaj, T.; Fischer, A.; Courville, A.; Bengio, Y.; et al. A closer look at memorization in deep networks. In Proceedings of the 34th International Conference on Machine Learning, Sydney, Australia, 6–11 August 2017; JMLR.org. Volume 70, pp. 233–242. [Google Scholar]
- Zhang, C.; Bengio, S.; Hardt, M.; Recht, B.; Vinyals, O. Understanding deep learning requires rethinking generalization. arXiv 2016, arXiv:1611.03530. [Google Scholar]
- Han, B.; Yao, Q.; Yu, X.; Niu, G.; Xu, M.; Hu, W.; Tsang, I.; Sugiyama, M. Co-teaching: Robust training of deep neural networks with extremely noisy labels. In Proceedings of the Advances in Neural Information Processing Systems, Montréal, QC, Canada, 2–8 December 2018; pp. 8536–8546. [Google Scholar]
- Song, H.; Kim, M.; Lee, J.G. Selfie: Refurbishing unclean samples for robust deep learning. In Proceedings of the International Conference on Machine Learning, Long beach, CA, USA, 9–15 June 2019; pp. 5907–5915. [Google Scholar]
- Tanaka, D.; Ikami, D.; Yamasaki, T.; Aizawa, K. Joint optimization framework for learning with noisy labels. In Proceedings of the IEEE Conference on Computer Vision and Pattern Recognition, Salt Lake City, UT, USA, 18–23 June 2018; pp. 5552–5560. [Google Scholar]
- Pathologic Myopia Challenge. Available online: http://palm.grand-challenge.org (accessed on 20 May 2019).
- Early Treatment Diabetic Retinopathy Study Research Group. Grading diabetic retinopathy from stereoscopic color fundus photographs—an extension of the modified Airlie House classification: ETDRS report number 10. Ophthalmology 1991, 98, 786–806. [Google Scholar] [CrossRef]
- Morgan, I.G.; Ohno-Matsui, K.; Saw, S.M. Myopia. Lancet 2012, 379, 1739–1748. [Google Scholar] [CrossRef]
- Kaggle Diabetic Retinopathy Detection Competition Report. 2015. Available online: https://www.kaggle.com/c/diabetic-retinopathy-detection (accessed on 20 May 2019).
- Decencière, E.; Zhang, X.; Cazuguel, G.; Lay, B.; Cochener, B.; Trone, C.; Gain, P.; Ordonez, R.; Massin, P.; Erginay, A.; et al. Feedback on a publicly distributed database: The Messidor database. Image Anal. Stereol. 2014, 33, 231–234. [Google Scholar] [CrossRef]
- Porwal, P.; Pachade, S.; Kamble, R.; Kokare, M.; Deshmukh, G.; Sahasrabuddhe, V.; Meriaudeau, F. Indian Diabetic Retinopathy Image Dataset (IDRiD): A Database for Diabetic Retinopathy Screening Research. Data 2018, 3, 25. [Google Scholar] [CrossRef]
- Retinal Fundus Glaucoma Challenge. Available online: http://refuge.grand-challenge.org (accessed on 20 May 2019).
- Almazroa, A.; Alodhayb, S.; Osman, E.; Ramadan, E.; Hummadi, M.; Dlaim, M.; Alkatee, M.; Raahemifar, K.; Lakshminarayanan, V. Retinal fundus images for glaucoma analysis: The RIGA dataset. In Proceedings of the Medical Imaging 2018: Imaging Informatics for Healthcare, Research, and Applications. International Society for Optics and Photonics, Houston, TX, USA, 10–15 February 2018; Volume 10579, p. 105790B. [Google Scholar]
- Ohno-Matsui, K.; Lai, T.Y.; Lai, C.C.; Cheung, C.M.G. Updates of pathologic myopia. Prog. Retin. Eye Res. 2016, 52, 156–187. [Google Scholar] [CrossRef]
- Retinal Image Bank. Available online: https://imagebank.asrs.org (accessed on 20 May 2019).
- Krause, J.; Gulshan, V.; Rahimy, E.; Karth, P.; Widner, K.; Corrado, G.S.; Peng, L.; Webster, D.R. Grader variability and the importance of reference standards for evaluating machine learning models for diabetic retinopathy. Ophthalmology 2018, 125, 1264–1272. [Google Scholar] [CrossRef] [PubMed]
- Reed, S.; Lee, H.; Anguelov, D.; Szegedy, C.; Erhan, D.; Rabinovich, A. Training deep neural networks on noisy labels with bootstrapping. arXiv 2014, arXiv:1412.6596. [Google Scholar]


Publisher’s Note: MDPI stays neutral with regard to jurisdictional claims in published maps and institutional affiliations. |
© 2021 by the authors. Licensee MDPI, Basel, Switzerland. This article is an open access article distributed under the terms and conditions of the Creative Commons Attribution (CC BY) license (http://creativecommons.org/licenses/by/4.0/).